Article

Structural FEM Analyses of a Landing Gear Testing Machine

1
Department of Industrial Engineering, University of Salerno, via Giovanni Paolo II, 132, 84084 Fisciano, SA, Italy
2
ProEtico srl, Via Antiniana, 2G, 80078 Pozzuoli, NA, Italy
*
Author to whom correspondence should be addressed.
Metals 2022, 12(6), 937; https://doi.org/10.3390/met12060937
Submission received: 7 May 2022 / Revised: 26 May 2022 / Accepted: 27 May 2022 / Published: 29 May 2022
(This article belongs to the Section Structural Integrity of Metals)

Abstract

:
The “Electro-mechanical Landing gear system Integration for Small Aircraft” (E-LISA) research project has the objective of developing an innovative “iron bird”, a testing facility dedicated to executing tests on an innovative landing gear of a small aircraft. This document presents the structural analyses of this complex testing machine performed with the Finite Element Method (FEM). Key purposes of these numerical simulations were the quantifications of the stress and displacement fields under the loading conditions foreseen for the machine. A modal analysis was performed with the aim of calculating eigenvalues and eigenvectors useful to provide an assessment of the structural dynamic response. The most critical mode shapes and the related frequencies were calculated, and the potentially critical rotational speeds were quantified. Finally, the Peak Stress Method (PSM) was adopted to quantify the fatigue resistance of the most critical weldments and an infinite fatigue life was assessed for the most critical one. The design of the machine, which is currently under manufacturing, was validated by the structural analyses presented here.

1. Introduction

Within the Clean Sky 2 framework, the “Electro-mechanical Landing gear system Integration for Small Aircraft” (E-LISA) research project has the objective of developing an innovative “iron bird”, i.e., a testing facility dedicated to executing tests on the landing gear of a small aircraft equipped with an electro-mechanical landing gear and an electrical brake. The iron bird will consist of a multi-functional intelligent testing facility integrating hardware and software, allowing all tests and analyses to be performed to demonstrate the maturity of electro-mechanical landing gear, hence paving the way for its implementation in small aircraft. After approval of the preliminary design, the activities prosecuted the development of the iron bird, which is qualified for the execution of qualification and performance tests as per applicable specifications. The final phase will focus on executing tests on test articles with respect to reliability and endurance tests, under normal and relevant aircraft environments (wet, dry, obstacle conditions, landing, take-off, taxiing, failure and disturbance conditions). The design of the testing machine, preliminarily achieved by hand calculations, was analysed numerically using the Finite Element Method (FEM) for validation purposes, see Figure 1. The purpose of this paper is to present the numerical simulations performed with this aim. Similar investigations based on topology optimization can be found in [1].
The numerical simulation via FEM was preferred over other design procedures, e.g., analytical methods and/or experimental tests, or Boundary Element Method (BEM) [2], thanks to its widespread usage in this regard [3,4,5]. In particular, FEM simulations were set up in order to quantify the stress and displacement fields under the actual loading conditions foreseen for the machine. These simulations were set up according to a global–local FEM approach [6], thus trying to keep the computational burden as low as possible, while at the same time keeping a high accuracy specifically for the most relevant locations. This is a common practice for structural assessments that require high accuracy of the stress–strain field in localised regions, e.g., for fatigue [7,8] and fracture [9,10,11] problems.
Along the same line of working with lightweight simulations, the Peak Stress Method (PSM) [12,13,14] was adopted to quickly quantify the fatigue resistance of the most critical weldments of the supporting structure. PSM is a powerful methodology that makes it possible to analyse the fatigue resistance of weldments in a fast and simplified way, without the need to resort to complex thermal-stress simulations [15,16] and/or FEM methodologies dedicated to the explicit simulation of the welding process [17,18].
Finally, no complex dynamic simulations were performed to account for the variable loading conditions occurring during the service life of the machine. However, a simpler modal analysis was performed with the aim of calculating eigenvalues and eigenvectors in such a way as to perform some evaluations on the expected structural dynamic response. Again, these are rather typical evaluations, especially for engineering structures that involve numerous components, non-linearities, etc. [19,20].
The analyses presented in this document made it possible to validate the preliminarily obtained design of the machine. Thanks to the structural analyses presented here, the life of the weldments was also assessed so as to guarantee the fatigue performances of the structure during its service conditions. The analyses were set up by knowing that a certain amount of approximation was needed so to deliver the fast validation procedure required by the project schedule. No dedicated validation of these numerical results was performed at this stage, even though a dedicated validation phase is scheduled when the machine will be manufactured, certified and before being considered as ready for tests. The testing machine is currently under manufacturing.

2. Materials and Methods

The landing gear testing machine was designed by the company CERTIA (Noisy-le-Grand, France), see Figure 1 for the final design configuration. This testing machine consists of a supporting framework mainly composed of welded steel profiles of different sections and lengths. The adopted steel was the S275J0 construction steel, whose main mechanical properties are listed in Table 1, and which provided excellent workability and weldability. The structure of the machine can be seen as an aggregate made of three distinct macro-parts. The bottom sub-structure is formed by a network of welded beams on which the various parts, dedicated to the production and transmission of motion, are installed. This comprises an electric motor for the power generation, a gearbox with mechanical joints for the power transmission and, finally, by a large wheel (also termed “runway simulator”) that is intended to deliver the motion to the test article.
From the bottom structure, a second sub-structure (termed the “main tower”) made of welded beams rises vertically. This comprises a hydraulically operating piston that is used to transmit the service load from the main tower to a third sub-structure, this latter in the shape of a shelf. The main tower and “shelf” are interconnected through four slides so to guarantee a purely vertical translation of the shelf, preventing any relative rotation with respect to the main tower. The shelf represents the supporting structure where the landing gear to test is connected through a fixture. During a test, the shelf makes it possible to translate vertically so as to vary the pressure produced between the tyre and the wheel. Accordingly, the load mission profiles to be used during the different testing phases can be set up by varying the force applied to the shelf by the hydraulic piston.
The overall simulation plan is shown in Figure 2. A 1D model of the structure was built according to the 3D CAD model shown in Figure 1. 1D beam and truss elements were selected from the FEM code library to model the framework of beams of the testing machine. This inherently introduced geometric approximations into the numerical model, especially close to joints and weldments. Additionally, the components that could not be modelled at all through 1D elements, such as electric motor, flywheel, gearbox, etc., were introduced into the model as lumped masses. Loading conditions considered into the 1D model consisted of the gravity and the tyre-wheel contact force, see Figure 3. The interaction between the tyre of the landing gear to test and the runway simulator of the testing machine was simulated through two vertical separating forces equal to 77 kN each (one acting on the shelf, the other acting on the lower sub-structure). Only the highest possible position of the shelf was considered, as this is the most critical configuration (i.e., no motion of the shelf was explicitly simulated). Interactions between the shelf and the main tower consisted of four multi-point constraints (MPCs) to simulate the four slides of the actual structure, in addition to one further MPC to interconnect the shelf with the actuator. This latter MPC made it possible to transmit the vertical displacements and forces so as to simulate the hydraulic actuator.
The 1D model comprised nearly 1600 1D linear elements and 3300 nodes. This model was used to perform two distinct analyses. The first analysis consisted of a static structural analysis, so as to calculate the stresses, strains and displacements in order to pinpoint the most critical locations of the machine. No dedicated analyses were performed to calculate the dynamic response of the structure, thus assuming that the variation of the actual loads induced by the actuator while simulating the landing profiles was “sufficiently slow”. Secondly, a modal analysis was performed on the 1D model to calculate eigenvectors and eigenvalues, namely resonant mode shapes and the corresponding frequencies, respectively. This analysis was intended as a simplified choice to acquire information on the dynamic structural response without the need for resorting to more complex analyses [21,22,23].
The 1D model made it possible to calculate the bending and twisting moments along all beams of the supporting structure, thus highlighting the position of the most stressed part. Once this information had been obtained, a 3D model was built to evaluate the most critical positions with higher accuracy, see Figure 2. Namely, the outputs obtained with the global 1D model were used as boundary conditions for a 3D local model that was used to assess the stress–strain field in more detail and accuracy. In particular, a much finer mesh, built with 3D elements in such a way as to replicate all the three-dimensional geometric details (weld beads, holes, fillets, etc.), was adopted for this local model. In particular, the weld beads were explicitly modelled in the 3D local submodel, as required by the application of the PSM, in turn allowing the prediction of the fatigue life of the most critical weldment of the structure [13,24]. To this end, a weld bead size of 10 mm was assumed for the weld bead modelling. The 3D model comprised nearly 130k quadratic tetrahedral elements and 220 k nodes.
Thanks to the 3D local modelling, the PSM was implemented and the weldments in the most critical positions were studied in order to predict their fatigue life. In particular, the most stressed beam was shown to be mostly loaded by simple bending, and along one principal axis of the local section only, by using the PSM-based relationship according to this loading condition:
K F E M * = K I σ ϑ ϑ , ϑ = 0 , p e a k   d 1 λ 1
The closed-form expression of the averaged strain energy density can be rewritten as a function of the singular, linear elastic FE peak stress σ ϑ ϑ , ϑ = 0 , p e a k , with the latter being directly provided by the FEM code. In Equation (1), d is the “global element size”, i.e., the overall element size provided as input in the pre-processing phase for the automatic mesh generation, (8 mm for the 3D model), λ 1 is the mode I stress singularity exponent ( λ 1 = 0.752 [13]), K I is the N-SIF (Notch- Stress Intensity Factor) related to mode I, K F E M * is a constant K value equals to 1.21 ± 8% for the chosen FEM code, meshing options and weld bead sizes [12]. Afterwards, the following equivalent peak stress range Δ σ e q , p e a k can be derived as:
Δ σ e q , p e a k = 2 c w 1 e 1 ( 1 υ 2 ) [ K F E M * Δ σ ϑ ϑ , ϑ = 0 , p e a k ( d R 0 ) 1 λ 1 ]
In Equation (2), c w 1 is a coefficient depending on the stress ratio R ( c w 1 = 1 when R = 0 , [13]), e 1 is a parameter depending on the weld bead geometry and the Poisson’s ratio υ ( e 1 = 0.104 [13]), R 0 is the so-called “control radius”, which is equal to 0.28 mm for arc-welded joints [25]. Finally, the Δ σ e q , p e a k is the equivalent peak stress range that can be directly inserted in an S-N curve (figure number 6 in [24]) to derive the corresponding fatigue life. The reader is referred to [12,13,14,15,24] for detail about PSM and its implementation.

3. Results and Discussion

The landing gear testing machine designed under the E-LISA project (Figure 1) required a validation phase so as to guarantee the structural safety during the operations foreseen for the machine. This was carried out according to the numerical simulation plan shown in Figure 2, namely via a 1D global model, for a fast and simplified structural assessment of the global structure, and via a 3D local model, for a detailed and accurate evaluation of the most critical position.
Once the overall global response of the structure had been obtained, the information about bending and twisting moments calculated by the FEM code was analysed, see Figure 4, for those occurring under both static and service loading conditions. In particular, the most stressed section (see also Figure 5) turned out to be loaded by two bending moments of −18.5 kNm (Figure 4a) and 0.02 kNm (Figure 4b), in addition to a twisting moment of −0.9 kNm (Figure 4c). A simple bending was therefore calculated in the most critical section.
The results of the 1D static analysis, also exhibiting a deformed shape, are shown in the following in terms of von Mises stresses, see Figure 5. These are shown for two different loading configurations, i.e., with and without the tyre–wheel load of 77 kN. The purpose of this subdivision was to quantify the structural stresses before and during the operation of the machine. It can be noticed that very small stresses were calculated when considering the gravity only (Figure 3a), whereas much higher stresses were calculating during the actual operating conditions of the structure (i.e., by adding the 77 kN operating tyre-wheel loads of Figure 3b). The peak value of von Mises stress was determined to be 34.3 MPa, occurring on the upper shelf and induced by a bending moment on the central beam of the shelf. This location presents a stress value of nearly 3.0 MPa when the service load is removed, thus suggesting that a stress ratio R = σ m i n / σ M A X of 0 can be assumed. Stress–strain data could be used to further stiffen the structure by enlarging the beam sections locally, even though the static safety factor σ Y S / σ V M = 8 was shown to be rather conservative. Regarding the displacements, a maximum displacement of 2.0 mm was calculated for the shelf: this value was judged to be acceptable because it did not affect the proper functioning of the testing machine.
Simple bending was calculated in the most critical section, as the stresses resulting from the two contributors of bending along the other direction and twisting were negligible, see Figure 4b,c. Consequently, only the −18.5 kNm moment was imported as a boundary condition of a local FEM submodel so as to analyse the most critical position with higher accuracy, see Figure 2. This importing of the 1D local moment as a 3D load made it possible to replicate the 1D nodal stress values as 3D stress fields, see Figure 6. By doing this, all the details available in the initial CAD model and neglected in the 1D model were added to the 3D local region. In particular, the weld beads were also inserted during the 3D modelling, as required by the application of the PSM, in turn allowing the prediction of the fatigue life of such most critical weldments, see Figure 6 [13,24]. Through Equations (1) and (2), a Δ σ e q , p e a k equals to 128 MPa was calculated for the most critical weld bead and compared with the S-N experimental data obtained through fatigue tests on arc-welded joints (available in [24]). In particular, it was found that the lowest value of the designed scatter band calculated by all experimental data available in [24] was equal to 156 MPa (i.e., >128 MPa), thus guaranteeing an infinite life for the most critical weldment of the machine.
The loading conditions that the testing machine undergoes during operation are variable, as the load induced by the actuator to simulate the landing mission profile is variable. However, this variability was considered to be “sufficiently low”, according to [26], as the load frequency is much smaller than the resonant frequencies calculated for the supporting structure of the machine. Additionally, the electric motor is designed to provide a rotational speed n up to 1000 rpm to the runway simulator through a gearbox, with the latter producing a speed reduction of 4 (i.e., the electric motor runs up to 4000 rpm). This rotational speed does not induce any variability in the contact pressure between the tyre and the runway simulator during tests, in turn producing a quasi-static loading condition in the supporting structure. From a practical standpoint, a small variation in loading conditions induced by the tyre–wheel interaction is nonetheless expected due to potential imprecisions of manufacturing, deformation of components during the operations, misalignments, tolerances, etc. No dynamic simulations were carried out to acquire a sense of the potential resonant issues caused by the rotation of the driveline; however, a modal analysis was performed with the aim of making some evaluations on the expected structural dynamic response. The modal analysis was carried out up to a maximum frequency of interest of nearly 100 Hz, so as to cover the entire range of interest.
The potentially critical mode shapes were regarded as those presenting an upward/downward flexural deformation of the shelf (i.e., with Z as the bending axis, see Figure 3), being favourable to a coupling with the tyre–wheel load acting along the Y-axis (Figure 3). Figure 7 presents such potentially critical mode shapes, resonant frequencies and the corresponding rotational speeds that should be either used with care or simply avoided during tests. In particular, the mode shapes at the frequencies of 35.9 Hz and 63.4 could represent uncertain machine operating conditions, even though more detailed calculations are needed in this regard to double check these safety issues.

4. Conclusions

The E-LISA research project has the objective of developing an innovative “iron bird”, a testing facility dedicated to executing tests on innovative landing gear for small aircraft. Within this project, this work presented the structural assessment that was developed for this complex testing machine. The assessment comprised different types of FEM models and analyses, the main results of which can be summed up through the following points:
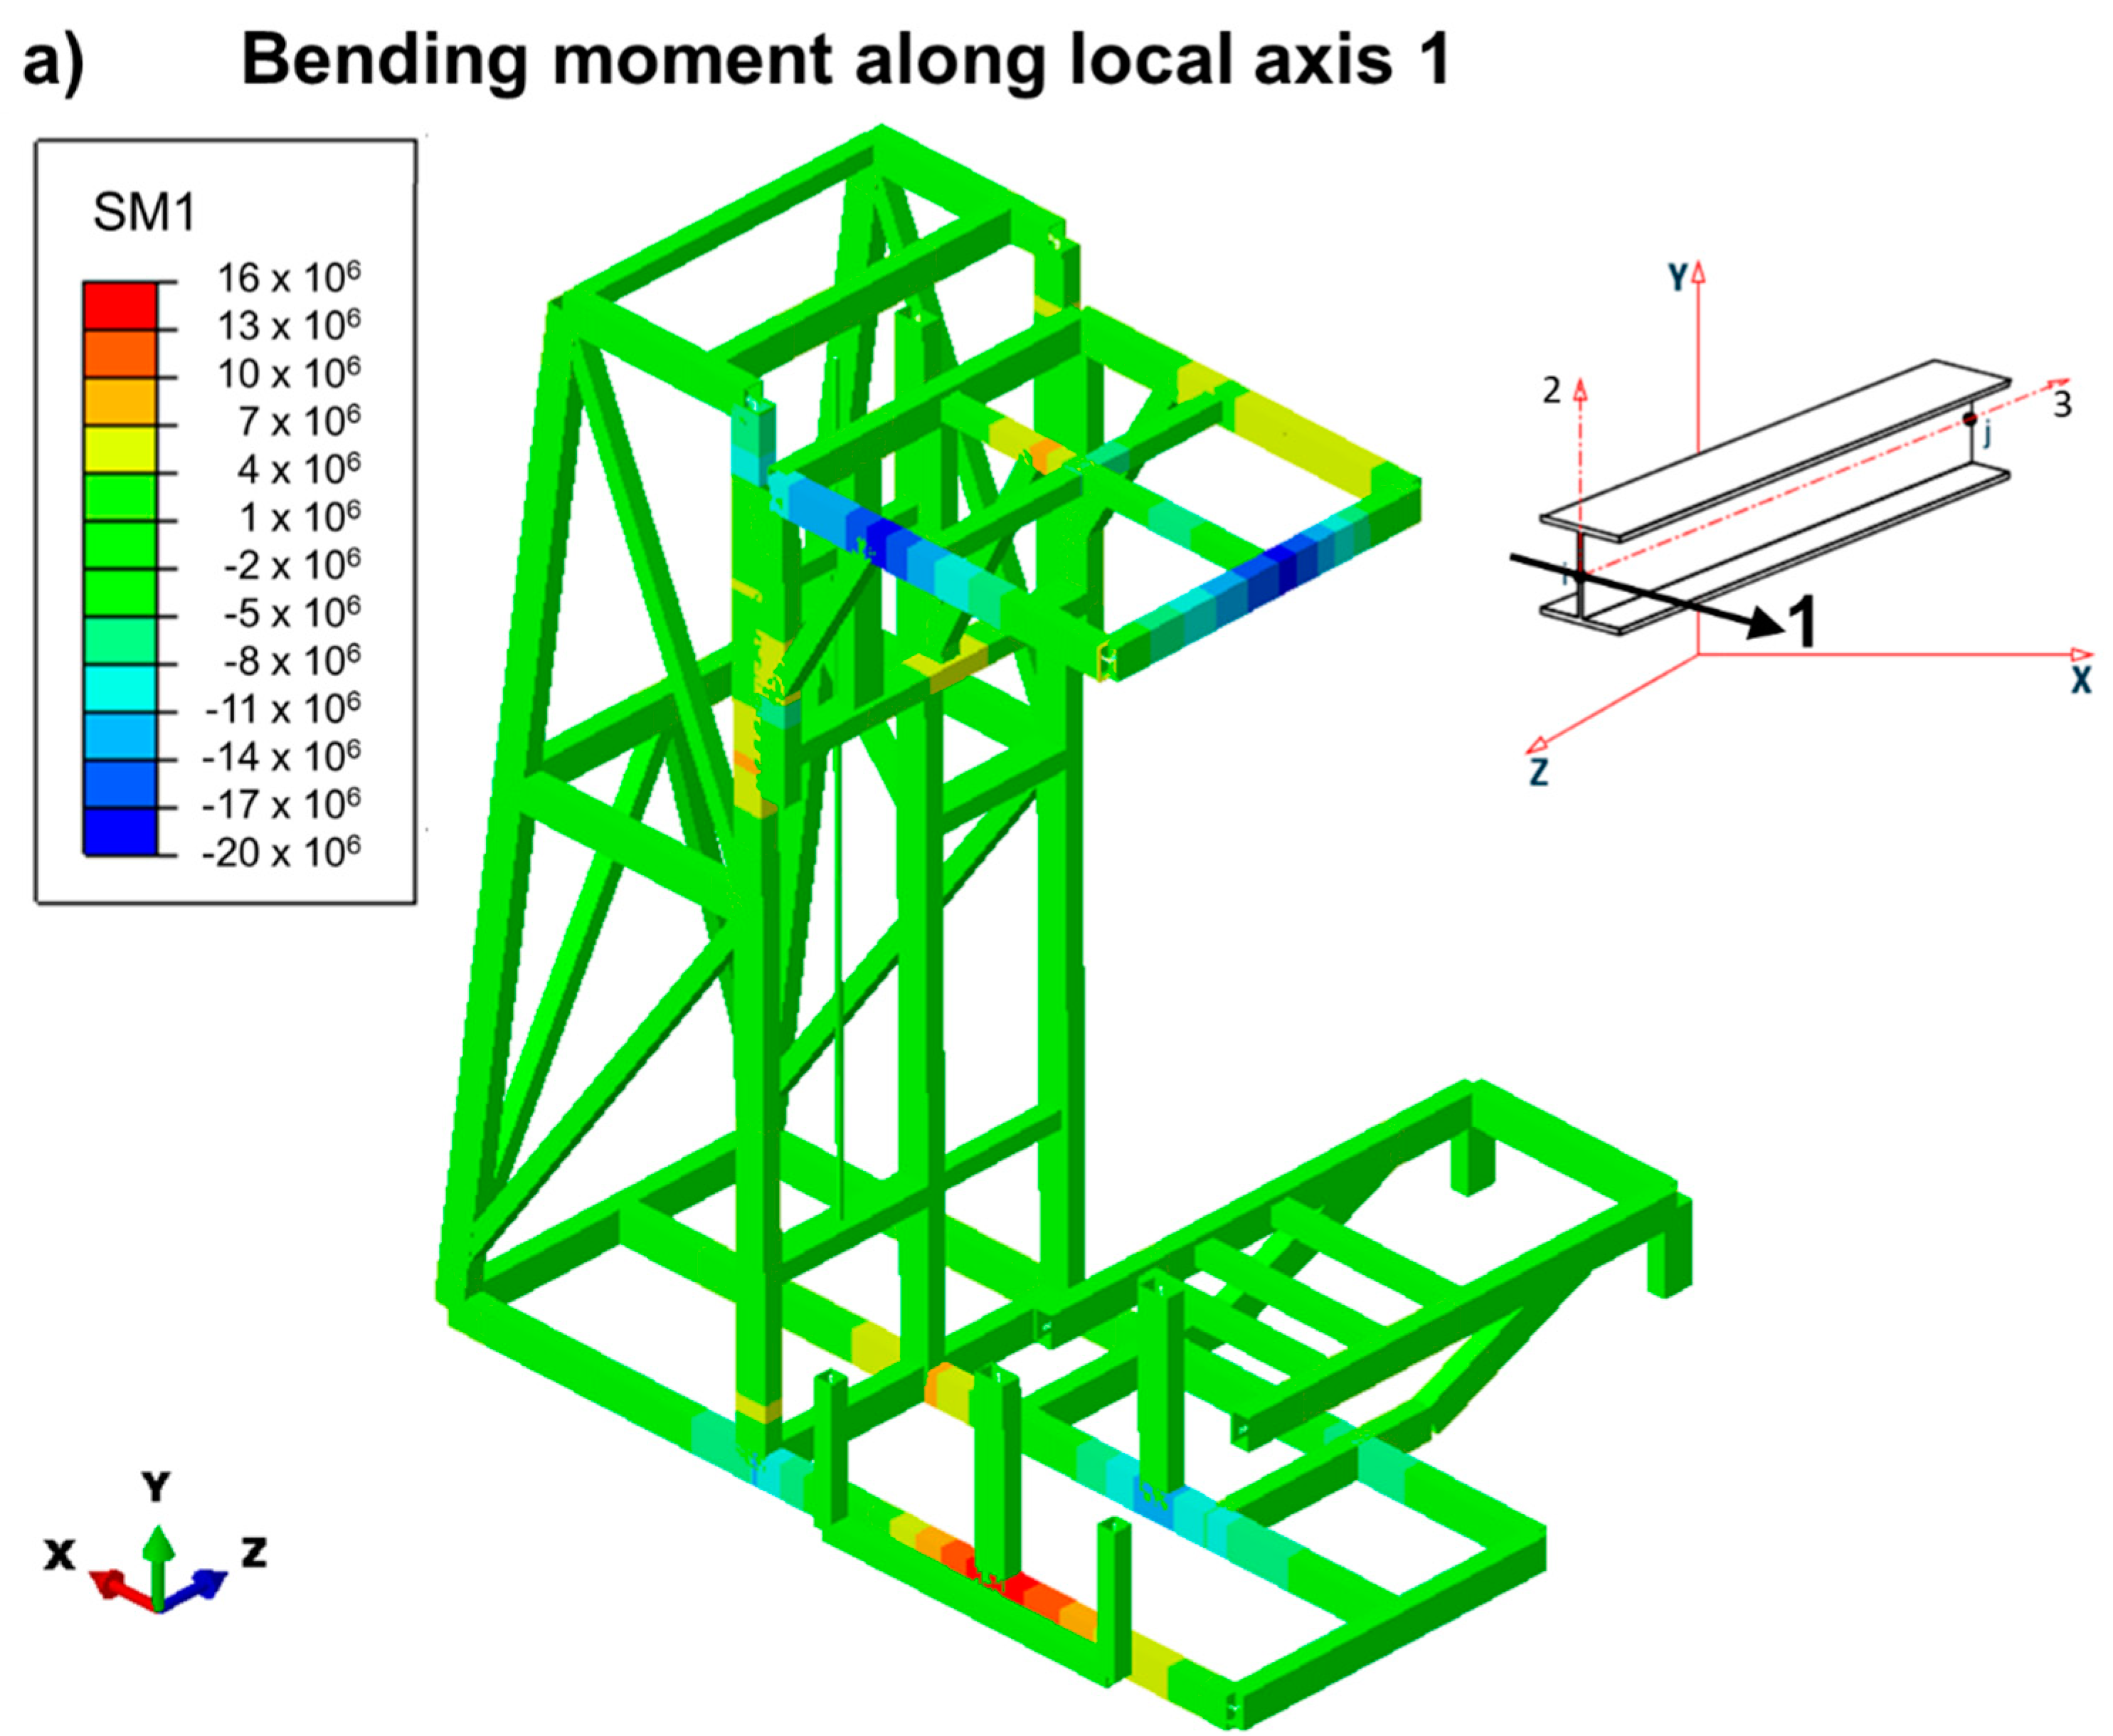
  • A 1D model of the whole testing machine made it possible to simulate the global structural response in a fast and simplified way. This model made it possible to calculate the stress, strain, and displacement fields for the whole structure, making it possible to pinpoint the most critical locations to subsequently analyse them in more detail.
  • A modal analysis was performed on the 1D model so to evaluate the performances of the structure against the heavy dynamic loads acting during the tests. Some rotational speeds of the wheel representing potentially critical conditions were calculated. Although the wheel rotation does not induce rotary bending on the structure during the operation of the machine, these operating conditions should be avoided so as to limit resonance issues.
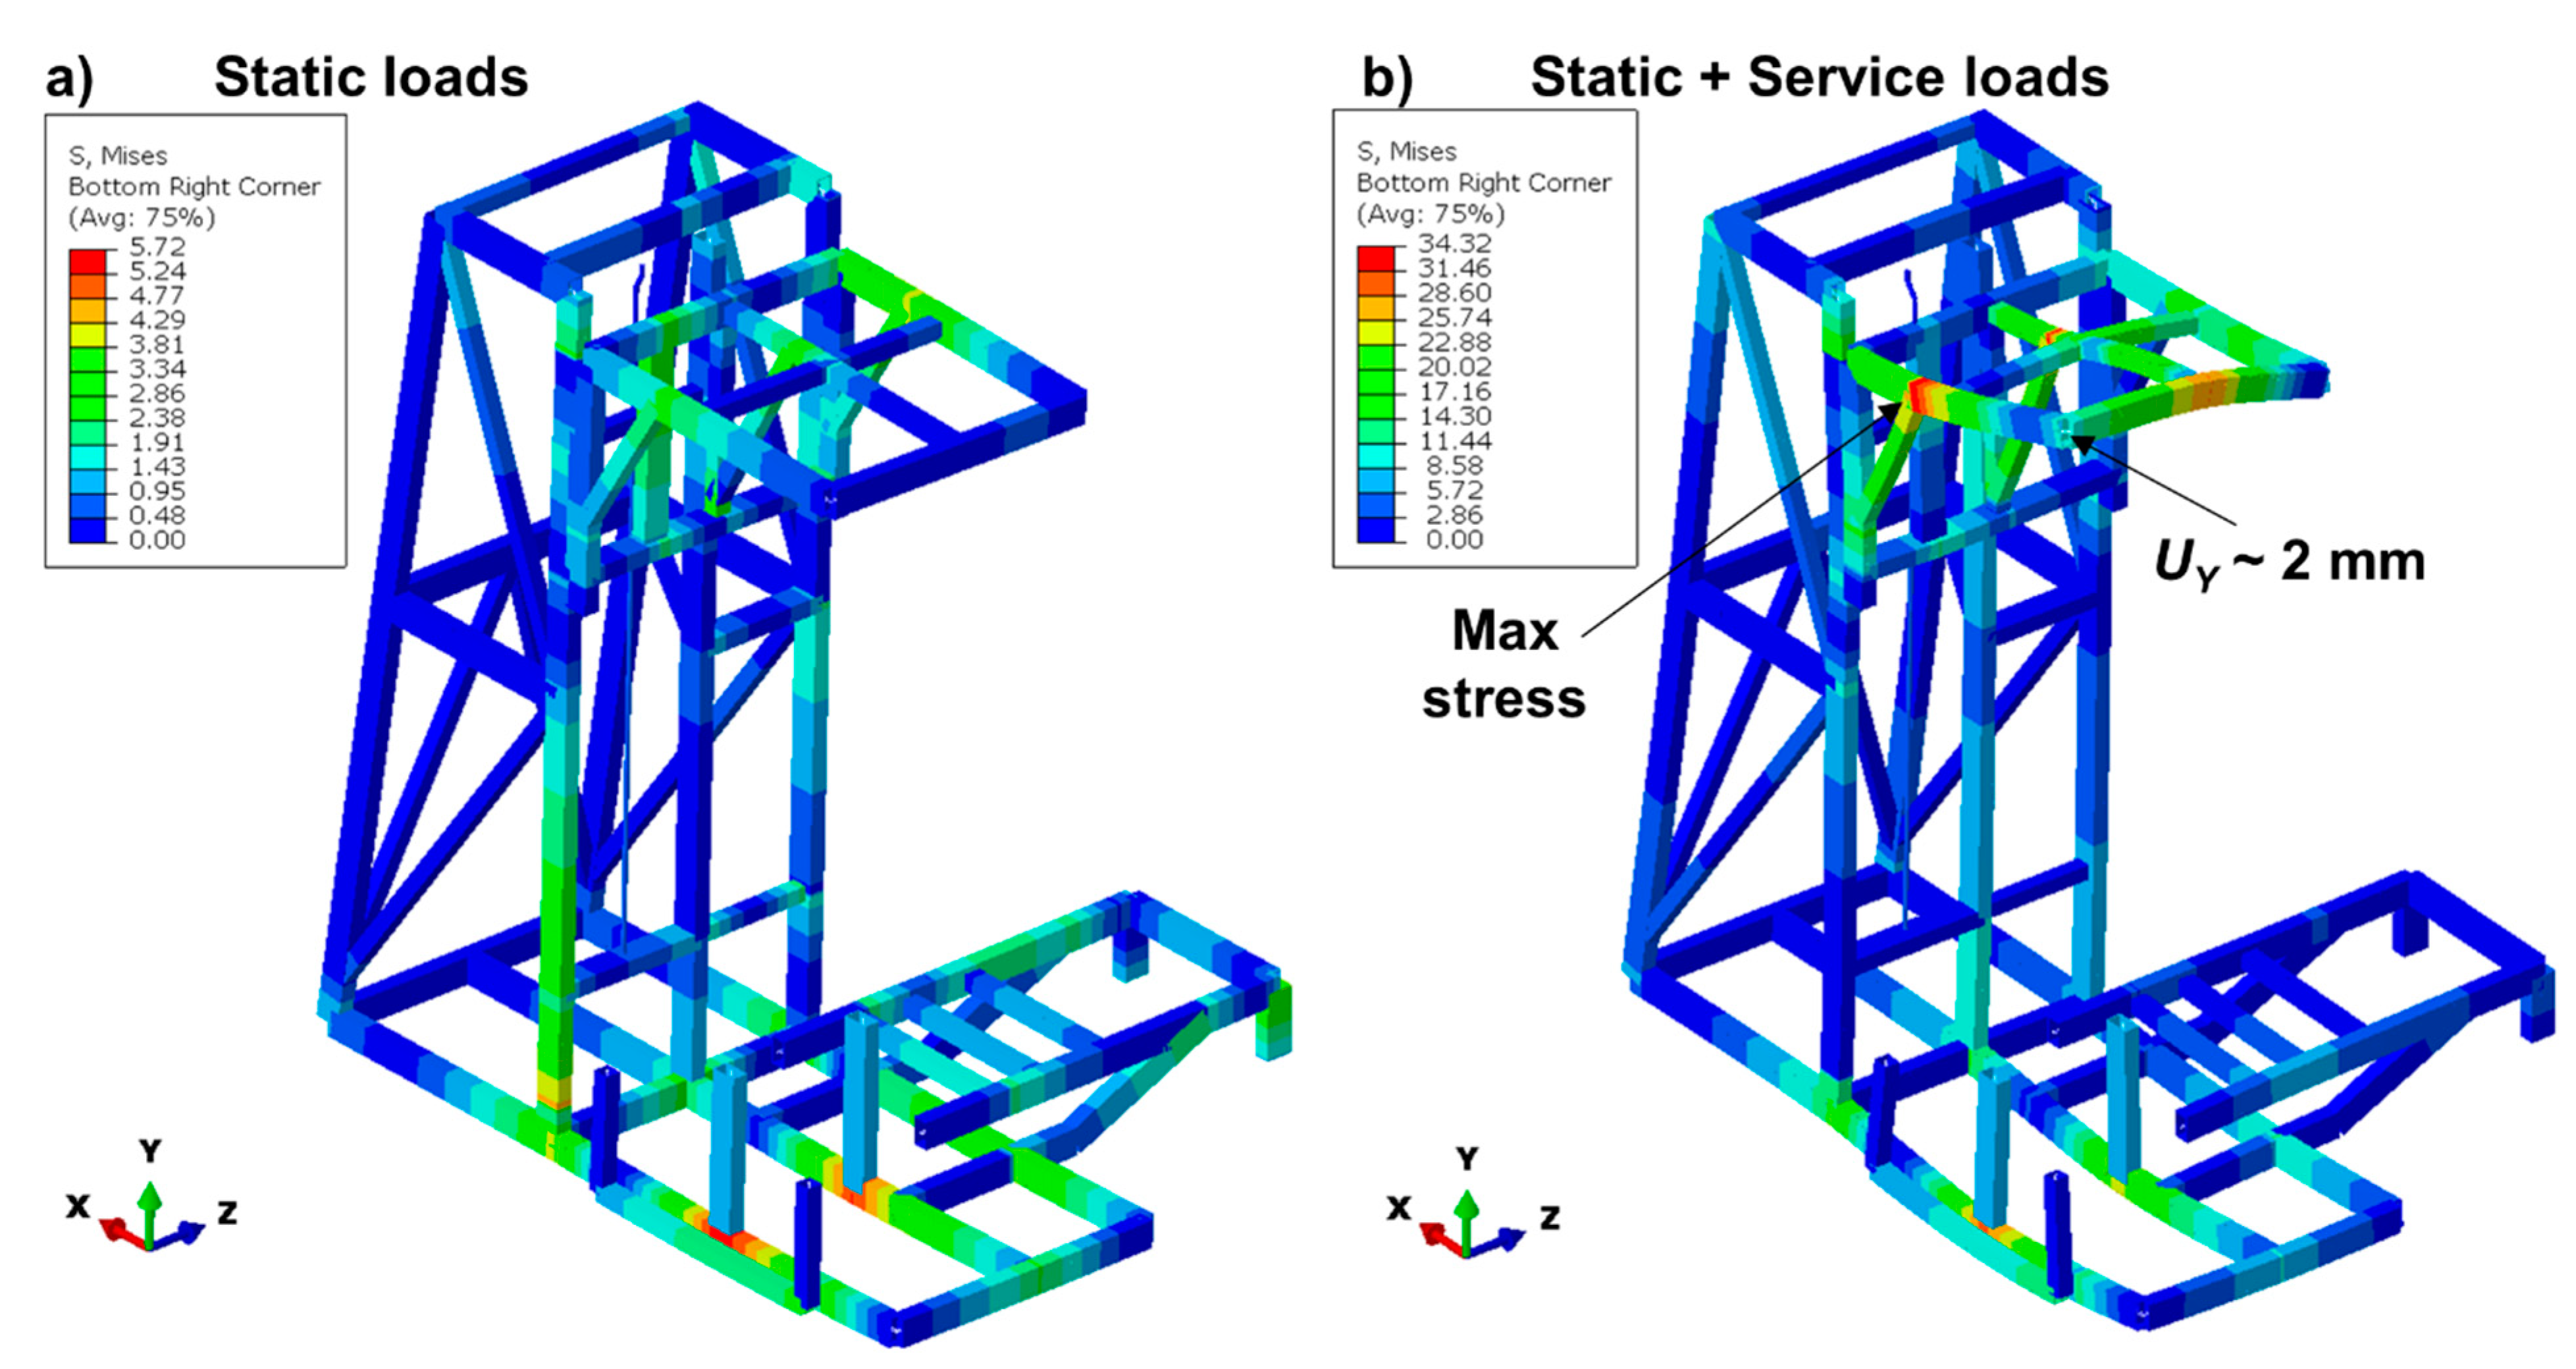
  • Based on the 1D model results, a full 3D FEM model was built up to investigate the most stressed position in more detail. Details of fillets and weldments were added to this model, and the accurate 3D local stress–strain field was recreated from the 1D global data. The Peak Stress Method was developed with this model so as to quantify that the most critical weldments were safe from fatigue.
The design of the machine was validated numerically thanks to the structural assessment presented here. The testing machine is currently under manufacturing.

Author Contributions

Conceptualization, R.G., V.G. and R.C.; methodology, V.G. and R.S.; software, V.G. and G.B.; validation, V.G., R.S. and R.C.; formal analysis, G.B. and V.G.; investigation, V.G. and G.B.; resources, R.G., R.S. and R.C.; data curation, V.G. and G.B.; writing—original draft preparation, V.G.; writing—review and editing, R.S. and R.C.; visualization, V.G.; supervision, R.G., R.C. and R.S. All authors have read and agreed to the published version of the manuscript.

Funding

The research work presented in this paper was performed within the E-LISA project, which has received funding from the Clean Sky 2 Joint Undertaking under the European Union’s Horizon 2020 Research and Innovation Program under grant agreement number 887222.

Data Availability Statement

Data supporting the reported results can be obtained from the author upon request.

Acknowledgments

The authors acknowledge the French company CERTIA, for providing all the information, models and details on the design of the testing machine.

Conflicts of Interest

The authors declare no conflict of interest.

References

  1. Fei, C.; Liu, H.; Zhu, Z.; An, L.; Li, S.; Lu, C. Whole-process design and experimental validation of landing gear lower drag stay with global/local linked driven optimization strategy. Chin. J. Aeronaut. 2021, 34, 318–328. [Google Scholar] [CrossRef]
  2. Citarella, R.G.; Cricrì, G.; Armentani, E. Multiple Crack Propagation with Dual Boundary Element Method in Stiffened and Reinforced Full Scale Aeronautic Panels. In Key Engineering Materials; Trans Tech Publications: Bach, Switzerland, 2013; Volume 560, pp. 129–155. [Google Scholar] [CrossRef]
  3. Citarella, R.; Giannella, V.; Lepore, M.; Dhondt, G. Dual boundary element method and finite element method for mixed-mode crack propagation simulations in a cracked hollow shaft. Fatigue Fract. Eng. Mater. Struct. 2018, 41, 84–98. [Google Scholar] [CrossRef]
  4. Sepe, R.; Greco, A.; De Luca, A.; Armentani, E.; Berto, F. Experimental and FEM numerical assessment of multiaxial fatigue failure criteria for a rolling Stock’s seats structure. Eng. Fail. Anal. 2019, 102, 303–317. [Google Scholar] [CrossRef]
  5. Caputo, F.; De Luca, A.; Greco, A.; Marro, A.; Apicella, A.; Sepe, R.; Armentani, E. Established Numerical Techniques for the Structural Analysis of a Regional Aircraft Landing Gear. Adv. Mater. Sci. Eng. 2018, 2018, 8536581. [Google Scholar] [CrossRef] [Green Version]
  6. Ferraiuolo, M.; Leo, M.; Citarella, R. On the Adoption of Global/Local Approaches for the Thermomechanical Analysis and Design of Liquid Rocket Engines. Appl. Sci. 2020, 10, 7664. [Google Scholar] [CrossRef]
  7. Giannella, V.; Citarella, R.; Fellinger, J.; Esposito, R. LCF assessment on heat shield components of nuclear fusion experiment “Wendelstein 7-X” by critical plane criteria. Procedia Struct. Integr. 2018, 8, 318–331. [Google Scholar] [CrossRef]
  8. Ferraiuolo, M.; Perrella, M.; Giannella, V.; Citarella, R. Thermal–Mechanical FEM Analyses of a Liquid Rocket Engines Thrust Chamber. Appl. Sci. 2022, 12, 3443. [Google Scholar] [CrossRef]
  9. Giannella, V.; Fellinger, J.; Perrella, M.; Citarella, R. Fatigue life assessment in lateral support element of a magnet for nuclear fusion experiment “Wendelstein 7-X”. Eng. Fract. Mech. 2017, 178, 243–257. [Google Scholar] [CrossRef] [Green Version]
  10. Giannella, V.; Perrella, M.; Citarella, R. Efficient FEM-DBEM coupled approach for crack propagation simulations. Theor. Appl. Fract. Mech. 2017, 91, 76–85. [Google Scholar] [CrossRef]
  11. Citarella, R.; Lepore, M.A.; Fellinger, J.; Bykov, V.; Schauer, F. Coupled FEM-DBEM method to assess crack growth in magnet system of Wendelstein 7-X. Frat. Integrità Strutt. 2013, 7, 92–103. [Google Scholar] [CrossRef] [Green Version]
  12. Meneghetti, G.; Campagnolo, A.; Visentin, A.; Avalle, M.; Benedetti, M.; Bighelli, A.; Castagnetti, D.; Chiocca, A.; Collini, L.; De Agostinis, M.; et al. Rapid evaluation of notch stress intensity factors using the peak stress method with 3D tetrahedral finite element models: Comparison of commercial codes. Fatigue Fract. Eng. Mater. Struct. 2022, 45, 1005–1034. [Google Scholar] [CrossRef]
  13. Meneghetti, G. The use of peak stresses for fatigue strength assessments of welded lap joints and cover plates with toe and root failures. Eng. Fract. Mech. 2012, 89, 40–51. [Google Scholar] [CrossRef]
  14. Meneghetti, G. The peak stress method applied to fatigue assessments of steel and aluminium fillet-welded joints subjected to mode I loading. Fatigue Fract. Eng. Mater. Struct. 2008, 31, 346–369. [Google Scholar] [CrossRef]
  15. Sepe, R.; Wiebesiek, J.; Sonsino, C.M. Numerical and experimental validation of residual stresses of laser-welded joints and their influence on the fatigue behaviour. Fatigue Fract. Eng. Mater. Struct. 2020, 43, 1126–1141. [Google Scholar] [CrossRef]
  16. Perić, M.; Tonković, Z.; Rodić, A.; Surjak, M.; Garašić, I.; Boras, I.; Švaić, S. Numerical analysis and experimental investigation of welding residual stresses and distortions in a T-joint fillet weld. Mater. Des. 2014, 53, 1052–1063. [Google Scholar] [CrossRef]
  17. Sepe, R.; De Luca, A.; Greco, A.; Armentani, E. Numerical evaluation of temperature fields and residual stresses in butt weld joints and comparison with experimental measurements. Fatigue Fract. Eng. Mater. Struct. 2021, 44, 182–198. [Google Scholar] [CrossRef]
  18. Sepe, R.; Giannella, V.; Greco, A.; De Luca, A. FEM Simulation and Experimental Tests on the SMAW Welding of a Dissimilar T-Joint. Metals 2021, 11, 1016. [Google Scholar] [CrossRef]
  19. Armentani, E.; Caputo, F.; Esposito, L.; Giannella, V.; Citarella, R. Multibody Simulation for the Vibration Analysis of a Turbocharged Diesel Engine. Appl. Sci. 2018, 8, 1192. [Google Scholar] [CrossRef] [Green Version]
  20. Giannella, V.; Sepe, R.; Citarella, R.; Armentani, E. FEM Modelling Approaches of Bolt Connections for the Dynamic Analyses of an Automotive Engine. Appl. Sci. 2021, 11, 4343. [Google Scholar] [CrossRef]
  21. Armentani, E.; Giannella, V.; Citarella, R.; Parente, A.; Pirelli, M. Substructuring of a Petrol Engine: Dynamic Characterization and Experimental Validation. Appl. Sci. 2019, 9, 4969. [Google Scholar] [CrossRef] [Green Version]
  22. Citarella, R.; Federico, L. Advances in Vibroacoustics and Aeroacustics of Aerospace and Automotive Systems. Appl. Sci. 2018, 8, 366. [Google Scholar] [CrossRef] [Green Version]
  23. Citarella, R.; Federico, L.; Barbarino, M. Aeroacustic and Vibroacoustic Advancement in Aerospace and Automotive Systems. Appl. Sci. 2020, 10, 3853. [Google Scholar] [CrossRef]
  24. Meneghetti, G.; Campagnolo, A. The Peak Stress Method to assess the fatigue strength of welded joints using linear elastic finite element analyses. Procedia Eng. 2018, 213, 392–402. [Google Scholar] [CrossRef]
  25. Livieri, P.; Lazzarin, P. Fatigue strength of steel and aluminium welded joints based on generalised stress intensity factors and local strain energy values. Int. J. Fract. 2005, 133, 247–276. [Google Scholar] [CrossRef]
  26. De Martin, A.; Jacazio, G.; Sorli, M. Simulation of Runway Irregularities in a Novel Test Rig for Fully Electrical Landing Gear Systems. Aerospace 2022, 9, 114. [Google Scholar] [CrossRef]
Figure 1. 3D CAD of the landing gear testing machine; units in mm.
Metals 12 00937 g001
Figure 2. Overall simulation plan.
Metals 12 00937 g002
Figure 3. 1D model highlighting all boundary conditions for (a) static and (b) service conditions; 1D elements shown through a 3D rendering with a scale factor of 0.2 to improve visibility.
Metals 12 00937 g003
Figure 4. Contour plots of (a,b) bending and (c) twisting moments of the machine undergoing the static and service loads; 1D elements shown through a 3D rendering with a scale factor equal to 0.5 to improve visibility; units in Nmm.
Metals 12 00937 g004aMetals 12 00937 g004b
Figure 5. Contour plots of von Mises equivalent stress for (a) static and (b) service loading conditions; 1D elements shown through a 3D rendering with a scale factor equal to 0.5 to improve visibility; scale factor for deformations equal to 250; units in MPa.
Metals 12 00937 g005
Figure 6. Contour plot of 3D von Mises stress in the most critical position; extraction of σ ϑ ϑ , ϑ = 0 , p e a k along the path for the application of the PSM to predict the fatigue life of the weldment; units in MPa.
Metals 12 00937 g006
Figure 7. First mode shapes and corresponding resonant frequencies.
Metals 12 00937 g007
Table 1. Main mechanical properties of S275J0.
Young’s Modulus E (GPa)Poisson’s Ratio ν (–) Yield   Strength   σ Y S   ( MPa ) Ultimate   Tensile   Strength   σ Y S   ( MPa ) Mass Density ρ (kg/m3)
2100.33>275>4107900
Publisher’s Note: MDPI stays neutral with regard to jurisdictional claims in published maps and institutional affiliations.

