Article

Effect of Solution Treatment and Aging Treatment on Mechanical Properties of 2060 Al-Li Alloy and Process Multi-Objective Optimization

1
School of Mechanical Engineering, University of Science and Technology Beijing, Beijing 100083, China
2
Beijing Key Laboratory of Lightweight Metal Forming, University of Science and Technology Beijing, Beijing 100083, China
*
Author to whom correspondence should be addressed.
Metals 2022, 12(6), 897; https://doi.org/10.3390/met12060897
Submission received: 11 April 2022 / Revised: 12 May 2022 / Accepted: 18 May 2022 / Published: 25 May 2022

Abstract

:
Solution and aging heat treatment are effective means to improve the mechanical properties of Al-Li alloys. The solution treatment and aging treatment tests of 2060 Al-Li alloy were carried out. The yield strength, tensile strength, elongation, Vickers hardness, and microstructure of specimens after heat treatment were obtained by the tensile test at room temperature, Vickers hardness test, SEM analysis, TEM analysis, and EDS analysis. The effects of solution and aging heat treatment parameters on mechanical properties of 2060 Al-Li alloy were analyzed by response surface model and test results. The results show that sufficient solution can make the Cu-rich second phase of the alloy continuously dissolves into the aluminum matrix, and consequently obtain the supersaturated solid solution, the insoluble second phase is mainly θ’ (Al2Cu) phase, T(Al2Cu2Mg3) phase, and S’ (Al2CuMg) phase. The strength and hardness of the alloy are improved, but the ductility worsens with the degree of solution treatment enhances. With the increase of aging temperature and aging time, the strength and hardness of the alloy increase, but the elongation decreases. Taking tensile strength, elongation, and Vickers hardness of the alloy as the optimization objectives, the NSGA-II multi-objective optimization algorithm was used to optimize the process parameters of solution and aging heat treatment, and the heat treatment experiment was carried out. The optimization results show that the best mechanical properties of the alloy with matching strength and toughness can be obtained under the solution treatment at 466 °C/60 min and aging treatment at 185 °C/13 h.

1. Introduction

As a kind of high-performance lightweight alloy material, Al-Li alloy has the advantages of low density, high specific strength, high specific stiffness, high modulus, and excellent fatigue resistance and corrosion resistance. It is widely used in the manufacturing of aerospace structural parts and is one of the promising and potential lightweight materials [1]. The density of the alloy decreases by 3% and the elastic modulus increases by 6% with the addition of 1 wt.% lithium [2]. Comparing with the second generation of Al-Li alloy, the third generation of Al-Li alloy has higher specific strength and fracture toughness, which is widely used in aircraft skin and structural parts, among which 2060 Al-Li alloy is the most representative [3,4].
Suitable heat treatment can significantly improve the comprehensive mechanical properties of Al-Li alloy. For 2060 Al-Li alloy and other heat-treatable strengthening alloys, the main heat treatment method is solution-aging treatment. Tao et al. [5] studied the effect of heat treatment on the microstructure and mechanical properties of a kind of extruded Al–Li alloy. The second phase containing the Cu element abundantly was thoroughly dissolved in the matrix material after the solution process. The strength increases while elongation decreases if enhancing the aging temperature or increasing the aging time. Above all, they suggested that the size, quantity, and distribution of the T1 and θ’ phases are the crucial factors influencing the mechanical properties to post heat treatment. Lin et al. [6] studied the influence of aging treatment on the microstructure, tensile properties, and corrosion resistance of Al-Cu-Li alloy, and found that the two-stage aging, T8 heat treatment status, can improve the comprehensive properties of the alloy. Li et al. [7] analyzed the influence of solution and aging process on the microstructure and properties of 2297 Al-Li alloy by tensile test, SEM and TEM, and found that the optimal solution system was (535 ± 5) °C, 1.5 h. After aging at 160 °C, the alloy strength of 7% deformation reached a peak of 482 Mpa.
The multi-objective optimization algorithm is an effective method to achieve the co-ordination and matching optimization of multiple conflicting objectives. Multi-objective optimization can solve the problem that a single response surface cannot achieve the co-ordination and matching of conflicting objectives, and avoid the adverse impact of the change of a single optimization objective on other objectives in the optimization process [8]. Non-inferior solutions refer to the solutions that can be improved for each index cannot be found, and more non-inferior solutions are generated after multi-objective optimization to form the Pareto solution set, which is manifested as a high-dimensional surface in space called Pareto front. Given the low efficiency and poor effect of the traditional multi-objective optimization algorithm in the face of high dimension and non-linear complex objective function, the rules of biological genetic evolution are introduced to search for multiple non-inferior solutions by population, which is not sensitive to the shape and continuity of Pareto frontier and can approach the discontinuous optimal front segment well [9]. Ma et al. [10] took yield strength, elongation, and Vickers hardness of 6016 aluminum alloy as optimization objectives, and optimized the solution and aging heat treatment parameters by using the second generation non-dominated genetic algorithm (NSGA-II), and obtained a solution system (540 °C, 50 min) and aging system (180 °C, 100 min). Wang et al. [11] took 42CrMo as the research object and established a prediction model for its surface roughness, surface residual stress, and work hardening degree by response surface methodology. After multi-objective optimization of process parameters by simulated annealing algorithm, they found that the result of 3000 iterations was the best. Yue et al. [12] investigated the effects of different processing temperature, pressure drop, and feed rate on the forming quality of 6061 aluminum alloy sheet through numerical simulation, established a response surface model of each factor and maximum Mises stress and maximum thickness thinning rate, and carried out multi-objective optimization with maximum Mises stress and maximum thickness thinning rate as constraints. After multi-objective optimization, the optimal process parameters were obtained as follows: processing temperature was 142 °C, pressure drop was 0.51 mm, and feed rate was 720 mm∙min−1.
2060 Al-Li alloy in the field of aerospace service not only requires the high strength performance, but ductility. Existing research rarely reported the mechanics performance differences of 2060 Al-Li alloy under different solid solution and aging heat treatment system, a few focused on response surface modeling and the multi-objective optimization was seldom introduced into the optimization of Al-Li alloy heat treatment process parameters. Therefore, this paper aims to explore the influence of different heat treatment systems on the mechanical properties of 2060 Al-Li alloy, and find the best process parameters which can provide reference for the formulation of heat treatment process route of 2060 Al-Li alloy, and provide certain support for its application in the field of aerospace.
In the present study, the heat treatment of solution and aging are conducted under different solution and aging process conditions, and the mechanical properties of test specimens are measured at room temperature. Moreover, the second phase and microstructure of specimens are observed and discussed in the subsequent section. The response surface equations of strength, hardness, and elongation are obtained from the testing results; finally, the Pareto frontier of heat treatment parameters is determined by using a multi-objective genetic algorithm to optimize the equations. The optimal ranges of heat treatment parameters are obtained in order to ensure the combination of strength and elongation is the best at the same time.

2. Experimental

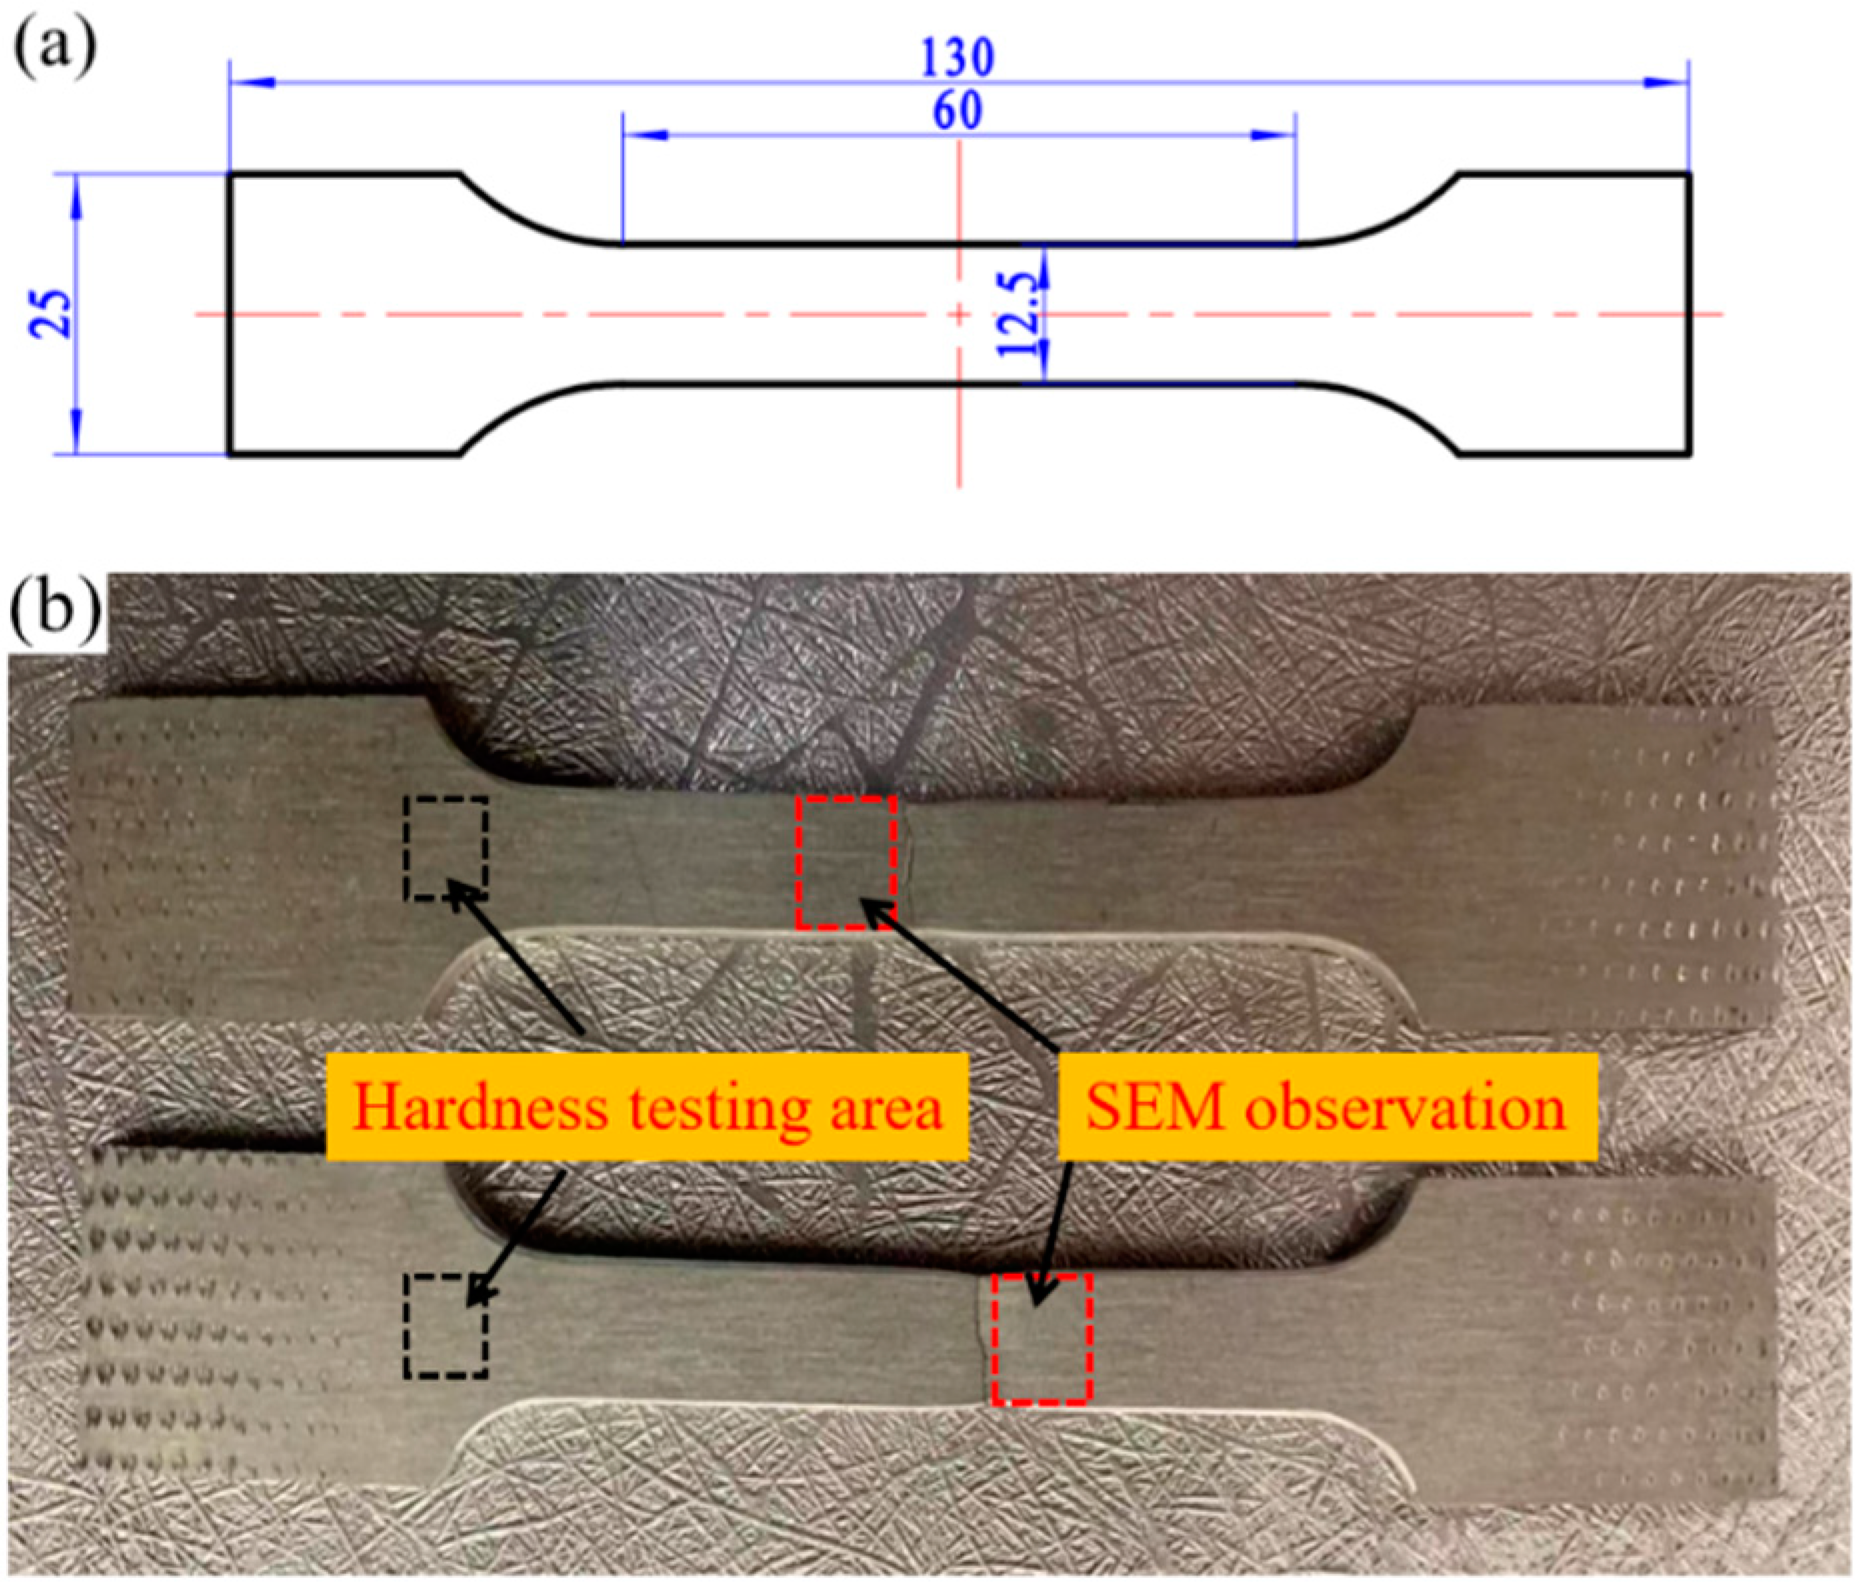
2.1. Experimental Materials and Procedures

The experimental material is a 2060 Al-Li alloy cold-rolled sheet with 2 mm thickness. Table 1 provides the chemical composition determined by the HX-750 metal spectrometric analyzer. It can be seen from Table 1 that the majority of alloying elements in the 2060 Al-Li alloy are the elements Cu and Mg. The addition of Cu and Mg could further increase the amount of strengthening phases in Al-Li alloy.
Figure 1 shows the dimension of the tensile specimen at room temperature and the fracture specimen after stretching. The tensile specimen was cut from the original sheet metal by wire electro-discharge cutting. The size of the tensile specimen is shown in Figure 1a. Three tensile specimens were gained from the as-delivered alloy sheets along the rolling direction. The tensile specimens were stretched by a universal tensile and compression testing machine to obtain the basic mechanical properties after the solution, water quenching and aging treatment. The square specimens with the dimension of 10 × 10 mm2 and 5 × 5 mm2 were also taken from the clamping section of the tensile specimen for hardness test and SEM observation. Figure 1b shows the fracture tensile specimens after testing. The fracture locates in the gauge length of the tensile specimen indicating that the elongation measured in the test satisfies the requirement in the Standard GB/T 228.1-2010, and, therefore, the measured value of elongation is credible.
Differential scanning calorimetry (DSC) was used to verify the temperature range of solution treatment of 2060 Al-Li alloy obtained according to reference [13]. A thin-sliced testing sample weighing about 15 mg was taken from the as-delivered alloy sheet and cleaned with acetone solution and ultrasonic cleaner. The DSC test sample was protected by nitrogen atmosphere during testing. Figure 2 indicates the DSC measure curve of the initial cold-rolled alloy sheet. There are two endothermic peaks on the curves when the temperature is about 210 °C and 435 °C, respectively. The first endothermic peak, from 180 to 270 °C, is caused by dissolution of the GP region and δ’ phase generated under natural aging [14], while the dissolving reaction of T1/T2 and θ/θ’ phases contributes to the second one, approximately from 350 to 520 °C [15]. The solution temperature should be selected to increase the solubility of solute phases as far as possible on the premise that the alloy does not overburn. According to the DSC curve, the solution temperature of the 2060 Al-Li alloy is decided in the range of 460–540 °C.
The experiment procedure for the solution and aging heat treatment is described as follows: the initial alloy sheet was cut into the tensile specimens, and the solution and aging heat treatments were conducted according to the experiment design. Because the mechanical properties of the 2060 Al-Li alloy are really sensitive to solution temperature, therefore, a muffle furnace had a high-temperature control accuracy of ±1 °C was adopted to heat the alloy sheet for completing solution treatment. The specimens were immediately quenched within the water after heating for the desired time at the arranged solution temperature. Artificial aging was conducted after water quenching in a constant temperature thermocirculator oven with a temperature control accuracy of ±1 °C. The gap time between the solution treatment and the aging treatment should be limited to less than 10 min to prevent natural aging from occurring.
After artificial aging, the tensile testing at room temperature was operated on a Zwick/Roell Z020 electronic universal testing machine. The hardness testing and metallographic observation specimens were clipped out from the tensile specimens. A microhardness tester was used to measure the hardness of the specimen five times and the average value of hardness was obtained. The Keller metallographic etchant was applied to demonstrate the microstructure, and the LEO 1450 field emission scanning electron microscope was used to observe the microstructure and analyze the energy spectrum.

2.2. Experiment Design and Test Results

In engineering statistics, George Box and Donald Behnken [16] devised the Box-Behnken design (BBD) for response surface statistical approximating model to formulate the relationships of independent and dependent variables. Box-Behnken design is the most efficient than other design methods such as central composite design (CCD), three-level full factorial design, and Doehlert design. Usually, each independent variable is at least divided into thirds, namely coded as three levels of −1, 0, and +1. The experiment design here in this study should be admissible to fit a quadratic model that contains the products of arbitrary factors, linear terms, and an intercept.
BBD was used to design and arrange the solution and aging combined experimental scheme, in which the solution temperature, solution time, aging temperature, and aging time were regarded as the experimental factors A, B, C, and D, respectively. In the experiment, the ranges of solution temperature and time are 460 to 540 °C and 10 to 60 min, respectively, while the ranges of aging temperature and time are 125 to 185 °C and 1 to 40 h, respectively. The tensile specimens were treated according to the experiment process described above. The experimental arrangement and the test results are given in Table 2.

3. Response Surface Model Analysis

3.1. Response Surface Equation Fitting

Employing Taylor expansion can approximate a complex function with a simple combination of polynomials, and use a similar concept to describe the response functions of experimental observation to different experimental conditions, as which the general equation of the response surface can be deduced [17]. Generally, the quadratic response surface equation is applied to gain a better fitting accuracy, and the equation is presented in Equation (1).
y = β 0 + i = 1 m β i x i + i = 1 m β i i x i x i + i < j β i j x i x j + e ,
where y represents the output dependent result, the symbol β with a subscript is the coefficient for the corresponding term, x represents the input independent variables, and e is the error of the response surface equation. Each coefficient can be determined by using the least square method minimizes the sum of error squares, and, finally, the response surface equation is determined.
The fitting effect of the response surface equation is determined by R2. When 0 ≤ R2 ≤ 1, the closer the value of R2 is to 1, the better the response surface fitting effect is. The R2 calculation formula is as follows, where y is the experimental value and y* is the predicted value.
R 2 = [ 1 ( ( y y ) 2 y 2 ) 1 2 ] 2
The tensile strength, yield strength, elongation, and Vickers hardness are denoted by the dependent variables y1, y2, y3, and y4, respectively. Furthermore, the four experimental independent variables, namely, solution temperature, solution time, aging temperature, and aging time, are represented by x1, x2, x3, and x4, respectively. The independent variables should be normalized, and their values range from −1 to 1 for the sake of data processing. The response surface equations of four experimental dependent variables were established based on the tensile testing results and hardness measurement given in Table 2. The determined coefficients were shown in Table 3.

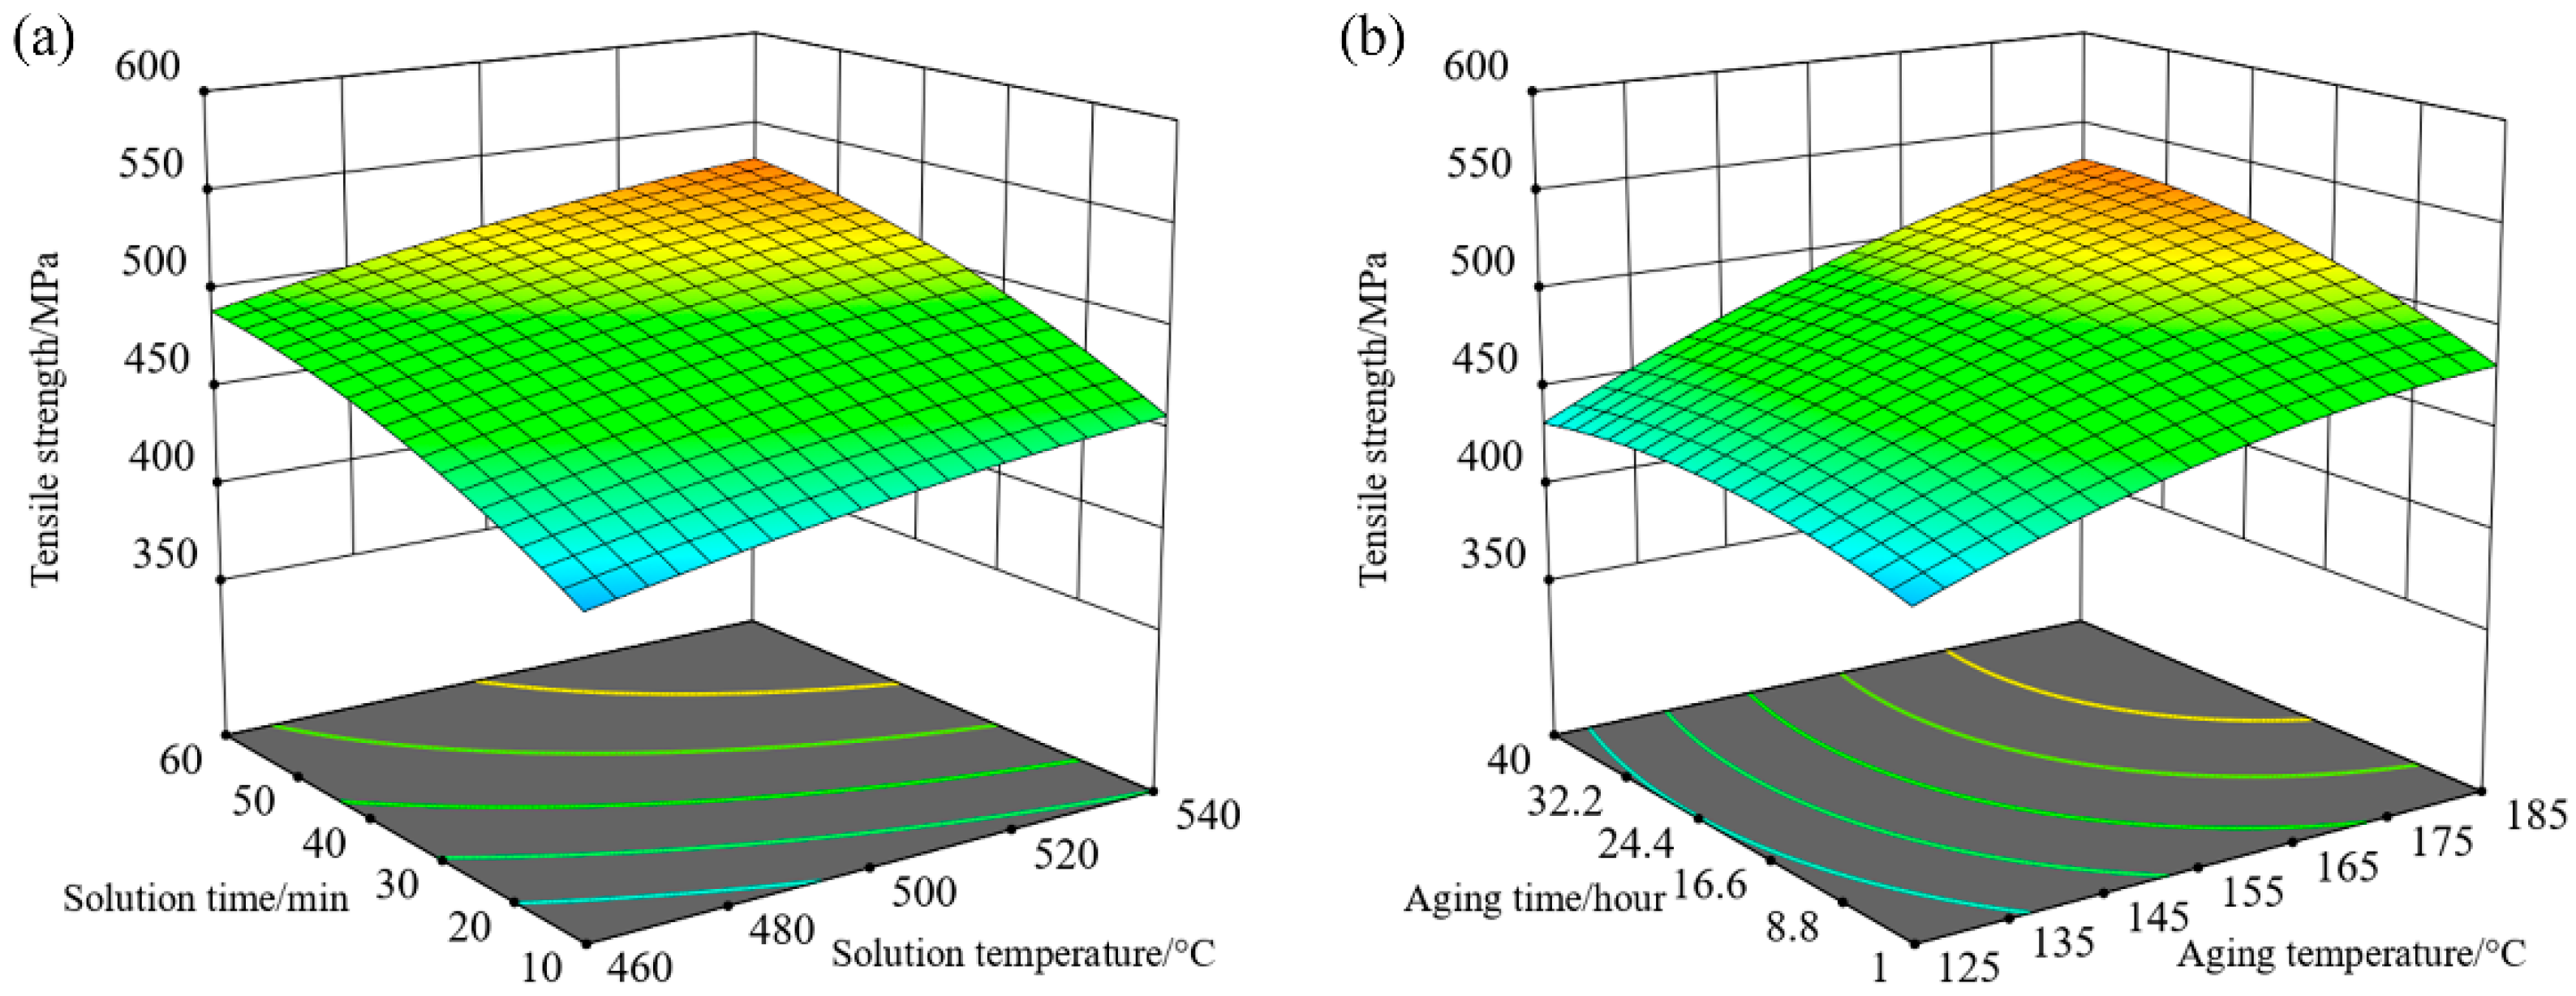
3.2. Effect of Process Parameters on Tensile Strength

The Adjusted R2 of the quadratic response surface equation for tensile strength is 0.9808, which indicates that the response surface equation agrees well with the experimental results and depicts the effect of solution and aging process parameters on tensile strength. Since the response surface equation of tensile strength has four independent variables, it is impossible to be plotted with a three-dimensional surface. In order to analyze the influence of process parameters on tensile strength, it is necessary to assign two process parameters definite values, and, thus, the relationship between the other two process parameters and tensile strength can be plotted. Figure 3a shows the response surface of tensile strength under the aging treatment of 155 °C/20.5 h and describes the influence of different solution parameters on tensile strength. Similarly, Figure 3b presents the response surface of the tensile strength under the solution treatment of 500 °C/35 min and describes the influence of aging parameters on tensile strength.
According to the response surface shown in Figure 3, the tensile strength of alloy sheet can be improved by increasing solution and aging temperature or prolonging solution and aging time. When the solution temperature increases to a certain extent, the tensile strength approaches the peak value. The tensile strength of alloy sheet increases with the increase of solution temperature when solution time is unchanged, while the tensile strength increases with the increase of solution time when solution temperature is constant. The tensile strength of alloy sheet increases with the increase of aging temperature at the same aging time, while the tensile strength increases with the increase of aging time at the consistent aging temperature. The tensile strength of greater than 500 MPa will be achieved if the solution treatment is conducted at the condition of 500–540 °C/43–60 min and the aging treatment at 155–185 °C/20.5–40 h. Increasing solution temperature or prolonging solution time increases the dissolution degree of alloying elements, and more solutes are dissolved into the aluminum matrix. Consequently, the aging precipitation and strengthening effect is better, and a higher tensile strength is acquired.

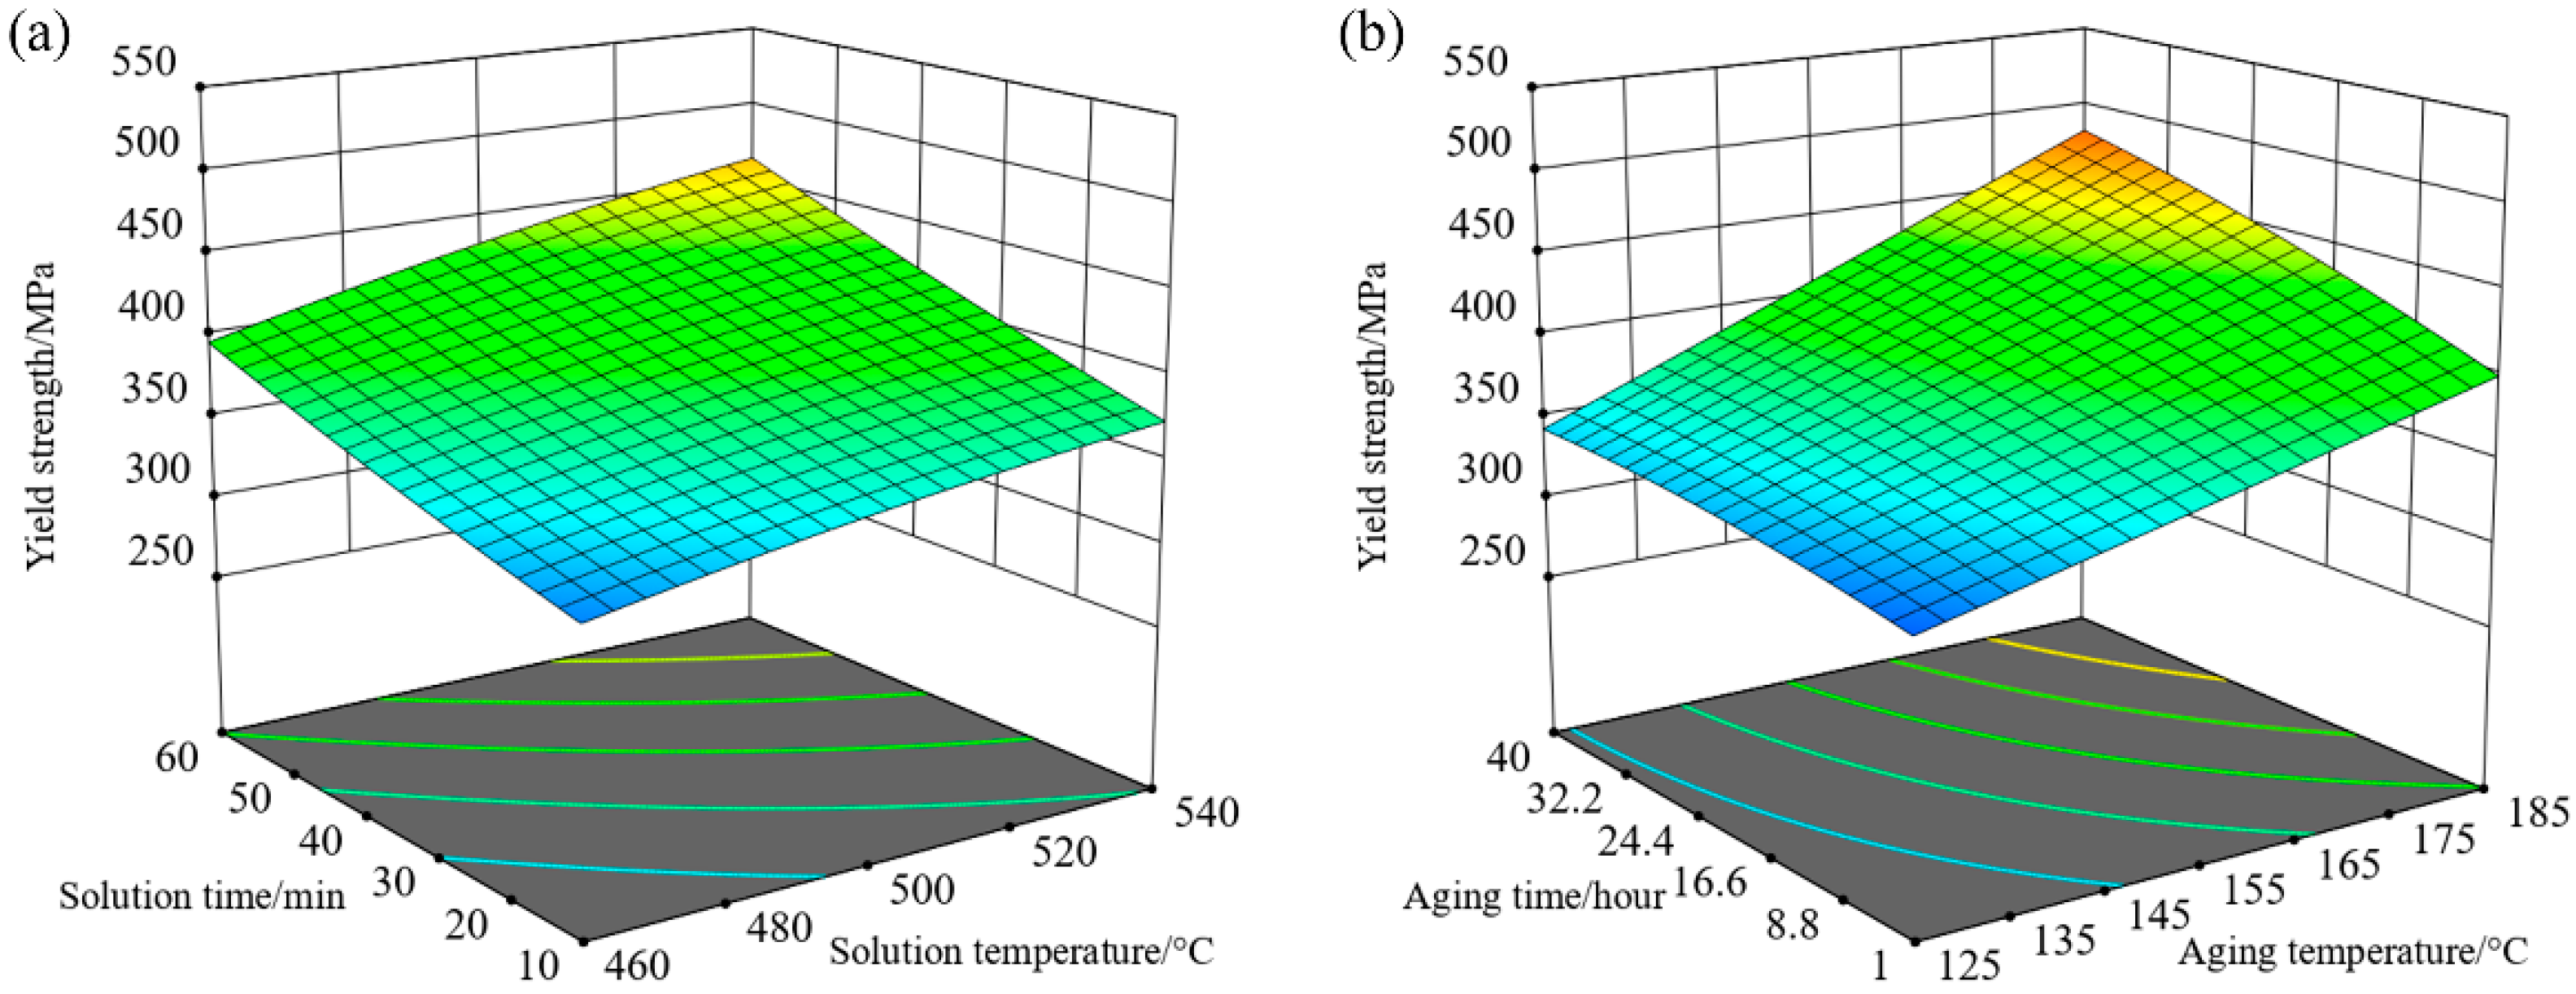
3.3. Effect of Process Parameters on Yield Strength

The Adjusted R2 of the yield strength response surface equation is 0.9434, which is slightly lower than that of the tensile strength response surface equation. The relationship between yield strength and the other two process parameters is obtained by keeping two process parameters unchanged. Figure 4a is the response surface of yield strength under the aging treatment of 155 °C/20.5 h, which describes the influence of solution treatment parameters on the yield strength. Figure 4b shows the response surface of yield strength under the solution treatment of 500 °C/35 min and describes the influence rule of aging treatment parameters on yield strength.
As can be seen from the response surfaces in Figure 4, the yield strength of alloy sheet can be improved by increasing the solution and aging temperature or prolonging the solution and aging time. The effect of solution time and aging temperature is more significant than that of other process parameters, and the responses of yield strength are approximately linear under the different process parameters, so the yield strength response surface manifests a gentle incline. The yield strength of alloy sheet increases with the increase of solution temperature at the same solution time, while the yield strength increases with the increase of solution time at the same solution temperature. The yield strength of alloy sheet increases with the increase of aging temperature and the yield strength increases with the increase of aging time. The yield strength of more than 400 MPa can be obtained after the solution treatment at 500–540 °C/43–60 min and the aging treatment at 160–185 °C/20.5–40 h. A sufficient solution indicates a large number of solute atoms to dissolve into the lattice of the aluminum matrix, resulting in lattice distortion and increasing the lattice resistance of dislocation movement, and improving the ability of the alloy to resist plastic deformation. Sufficient aging results in the formation of fine and dispersed precipitated particles in the alloy matrix, which are usually coherent or semi-coherent with the matrix. Dislocation movement must be cut or bypassed by the particles, which increases dislocation movement resistance and improve the ability of the alloy to resist plastic deformation. These two strengthening mechanisms could explain the effect of process parameters on yield strength.

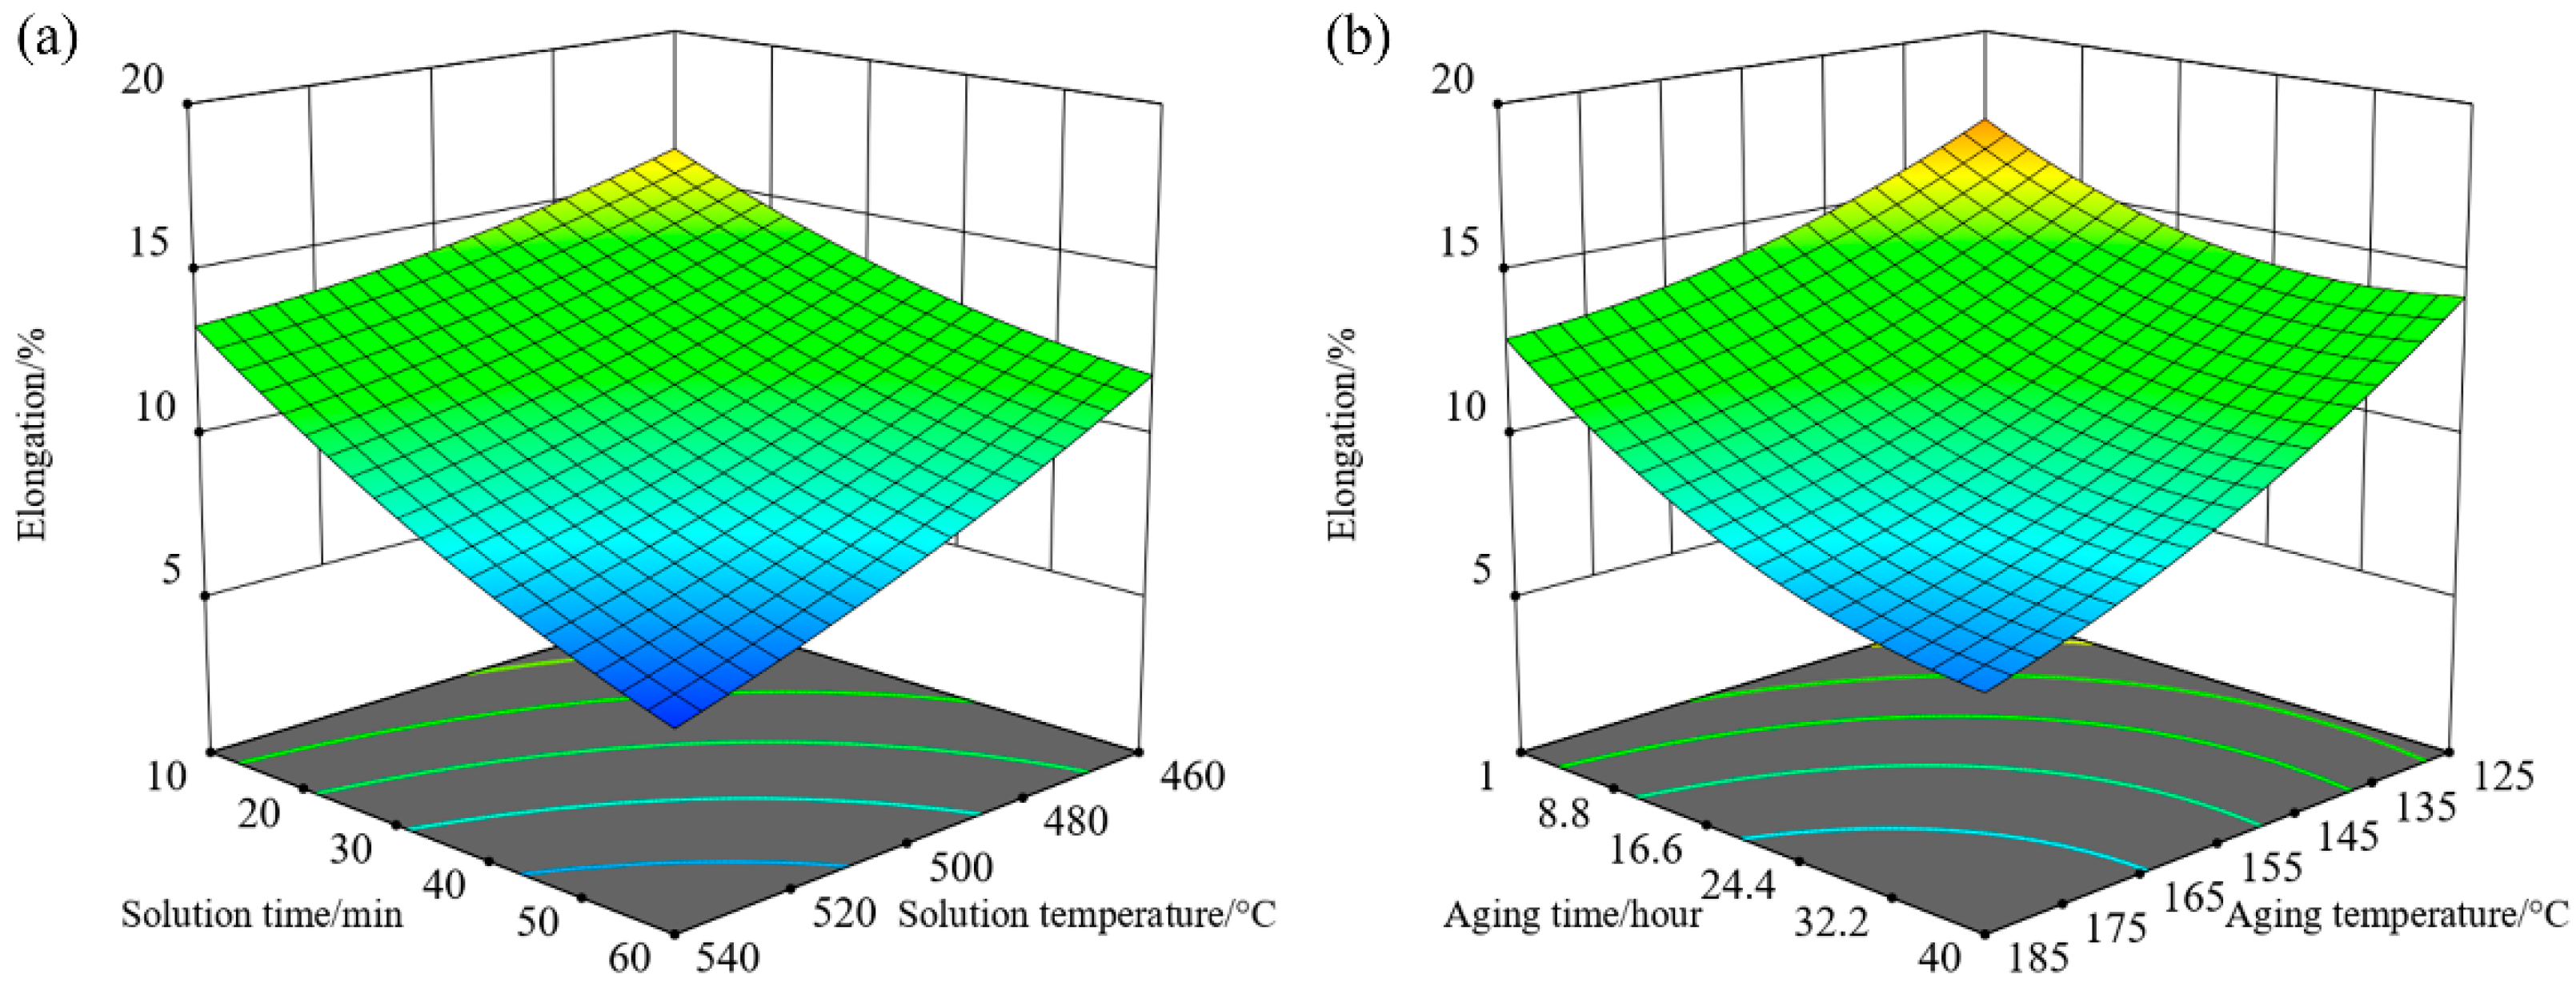
3.4. Effect of Process Parameters on Elongation

The Adjusted R2 of the response surface equation for elongation is 0.9321, which is lower than the response surface equation for tensile strength and yield strength, indicating that elongation may be affected by other factors besides solid solution strengthening and precipitation strengthening. Figure 5a is the response surface of elongation under the aging treatment of 155 °C/20.5 h, which describes the influence of solution treatment parameters on elongation. Figure 5b is the response surface of elongation under the solution treatment of 500 °C/35 min and describes the influence of aging treatment parameters on elongation.
It can be seen from the response surfaces in Figure 5 that increasing solution and aging temperature or prolonging solution and aging time reduce the elongation of alloy sheet, and when it is reduced to a certain extent, the decreasing trend of elongation becomes mild. The four heat treatment process parameters have similarly significant effects on elongation. The alloy elongation decreases with the increase of solution temperature and decreases with the increase of solution time. The elongation of alloy decreases with the increase of aging temperature and decreases with the increase of aging time. The elongation of alloy sheets would be greater than 10% if the solution temperature is less than 500 °C, solution time less than 40 min, aging temperature below 158 °C, and aging time less than 24 h. It is found that the variation trends of the response surfaces of strength and elongation are opposite by comparing the response surfaces. Hence, the compromise between strength and elongation should be made according to the effects of process parameters on them.

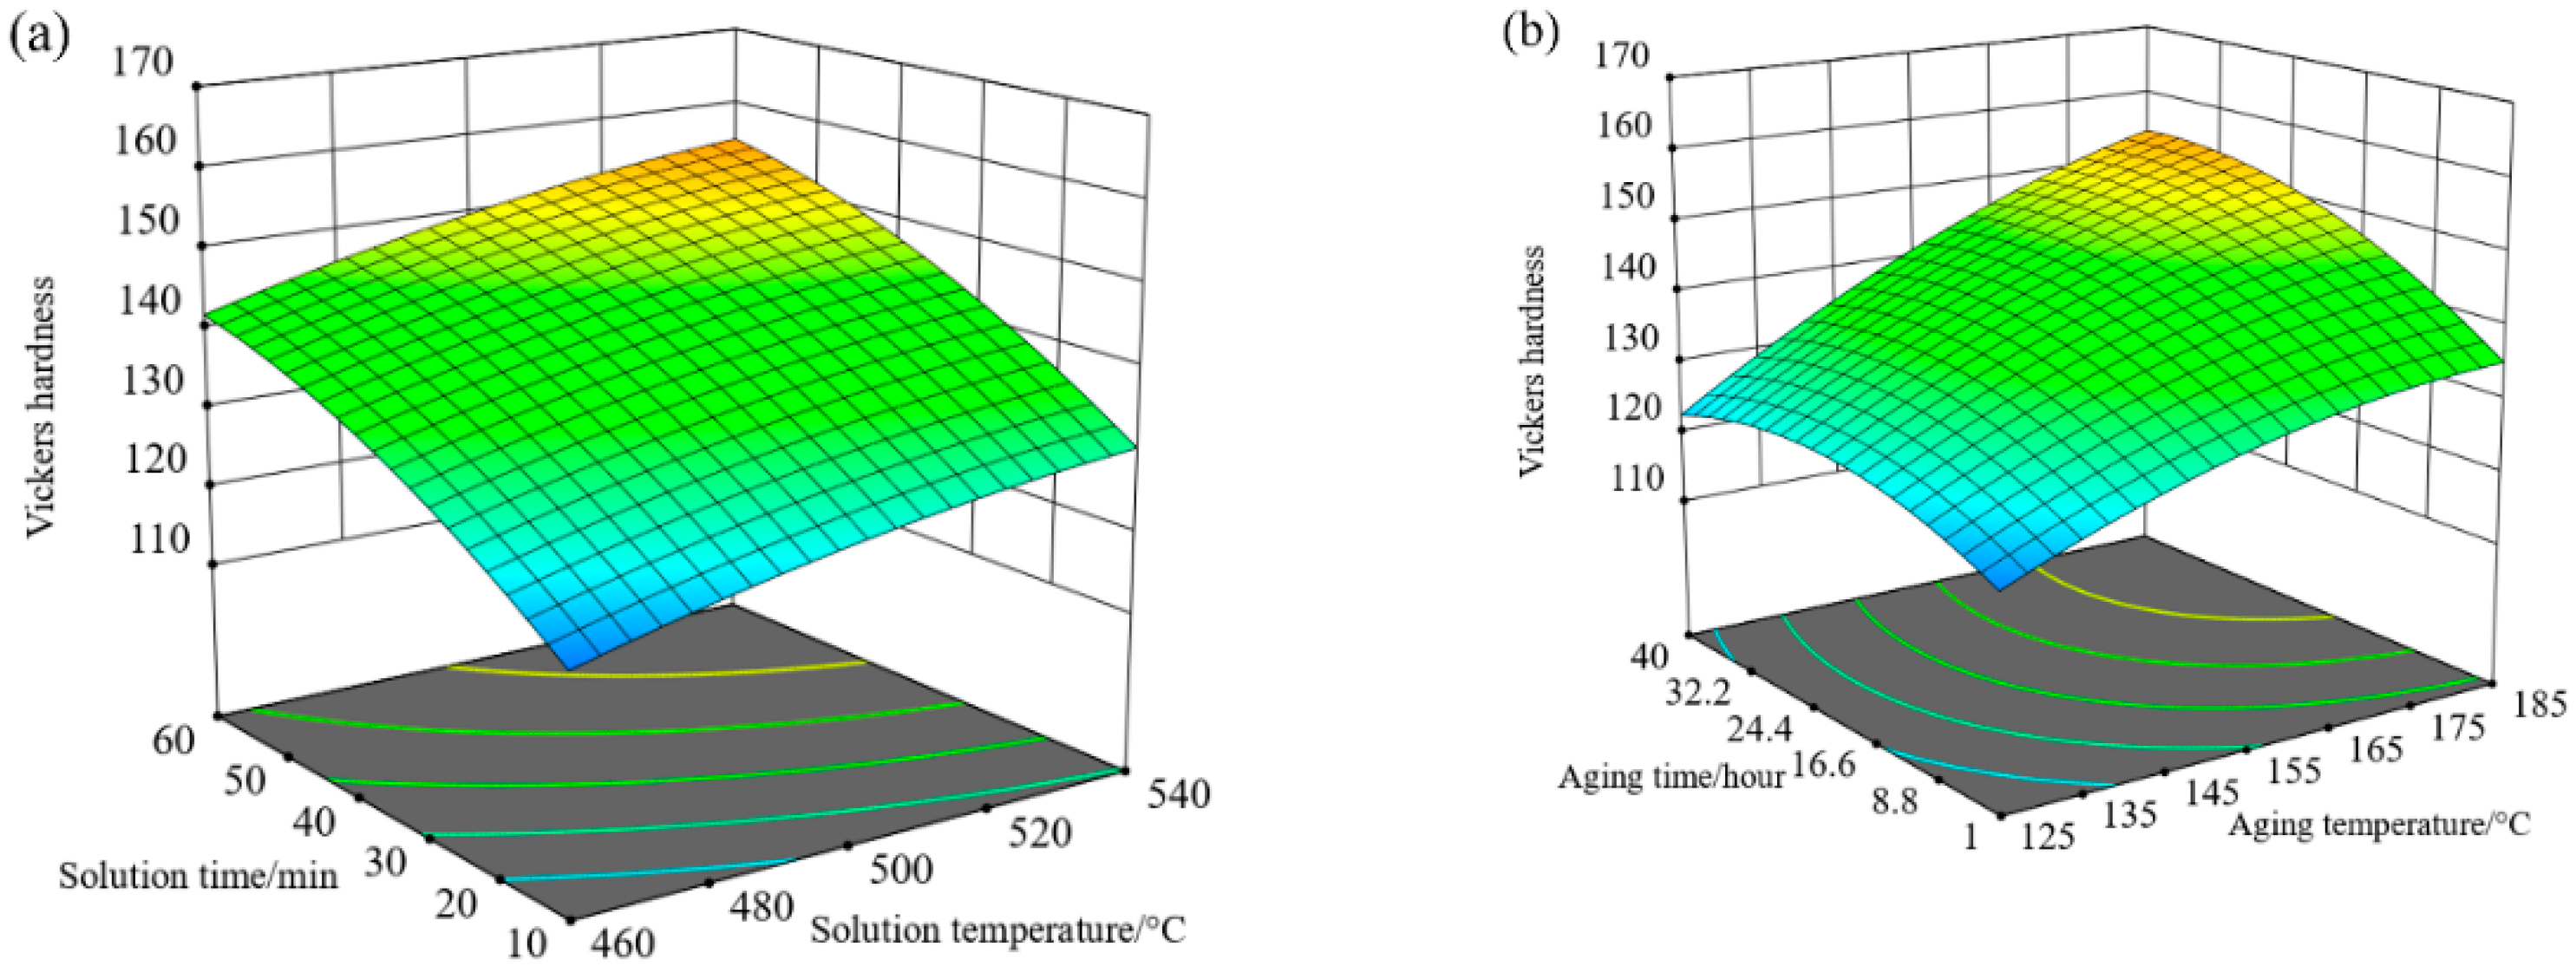
3.5. Effect of Process Parameters on Vickers Hardness

The Adjusted R2 of the response surface equation for Vickers hardness is 0.9321, indicating that the response surface equation has a good fitting and can reflect the effect of solution and aging process parameters on hardness. Figure 6a is the Vickers hardness response surface under the aging treatment of 155 °C/20.5 h, which describes the influence rule of solution treatment parameters on Vickers hardness. Figure 6b is the Vickers hardness response surface under the solution treatment of 500 °C/35 min, which describes the influence of aging treatment parameters on Vickers hardness.
It can be seen from the response surfaces in Figure 6 that increasing solution temperature and aging temperature or prolonging solution time and aging time can improve the Vickers hardness of alloy sheet. When the solution time and aging temperature increase to a certain extent, the Vickers hardness closes to the peak value, and the effect of solution time and aging temperature is more significant. The Vickers hardness of alloy sheet increases with the increase of solution temperature if solution time is constant, and increases with the increase of solution temperature if solution time is unchanged. The Vickers hardness of alloy sheet increases with the increase of aging temperature, while the Vickers hardness increases with the increase of aging time. The Vickers hardness above HV150 can be acquired at the solution treatment of 510–540 °C/53–60 min and aging treatment of 170–185 °C/30–40 h.

4. Microstructure Analysis

The supersaturated solid solution state of 2060 Al-Li alloy is an unstable state that could be attained after solution treatment and water quenching, and precipitation will occur under the conditions of the natural or artificial aging process. The type, size, and morphology of precipitates change with different alloy compositions and aging schemes, which finally determines the mechanical properties of the alloy [18]. Elements Ag and Zr are also added to the 2060 Al-Li alloy except for the elements of Cu and Mg. Element Ag shows higher binding energy and weaker interaction with Cu atoms, which inhibits the generation of the GP region in the initial period of aging and promotes the precipitation and growth of the T1 phase during the middle and late stages of aging. Moreover, elements Ag and Mg are prone to the formation of atomic clusters with vacancies, which provides low-energy nucleation sites for the T1 phase and thus play a catalytic role in the generation of the T1 phase [19]. The morphology of precipitated element Zr improves the pinning uniformity of dispersive phase, weakens the resistance of recrystallization, regulates the microstructure together with element Mn, and reduces the anisotropy of Al-Li alloys [20]. It can be deduced that the mechanical properties of 2060 Al-Li alloy after heat treatment are mainly affected by the distribution of alloy elements. The phase distribution and composition of the specimen are observed and analyzed by SEM.
The specimens with high tensile strength (No. 3 specimen in Table 2) and high elongation (No. 16 specimen in Table 2), and one cut from the as-delivered sheet are selected for SEM observation and TEM observation. The tensile strength of the No. 3 specimen is about 540 MPa, and the elongation of the No. 16 specimen is approximately 16%. The second phase was observed and its composition was analyzed by the energy dispersive spectrometer (EDS). Figure 7 presents the SEM photographs and the sampling position of corresponding specimens in the EDS analysis; Figure 8 shows the sample characterized and observed along the <110> crystal band axis of substrate by TEM.
The EDS analysis results are given in Table 4, corresponding to the element content identified in Figure 7. As can be seen from Figure 7a and Figure 8B, the initial material contains a large number of spherical and massive undissolved second phases, mainly the Cu-rich phases, the massive second phase is θ’ (Al2Cu) phase. Somewhat analogous second phases containing the elements Cu and Mn are also found in the 2050 Al-Li alloy [21]. It can be seen from Figure 7b and Figure 8B that after the solution treatment at 540 °C, the second phases in the NO. 3 specimen are almost completely dissolved, and the undissolved second phases with a size of 1–3 μm are occasionally found in the view field, massive θ’ (Al2Cu) phase still dominates. According to elemental analysis, it can be inferred that the compositions of the second phases are mainly a small amount of θ’ (Al2Cu), T(Al2Cu2Mg3) and S’ (Al2CuMg) phases, as well as the Mn-rich phases. It can be seen from Figure 7c and Figure 8C that, after the solution treatment at 460 °C, insufficient solution treatment leads to the residue of the second phases, mainly the Cu-rich phase, but the content of Cu atoms decreases while the content of Mg and Mn atoms increases, indicating that a part of Cu atoms are dissolved into the aluminum matrix, while some Mg and Mn atoms are enriched in the second phases.

5. Multi-Objective Optimization based on NSGA-II

Based on the first-generation NSGA algorithm [22], the NSGA-II algorithm [23] introduces an elite quicksort to retain the best individuals and ensure that excellent individuals will not be discarded in the evolution to maintain population diversity [24]. The main procedure of the algorithm is described as follows:
  • Random generation of the original population. The population is not dominated sequence, and then the population selection, crossover, and mutation are conducted to produce the next generation of subpopulations;
  • In the second-generation population, the offspring, and the parent population are blended to form a new population, and then the new population is arranged in a fast non-dominated sequence. The crowding degree of each non-dominated layer is calculated, and the appropriate individuals are selected to form the new parent population with the help of the non-dominant relationship and crowding degree. The new offspring are generated through a new round of selection, crossover, and mutation;
  • Determine the termination condition whether repeat step 2.
The tensile strength, elongation, and Vickers hardness are selected for multi-objective optimization. The optimization principal is hoping the three mechanical properties of specimens after the heat treatment could reach a higher level. The multi-objective optimization objective function can be expressed with the independent variables X = [ x 1 , x 2 , x 3 , x 4 ] T :
F o b j = min { y 1 ( X ) , y 3 ( X ) , y 4 ( X ) } s . t .   X { X | 460 x 1 540 , 10 x 2 60 , 125 x 3 185 , 1 x 4 40 }
In the Equation (3), y 1 ( X ) , y 3 ( X ) , and y 4 ( X ) are the response surface equations of the tensile strength, elongation, and Vickers hardness after the solution and aging treatment, respectively. The algorithm parameters are given as follows: initial population of 100, evolution generations of 1000, crossover probability of 0.9, mutation probability of 0.1, optimal individual coefficient of 0.8, and fitness deviation of 10−10. After several rounds of genetic evolution calculation, the non-inferior solution set is obtained as shown in Figure 9.
In Figure 9, the blue scatters represent the spatial distribution of possible solutions to the objective function, and the red scatters represent the Pareto frontier calculated by the NSGA-II algorithm. By multi-objective optimization algorithm, the distribution of the Pareto frontier is uniformly distributed on edge of the maximum directions of multi-objective function in solution space. It can be seen from Figure 9b,c that elongation decreases with the increase of tensile strength and Vickers hardness, and there is no absolute optimal solution that the maximum values of the three mechanical properties are taken.
In order to achieve high strength and hardness and a certain elongation, three types of heat treatment can be determined from the Pareto front according to the tensile strength and elongation: high strength (about 550 MPa), low elongation (about 5%); medium strength (about 500 MPa), medium elongation (≥10%); low strength (about 450 MPa), high elongation (≥15%). The selected optimal results are listed in Table 5.
As can be seen from Table 5, comprehensively considering strength and elongation, the solution treatment of 466 °C/60 min and the aging treatment of 185 °C/13 h should be selected. If the focus is on high strength, the solution treatment should be conducted at 485 °C/60 min and the aging treatment at 185 °C/37 h. The optimized process parameters were used for the solution and aging treatment, and the tensile and hardness tests were conducted. The testing results are compared with the response surface results, as given in Table 6. It could be demonstrated that the results obtained by multi-objective optimization are close to those measured from the actual heat treatment experiment. This indicates that the response surface equations are available for the determination of heat treatment process parameters.

6. Conclusions

  • Solution and aging have a significant effect on the strength and ductility of 2060 Al-Li alloy. Within the range of experimental parameters, the alloy strength is positively correlated with temperature and time, while the alloy plasticity is negatively correlated with temperature and time. After the solution and aging treatment, the tensile strength and yield strength of the alloy are about 550 MPa and 500 MPa, respectively, and the hardness can be close to HV170. The elongation of the alloy can attain 19% at best and 5% at worst.
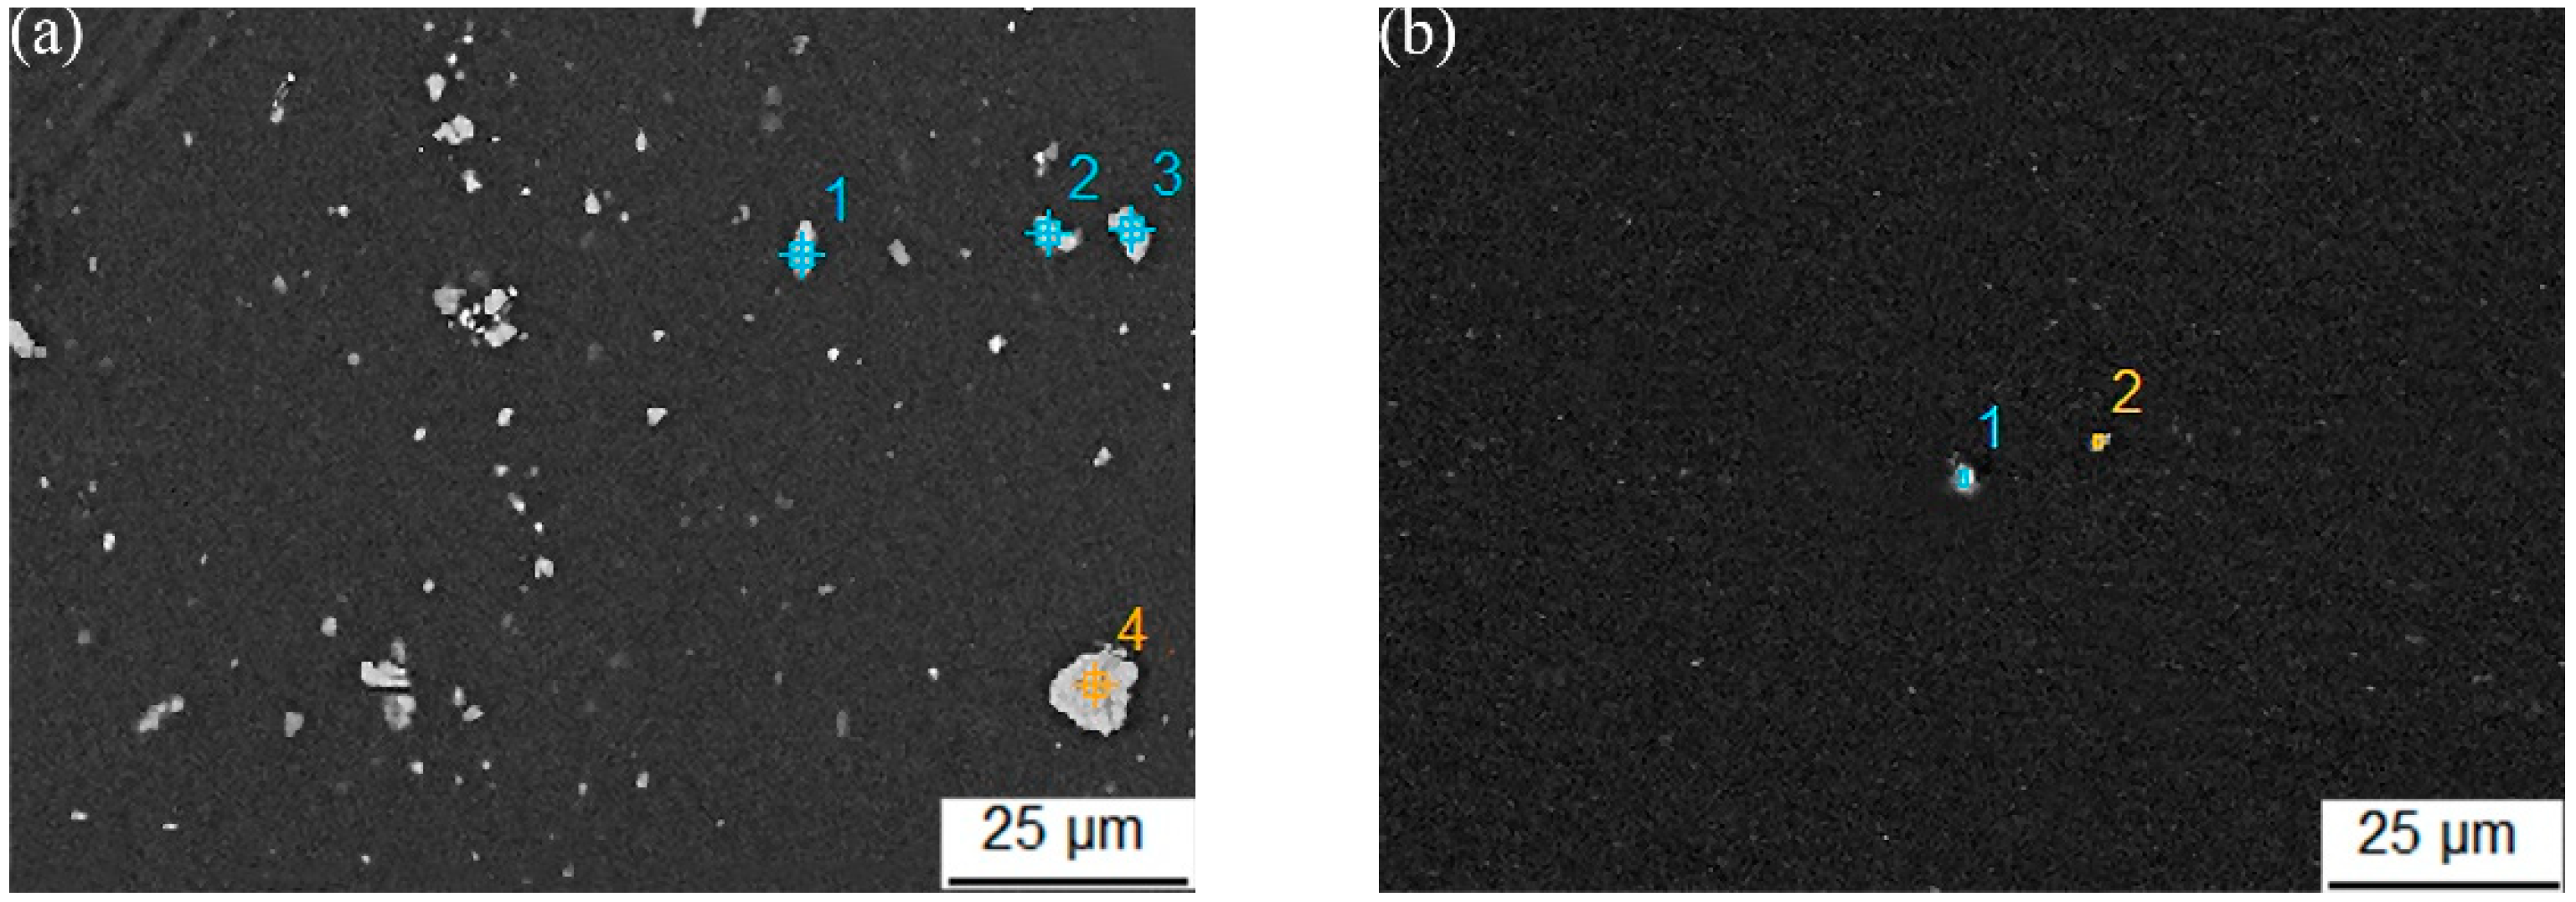
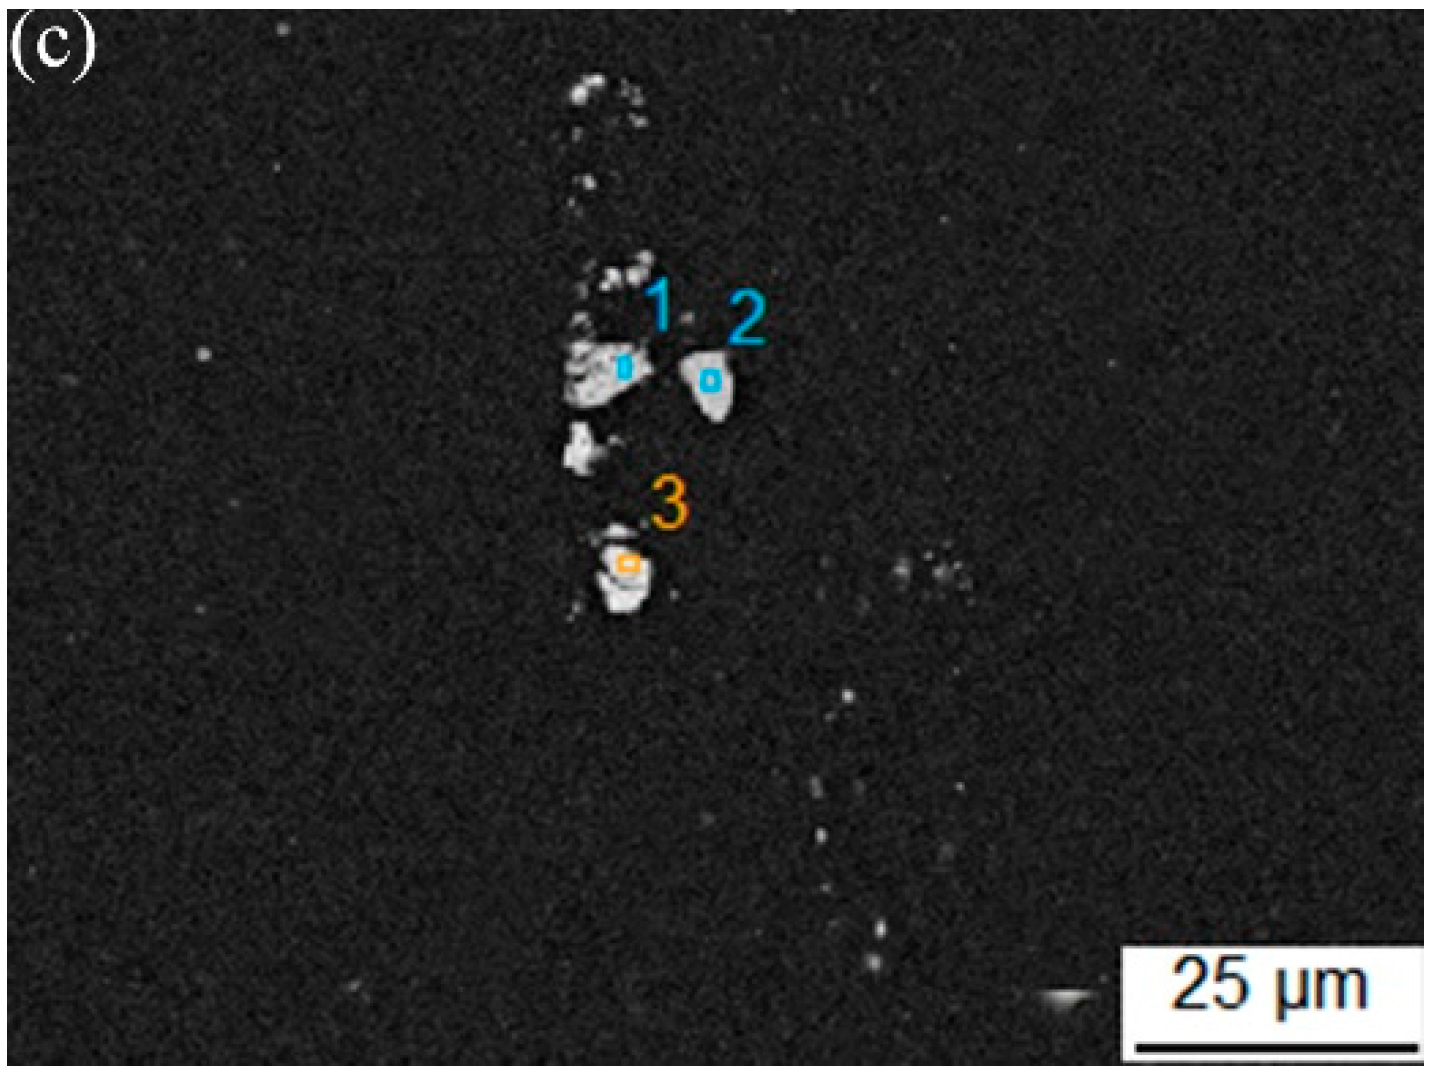
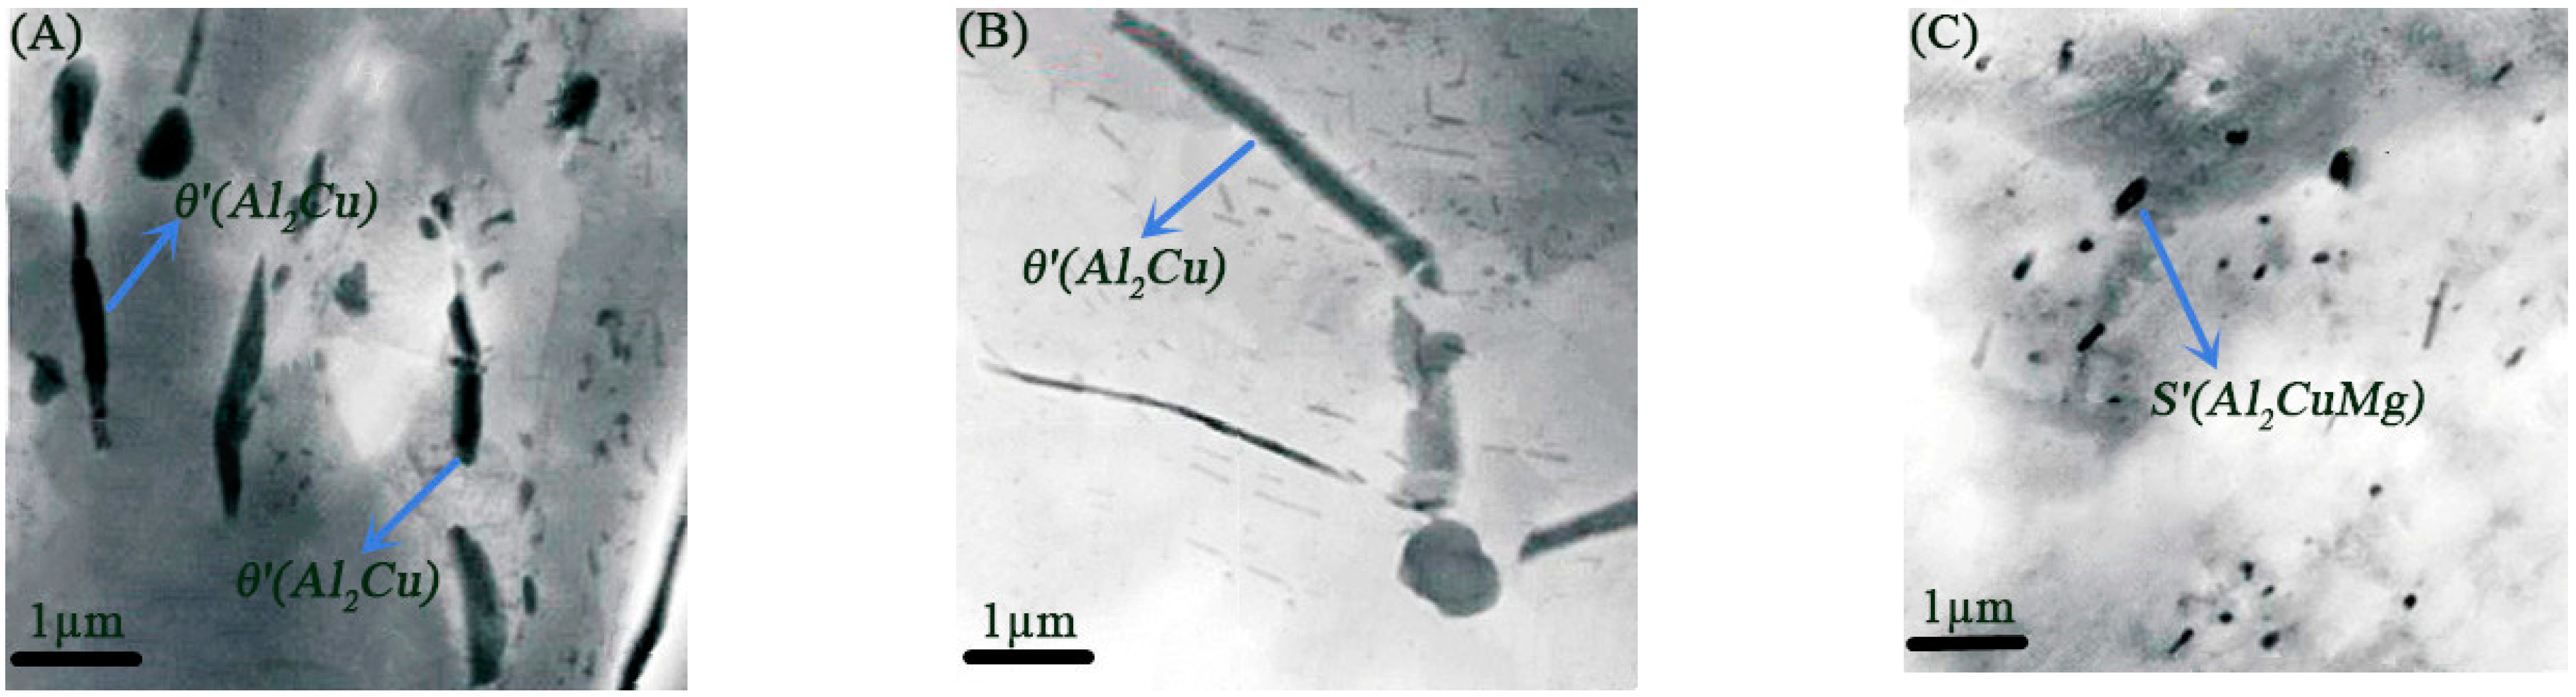
  • SEM observation and TEM analysis indicate that the dissolution degree of the second phase of the alloy is mainly affected by solution treatment. The sufficient solution treatment can make the Cu-rich second phases of the alloy fully dissolve into the aluminum matrix and reduce the second phase particle residual. After water quenching, it is easier to obtain the supersaturated solid solution, which is conducive to improving the strength and hardness of the alloy.
  • Taking the tensile strength, elongation, and hardness of the alloy as the optimization objectives, the Pareto frontier of process parameters was acquired after multi-objective optimization by NSGA-II. The optimal process parameters are as follows: 466 °C/60 min for solution treatment, 185 ℃/13 h for aging treatment. The tensile strength of the alloy can reach 500 MPa, the elongation can reach 12%, and in this case, the strength and ductility matching is pretty good. The experimental results show that the mechanical properties of the alloy under the optimal process parameters are close to the calculated results from the response surfaces, and the process parameters can be used as a reference for process formulation.

Author Contributions

Conceptualization, J.Z. and J.M.; Methodology, J.Z. and J.M.; Investigation, J.Z., J.M. and B.W.; writing—original draft preparation, J.Z. and J.M.; writing—review and editing, B.W. and J.W. All authors have read and agreed to the published version of the manuscript.

Funding

This research was funded by Fundamental research Funds for the central universities, grant number FRD-BD-20-08A and FRD-BD-19-003A.

Data Availability Statement

Data presented in this article are available at request from the corresponding author.

Conflicts of Interest

The authors declare no conflict of interest.

References

  1. Dursun, T.; Soutis, C. Recent developments in advanced aircraft aluminium alloys. Mater. Des. 2014, 56, 862–871. [Google Scholar] [CrossRef]
  2. Rioja, R.J.; Liu, J. The Evolution of Al-Li Base Products for Aerospace and Space Applications. Metall. Mater. Trans. A 2012, 43, 3325–3337. [Google Scholar] [CrossRef]
  3. Zheng, Z.Q.; Li, J.F.; Chen, Z.G. Alloying and microstructural evolution of Al-Li alloys. Chin. J. Nonferr. Met. 2011, 21, 2337–2351. [Google Scholar]
  4. Wu, X.L.; Liu, M.; Zang, J.X. Research progress and aerospace application of aluminum lithium alloys. Mater. Rep. 2016, 30 (Suppl. S2), 571–578. [Google Scholar]
  5. Tao, J.; Zhang, L.; Wu, G. Effect of heat treatment on the microstructure and mechanical properties of extruded Al–4Cu–1Li–0.4Mg–0.4Ag–0.18Zr Alloy. Mater. Sci. Eng. A 2018, 717, 11–19. [Google Scholar] [CrossRef]
  6. Lin, Y.; Lu, C.; Wei, C. Effect of aging treatment on microstructures, tensile properties and intergranular corrosion behavior of Al–Cu–Li alloy. Mater. Charact. 2018, 141, 163–168. [Google Scholar] [CrossRef]
  7. Li, H.Y.; Wang, X.Y.; Yu, W.C. Effect of solution aging process on microstructure and mechanical properties of 2297 Al-Li alloy. Chin. J. Nonferr. Met. 2017, 27, 2187–2194. [Google Scholar]
  8. Xiao, R.; Yang, M.; Huang, C.W. Optimal design of 211ZX high strength aluminum alloy solid solution process based on response surface method. Chin. J. Rare Met. 2019, 43, 1040–1046. [Google Scholar]
  9. Feng, Q.; Li, Q.; Quan, W. Overview of multiobjective particle swarm optimization algorithm. Chin. J. Eng. 2021, 43, 745–753. [Google Scholar]
  10. Ma, Y.W.; Wang, B.Y.; Xiao, W.C. Effect of solution and aging processes on the mechanical properties of 6016 aluminum alloy and multi-objective optimization. Chin. J. Eng. 2017, 39, 75–80. [Google Scholar]
  11. Wang, H.J.; Wang, X.Q.; Zhu, Q.P.; Wang, P.G. Multi-objective optimization of ultrasonic rolling extrusion process parameters based on simulated annealing. J. Plast. Eng. 2022, 04, 14–22. [Google Scholar]
  12. Yue, T.W.; Chen, X.H.; Men, Z.X.; Ma, Y.X.; An, Z.G. Multi-objective optimization of nc single point progressive warm forming process for 6061 aluminum alloy sheet. Forg. Technol. 2020, 45, 59–64. [Google Scholar]
  13. Gao, H.; Weng, T.; Liu, J. Hot stamping of an Al-Li alloy: A feasibility study. MATEC Web Conf. 2015, 21, 5–17. [Google Scholar] [CrossRef] [Green Version]
  14. Kim, J.H.; Jeun, J.H.; Chun, H.J.; Lee, Y.R.; Yoo, J.T.; Yoon, J.H. Effect of precipitates on mechanical properties of AA2195. J. Alloy. Comp. 2016, 669, 187–198. [Google Scholar] [CrossRef]
  15. Kumar, K.S.; Brown, S.A.; Pickens, J.R. Microstructural evolution during aging of an Al-Cu-Li-Ag-Mg-Zr alloy. Acta Mater. 1996, 44, 1899–1915. [Google Scholar] [CrossRef]
  16. George, B.; Donald, B. Some new three level designs for the study of quantitative variables. Technometrics 1960, 2, 455–475. [Google Scholar]
  17. Liu, H.Q.; Cao, X.Y.; Fang, Y.W.; Xie, W.P. Finite element model modification of steel box girder bridge based on response surface method. J. Wuhan Univ. Technol. 2016, 38, 69–75. [Google Scholar]
  18. Zhu, X.X. Ageing Response and Strengthening Mechanism of Novel Al-Li Alloys; Harbin Institute of Technology: Harbin, China, 2016; pp. 3–4. [Google Scholar]
  19. Huang, B.; Zheng, Z. Independent and combined roles of trace Mg and Ag additions in properties precipitation process and precipitation kinetics of Al–Cu–Li–(Mg)–(Ag)–Zr–Ti alloys. Acta Mater. 1998, 46, 4381–4393. [Google Scholar] [CrossRef]
  20. Tsivoulas, D.; Robson, J.D.; Sigli, C. Interactions between zirconium and manganese dispersoid-forming elements on their combined addition in Al–Cu–Li alloys. Acta Mater. 2012, 60, 5245–5259. [Google Scholar] [CrossRef]
  21. Zhu, R.; Liu, Q.; Li, J. Dynamic restoration mechanism and physically based constitutive model of 2050 Al–Li alloy during hot compression. J. Alloy. Compd. 2015, 650, 75–85. [Google Scholar] [CrossRef]
  22. Deb, K.; Pratap, A.; Agarwal, S.; Meyarivan, T.A.M.T. A fast and elitist multiobjective genetic algorithm: NSGA-II. IEEE Trans. Evol. Comput. 2002, 6, 182–197. [Google Scholar] [CrossRef] [Green Version]
  23. Srinivas, N.; Deb, K. Muiltiobjective Optimization Using Nondominated Sorting in Genetic Algorithms. Evol. Comput. 1994, 2, 221–248. [Google Scholar] [CrossRef]
  24. Ma, W.; Wang, B.; Yang, L. Influence of solution heat treatment on mechanical response and fracture behaviour of aluminium alloy sheets: An experimental study. Mater. Des. 2015, 88, 1119–1126. [Google Scholar] [CrossRef]
Figure 1. Tensile specimens: (a) the dimension of tensile specimen; (b) the fractured specimens after tensile testing.
Metals 12 00897 g001
Figure 2. DSC curve of initial 2060 Al-Li alloy sheet.
Metals 12 00897 g002
Figure 3. Response surfaces of tensile strength: (a) different solution temperatures and time; (b) different aging temperatures and time.
Metals 12 00897 g003
Figure 4. Response surfaces of yield strength: (a) different solution temperatures and time; (b) different aging temperatures and time.
Metals 12 00897 g004
Figure 5. Response surfaces of elongation: (a) different solution temperatures and time; (b) different aging temperatures and time.
Metals 12 00897 g005
Figure 6. Response surfaces of Vickers hardness: (a) different solution temperatures and time; (b) different aging temperatures and time.
Metals 12 00897 g006
Figure 7. SEM images of the specimens under different treatment conditions: (a) as-delivered material; (b) No. 3 testing specimen; (c) No. 16 testing specimen.
Metals 12 00897 g007aMetals 12 00897 g007b
Figure 8. TEM images of the specimens under different treatment conditions: (A) as-delivered material; (B) No. 3 testing specimen; (C) No. 16 testing specimen.
Metals 12 00897 g008
Figure 9. Pareto frontiers of multi-objective optimization: (a) Pareto front in solution space; (b) Pareto front in the solution space of tensile strength versus elongation; (c) Pareto front in the solution space of elongation versus Vickers hardness.
Metals 12 00897 g009
Table 1. Chemical composition of Al-Li alloy 2060 (wt.%).
CuLiMgAgZrZnMnFeSiAl
3.960.750.870.230.140.40.350.070.07Bal.
Table 2. Experimental arrangement for solution and aging treatment and testing results.
RunFactor A
Solution
Temperature (°C)
Factor B
Solution Time (min)
Factor C
Aging
Temperature (°C)
Factor D
Aging Time
(h)
Tensile Strength (MPa)Yield Strength (MPa)Elongation (%)HV
Error (+/−)±1±1±1±1±0.1±0.1±0.1±0.1
1500601551465.2386.512.5128.6
24603512520.5432.5341.714.5123
35403518520.5539.8497.45.1159.2
45401015520.5463.838213.5128.2
5500351851484.4398.613.9133.2
65001012520.5393.3299.819.2112.4
7500101551430.7345.915.4124
84606015520.5485.6379.512.3141.3
95001018520.5466.5390.911.5131.7
105003515520.5499.5407.39.4143.6
115406015520.5533.84476.2154.5
125001015540427.9350.314.9122.7
135006015540534.3493.26.5159.1
14460351551459.6348.915.8130.7
154603518520.5481.2397.813.2139.8
164601015520.5420.2336.116.3116.5
174603515540448.9340.813.2125.5
185003512540432.2336.313.9121.8
195006012520.5463.3378.712.6133.5
205403515540525.9472.36.7152.7
215403512520.5436.2334.213.3126.3
225003515520.5491.3374.311.9138.3
235003518540532.1479.47.1152.3
24500351251423.7315.317.4118.2
25540351551463.1358.714.2131.8
265003515520.5480.4393.610.8142.8
275006018520.5549.9504.45.5163.1
Table 3. Polynomial coefficients of quadratic response surface equations.
Polynomial CoefficientsResponse Surface Equations
y1 (MPa)y2 (MPa)y3 (%)y4
β0490.4000391.733310.7000141.5667
β119.633328.9000−2.19176.3250
β235.808340.3583−2.933312.0500
β339.475055.2083−2.883312.0083
β414.550026.5333−2.24175.6333
β121.15005.4000−0.82500.3750
β1313.975026.7750−1.72504.0250
β1418.375030.4250−1.22506.5250
β233.35008.65000.15002.5750
β2417.975025.5750−1.37507.9500
β349.800014.9500−0.82503.8750
β11−4.3792−4.47080.4083−1.6833
β22−11.51672.76670.6708−3.4208
β33−11.31670.29170.7708−3.5583
β44−12.3292−5.74581.3083−5.2958
Table 4. EDS analysis results at different positions.
Position LabelContent (at.%)
AlCuMgAgMn
Error (+/−)±0.5±0.1±0.01±0.01±0.1
a175.815.70.70.12.6
a275.516.00.70.12.5
a379.313.60.7-2.1
a471.518.00.40.24.0
b190.73.61.0-4.7
b290.15.10.9-3.9
c176.711.91.9-5.9
c272.610.23.80.18.3
c374.715.32.2-2.5
Table 5. Optimal results chosen from Pareto front.
Solution
Temperature (°C)
Solution Time (min)Aging
Temperature (°C)
Aging Time
(h)
Tensile Strength (MPa)Elongation (%)HV
48560184.837553.25.9166
46660184.713501.412.3145.5
46023184.51.2450.316.5126
Table 6. Comparison of the actual mechanical properties with the optimal results.
Mechanical
Properties
High Strength-Low DuctilityModerate Strength–Moderate
Ductility
Optimal
Results
Testing
Results
Optimal ResultsTesting Results
Tensile strength/MPa553.2533501.4493
Elongation/%5.95.312.313.2
Vickers hardness166161.3145.5139
Publisher’s Note: MDPI stays neutral with regard to jurisdictional claims in published maps and institutional affiliations.

