Article

Oxidation Behavior of Intermetallic Phase and Its Contribution to the Oxidation Resistance in Fe-Cr-Zr Ferritic Alloy

Key Laboratory of Nuclear Materials and Safety Assessment, Institute of Metal Research, Chinese Academy of Sciences, 72 Wenhua Road, Shenyang 110016, China
*
Author to whom correspondence should be addressed.
Metals 2022, 12(5), 827; https://doi.org/10.3390/met12050827
Submission received: 22 April 2022 / Revised: 7 May 2022 / Accepted: 9 May 2022 / Published: 11 May 2022
(This article belongs to the Special Issue Advances in Corrosion and Protection of Materials)

Abstract

:
Oxidation resistance of the ferritic Fe-Cr-W-Zr alloy with dispersed Fe2Zr phase were investigated in stagnant air and in static oxygen-saturated liquid Pb-Bi eutectic separately considering the service environment in the advanced generation IV nuclear reactors. A duplex structure including an outer Fe2O3 layer and an inner (Fe,Cr,Zr)2O3 layer is developed after oxidation in air, while a three-layered structure consisting of outer magnetite layer, inner Fe-Cr spinel layer, and internal oxidation zone is formed after oxidation in liquid Pb-Bi eutectic. The dispersed Fe2Zr phase shows delayed oxidation with respect to the α-Fe in air and in liquid Pb-Bi eutectic, which significantly affects the oxidation behaviors of the alloy. After oxidation in air at 923 K, the incorporated Fe2Zr phase in the scale would obstruct the diffusion of metal/oxygen across the scale, resulting in the nonuniform oxidation behavior. After oxidation in static oxygen-saturated liquid Pb-Bi eutectic at 823 K, a reduction in the Fe supply to the magnetite/Fe-Cr spinel interface is present adjacent to the Fe2Zr phase, which might lead to the creation of cavities in the outer magnetite layer with prolonged oxidation time.

1. Introduction

Ferritic/martensitic steels with a chromium content of 9~12 wt.% have been considered as candidate structural materials in future advanced nuclear reactors due to their higher resistance to irradiation swelling, lower thermal expansion coefficients, and higher thermal conductivity [1,2,3,4]. Ferritic/martensitic steels are usually characterized by the tempered martensitic structure, consisting of a high density of tangled dislocations within laths and dispersion of carbides along their boundaries and within their matrix. During the long-term exposure at temperature above 823 K, reduction in the dislocation density and coarsening of carbide would lead to the recovery of martensitic structure and a significant reduction in creep strength [5,6,7]. Afterwards, dispersed oxide nano-particles with a high number density are introduced into the ferrite matrix to develop the oxide dispersion strengthened (ODS) steels [8,9,10]. These highly stabilized oxide nano-particles are responsible for the excellent tensile strength and creep properties at 923~1173 K. The ODS steels are produced by much more complicated and expensive powder-metallurgy techniques.
Moreover, intermetallic precipitates are potentially considered as the strengthening phase during the design of high-temperature ferritic alloys. K. Yamamoto et al. reported the Fe-Cr-Nb ferritic heat-resistant alloy strengthened by the Fe2Nb Laves phase, and found that the presence of Fe2Nb phase could significantly improve the high-temperature strength [11]. D.G. Morris et al. reported a Fe-Al-Zr ferritic alloy with coherent Fe3Zr phase, and Fe3Zr phase with excellent stability contributed to the great improvement in creep strength at 973 K [12,13]. Thermodynamic modeling of Fe-Cr-Zr system through the Calphad approach found that Fe-Zr Laves phase could form in the ferritic Fe-Cr-Zr system [14]. Our recent investigation found that dispersed Fe2Zr phase were introduced into equiaxed α-Fe matrix in the Fe-9Cr-2W alloy with the Zr content of 7~10 wt.%, and enhanced creep-rupture properties was achieved up to 973 K in comparison with the typical 9Cr2WVTa ferritic/martensitic steel [15]. L. Tan et al. found that only a small amount of radiation-induced precipitates was observed in Fe-9Cr-1W-11Zr alloy after Fe ion irradiation to ~50 dpa at 673 K, demonstrating promising radiation resistance [16,17]. It was found that the Fe-Cr-Zr alloy presented better high-temperature creep properties and superior radiation resistance in comparison with the ferritic/martensitic steel. In addition, corrosion is a life-limiting property when the alloy is exposed to the service environment. Liquid metal are the primary coolants for the advanced generation IV nuclear reactors. For instance, liquid Pb-Bi eutectic are the coolant for the advanced lead fast reactors. The liquid Pb-Bi eutectic is very corrosive towards the structural material [18,19,20,21,22,23,24]. Therefore, the corrosion properties in contact with liquid Pb-Bi eutectic should be considered. Until now, the corrosion properties of ferritic alloy with the dispersed intermetallic phase have not been clearly understood. In this study, the high-temperature oxidation resistance of Fe-Cr-Zr alloy in air and in static liquid Pb-Bi eutectic were investigated in view of the service environment in the advanced generation IV nuclear reactors.

2. Materials and Methods

2.1. Materials

A Fe-Cr-Zr alloy with a weight of 10 kg is produced by vacuum induction melting technique, and the chemical composition is given in Table 1. The ingot is hot forged and then hot rolled to ~12 mm thick plate. The plate is annealed at 1373 K for 15 min followed by air cooling.

2.2. Oxidation Tests in Air and in Liquid Pb-Bi Eutectic

Samples with dimensions of 8 mm × 8 mm × 8 mm are ground with SiC abrasive papers up to 2000 grit, mechanically polished with 0.5 μm diamond powder, and ultrasonically cleaned by ethanol prior to oxidation tests. The oxidation behaviors in air are evaluated by continuous isothermal oxidation tests, which are conducted at 923 K for different durations up to 1000 h in a furnace with stagnant air. The weight measurement for evaluating the oxidation rate is performed by using a Sartorius BP211D electric balance (Sartorius, Goettingen, Germany) with an accuracy of 0.01 mg.
Furthermore, the oxidation behaviors in liquid metal are evaluated by the isothermal oxidation tests in oxygen-saturated stagnant liquid Pb-Bi eutectic at 823 K using a self-developed liquid Pb-Bi eutectic corrosion test apparatus [19,20]. Ar + 5% O2 serves as the cover gas to ensure the oxygen-saturated condition and avoid excessive oxidation of the liquid Pb-Bi eutectic. The presence of thin PbO on the liquid metal surface indicated that liquid Pb-Bi eutectic is oxygen-saturated. The samples are taken out after immersion in the oxygen-saturated Pb-Bi eutectic for 500 h, 1000 h, and 2000 h, respectively.

2.3. Characterization

The phase structure of the Fe-Cr-Zr alloy is identified using x-ray diffraction (XRD, Rigaku D/max-2400PC, Rigaku, Tokyo, Japan) with Cu Kα radiation source. Microstructure of Fe-Cr-Zr alloy is characterized by FEI Inspect F50 scanning electron microscope (SEM) (FEI company, Oregon, America) and JEOL JEM-2100F transmission electron microscopy (TEM) (JEOL, Tokyo, Japan).
After oxidation tests in stagnant air and in oxygen-saturated stagnant liquid Pb-Bi eutectic, phase structure of oxide scale is identified using XRD. The surface and cross-sectional morphologies of oxide scales are observed by SEM, and chemical compositions are analyzed by energy-dispersive X-ray spectrometer (EDS) (Oxford Instruments, Oxford, UK). The element distribution analysis is conducted by Shimadzu EPMA-1610 electron probe microanalysis (EPMA) (Shimadzu, Kyoto, Japan). For preparing the cross-sectional samples after oxidation tests in stagnant air, the sample surface is protected by electroless Ni plating. The residual Pb-Bi eutectic on the surface of sample is retained after oxidation tests in oxygen-saturated stagnant liquid Pb-Bi eutectic to protect the oxide scale during the sample preparation process.

3. Results

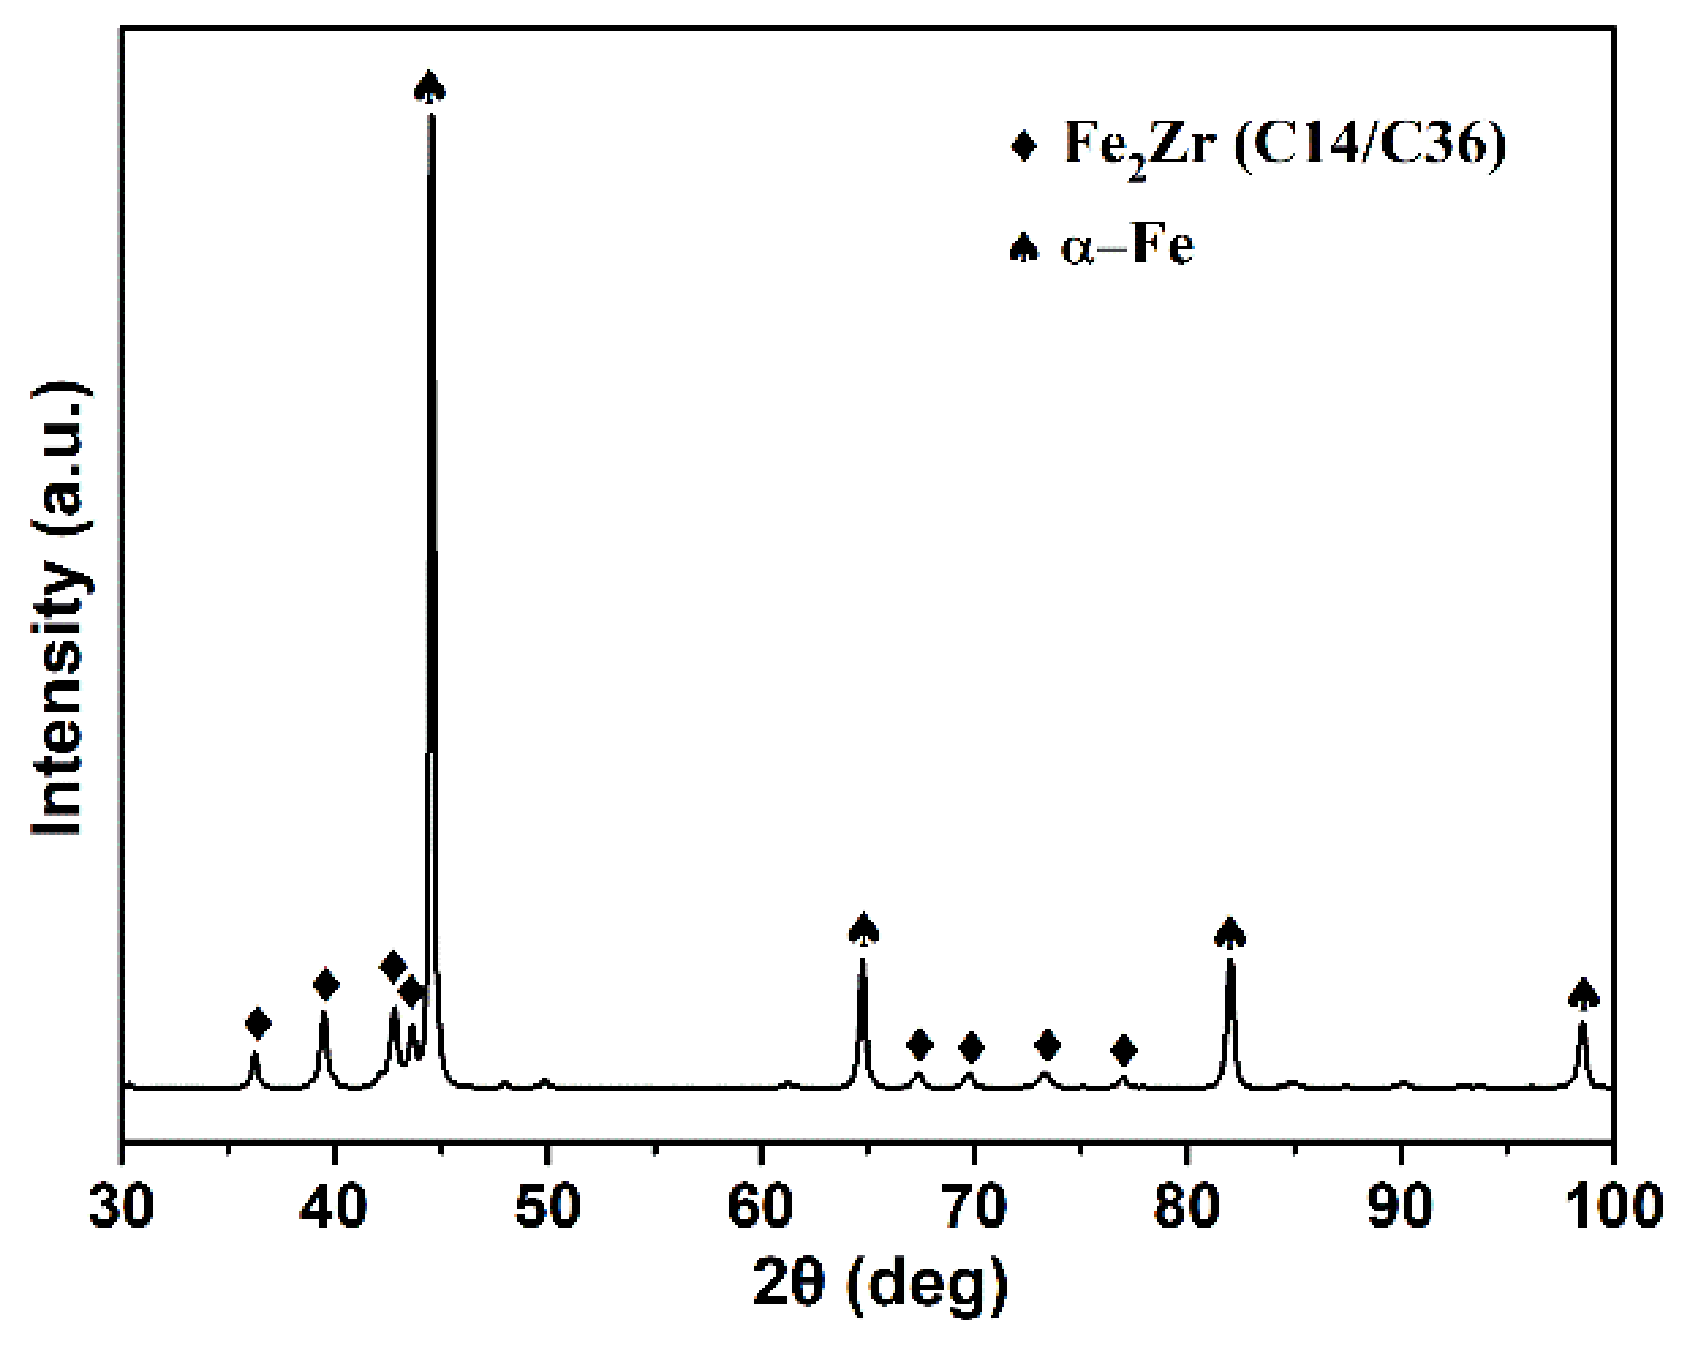
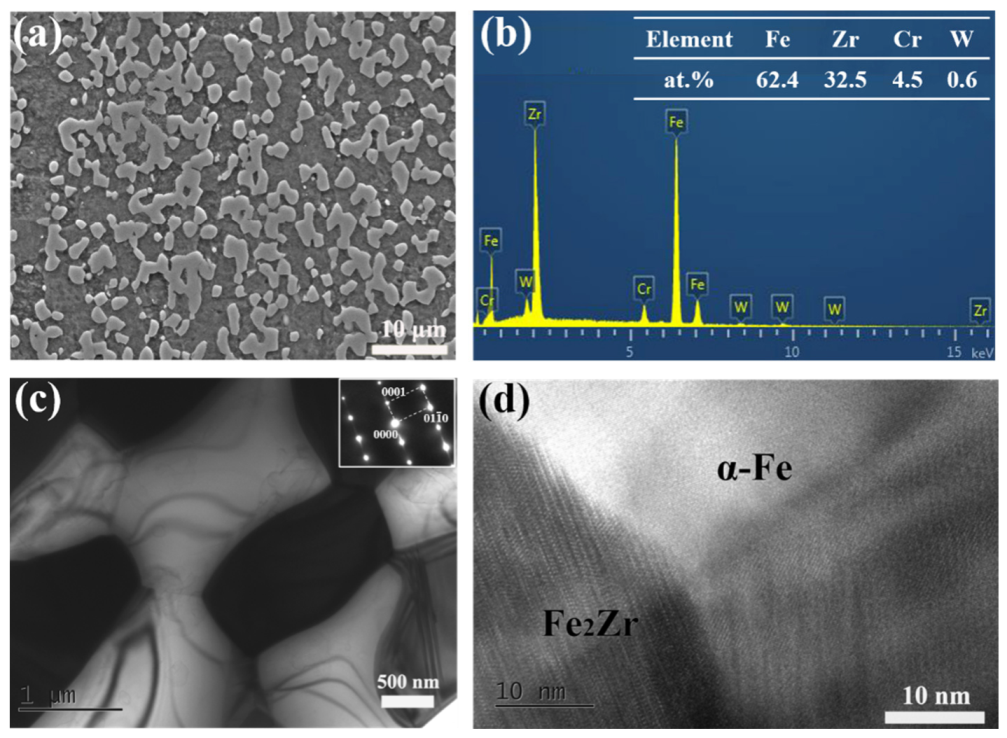
3.1. Microstructure of Fe-Cr-Zr Alloy

Figure 1 shows the XRD pattern of Fe-Cr-Zr alloy. The peak of Fe2Zr phase with the hexagonal polymorphs (C14/C36) could be observed besides the sharp diffraction peaks of α-Fe. It is confirmed that the microstructure of Fe-Cr-Zr alloy mainly compromises α-Fe and Fe2Zr phase.
As shown in Figure 2a, the SEM image reveals that the micrometer-sized Fe2Zr phases are nearly uniformly distributed in the α-Fe matrix, and the area fraction of Fe2Zr phases is ~9.5%. EDS point analysis shows that Fe2Zr phases are composed primarily of Fe and Zr, and low contents of Cr and W are present at the phase (Figure 2b). Figure 2c shows the bright-field TEM micrograph and corresponding selected area electron diffraction (SAED) pattern. The TEM micrograph shows the coexistence of light α-Fe and dark Fe2Zr phases, and the α-Fe and Fe2Zr phases are both in the micrometer-sized range. The SAED pattern (inset in Figure 2c) of Fe2Zr phases confirms the Laves structure. The high-resolution electron microscopy (HRTEM) image of α-Fe/Fe2Zr clearly shows that their interface is incoherent (Figure 2d).

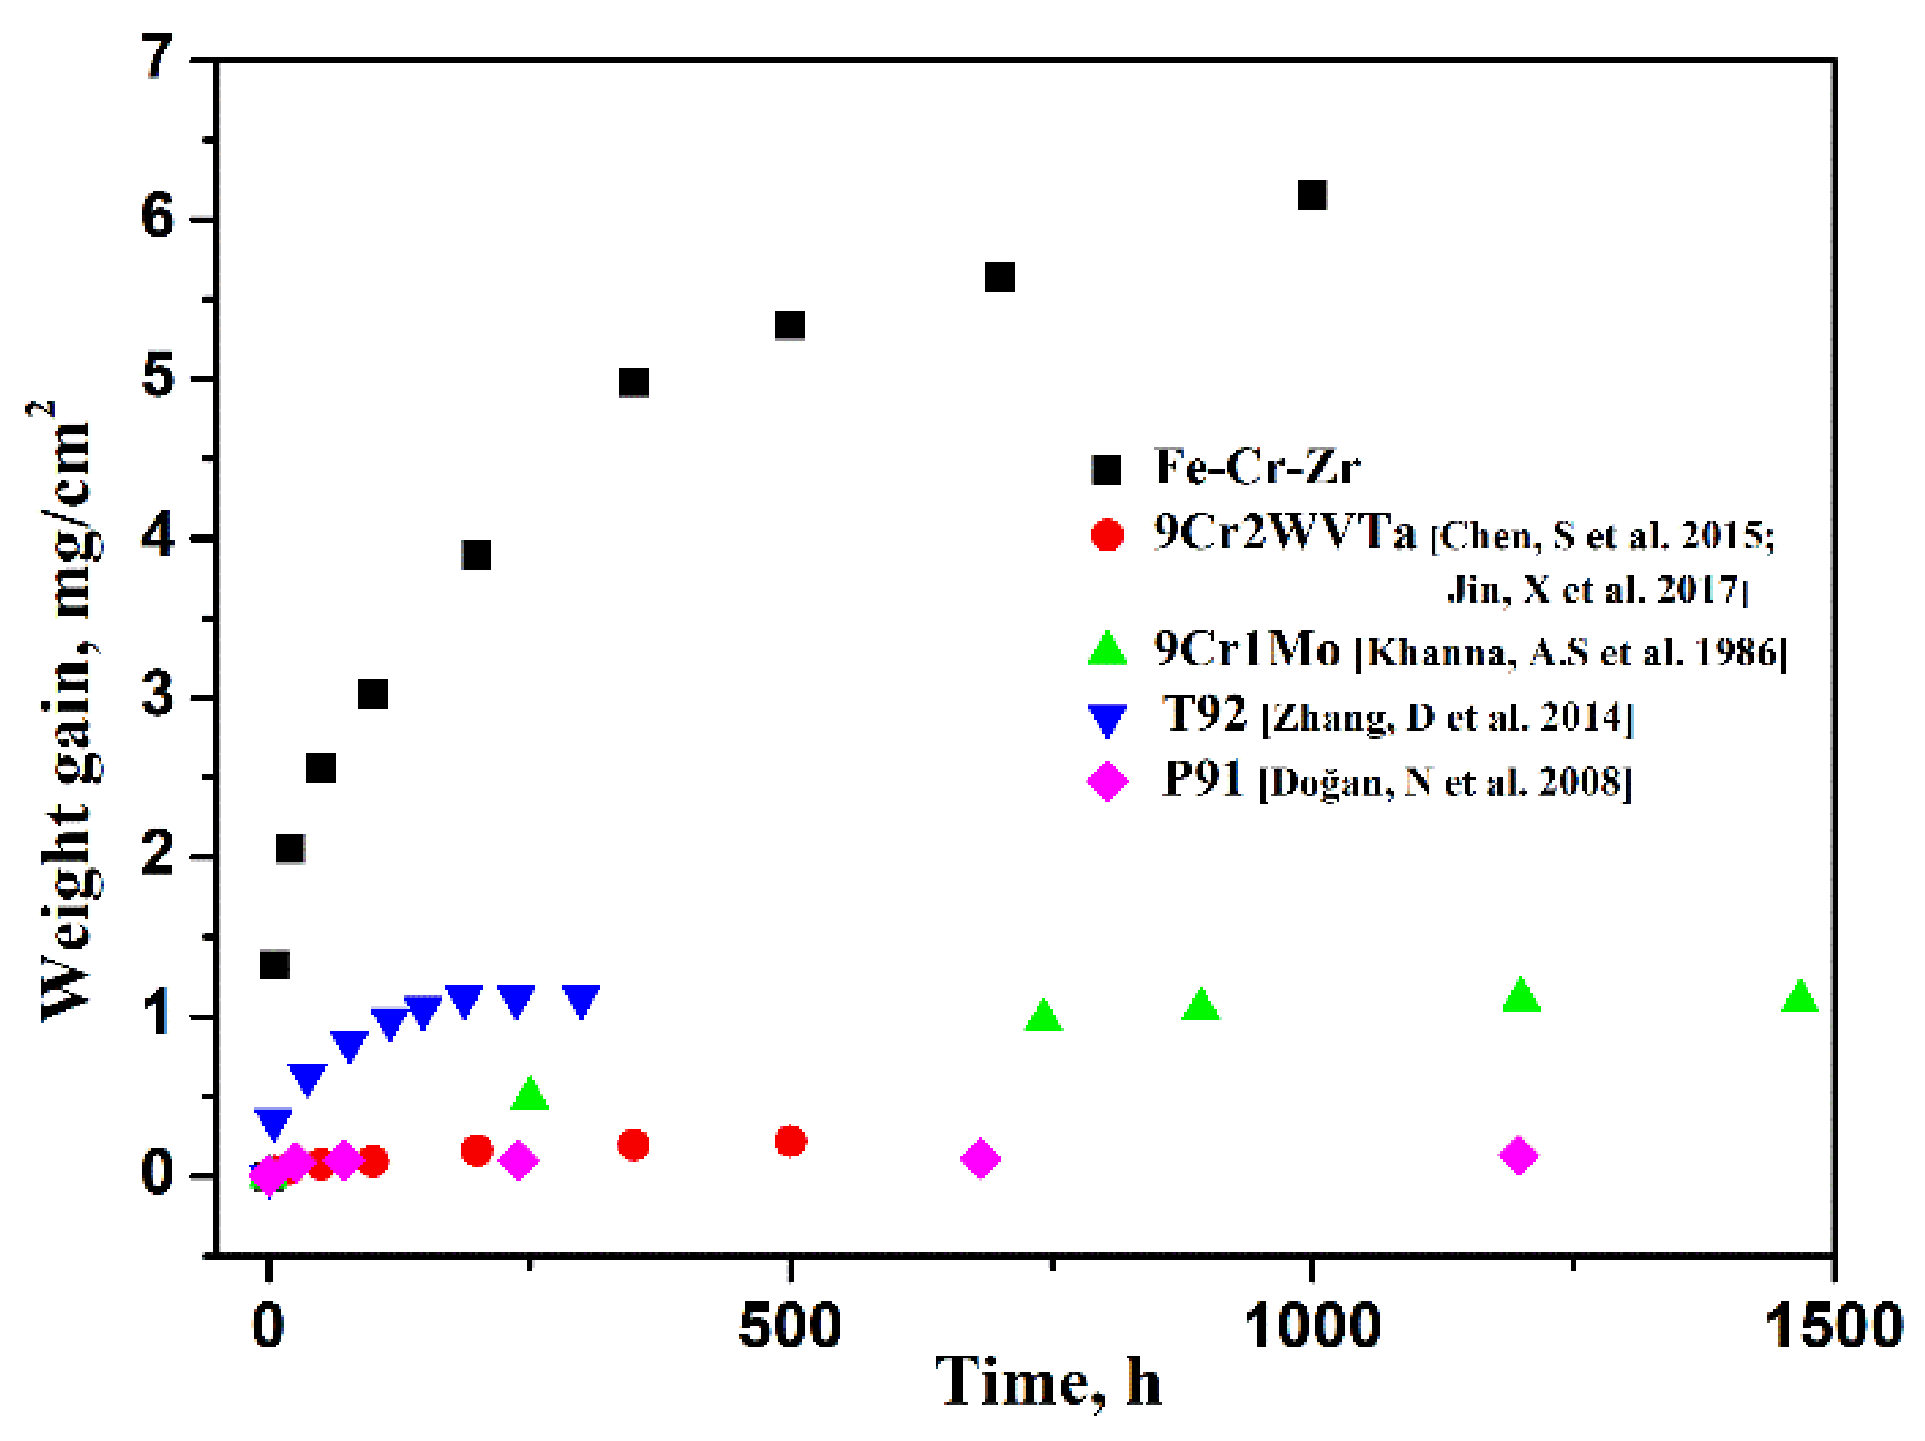
3.2. Oxidation Behavior in Air

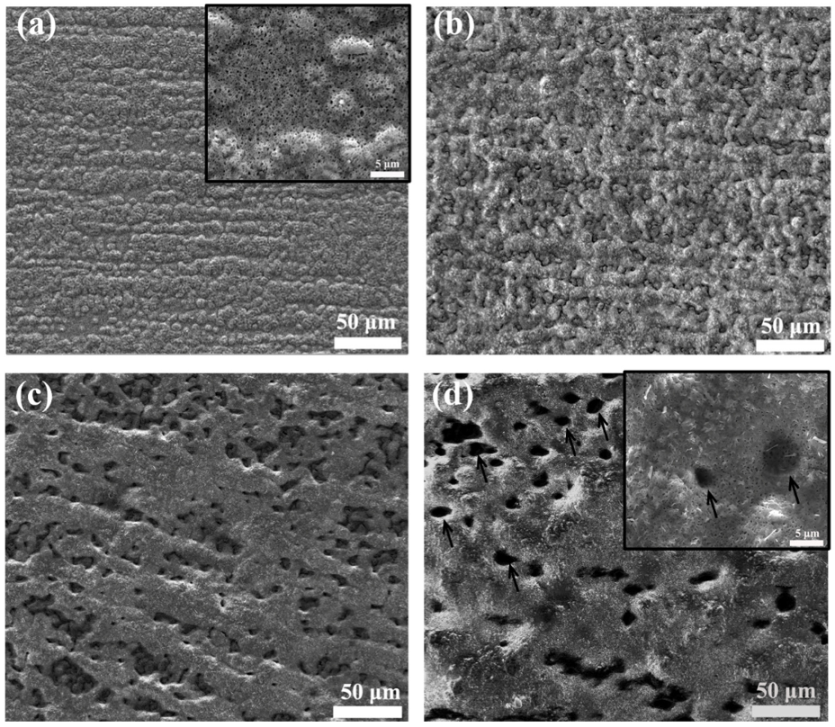
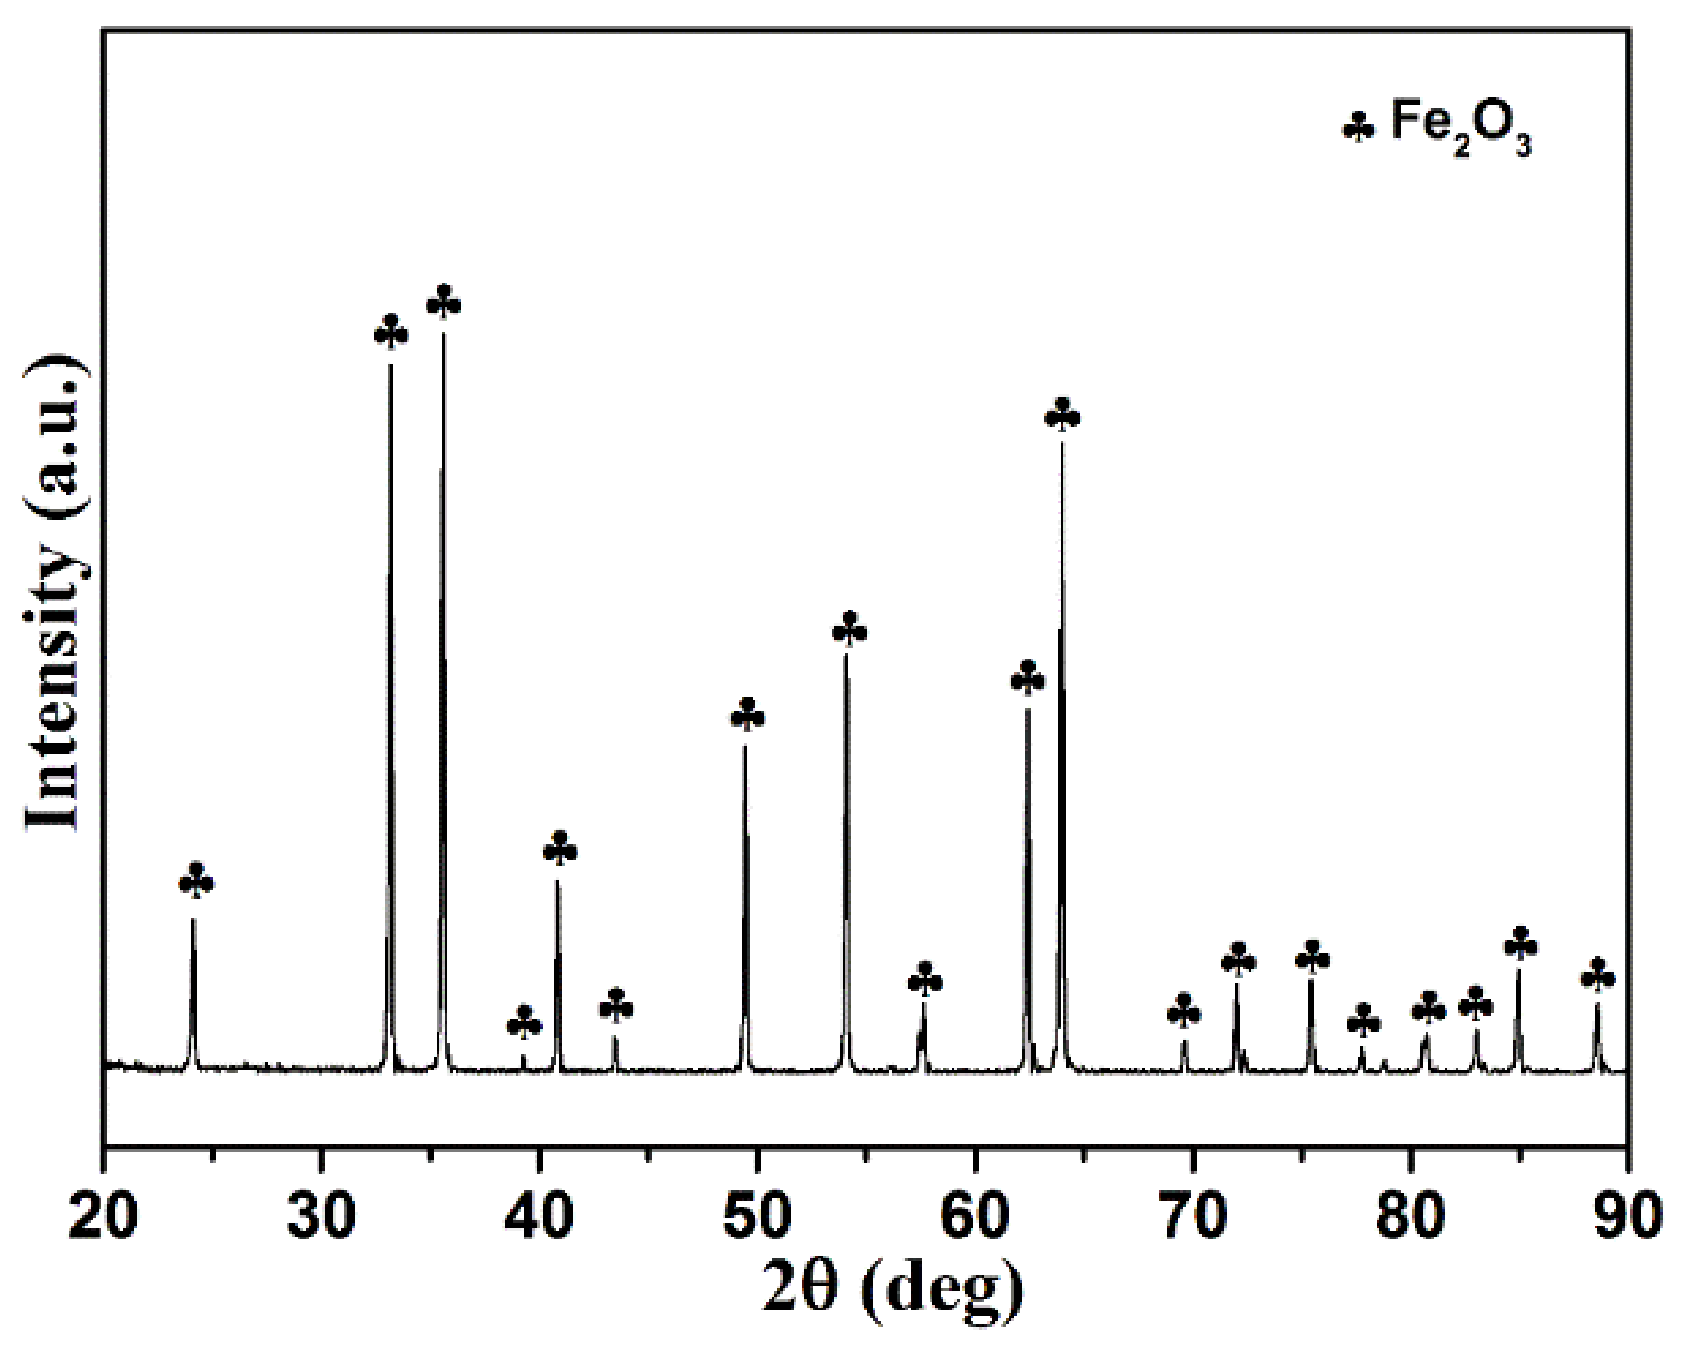
3.2.1. Structure and Morphology of Oxide Scale

Figure 3 shows the SEM surface morphologies of Fe-Cr-Zr alloy after oxidation at 923 K for 10 min, 20 h, 500 h, and 1000 h, respectively. It is found that at the initial oxidation stage within 10 min, numerous oxide particles are distributed on the metal surface. However, an uneven oxide surface is formed (Figure 3a and inset), which is indicative of a nonuniform oxidation process. As the oxidation time is prolonged, the surface flatness of oxide scale is aggravated (Figure 3b–d). After oxidation of 1000 h, a number of pits could be found on the surface due to the nonuniform growth of oxide (arrows in Figure 3d and inset). The structure of oxide scale was identified by XRD after oxidation at 923 K for 1000 h, as shown in Figure 4. Single (Fe,Cr)2O3 phase is detected in the oxide scale, which indicates that Cr2O3 could not form in the Fe-Cr-Zr alloy with a Cr content of ~9 wt.%.

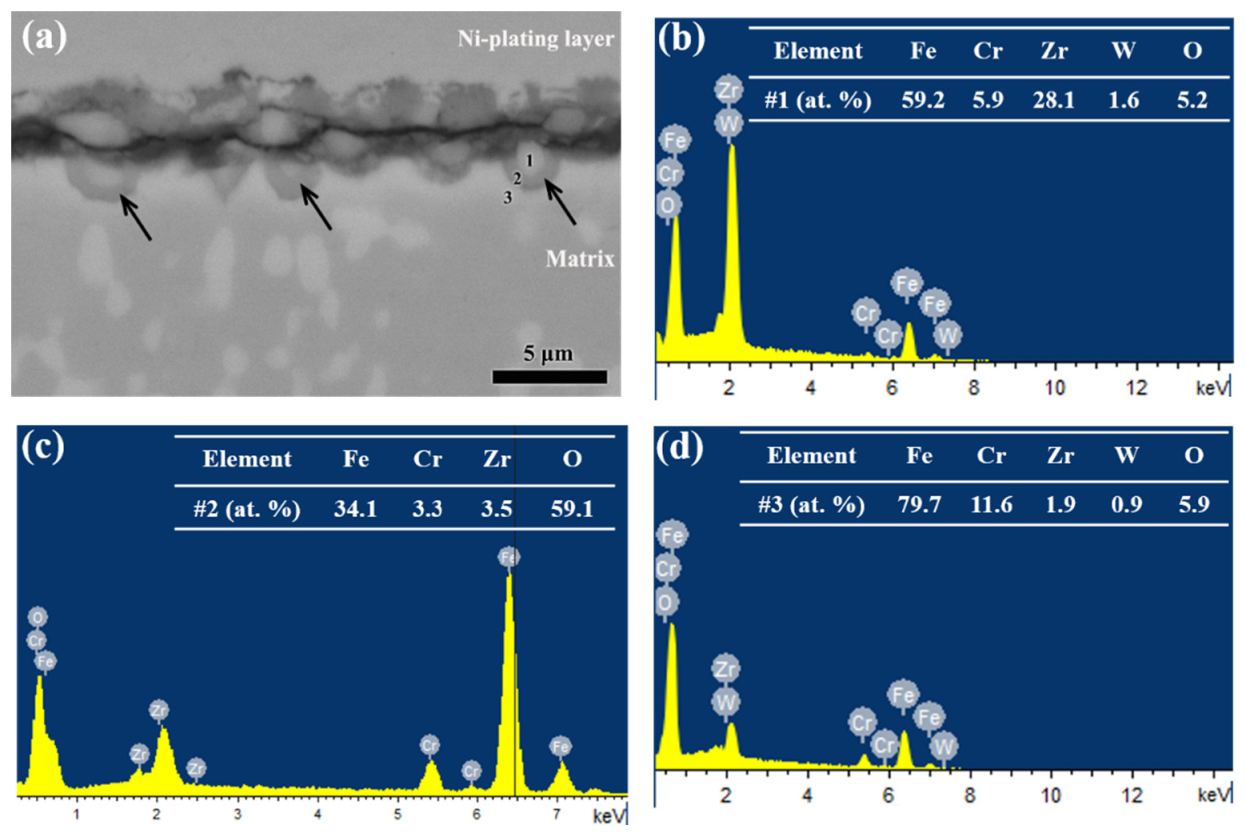
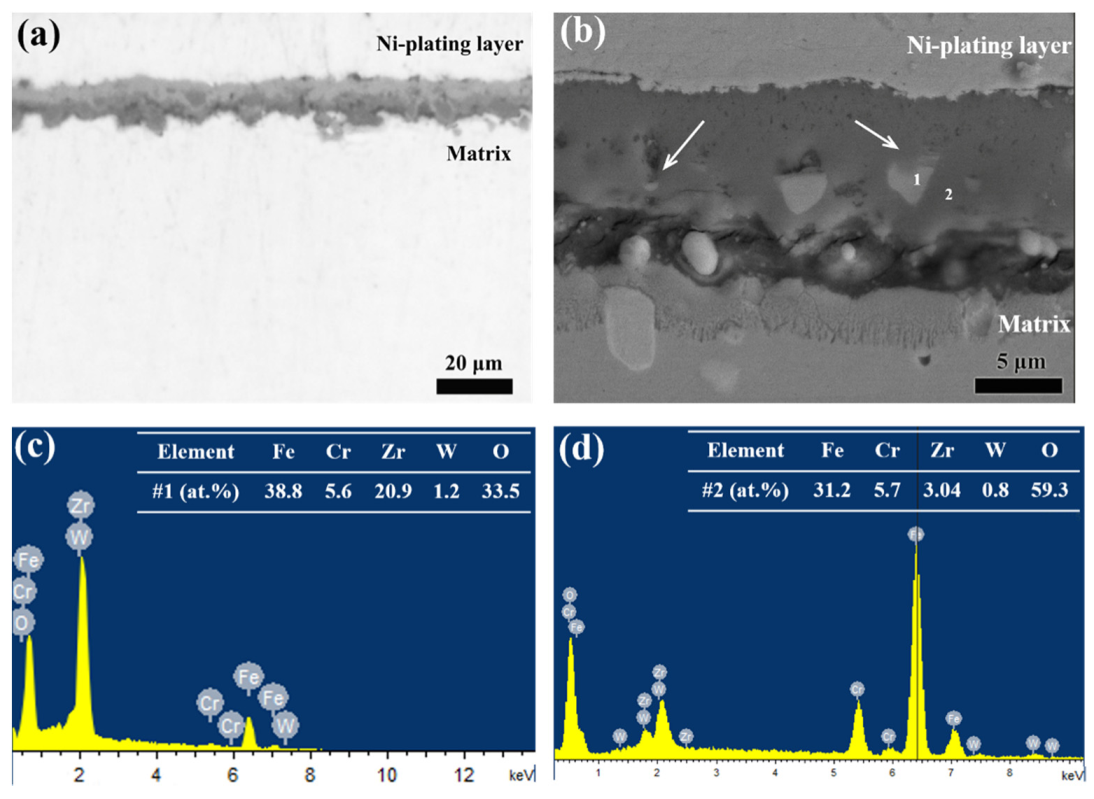
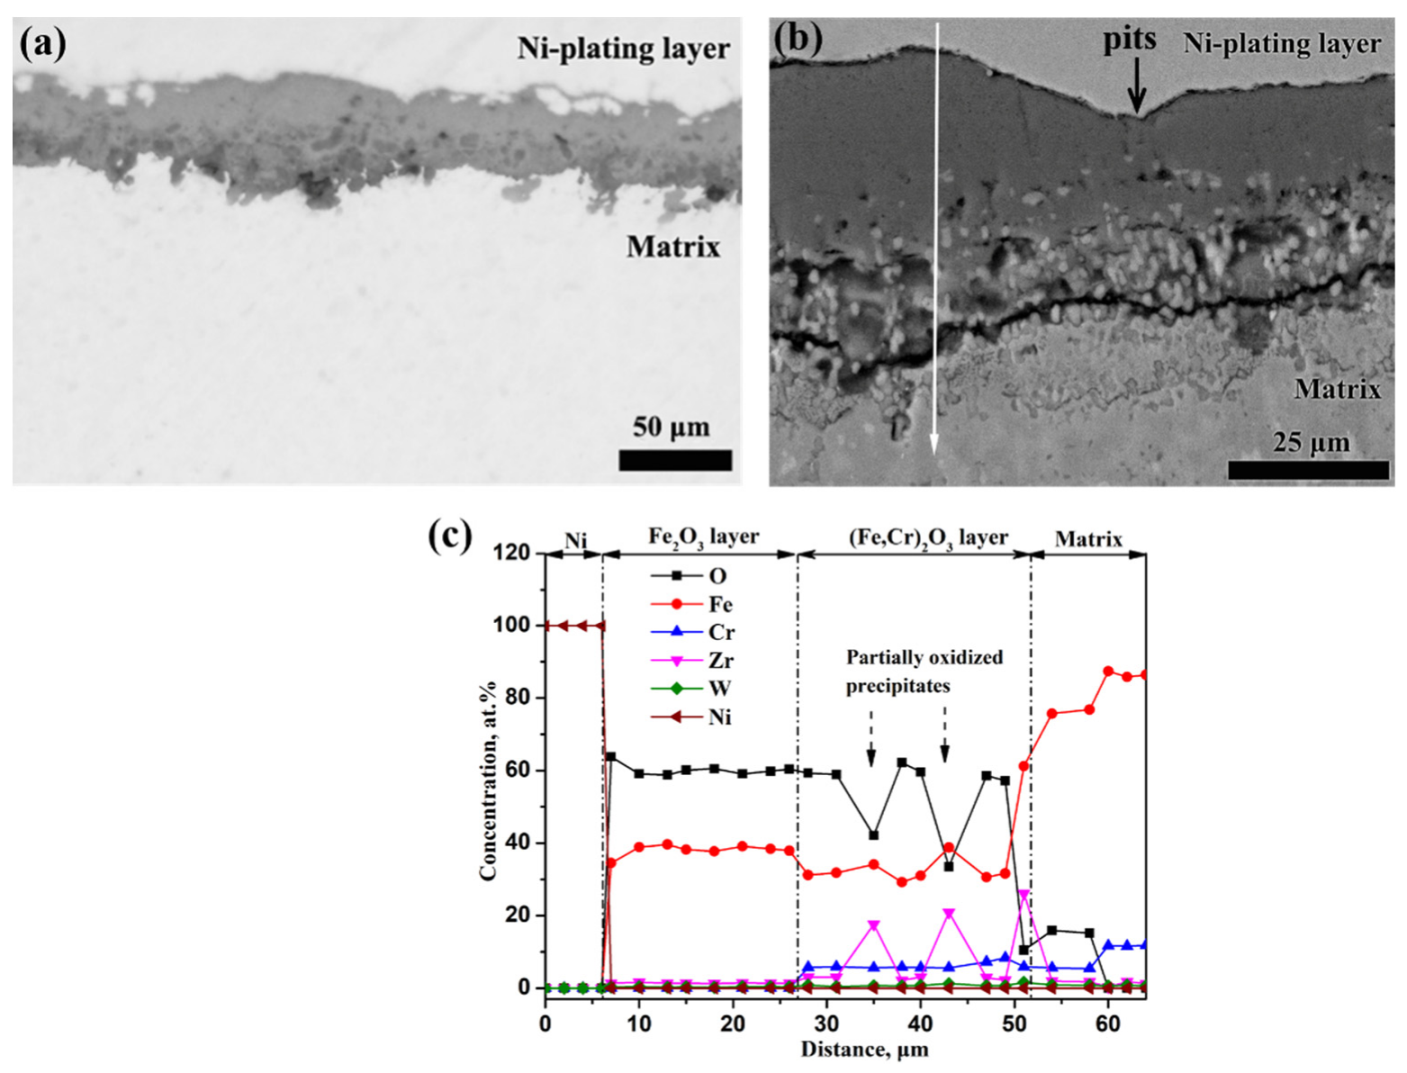
3.2.2. Cross-Sectional Morphology

Figure 5a shows a backscattered detector (BSE) image of the cross-sectional morphologies of oxide scale formed on Fe-Cr-Zr alloy after oxidation at 923 K for 10 min. The matrix/scale interface appears to roughen, and incorporated Fe2Zr phase could be found at the oxidation front due to their white contrast compared to the oxide scale (black arrows in Figure 5a). EDS point analysis in the vicinity of the incorporated Fe2Zr phase reveal that ~5.2 at.% of O is detected at the incorporated phase (Figure 5b), and concentrations of Fe, Zr, and Cr of the incorporated phase are similar to the composition of Fe2Zr phase obtained in the matrix (Figure 2b). In contrast, a much higher concentration of O (~59.1 at.%) is detected in the gray scale around the incorporated phase, and the atomic percent is consistent with the stoichiometric ratio of (Fe,Cr,Zr)2O3 oxide (Figure 5c). Besides, a low concentration of O (~5.9 at.%) is present in the α-Fe adjacent to the gray scale (Figure 5d). Therefore, the incorporated Fe2Zr phase in the oxide scale close to the matrix/scale interface exhibits delayed oxidation.
After oxidation for 20 h, the average thickness of the oxide scale is ~10 μm, and the incorporation of dark phase in the inner part of white scale could be observed by optical microscope (OM) (Figure 6a). BSE image shows that Fe2Zr phase are observed in the inner part of oxide scale and some of the phase in the scale are much smaller than those in the matrix (arrows in Figure 6b), which might be resulted from the gradual oxidation of Fe2Zr phase. EDS point analysis at the Fe2Zr phase sites in the scale reveals that the ratio of Fe to Zr corresponds to about 2 while the measured oxygen concentration is ~33.5 at.% (Figure 6c), indicating that the Fe2Zr phase are oxidized. By contrast, the oxide scale surrounding the Fe2Zr phase having an oxygen concentration of 59.3 at.% (Figure 6d), is found to be fully oxidized into (Fe,Cr,Zr)2O3. Therefore, it is concluded that the incorporated Fe2Zr phase in the oxide scale exhibit too low oxygen concentration to be fully oxidized.
OM image of the cross-sectional morphologies of scale after oxidation of 1000 h is shown in Figure 7a. A roughened surface is observed, which is corresponding to the uneven oxide surface morphology (Figure 3d). The incorporated dark phases are also observed in the inner part of the white scale. The BSE image reveals the presence of Fe2Zr phase in the inner part of oxide scale, and a significant decrease in number density of incorporated phase is observed from the oxide/matrix interface to the outer surface, as shown in Figure 7b. The compositional profiles by EDS point analysis show that the oxide scale has a duplex-layered structure (Figure 7c). The outer layer, with a thickness of ~20 μm, consists mainly of the 40Fe-60O (at.%), which is in line with the stoichiometry of Fe2O3. The inner layer, with a thickness of ~25 μm, consists mainly of the 30Fe-6Cr-3Zr-1W-60O (at.%), which is in line with the stoichiometry of (Fe,Cr,Zr)2O3. Within the inner layer, particles with higher concentration of Zr (20~26 at.%) and lower concentration of O (10~40 at.%) are the delayed oxidized Fe2Zr phase. In addition, the concave surface (arrows in Figure 7b) is in accordance with the pits on the oxide surface morphologies (arrows in Figure 3d). It is shown that the density of incorporated Fe2Zr phase is higher in the oxide scale beneath the concave surface than that beneath the convex surface (Figure 7b), which is reminiscent of the fact that the inhomogeneous cross-sectional morphology is related with the number density of the Fe2Zr phase.

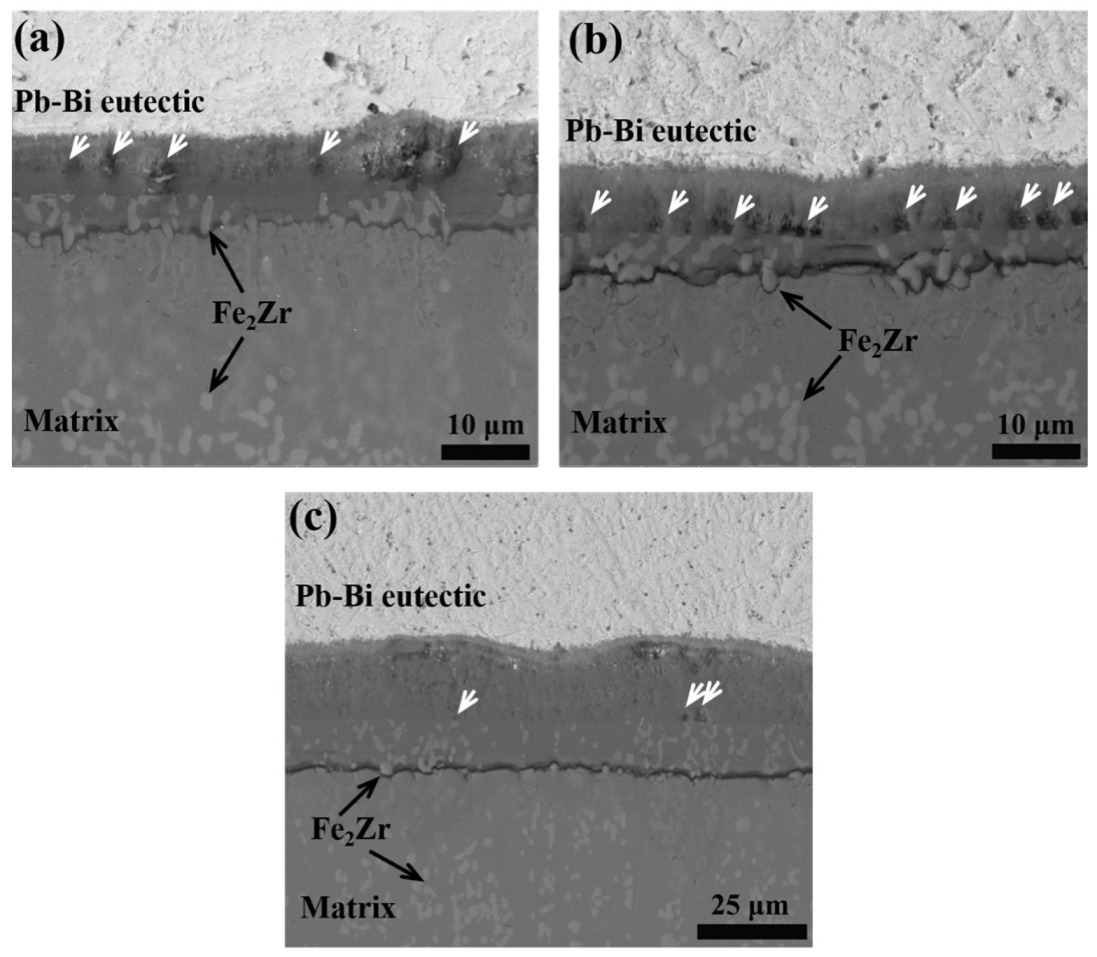
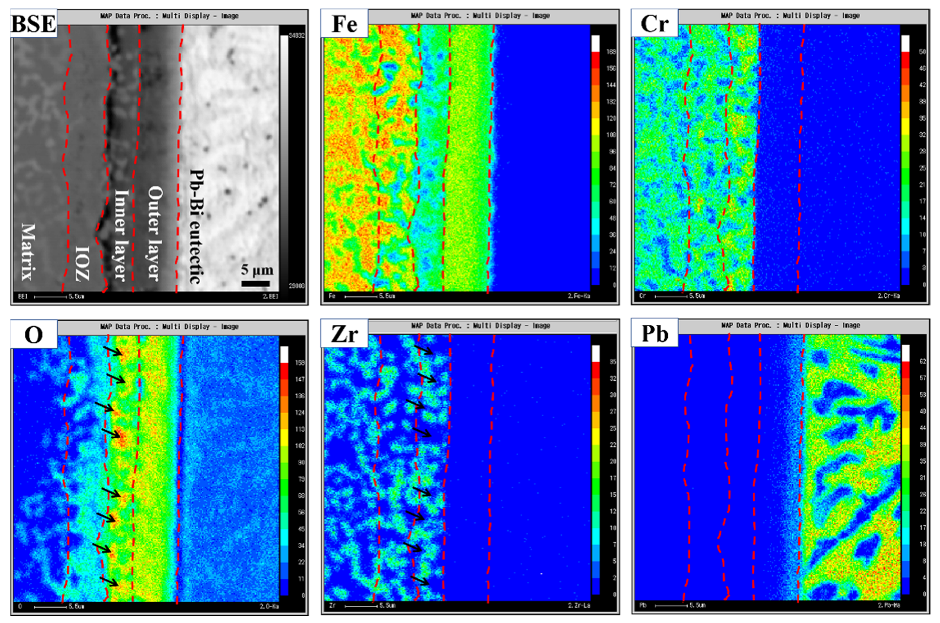
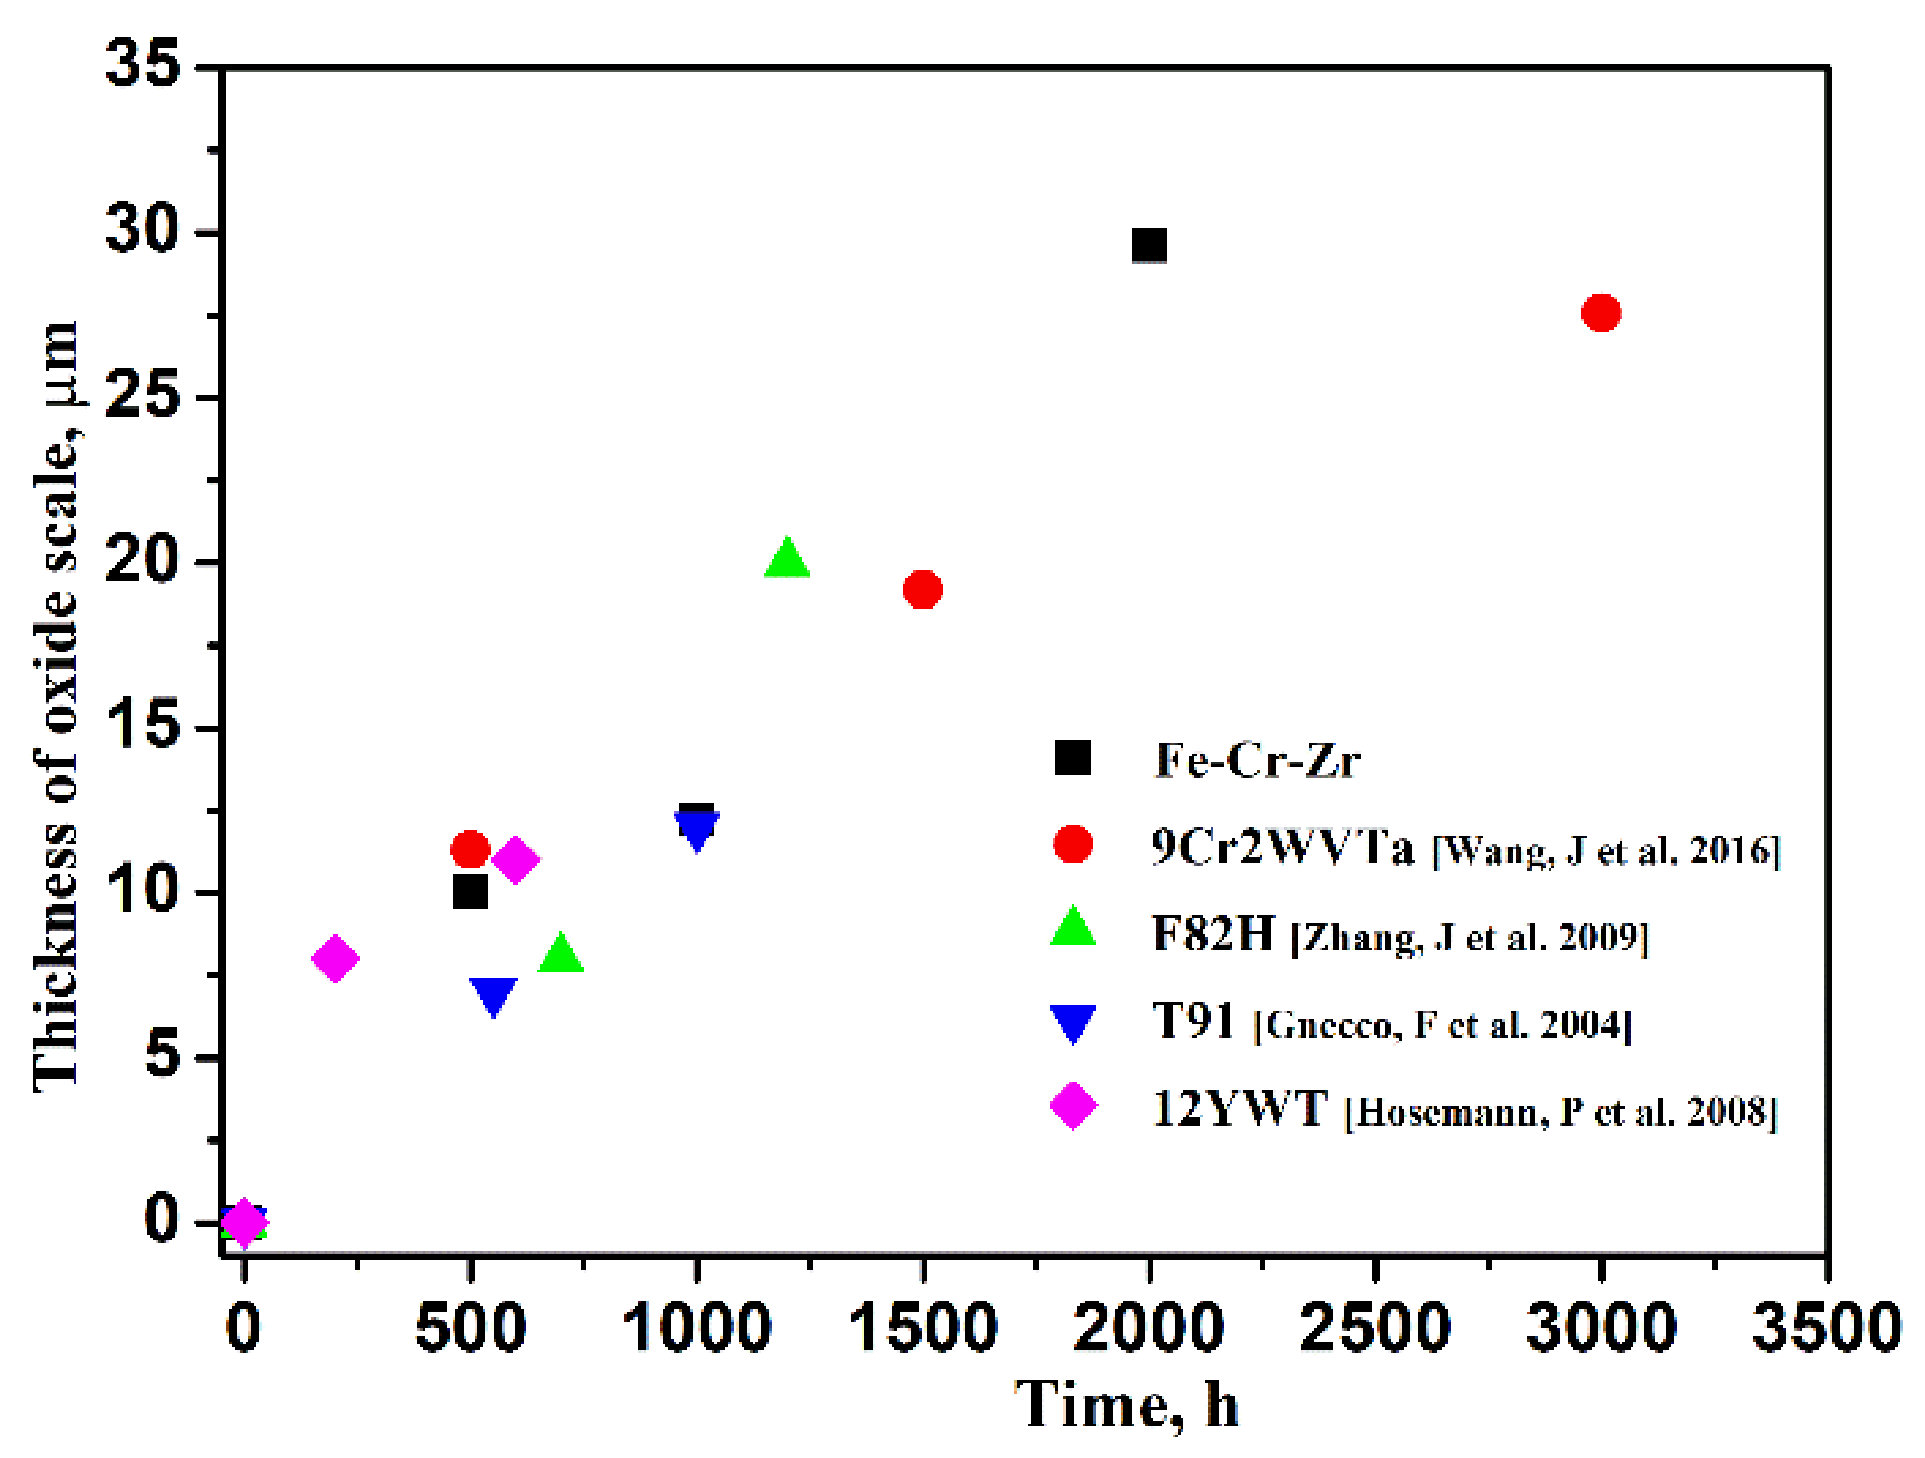
3.3. Oxidation Behavior in Stagnant Liquid Pb-Bi Eutectic

Figure 8 shows the BSE cross-sectional image of oxide scale formed on Fe-Cr-Zr alloy after exposure to oxygen-saturated Pb-Bi eutectic at 823 K for 500 h, 1000 h, and 2000 h, respectively. As the exposure time increases from 500 h to 2000 h, the thickness of oxide scale increases from ~10 μm to ~30 μm. The outer layer of the oxide scale seems porous. In comparison, the inner layer of the oxide scale seems compact, and the incorporation of Fe2Zr phase in the inner layer is also observed. It could be found that the cavities are mainly present at the inner/outer layer interface of oxide scale and formed adjacent to the incorporated Fe2Zr phase (white arrows in Figure 8), which implies cavity nucleation around the Fe2Zr phase.
EPMA analysis of the oxide scale after exposure to oxygen-saturated Pb-Bi eutectic at 823 K for 1000 h is shown in Figure 9. In the matrix, the Fe-rich α-Fe and Zr-rich Fe2Zr phase could be clearly identified. The oxide scale formed on the Fe-Cr-Zr alloy exhibits a three-layered structure. An enrichment of Fe and O is observed in the outer oxide layer while Cr and Zr could not be detected in this layer, revealing that the outward diffusion of Fe from matrix to the external interface. The outer layer composed of the iron oxide is identified as magnetite (Fe3O4) according to the SEM/EDS [19], XRD [21] and glow discharge optical emission spectroscopy (GD-OES) [22]. The penetration of Pb/Bi into the formed magnetite layer could also be observed. In comparison with the outer oxide layer, the inner oxide layer is a Fe-Cr spinel which is enriched by Cr and depleted in Fe. An inhomogeneous distribution of O is present in the inner oxide layer, and the region with higher concentration of O is found exactly to be at the α-Fe site (black arrows in Figure 9). The lower concentration of O at the Fe2Zr phase site may be resulted from the delayed oxidation of the phase. The ratio of outer magnetite layer thickness on the inner Fe-Cr spinel layer thickness is ~1.2, which is in agreement with the oxidation results of ferritic/martensitic steels in liquid Pb-Bi eutectic [22,23,24]. An internal oxidation zone (IOZ) with a significant decreased concentration of O develops between the matrix and inner oxide scale, and a relative homogeneous distribution of O exists in the vicinity of the inner oxide layer/IOZ interface.

4. Discussion

4.1. Oxidation Behavior of Fe2Zr Phase

The oxidation behaviors of the Fe-Cr-Zr alloy reveal the delayed oxidation of the Fe2Zr phase with respect to the α-Fe matrix. The incorporated Fe2Zr phase with low oxygen concentration could be observed in the oxide scale close to the matrix/scale interface (Figure 5). With increased oxidation time, the incorporated Fe2Zr phase with increased oxygen concentration in the scale indicates the gradual oxidation of Fe2Zr phase. It is shown that iron oxide in the form of Fe2O3 is determined by EDS and XRD during oxidation in air at 923 K, and Zr is reported to be oxidized to ZrO2 [25]. The oxidation reaction of the Fe2Zr phase could be written as follows:
Fe2Zr (s) + 5/2O2 (g) = Fe2O3 (s) + ZrO2 (s)
It is concluded that the oxygen concentration should be between 60 and 66 at.% at the fully oxidized Fe2Zr phase site. It is assumed that the lower measured oxygen concentration at the incorporated Fe2Zr phase site is caused by the partially oxidized Fe2Zr phase. An approximate fraction of oxidized Fe2Zr phase can be calculated according to the quantitative EDS results at the incorporated Fe2Zr phase sites considering that the ratio of Fe to Zr is close to 2 at these sites (Figure 6c). This calculation is made assuming that each analysis point inside the incorporated Fe2Zr phase consists of oxidized Fe2Zr and metallic Fe2Zr. According to the hypotheses, compositions of the incorporated Fe2Zr phase can be calculated by using the following relations:
xFe = 2xoxidized + 2xmetallic
xZr = xoxidized + xmetallic
xO = 5xoxidized
The resolution of Equations (2)–(4) leads to:
xoxidized/(xoxidized + xmetallic) = 0.2(xO/xZr) = 0.4(xO/xFe)
For each analysis point inside the incorporated Fe2Zr phase, the ratio of O to Fe or O to Zr could be obtained by EDS. As a consequence, the mole fraction of oxidized Fe2Zr at the incorporated Fe2Zr phase sites can be determined by the Equation (5). For the incorporated Fe2Zr phase (marked position #1 in Figure 5a) in the oxide scale close to the matrix/scale interface after oxidation of 10 min, the calculated mole fraction of oxidized Fe2Zr phase is ~4%. For the incorporated Fe2Zr phase (marked position #1 in Figure 6b) in the scale after oxidation of 2 h, the calculated mole fraction of oxidized Fe2Zr phase reaches ~34.5%.
Based on the oxidation reaction of Fe2Zr (1), standard Gibbs free energy change of the oxidation of metallic Fe2Zr phase to oxides could be calculated as
ox(Fe2Zr) = −744268 + 175.8T J/mol
where the standard Gibbs free energy changes of the formation of Fe2O3 and ZrO2 are obtained from the Ellingham/Richardson diagram [26,27] and the standard Gibbs free energy changes of the Fe2Zr formation from the constituting elements (2Fe + Zr = Fe2Zr) is given as ∆ = −30400 + 12.7T J/mol [28]. At 923 K, ∆ox(Fe2Zr) = −582004 J/mol, and the calculated equilibrium oxygen partial pressure value of pO2 is 1.2 × 10⁻³³ atm. For the alloy matrix with the chemical composition of 86Fe-12Cr-2Zr (at.%), the calculated equilibrium oxygen partial pressure value of pO2 for the oxidation of Cr solute and Zr solute is 5.2 × 10⁻³⁴ atm and 2.6 × 10−51 atm, assuming that Cr and Zr solutes would oxidize to their respective oxides. The maximum value of pO2 available to a dilute Fe-Cr alloy could be set by Fe-Fe2O3 equilibrium because a scale forms on the alloy surface. Accordingly, the maximum value of pO2 available is 1.3 × 10⁻²² atm at 923 K. It is demonstrated that oxidation of metallic Fe2Zr phase and alloy matrix at 923 K in stagnant air is thermodynamically favorable as evidenced by the initial oxidation behavior (Figure 5). As the oxidation process continues, the oxide scale formed around the Fe2Zr phase would prevent the inward diffusion of O into the phase, leading to a lower oxygen partial pressure value inside the Fe2Zr phase. Once the value of pO2 is lower than 1.2 × 10⁻³³ atm inside the Fe2Zr phase, there would be delayed oxidation of the Fe2Zr phase with respect to the alloy matrix (Figure 6).
Oxidation results of Fe-Cr-Zr alloy in air and liquid Pb-Bi eutectic also show that the presence of incorporated Fe2Zr phase could significantly affect the oxidation behaviors of the alloy. In order to evaluate the oxidation resistance of the Fe-Cr-Zr alloy, the oxidation behaviors of Fe-Cr-Zr alloy in air and liquid Pb-Bi eutectic are compared with that of ferritic/martensitic steels and ODS steels with the similar Cr content of 9~12 wt.% [29,30,31,32,33,34,35,36]. As shown in Figure 10, the weight gain curves after oxidation at 923 K in air reveal that the weight gain of Fe-Cr-Zr alloy is significantly greater than that of ferritic/martensitic steels, and the obtained parabolic rate constant of Fe-Cr-Zr alloy (~3.8 × 10⁻² mg2 cm−4 h−1) is much higher than that of ferritic/martensitic steels (4.4 × 10⁻³~9.4 × 10⁻⁶ mg2 cm−4 h−1) according to the parabolic kinetic law. However, the thickness of the oxide scale after oxidation in oxygen-saturated liquid Pb-Bi eutectic at 823 K shows that the growth rate of oxide scale thickness of Fe-Cr-Zr alloy is similar to that of ferritic/martensitic steels and ODS steels (Figure 11), demonstrating that the experimental parabolic rate constants of Fe-Cr-Zr alloy, ferritic/martensitic steels and ODS steels are in the range of 1.9 × 10⁻⁷ μm2 h−1 to 4.4 × 10⁻⁷ μm2 h−1 according to the parabolic kinetic law. Therefore, the oxidation mechanism of the Fe-Cr-Zr alloy in air and liquid Pb-Bi eutectic will be discussed separately.

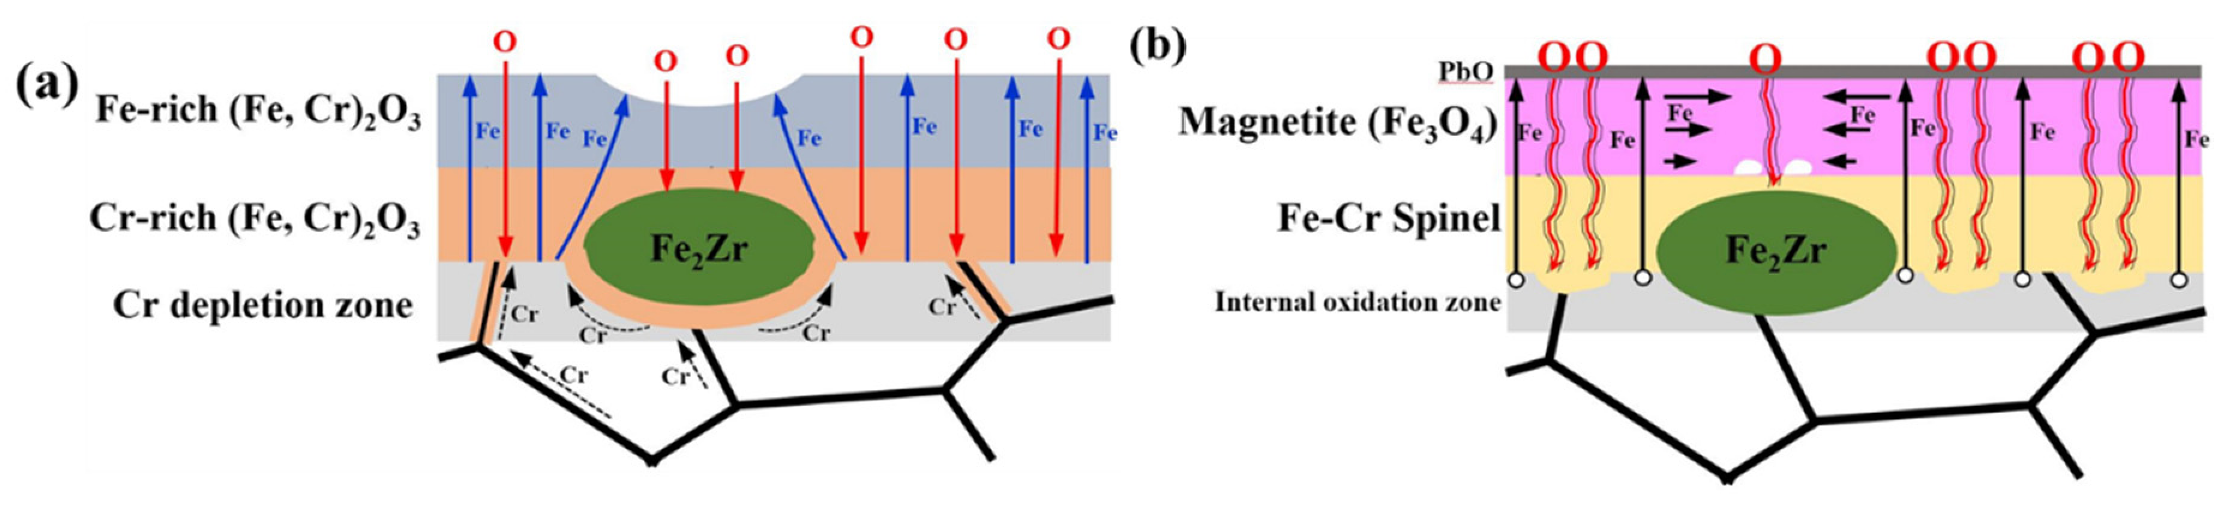
4.2. Oxidation Mechanism in Air

During oxidation in air, oxidation process involves the diffusion of reactants through the oxide scale (i.e., solute is transported through the matrix to the scale/air interface and oxygen is transported to the scale/matrix interface). Generally, diffusion of solutes in the matrix is usually correlated with the bulk diffusion and grain boundary diffusion, and the grain boundary diffusion rate is widely considered to be much larger than the bulk diffusion rate [37,38,39]. For the Fe-Cr-Zr alloy, the presence of incoherent α-Fe/Fe2Zr interface could also affect the diffusion rate of solutes. Investigations on the interface diffusivities along the metal/ceramic interface, metal/SiC interface, and metal/SiN interface have revealed that interfaces were the high-diffusivity paths for metal atoms, which was much faster than the bulk diffusion [40,41]. Therefore, diffusion along the α-Fe/Fe2Zr interface might promote the outward diffusion of solutes.
In the early stage of oxidation, Cr is preferentially oxidized to form Cr2O3 due to its higher affinity to oxygen according to Ellingham/Richardson diagram. However, a continuous Cr2O3 oxide scale could not be formed due to that the low content of Cr (~9 wt.%) in the Fe-Cr-Zr alloy. Fe would also diffuse outward to form Fe2O3 oxide, and thus (Fe,Cr)2O3 oxide scale are generated in the scale. Compositional analysis in the vicinity of the matrix/scale interface reveals that the incorporated Fe2Zr phase in the oxide scale exhibits delayed oxidation with respect to the α-Fe (Figure 5a). With increased oxidation time, Fe/Cr and O continually penetrate through the less compact (Fe,Cr)2O3 scale. The inadequate supply of Cr in the matrix could not replenish the Cr consumed by the scale due to the lower concentration of Cr. As a result, Fe2O3 is formed in the outer oxide layer and (Fe,Cr,Zr)2O3 is present in the inner oxide layer (Figure 7c). The Fe2Zr phases showing delayed oxidation are incorporated in the scale (Figure 7b), and the presence of incorporated phase would obstruct the diffusion of solute/oxygen through the scale. It can be concluded that the oxidation process would be affected by the number density of the incorporated Fe2Zr phase. A higher density of the incorporated Fe2Zr phase could effectively retard the outward diffusion of Fe during oxidation process. Thus, a thinner Fe2O3 layer is formed in the area with higher density of Fe2Zr phase due to the lower external oxidation rate, which is consistent with the concave surface on the cross-sectional morphologies (Figure 7b) and pits on the surface morphologies (Figure 3d). The schematic illustration of oxidation behaviors in air is shown in Figure 12a.
It is shown that the growth rate of oxide scale in Fe-Cr-Zr alloy after oxidation in air is mainly controlled by diffusion of solutes/oxygen through the scale, which is similar to that of ferritic/martensitic steels [29,30]. A large disparity in the oxidation rates between the Fe-Cr-Zr alloy and ferritic/martensitic steels is correlated with their different microstructural features. Firstly, the grain size of Fe-Cr-Zr alloy (in the micrometer-sized range) is much larger than the sub-grain size (in the nanometer-sized range) of ferritic/martensitic steels [7], and as a consequence, higher diffusivity of Cr from matrix could promote the formation of continuous Cr-rich (Fe,Cr)2O3 inner oxide layer via short-circuit diffusion of sub-boundary in ferritic/martensitic steels. Secondly, a higher density of dislocations in the lath martensite of ferritic/martensitic steels could facilitate the bulk diffusion and then accelerate the delivery of solutes into fringes around the grain boundaries, which also promotes the formation of continuous Cr-rich (Fe,Cr)2O3 inner oxide layer. Finally, α-Fe/Fe2Zr interfaces serve as the preferential oxidation sites could promote the internal oxidation, and the incorporated Fe2Zr phase might causes the thermal and growth stress in the oxide scale.

4.3. Oxidation Mechanism in Pb-Bi Eutectic

Oxidation results of Fe-Cr-Zr alloy in oxygen-saturated Pb-Bi eutectic also show that Fe2Zr phase shows delayed oxidation with respect to α-Fe. It is found that the magnetite/Fe-Cr spinel interface is the original alloy/Pb-Bi interface according to the spatial position of Fe2Zr phase in the oxide scale (Figure 8), demonstrating that outward diffusion of Fe until oxide/liquid Pb-Bi interface to form the outer magnetite layer while the inner Fe-Cr spinel layer grows at the scale/matrix interface. Unlike the air oxidation in Section 4.2, inward diffusion of O is not achieved by the diffusion inside the oxide lattice, but the presence of nano-channels caused by the Pb-Bi penetrations (Figure 9) are considered as a fast diffusion path for O in the Pb-Bi eutectic [22,23,24]. The constant ratio (~1.2) of outer magnetite layer thickness on the inner Fe-Cr spinel layer thickness is observed throughout the oxidation process (Figure 8), demonstrating that fast O diffusion paths inside nano-channels do not account for the growth of inner Fe-Cr spinel layer (since it is suggested that the growth rates of outer magnetite layer and inner Fe-Cr spinel layer are directly correlated). It is shown that growth rate of the outer magnetite layer is controlled by the outward diffusion of Fe across the scale by EPMA, and the outward diffusion of Fe would generate vacancies at the scale/matrix interface. The generated vacancies would be accumulated to form nano-cavities at the scale/matrix interface, which is verified by the porous morphology at this interface (Figure 8). The presence of Cr and W with a much slower diffusion rate than Fe could impede the vacancies annihilation through inhibiting Fe vacancies movement to the oxide/metal interface [23]. Meanwhile, O transported by diffusion in the nano-channel could react with the alloy inside the nano-cavities. An equivalent amount of Cr in the matrix and in the Fe-Cr spinel through EPMA analysis (Figure 9) also revealed that the diffusion of Cr in both matrix and Fe-Cr spinel is negligible. It could be deduced that thickness of the newly-formed Fe-Cr spinel is equivalent to the consumed matrix volume, implying that the growth rate of Fe-Cr spinel is also dependent on the outward diffusion of Fe across the scale.
The incorporated Fe2Zr phase in the inner Fe-Cr spinel scale would impede the diffusion of Fe across the Fe-Cr spinel scale. As a result, a reduction in the Fe supply to the magnetite/Fe-Cr spinel interface is present adjacent to the Fe2Zr phase, and looser magnetite would be formed around the Fe2Zr phase, resulting in the creation of cavities in the outer magnetite layer with prolonged oxidation time (arrows in Figure 8). Moreover, grain dissociation of scale above the nano-cavities is responsible for the nano-channels formation in the scale according to dissociative/perforative growth theory [22]. The presence of Fe-Cr spinel/Fe2Zr interface is the preferential sites for grain dissociation, and would promote the formation of nano-channels at these interfaces. The schematic illustration of oxidation behaviors in oxygen-saturated Pb-Bi eutectic is shown in Figure 12b.
Unlike the large disparity in the oxidation rates between the Fe-Cr-Zr alloy and other ferritic/martensitic steels after air oxidation, the growth rate of oxide scale thickness of Fe-Cr-Zr alloy in oxygen-saturated Pb-Bi eutectic is similar to that of ferritic/martensitic steels and ODS steels. On the one hand, the growth rates of outer magnetite layer and inner Fe-Cr spinel layer in oxygen-saturated Pb-Bi eutectic are both related with the Fe diffusion across the oxide scale, but differences in the microstructural features between Fe-Cr-Zr alloy, ferritic/martensitic steels and ODS steels have little effect on the out-ward diffusion behavior of Fe. On the other hand, diffusion of Cr in both matrix and Fe-Cr spinel is negligible due to the rapid diffusion of O inside the nano-channels, and similar Cr content of 9~12 wt.% in these materials could lead to the same growth rate of inner Fe-Cr spinel layer. Finally, the incorporated Fe2Zr phase could affect the compactness of the outer magnetite layer, but do not significantly affect the growth rate of scale.

5. Conclusions

A Fe-Cr-Zr alloy with a dispersed Fe2Zr phase in the α-Fe matrix was produced, and the oxidation behaviors of the Fe-Cr-Zr alloy were investigated in stagnant air and in oxygen-saturated stagnant liquid Pb-Bi eutectic, respectively.
Delayed oxidation of Fe2Zr phase with respect to the α-Fe matrix is found during oxidation in air and in liquid Pb-Bi eutectic at 823 K and 923 K based on the experimental results and the thermodynamic calculations.
After oxidation in air at 923 K, a duplex structure including an outer Fe2O3 layer and an inner (Fe,Cr,Zr)2O3 layer was developed due to the inadequate supply of Cr. The incorporated Fe2Zr phase with delayed oxidation in the scale would obstruct the diffusion of solute/oxygen across the scale, resulting in the nonuniform oxidation behavior. The greater oxidation rate of Fe-Cr-Zr alloy than that of ferritic/martensitic steels is directly correlated with their microstructural differences.
After oxidation in oxygen-saturated stagnant liquid Pb-Bi eutectic at 823 K, a three-layered structure consisting of an outer magnetite layer, inner Fe-Cr spinel layer, and internal oxidation zone is formed. The incorporated Fe2Zr phase in the inner Fe-Cr spinel would obstruct the diffusion of Fe across the Fe-Cr spinel, which is a limiting step for the scale growth. A reduction in the Fe supply to the magnetite/Fe-Cr spinel interface is present adjacent to the Fe2Zr phase, leading to the creation of cavities in the outer magnetite layer with prolonged oxidation time. Comparable growth rates of oxide scale thickness between Fe-Cr-Zr alloy and ferritic/martensitic steels are due to that the differences in the microstructural features have little effect on the limiting step of scale growth.

Author Contributions

Conceptualization, S.C. and L.R.; methodology, S.C.; validation, S.C. and L.R.; formal analysis, S.C.; investigation, S.C.; resources, L.R.; data curation, S.C.; writing—original draft preparation, S.C.; writing—review and editing, S.C.; visualization, S.C.; supervision, L.R.; project administration, L.R.; funding acquisition, L.R. All authors have read and agreed to the published version of the manuscript.

Funding

This work is financially supported by the National Natural Science Foundation of China (No. 51871218), Youth Innovation Promotion Association, CAS (No. 2018227), and Natural Science Foundation of Liaoning Province (No. 2020-MS-010).

Data Availability Statement

Not applicable.

Acknowledgments

The authors are grateful to Xiaojie Jin for help with oxidation tests in oxygen-saturated stagnant liquid Pb-Bi eutectic.

Conflicts of Interest

The authors declare no conflict of interest.

References

  1. Klueh, R.; Nelson, A. Ferritic/martensitic steels for next-generation reactors. J. Nucl. Mater. 2007, 371, 37–52. [Google Scholar] [CrossRef]
  2. Guérin, Y.; Zinkle, S.J.; Was, G.S. Materials challenges for advanced nuclear energy systems. MRS Bull. 2009, 34, 10–19. [Google Scholar]
  3. Zinkle, S.J.; Was, G.S. Materials challenges in nuclear energy. Acta Mater. 2013, 61, 735–758. [Google Scholar] [CrossRef]
  4. Chen, S.; Rong, L. Effect of silicon on the microstructure and mechanical properties of reduced activation ferritic/martensitic steel. J. Nucl. Mater. 2015, 459, 13–19. [Google Scholar] [CrossRef]
  5. Agamennone, R.; Blum, W.; Gupta, C.; Chakravartty, J.K. Evolution of microstructure and deformation resistance in creep of tempered martensitic 9–12%Cr–2%W–5%Co steels. Acta Mater. 2006, 54, 3003–3014. [Google Scholar] [CrossRef]
  6. Ghassemi-Armaki, H.; Chen, R.; Maruyama, K.; Yoshizawa, M.; Igarashi, M. Static recovery of tempered lath martensite microstructures during long-term aging in 9–12% Cr heat resistant steels. Mater. Lett. 2009, 63, 2423–2425. [Google Scholar] [CrossRef]
  7. Chen, S.; Jin, X.; Rong, L. Microstructural Evolution and Mechanical Properties of Ultrafine-Grained Ferritic-Martensitic Steel During Thermal Aging. Met. Mater. Trans. A 2020, 51, 5154–5168. [Google Scholar] [CrossRef]
  8. Ukai, S.; Fujiwara, M. Perspective of ODS alloys application in nuclear environments. J. Nucl. Mater. 2002, 307, 749–757. [Google Scholar] [CrossRef]
  9. Hayashi, T.; Sarosi, P.; Schneibel, J.; Mills, M. Creep response and deformation processes in nanocluster-strengthened ferritic steels. Acta Mater. 2008, 56, 1407–1416. [Google Scholar] [CrossRef]
  10. Alinger, M.; Odette, G.; Hoelzer, D. On the role of alloy composition and processing parameters in nanocluster formation and dispersion strengthening in nanostuctured ferritic alloys. Acta Mater. 2009, 57, 392–406. [Google Scholar] [CrossRef]
  11. Yamamoto, K.; Kimura, Y.; Wei, F.; Mishima, Y. Design of Laves phase strengthened ferritic heat resisting steels in the Fe–Cr–Nb(–Ni) system. Mater. Sci. Eng. A 2002, 329, 249–254. [Google Scholar] [CrossRef]
  12. Morris, D.G.; Muñoz-Morris, M.A.; Requejo, L.M. New iron–aluminium alloy with thermally stable coherent intermetallic nanoprecipitates for enhanced high-temperature creep strength. Acta Mater. 2006, 54, 2335–2341. [Google Scholar] [CrossRef]
  13. Morris, D.G.; Gutierrez-Urrutia, I.; Muñoz-Morris, M.A. The high-temperature creep behaviour of an Fe–Al–Zr alloy strengthened by intermetallic precipitates. Scr. Mater. 2007, 57, 449–452. [Google Scholar] [CrossRef]
  14. Yang, Y.; Tan, L.; Bei, H.; Busby, J.T. Thermodynamic modeling and experimental study of the Fe–Cr–Zr system. J. Nucl. Mater. 2013, 441, 190–202. [Google Scholar] [CrossRef]
  15. Jin, X.; Chen, S.; Rong, L. Effect of Fe2Zr phase on the mechanical properties and fracture behavior of Fe-Cr-W-Zr ferritic alloy. Mater. Sci. Eng. A 2018, 722, 173–181. [Google Scholar] [CrossRef]
  16. Tan, L.; Yang, Y.; Chen, T.; Sridharam, K.; He, L. Mechanical Properties and Radiation Resistance of Nanoprecipitates-Strengthened Advanced Ferritic Alloys; Oak Ridge National Lab.(ORNL): Oak Ridge, TN, USA, 2017. [Google Scholar] [CrossRef]
  17. Tan, L.; Yang, Y.; Sridharan, K. Accelerated Development of Zr-Containing New Generation Ferritic Steels for Advanced Nuclear Reactors; Oak Ridge National Lab.(ORNL): Oak Ridge, TN, USA, 2015. [Google Scholar] [CrossRef]
  18. Chen, S.; Rong, L. Oxide scale formation on ultrafine-grained ferritic-martensitic steel during pre-oxidation and its effect on the corrosion performance in stagnant liquid Pb-Bi eutectic. Acta Metall. Sin. 2021, 57, 989–999. [Google Scholar]
  19. Wang, J.; Lu, S.; Rong, L.; Li, D.; Li, Y. Effect of silicon on the oxidation resistance of 9 wt.% Cr heat resistance steels in 550 °C lead-bismuth eutectic. Corros. Sci. 2016, 111, 13–25. [Google Scholar] [CrossRef]
  20. Lu, Y.; Song, Y.; Chen, S.; Rong, L. Effects of Al and Si on mechanical properties and corrosion resistance in liquid Pb-Bi eutectic of 9Cr2WVTa steel. Acta Metall. Sin. 2016, 52, 298–306. [Google Scholar]
  21. Gong, X.; Short, M.P.; Auger, T.; Charalampopoulou, E.; Lambrinou, K. Environmental degradation of structural materials in liquid leadand lead-bismuth eutectic-cooled reactors. Prog. Mater. Sci. 2022, 126, 100920. [Google Scholar] [CrossRef]
  22. Martinelli, L.; Balbaud-Célérier, F.; Terlain, A.; Delpech, S.; Santarini, G.; Favergeon, J.; Moulin, G.; Tabarant, M.; Picard, G. Oxidation mechanism of a Fe–9Cr–1Mo steel by liquid Pb–Bi eutectic alloy (Part I). Corros. Sci. 2008, 50, 2523–2536. [Google Scholar] [CrossRef]
  23. Martinelli, L.; Balbaud-Célérier, F.; Terlain, A.; Bosonnet, S.; Picard, G.; Santarini, G. Oxidation mechanism of an Fe–9Cr–1Mo steel by liquid Pb–Bi eutectic alloy at 470 °C (Part II). Corros. Sci. 2008, 50, 2537–2548. [Google Scholar] [CrossRef]
  24. Martinelli, L.; Balbaud-Célérier, F.; Picard, G.; Santarini, G. Oxidation mechanism of a Fe–9Cr–1Mo steel by liquid Pb–Bi eutectic alloy (Part III). Corros. Sci. 2008, 50, 2549–2559. [Google Scholar] [CrossRef]
  25. Proff, C.; Abolhassani, S.; Lemaignan, C. Oxidation behaviour of zirconium alloys and their precipitates—A mechanistic study. J. Nucl. Mater. 2013, 432, 222–238. [Google Scholar] [CrossRef]
  26. Young, D.J. High. Temperature Oxidation and Corrosion of Metals, 2nd ed.; Elsevier: Sydney, Australia, 2008; ISBN 9780081001011. [Google Scholar]
  27. Robino, C.V. Representation of mixed reactive gases on free energy (Ellinghan-Richardson) diagrams. Metall. Mater. Trans. B 1996, 27, 65–69. [Google Scholar] [CrossRef]
  28. Matsui, T. Vaporization study on M2Zr (M=Fe and Cr) by a mass-spectrometric method. J. Nucl. Mater. 1993, 201, 278–283. [Google Scholar] [CrossRef]
  29. Chen, S.; Jin, X.; Rong, L. Improvement in High Temperature Oxidation Resistance of 9 %Cr Ferritic–Martensitic Steel by Enhanced Diffusion of Mn. Oxid. Met. 2015, 85, 189–203. [Google Scholar] [CrossRef]
  30. Jin, X.; Chen, S.; Rong, L. Effects of Mn on the mechanical properties and high temperature oxidation of 9Cr2WVTa steel. J. Nucl. Mater. 2017, 494, 103–113. [Google Scholar] [CrossRef]
  31. Khanna, A.S.; Rodriguez, P.; Gnanamoorthy, J.B. Oxidation Kinetics, Breakaway oxidation, and inversion phenomenon in 9Cr―lMo steels. Oxid. Met. 1986, 26, 171–200. [Google Scholar] [CrossRef]
  32. Zhang, D.; Liu, J.; Xue, Z.; Mao, X. Oxidation behavior of T92 steel with NiCoCrAlY coating by EB-PVD. Surf. Coat. Technol. 2014, 252, 179–185. [Google Scholar] [CrossRef]
  33. Doğan, N.; Holcomb, G.R.; Alman, D.E.; Jablonski, P.D. Steamside Oxidation Behavior of Experimental 9% Cr Steels, DOE/NETL-IR-2008-007; U.S. Department of Energy, National Energy Technology Laboratory: Pittsburgh, PA, USA, 2008. [Google Scholar]
  34. Zhang, J. A review of steel corrosion by liquid lead and lead–bismuth. Corros. Sci. 2009, 51, 1207–1227. [Google Scholar] [CrossRef]
  35. Gnecco, F.; Ricci, E.; Bottino, C.; Passerone, A. Corrosion behaviour of steels in lead–bismuth at 823 K. J. Nucl. Mater. 2004, 335, 185–188. [Google Scholar] [CrossRef]
  36. Hosemann, P.; Thau, H.; Johnson, A.; Maloy, S.; Li, N. Corrosion of ODS steels in lead–bismuth eutectic. J. Nucl. Mater. 2008, 373, 246–253. [Google Scholar] [CrossRef]
  37. Mehrer, H. Diffusion in Solids; Springer: Berlin, Germany, 2007. [Google Scholar]
  38. Raman, R.K.S.; Gupta, R.K. Oxidation resistance of nanocrystalline vis-à-vis microcrystalline Fe–Cr alloys. Corros. Sci. 2009, 51, 316–321. [Google Scholar] [CrossRef]
  39. Chen, S.; Rong, L. Roles of Mn in the High-Temperature Air Oxidation of 9Cr Ferritic–Martensitic Steel After Severe Plastic Deformation. Oxid. Met. 2017, 89, 415–428. [Google Scholar] [CrossRef]
  40. Kumar, A.; Barda, H.; Klinger, L.; Finnis, M.; Lordi, V.; Rabkin, E.; Srolovitz, D.J. Anomalous diffusion along metal/ceramic interfaces. Nat. Commun. 2018, 9, 5251. [Google Scholar] [CrossRef]
  41. Amram, D.; Klinger, L.; Gazit, N.; Gluska, H.; Rabkin, E. Grain boundary grooving in thin films revisited: The role of interface diffusion. Acta Mater. 2014, 69, 386–396. [Google Scholar] [CrossRef]
Figure 1. XRD patterns of the Fe-Cr-Zr alloy.
Metals 12 00827 g001
Figure 2. (a,b) SEM/EDS, (c) TEM, and (d) HRTEM image of the Fe-Cr-Zr alloy. (b) EDS point analysis of Fe2Zr phase. The inset in (c) represents the SAED patterns of Fe2Zr phase.
Metals 12 00827 g002
Figure 3. SEM surface morphologies of the Fe-Cr-Zr alloy oxidized in air at 923 K for (a) 10 min, (b) 20 h, (c) 500 h, and (d) 1000 h.
Metals 12 00827 g003
Figure 4. XRD patterns of the Fe-Cr-Zr alloy oxidized in air at 923 K for 1000 h.
Metals 12 00827 g004
Figure 5. (a) BSE images of cross-sectional morphologies of Fe-Cr-Zr alloy after oxidation in air at 923 K for 10 min. (bd) EDS spectrums for point 1, point 2, and point 3 marked in (a).
Metals 12 00827 g005
Figure 6. (a) OM and (b) BSE images of polished cross-sectional morphologies of Fe-Cr-Zr alloy after oxidation in air at 923 K for 20 h. (c,d) EDS spectrums for point 1 and point 2 marked in (b).
Metals 12 00827 g006
Figure 7. (a) OM and (b) BSE images of polished cross-sectional morphologies of Fe-Cr-Zr alloy after oxidation in air at 923 K for 1000 h. (c) Compositional profiles with the distance across the oxide scale marked in (b).
Metals 12 00827 g007
Figure 8. BSE images of cross-sectional morphologies of Fe-Cr-Zr alloy after exposure to oxygen-saturated Pb-Bi eutectic at 823 K for (a) 500 h, (b) 1000 h, and (c) 2000 h.
Metals 12 00827 g008
Figure 9. EPMA analysis of the cross-sectional area of Fe-Cr-Zr alloy after exposure to oxygen-saturated Pb-Bi eutectic at 823 K for 1000 h.
Metals 12 00827 g009
Figure 10. The weight gain curves of Fe-Cr-Zr alloy oxidized in air at 923 K compared with the ferritic/martensitic steels (Data from [29,30,31,32,33]).
Metals 12 00827 g010
Figure 11. Thickness of oxide scale of Fe-Cr-Zr alloy obtained by oxidation in oxygen-saturated liquid Pb-Bi eutectic at 823 K compared with the ferritic/martensitic steels (Data from [19,34,35,36]).
Metals 12 00827 g011
Figure 12. The schematic illustration of oxidation mechanism of Fe-Cr-Zr alloy after oxidation (a) in air and (b) in oxygen-saturated liquid Pb-Bi eutectic.
Metals 12 00827 g012
Table 1. Chemical compositions of Fe-Cr-Zr alloy.
ElementCCrWZrFe
wt.%0.00398.962.019.86Bal.
Publisher’s Note: MDPI stays neutral with regard to jurisdictional claims in published maps and institutional affiliations.

