Article

Effect of the Annealing Process on the Microstructure and Performance of 5056 Aluminum Alloy Wires

1
Key Laboratory of Electromagnetic Processing of Materials, Ministry of Education, Northeastern University, Shenyang 110819, China
2
School of Materials Science and Engineering, Northeastern University, Shenyang 110819, China
3
Department of Applied Science, University of Quebec at Chicoutimi, 555, Boulevard de l’University, Chicoutimi, QC G7H 2B1, Canada
*
Author to whom correspondence should be addressed.
Metals 2022, 12(5), 823; https://doi.org/10.3390/met12050823
Submission received: 11 April 2022 / Revised: 1 May 2022 / Accepted: 7 May 2022 / Published: 10 May 2022

Abstract

:
Recrystallization can affect the mechanical properties of aluminum alloys by changing the grain structure, and even the secondary recrystallization will cause a sudden change in the grain size in the alloy. In this work, by choosing different annealing treatments on the cold-drawn 5056 aluminum wire, the microstructure evolution in the alloy homogenized at different annealing processes was discussed, and its influence on the mechanical properties was tested. The results demonstrated that the different annealing treatments had a great effect on the recrystallized structure in the 5056 aluminum alloy. During the annealing, it was observed that the recrystallization started at 250 °C and completed at 310 °C, leading to a significant decrease in the mechanical properties. When the temperature was further increased to 530 °C, the secondary recrystallization occurred, and the grain size of the secondary recrystallization was larger than that when the annealing temperature was 560 °C. However, there was only a minor decrease in the mechanical properties. The reasons and laws of the secondary recrystallization are analyzed and discussed in this paper.

1. Introduction

The 5056 alloy is a high-magnesium aluminum alloy with good strength among the non-heat treatable aluminum alloys. It has a good processing plasticity and corrosion resistance. As a rustproof aluminum alloy with excellent comprehensive performance, it is widely applied in the fields of aerospace and shipbuilding [1,2,3]. After anodizing treatment, the alloy exhibits a good riveting performance and can be used as a rivet for riveting aerospace structural parts [4]. The cold drawing of the 5056 aluminum alloy can increase the strength while decreasing the plasticity, thereby affecting the quality of products and even the subsequent processing, which goes against improving the use ratio of the material [5]. Therefore, it is often necessary to anneal 5056 aluminum alloy wires before the forming process. The movement of dislocations and defects in the aluminum-magnesium alloy during the recovery process is utilized to reduce the strength, improve the plasticity, eliminate the stress, and change the textural configuration of the alloy and grain orientation while maintaining the effect of work hardening [6,7,8].
Although there are many studies on Al-Mg alloys, there are few studies on 5056 aluminum alloys. The 5056 aluminum alloy, similar to other conventional Al-Mg alloys, contains less recrystallization-inhibiting elements; the grains tend to grow up during the annealing process. Especially for alloys after cold deformation, grain growth is more likely to occur during the annealing process. With the occurrence of recrystallization, the deformation texture generated after cold deformation will transform to the recrystallization texture [9,10,11]. In the grain growth process, large grains augment while small grains shrink until they disappear, so that the average grain size of the system increases. However, if a second-phase grain overtexture exists, the grain growth process will deviate from the normal kinetic characteristics and will be prone to abnormal grain growth, namely secondary recrystallization [12,13]. Regarding the research on the recrystallization of Al-Mg alloys, the recrystallization after cold rolling has mainly been studied. Ma Pengcheng et al. studied the effects of the cold rolling process and annealing temperature on the microstructure and performance of an Al-Mg alloy [14]. The results showed that when the total reduction ratio was constant, the cold rolling process with a primary cold rolling reduction of 33.3% and secondary cold rolling reduction of 75% can achieve high strength and excellent formability. In the temperature range of 350~450 °C, the alloy exhibits excellent formability after final annealing at 450 °C. Some scholars have also studied the recrystallization behavior of Al-Mg alloys obtained by extrusion, such as Liu Jinan et al. who studied the effect of annealing on the texture of 5B02 aluminum alloy pipes [15]. The texture strength of grains in the alloy, especially the cubic texture and Goss texture, was significantly reduced under the 2-h annealing process at 380 °C; during the plastic deformation, the number of grains involved in the slip significantly increased, improving the homogeneity of the plastic deformation of the pipes. A few researchers have studied the recrystallization behavior after cold drawing deformation but there is limited open literature about the secondary recrystallization behavior after cold drawing deformation in Al-Mg alloys.
With the 5056 aluminum alloy wires obtained from the drawing process of extrusion poles through a cold deformation of 60% as the research object, this paper studied the influence of the annealing process on the microstructure, mechanical properties, and texture of the specimens, analyzed the mechanism of secondary recrystallization after annealing, and summarized the rules in order to provide a theoretical basis for the drawing production of 5056 aluminum alloys.

2. Materials and Methods

The experimental raw material was 5056 aluminum alloy extrusion poles with a diameter of 9.5 mm. The nominal composition and actual composition (mass fraction) are shown in Table 1.
After the 5056 aluminum alloy extrusion poles underwent repeated cold drawing, the 5056 aluminum alloy cold-drawn specimens were obtained with a total deformation of 60% or 6 mm. The RJ2-35-6 pit furnace was used for the heat treatment. According to the literature [16,17], the annealing process in the present work was designed in three parts: (1) the holding time was kept unchanged for 2 h, the holding temperature was from 190 °C to 560 °C, and a group of experiments were carried out at intervals of 30 °C; (2) the holding temperature was kept unchanged at 530 °C, and the temperature was kept for 10 min, 20 min, and 60 min respectively; (3) the holding temperature was kept unchanged at 560 °C for 5 min, 10 min and 20 min, respectively. The annealing behavior and texture evolution rule of the cold-drawn 5056 aluminum alloy wires at different annealing temperatures were studied by hardness testing, a tensile test, microstructure observation, and texture measurement. The hardness test was conducted on the HV-10Z micro-Vickers hardness tester by measuring each specimen at no less than 5 hardness points and taking the average. The metallographic specimens were mechanically ground and polished before anodic coating treatment (with Baker’s reagent as the coating liquid), and their microstructure was observed through a Leica 5000M upright polarizing microscope (Leica, Wetzlar, Germany). EBSD analysis was conducted on the specimens using a Crossbeam 550 FIB (Oxford Instruments, London, UK) focused ion beam scanning electron microscope (SEM) (Zeiss, Dresden, Germany). The specimens for texture analysis were mechanically ground and polished before electropolishing treatment to eliminate residual stress on their surface.

3. Results

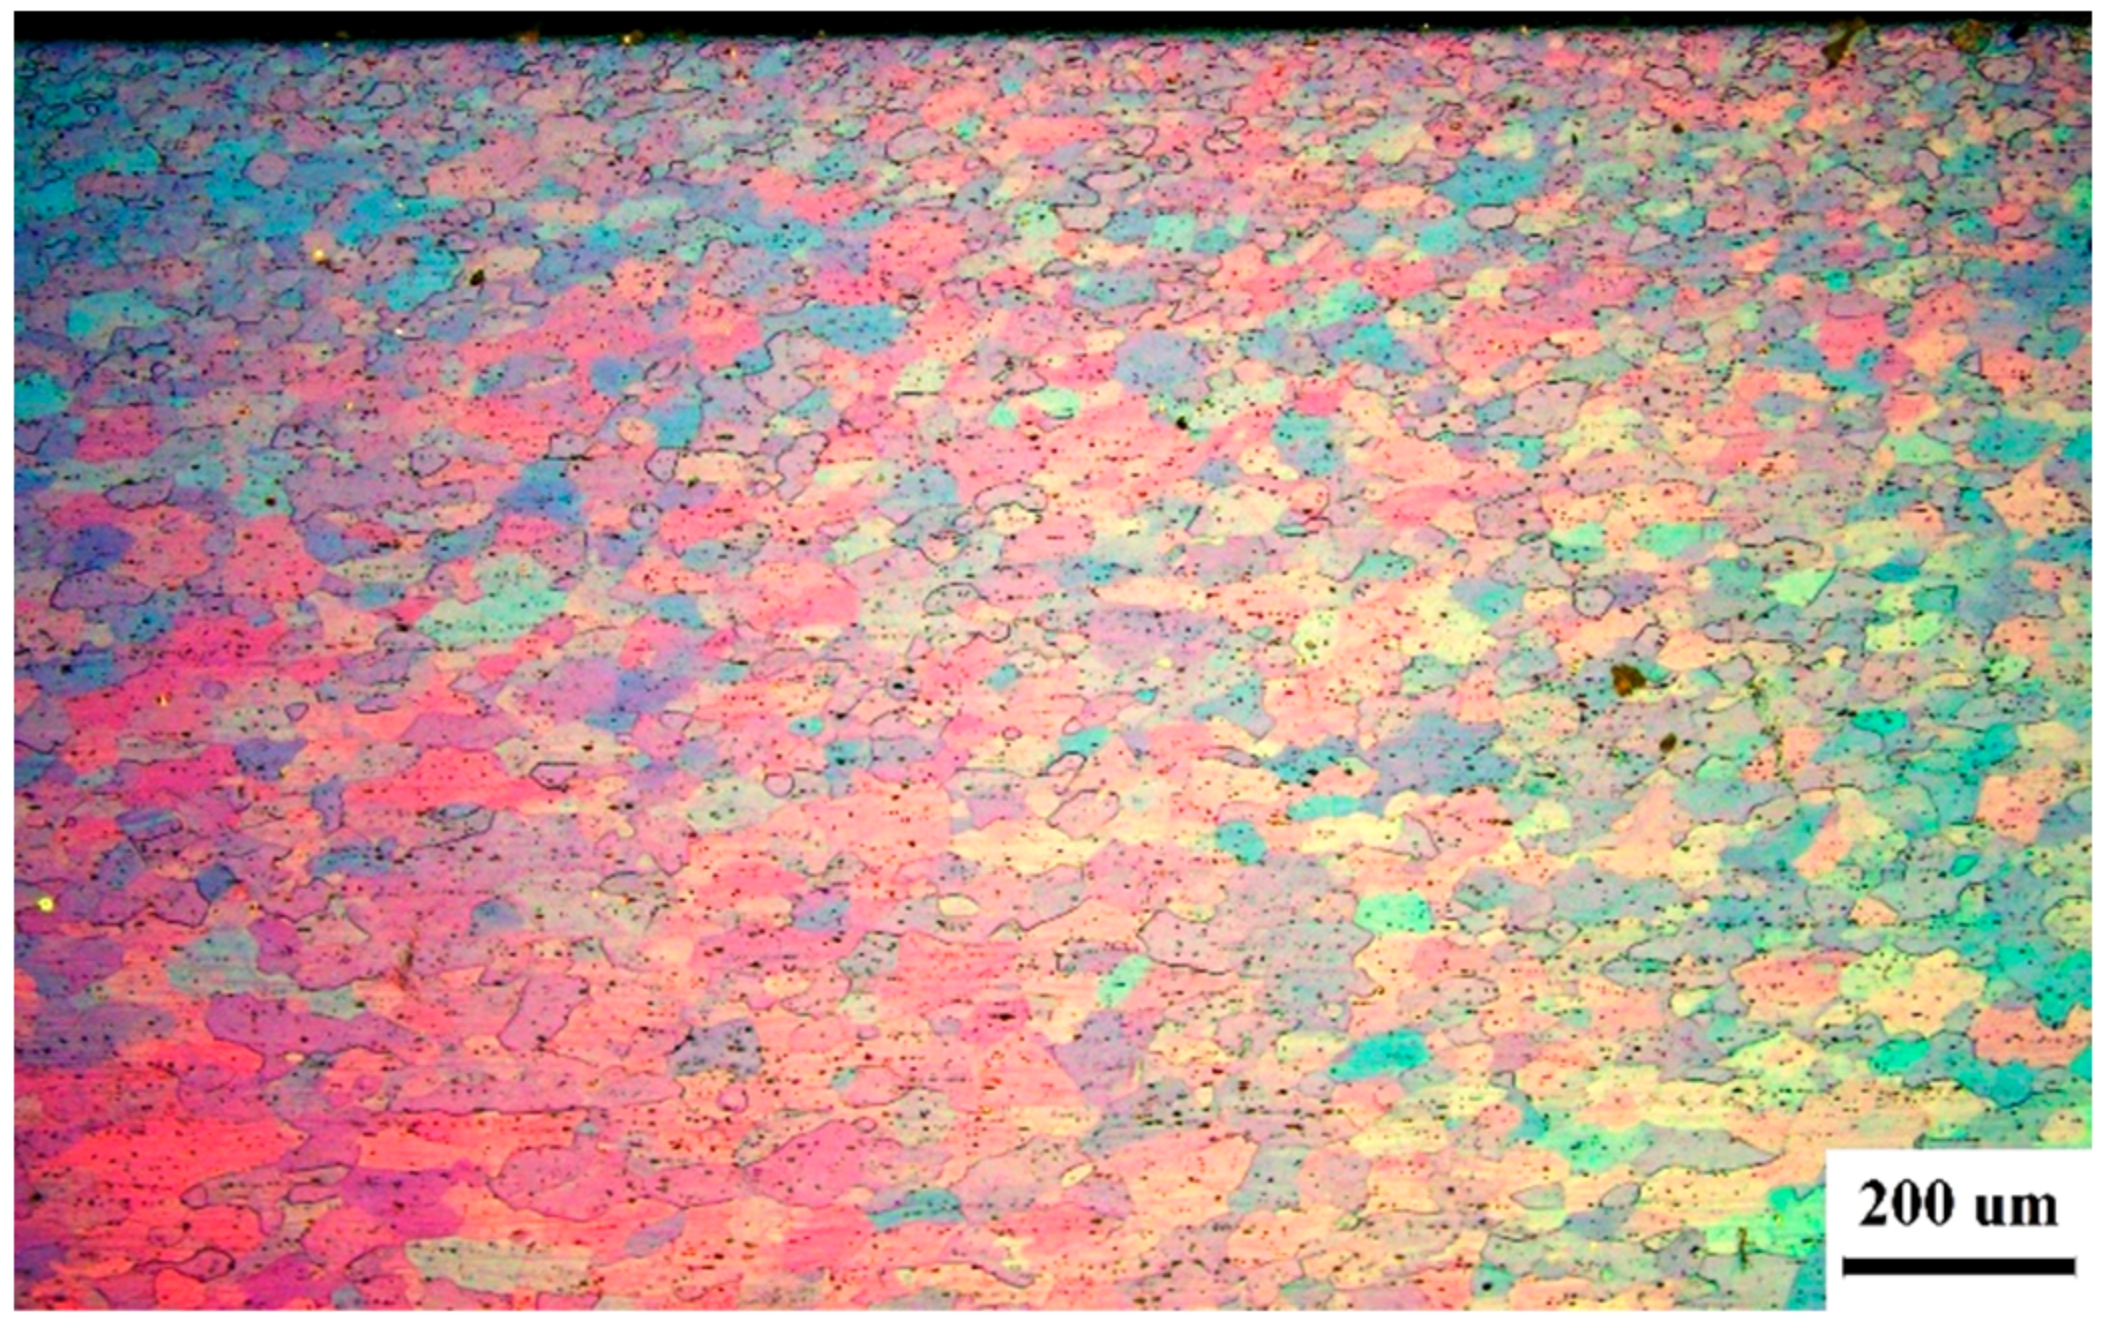
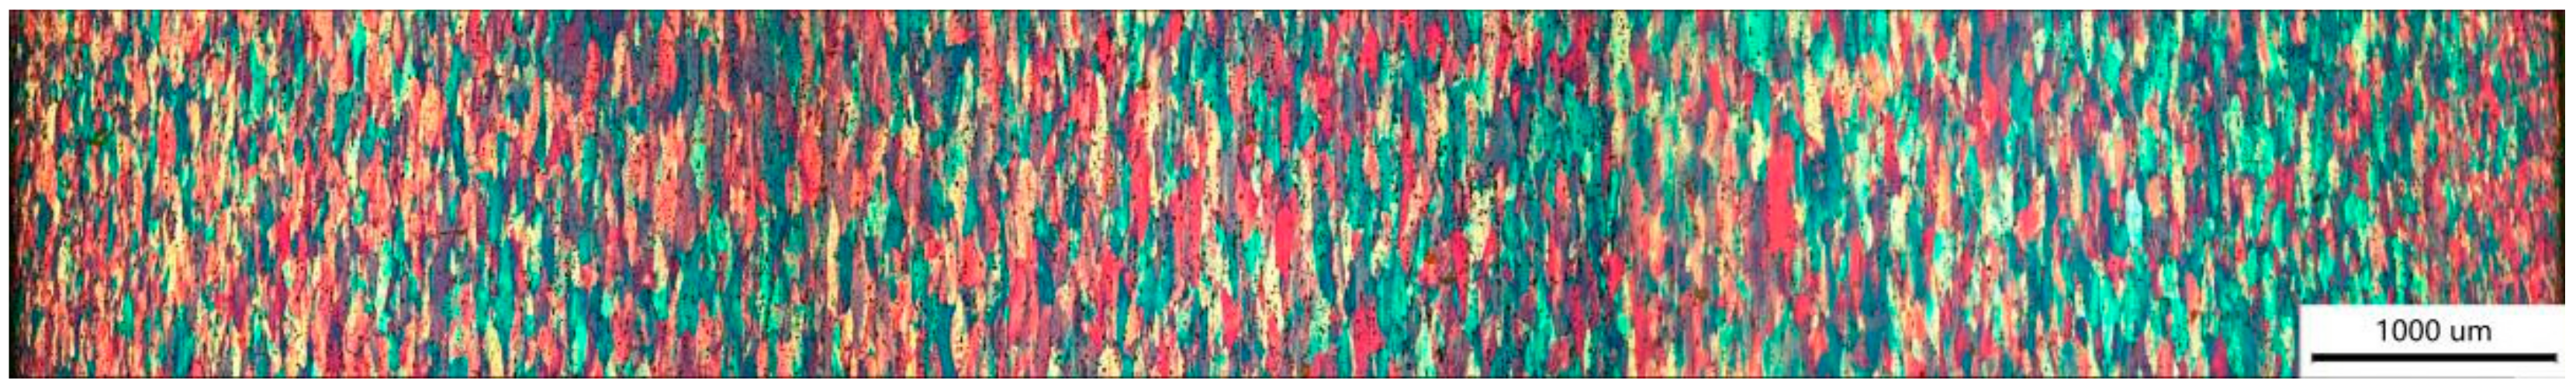
3.1. Microstructures of Extrusion Poles and Drawn Wires

Figure 1 is a polarized-light microstructure diagram obtained after the 5056 aluminum alloy extrusion poles with a diameter of 9.5 mm were planed axially. The upper part of the figure is the edge of the extrusion poles. The microstructure obtained through extrusion deformation was basically equiaxial grains, and the grain size was significantly smaller at the edge than that at the core, so that the area of grains at the edge was about 515 μm2 while the area of grains at the core was about 2290 μm2.
Figure 2 is a polarized-light microstructure diagram after the 5056 aluminum alloy drawn wires of φ6 mm were planed axially. The left and right sides of the figure are the edge of the wire. The grain morphology of the 5056 aluminum alloy changed from a near-spherical shape in the as-extruded state into a near-spindle shape in the as-drawn state. The direction of the two sharp corners of the spindle shape was the direction of drawing deformation, and the grain size was significantly smaller at the edge than at the core, so that the area of spindle-shaped grains at the edge was about 567 μm2 while the area of spindle-shaped grains at the core was about 2447 μm2.
Figure 3 shows the metallographic photos after as-extruded state and the as-drawn state. During the extrusion, the residual particles fragmented into small particles distributed along the grain boundaries (Figure 3a). During further cold-drawing, little change was observed on the residual particles due to the minor deformation (from φ9.5 mm to φ6 mm) and they were still evenly distributed along the grain boundaries.

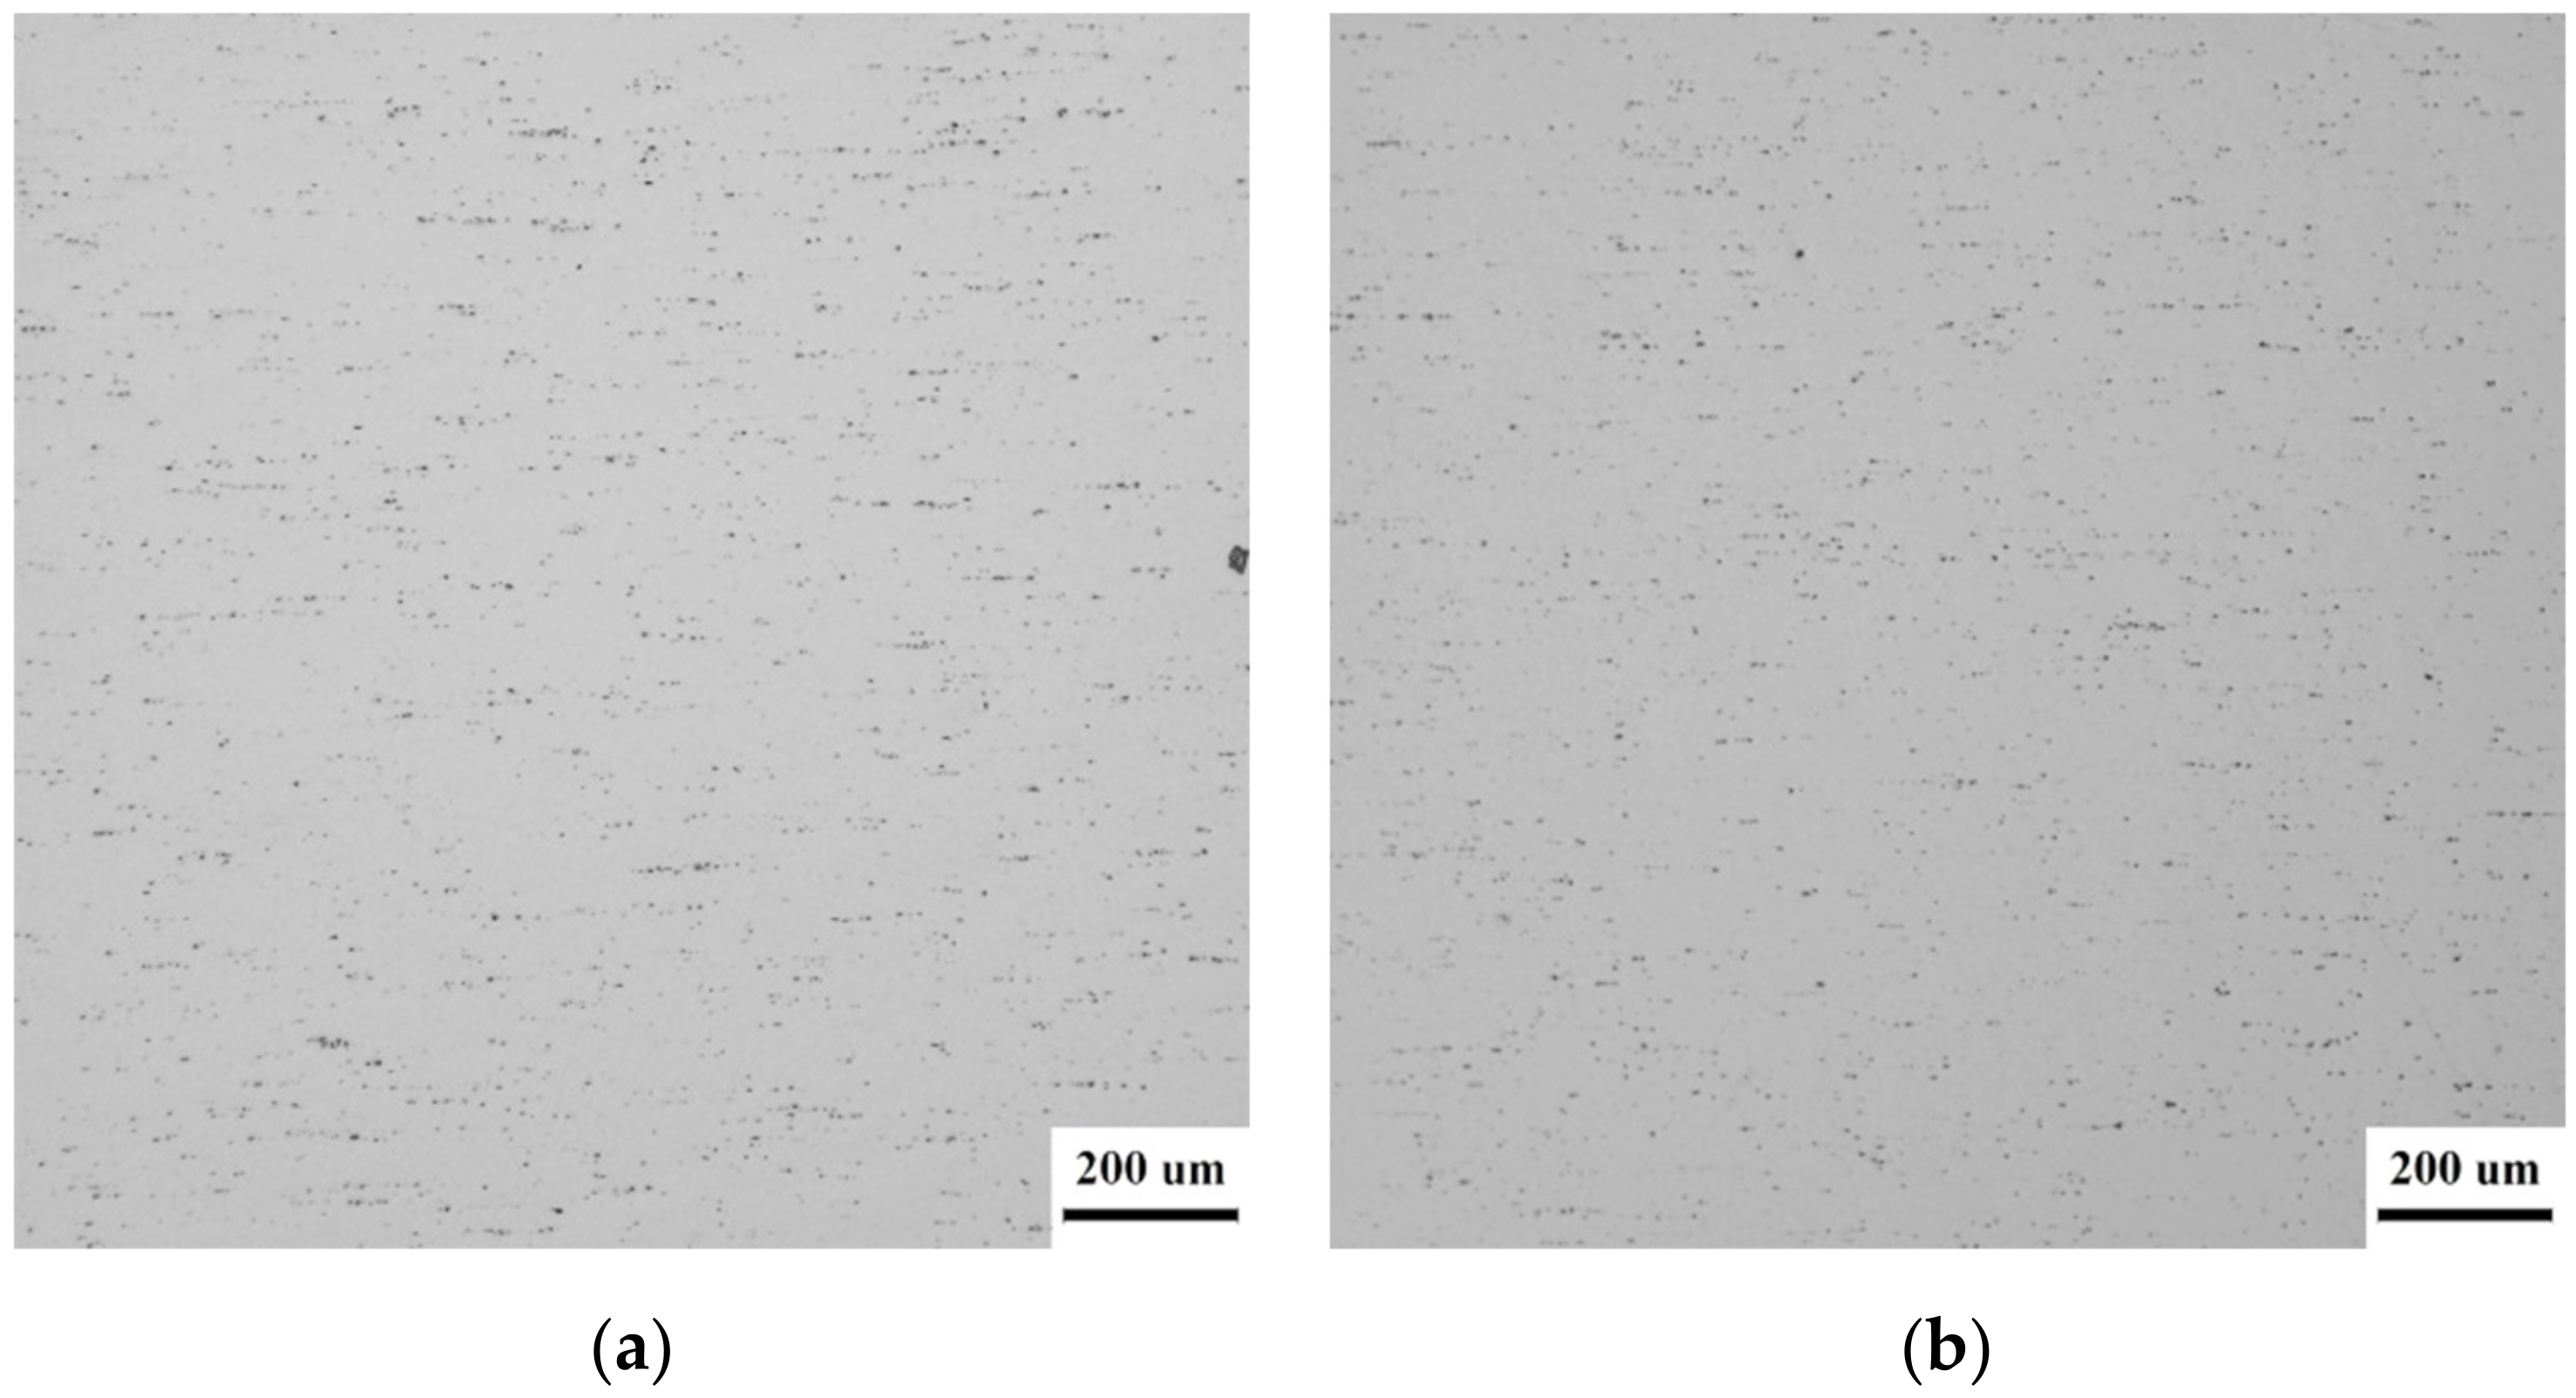
3.2. Effect of Annealing Treatments on the Microstructure and Performance of an as-Drawn 5056 Aluminum Alloy

In the present work, it is observed that the grain structure is similar in the temperature range of 190–220, 220–310, 310–400, and then 530 and 560 °C, therefore, the grain structure at typical temperatures is selected and shown in Figure 4, which shows the polarized-light microstructure of a φ6 mm thick 5056 aluminum alloy wire after 2-hour annealing at 220, 250, 310 and 400 °C while more grain structure at higher temperatures (530 and 560 °C) is shown in Figure 5 and Figure 6. From Figure 4a, it can be seen that the alloy preserved the spindle-shaped drawing deformation microstructure without undergoing recrystallization after being annealed at 220 °C for 2 h; however, it can be seen from Figure 4b that some fine equiaxial grains were generated, which means that partial recrystallization occurred after annealing at 250 °C for 2 h. As the annealing temperature kept rising, Figure 4c,d were obtained, from which can be seen that the alloy underwent a complete recrystallization such that its interior was teeming with uniformly distributed equiaxial grains without any spindle-shaped deformation microstructure [18,19].
Figure 5 shows the polarized-light microstructures of as-drawn state 5056 aluminum alloy wires after 10-, 20-, and 60-min thermal insulations at 530 °C, respectively. It can be seen from the figure that the alloy underwent a complete recrystallization after being treated at 530 °C for 10 min, such that its interior was teeming with uniformly distributed equiaxial grains without any spindle-shaped deformation microstructure. After the alloy was treated at 530 °C for 20 min, a few extraordinarily large grains appeared at the edge of the wires. After the alloy was treated at 530 °C for 60 min, secondarily recrystallized grains appeared everywhere except at one edge where normal recrystallized grains remained. The area of the grains was about 5,742,301 μm2, while the area of the normal primarily recrystallized grains at the exceptional edge was only about 56 μm2.
Figure 6 shows the polarized light microstructure of the as-drawn state 5056 aluminum alloy wires after 5-min, 10-min, and 20-min thermal insulations at 560 °C, respectively. It can be seen from the figure that the alloy underwent a complete recrystallization after being treated at 560 °C for 5 min, such that there was no spindle-shaped deformation microstructure but a certain number of secondarily recrystallized grains in the exterior of the alloy and still a large number of primarily recrystallized grains that were not swallowed. There was basically no obvious qualitative change in the microstructure of the alloy which was treated at 560 °C for 10 min, as compared to that which was treated at 560 °C for 5 min. However, after the alloy was treated at 560 °C for 20 min, other a certain number of primarily recrystallized grains that remained amid the secondarily recrystallized grains, most regions were teeming with secondary recrystallized grains, and the area of secondarily recrystallized grains after 560 °C/20 min treatment was about 120,572 μm2, far smaller than the area of secondarily recrystallized grains after the 530 °C/60 min treatment. The area of normal primarily recrystallized grains after 560 °C/20 min treatment was about 78.5 μm2.
Figure 7 is a Vickers hardness data map of 5056 aluminum alloy drawn wires after different annealing processes. It can be seen from the figure that the as-drawn state hardness of 5056 aluminum alloy was 123 HV. After the 2-h annealing treatment of thermal insulation at different annealing temperatures, the hardness decreased to varying degrees with the rise in temperature. The whole decreasing process roughly fell into four stages: (1) when the annealing temperature ranged between 190 °C and 310 °C, the hardness of 5056 aluminum alloy wires decreased dramatically with the rise in the annealing temperature, from 103 HV at 190 °C to 73 HV at 310 °C of the annealing temperature; (2) when the annealing temperature ranged between 310 °C and 500 °C, the hardness of 5056 aluminum alloy wires basically leveled off without significant variation; (3) when the annealing temperature ranged between 500 °C and 560 °C, the hardness of 5056 aluminum alloy wires first decreased slightly and then increased slightly with the rise in the annealing temperature.
Figure 8 shows the change in the mechanical properties of 5056 aluminum alloy drawn wires after different annealing processes. It can be seen from the figure that the maximum tensile strength of the cold-deformed alloy was 422 MPa while the minimum elongation percentage was 10.30%. After the 2-h annealing treatment of thermal insulation at different annealing temperatures, the strength of the alloy decreased while the elongation percentage increased by distinct rates within distinct temperature ranges with the rise in the annealing temperature. When the annealing temperature was 190 °C, the tensile strength was 363 MPa, 14% lower than when the wires were unannealed, and the elongation percentage increased to 14.95%; when the annealing temperature was 190~250 °C, the strength of the alloy decreased slightly with the rise in the annealing temperature; when the annealing temperature rose from 250 °C to 280 °C, the tensile strength and yield strength of the alloy both decreased significantly, and the elongation percentage of the alloy increased significantly; when the annealing temperature was 310~500 °C, the strength and elongation percentage of the alloy changed little with the rise in the annealing temperature; when the annealing temperature was 530 °C, the strength decreased slightly; when the annealing temperature rose to 560 °C, the strength increased slightly again.

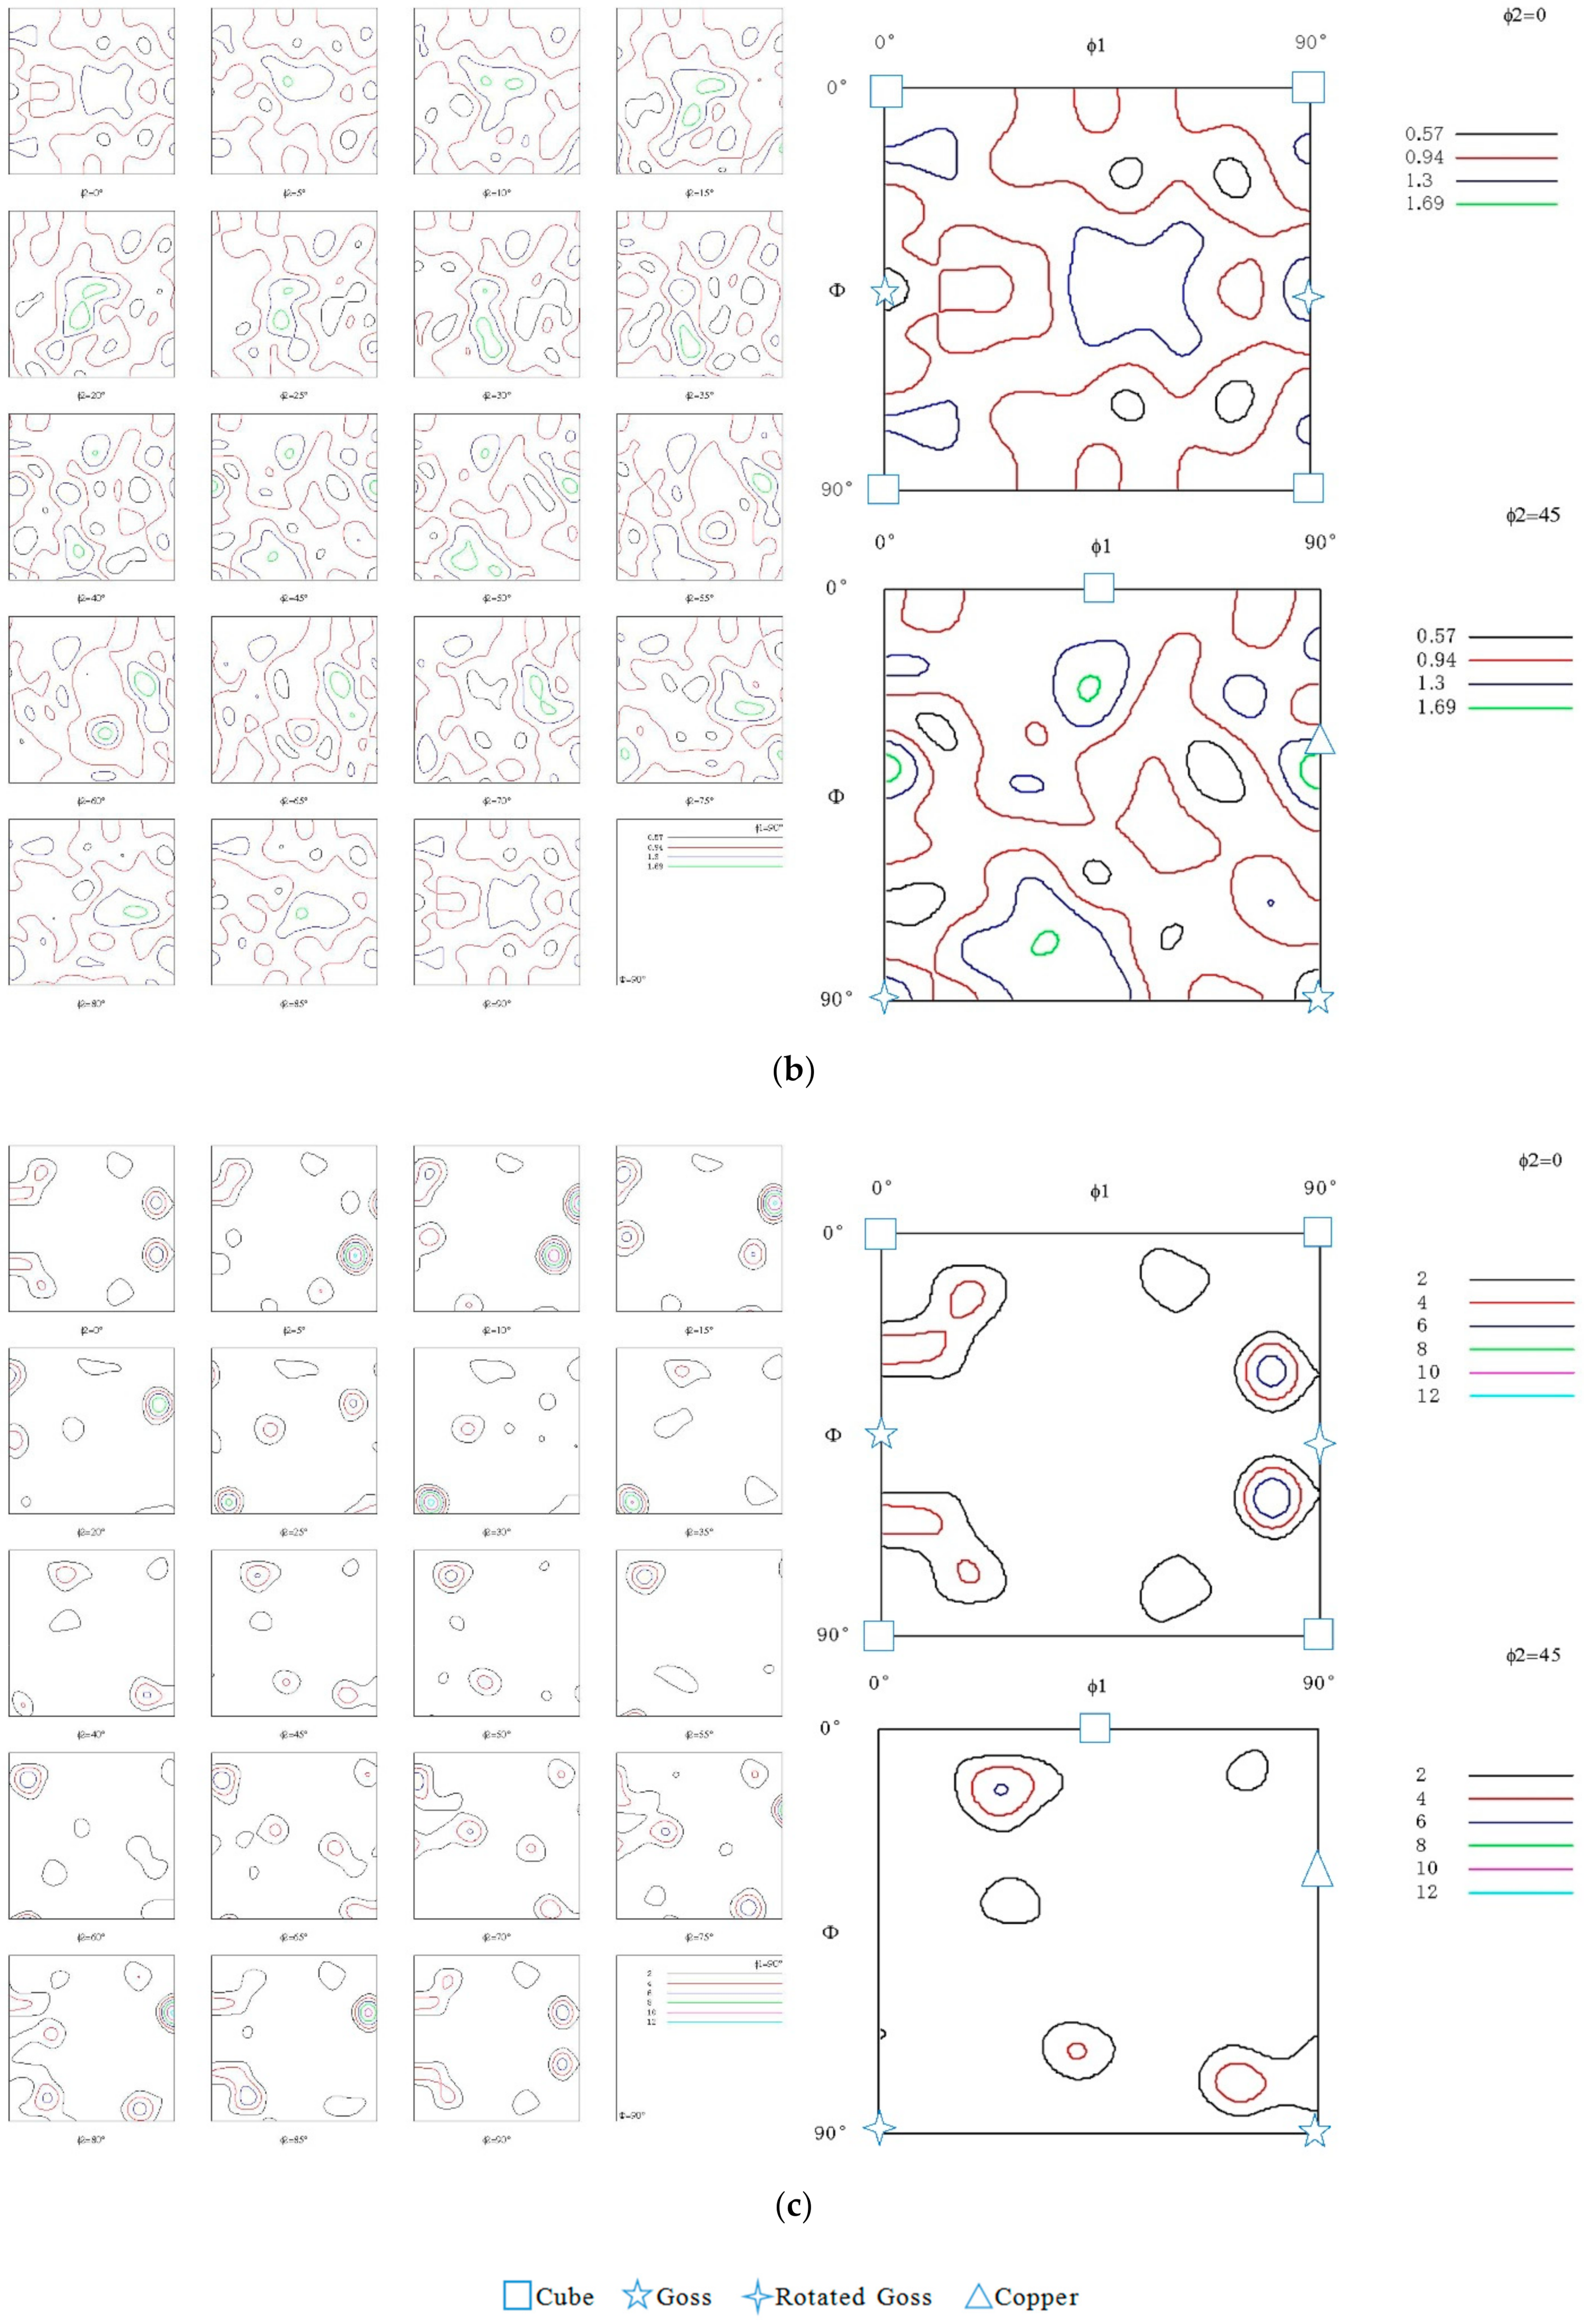
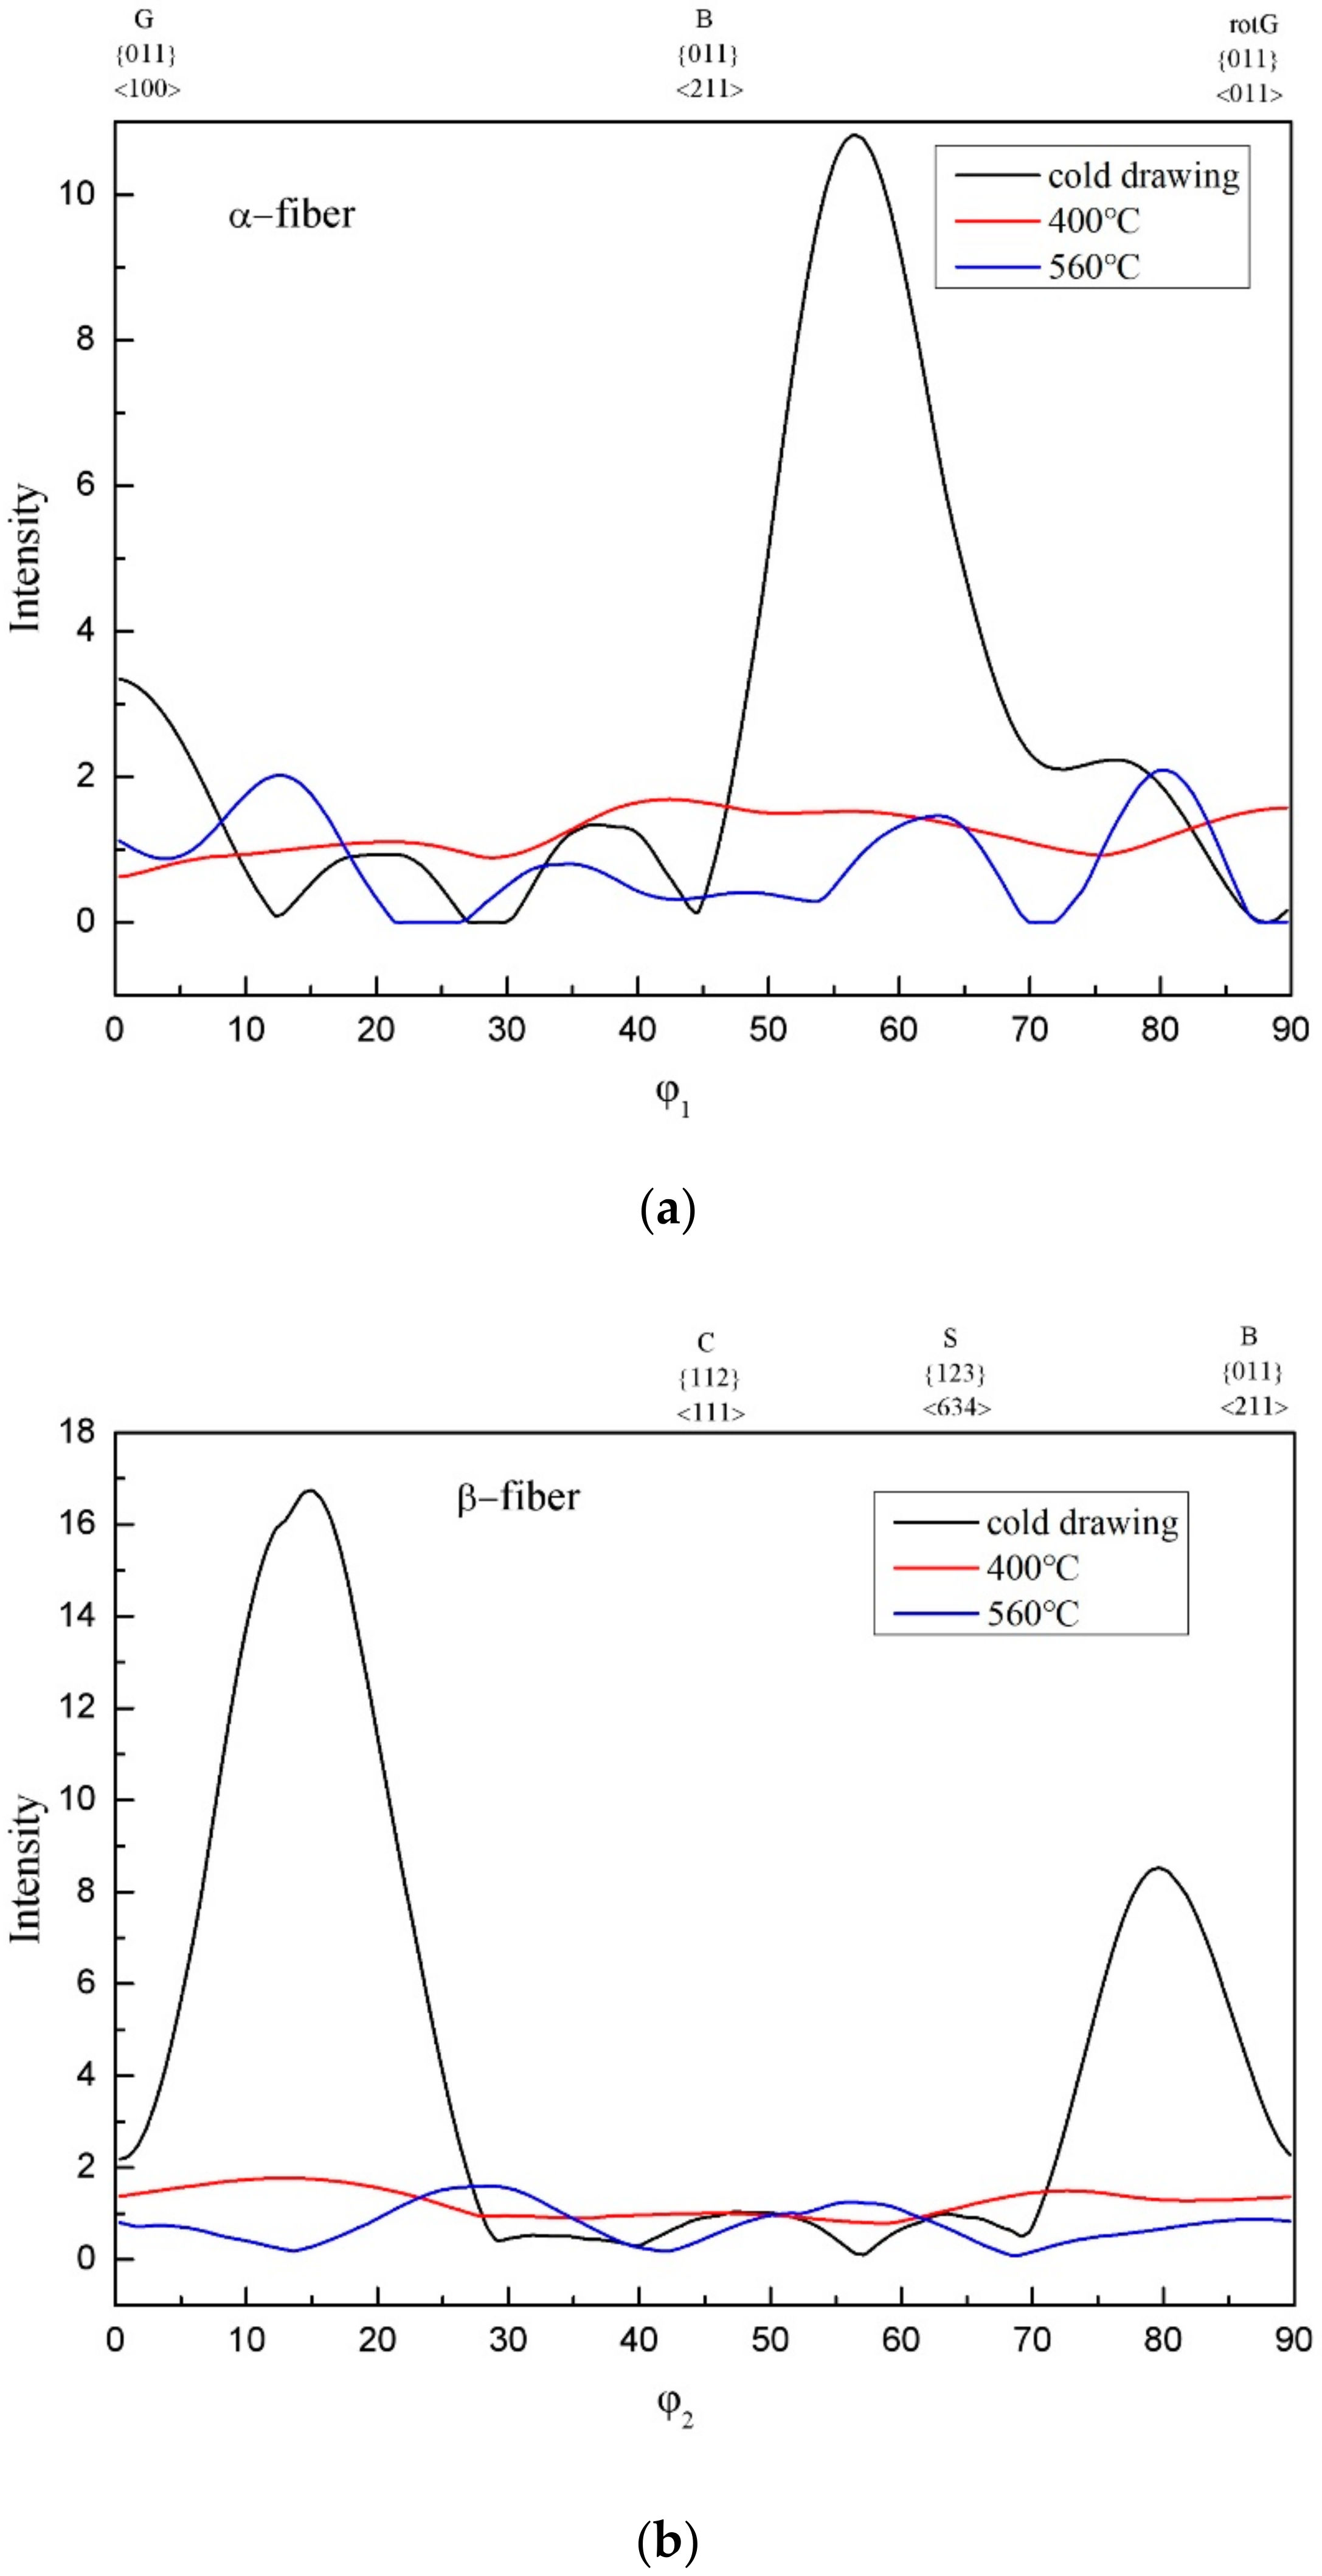
3.3. Textural Change

Figure 9 shows the curves of the specimens and the distribution of grain boundary misorientation angles. From Figure 9d, the distribution of misorientation angles in the as-drawn state of the alloy can be observed. The number of small-angle grain boundaries in the as-drawn state of the alloy was large, accounting for 30.9% of the total grain boundaries, while the number of large-angle boundaries was extremely small. There were a large number of grain boundaries of less than 2° in the specimens. It can be observed from Figure 9b that after the alloy was annealed at 400 °C for 2 h, its interior microstructure was predominated by equiaxial grains without any spindle-shaped deformation microstructure, and the sizes of the recrystallized grains were relatively uniform. Observing the distribution of misorientation angles, large-angle grain boundaries accounted for 67.4% of the total number of grain boundaries. It can be observed from Figure 9c that there were a certain number of large grains in the alloy after 560 °C/2 h annealing. The grain size difference was very significant in the field of view. From Figure 9f, it can be observed that the large-angle grain boundaries of the interior microstructure of the alloy after 560 °C/2 h annealing accounted for 56.3% of the total number of grain boundaries.
Figure 10 is the ODF cross-sectional views of the cold-drawn state and temperature-varying annealed state 5056 aluminum alloy sheet specimens. As can be seen from Figure 10a, the 5056 aluminum alloy wires with a drawing deformation of 60% contain strong textures. The main texture components were at (90°, 45°, 45°) and (30°, 80°, 45°), i.e., {441}<232> with the maximum intensity of 30.3 in the as-drawn state 5056 aluminum alloy. However, compared with the cold-drawn state alloy, after annealing at 400 °C (Figure 10b), the textures after annealing at 400 °C were totally eliminated, which can be attributed to a fully recrystallization microstructure composed of equiaxed grains with nearly random orientations, as shown in Figure 9b. Meanwhile, Figure 10c is the ODF image after secondary recrystallization. It can be seen that the ODFs were still lack of texturing despite the appearance of a few orientations [20].
Figure 11 shows the orientation density of each texture under different conditions. It can be seen from the figure that after annealing at 400 °C and 560 °C, the orientation density of the texture decreases significantly compared with the as-drawn state. This is the same phenomenon as in Figure 9. The drawn wires were annealed at 400 °C and 560 °C, complete recrystallization and secondary recrystallization occurred, which was one of the reasons why the strength of the drawn wire decreased after annealing.

4. Discussion

There are few alloying elements that inhibit recrystallization in 5056 aluminum alloys. The plastic deformation of high-temperature large deformation occurs in the extrusion deformation process, and dynamic recrystallization occurs in the plastic deformation process. The metal flow at the edge is larger in the extrusion deformation process, resulting in a large amount of deformation at the edge of the extrusion poles. According to the Johnson–Meir equation [21,22], the large deformation at the edge of the extrusion poles is responsible for the small size of the recrystallized grains at the edge.
Combined with the microstructure changes, the mechanical properties of the alloy through different annealing processes have been analyzed. From Figure 7 and Figure 8, it can be found that when the annealing time was 2 h and the annealing temperature is in the range of 190 °C to 560 °C, the mechanical properties of the drawn wire after annealing will be greatly reduced compared with the as-drawn wire. The trend can be divided into the following stages:
(1)
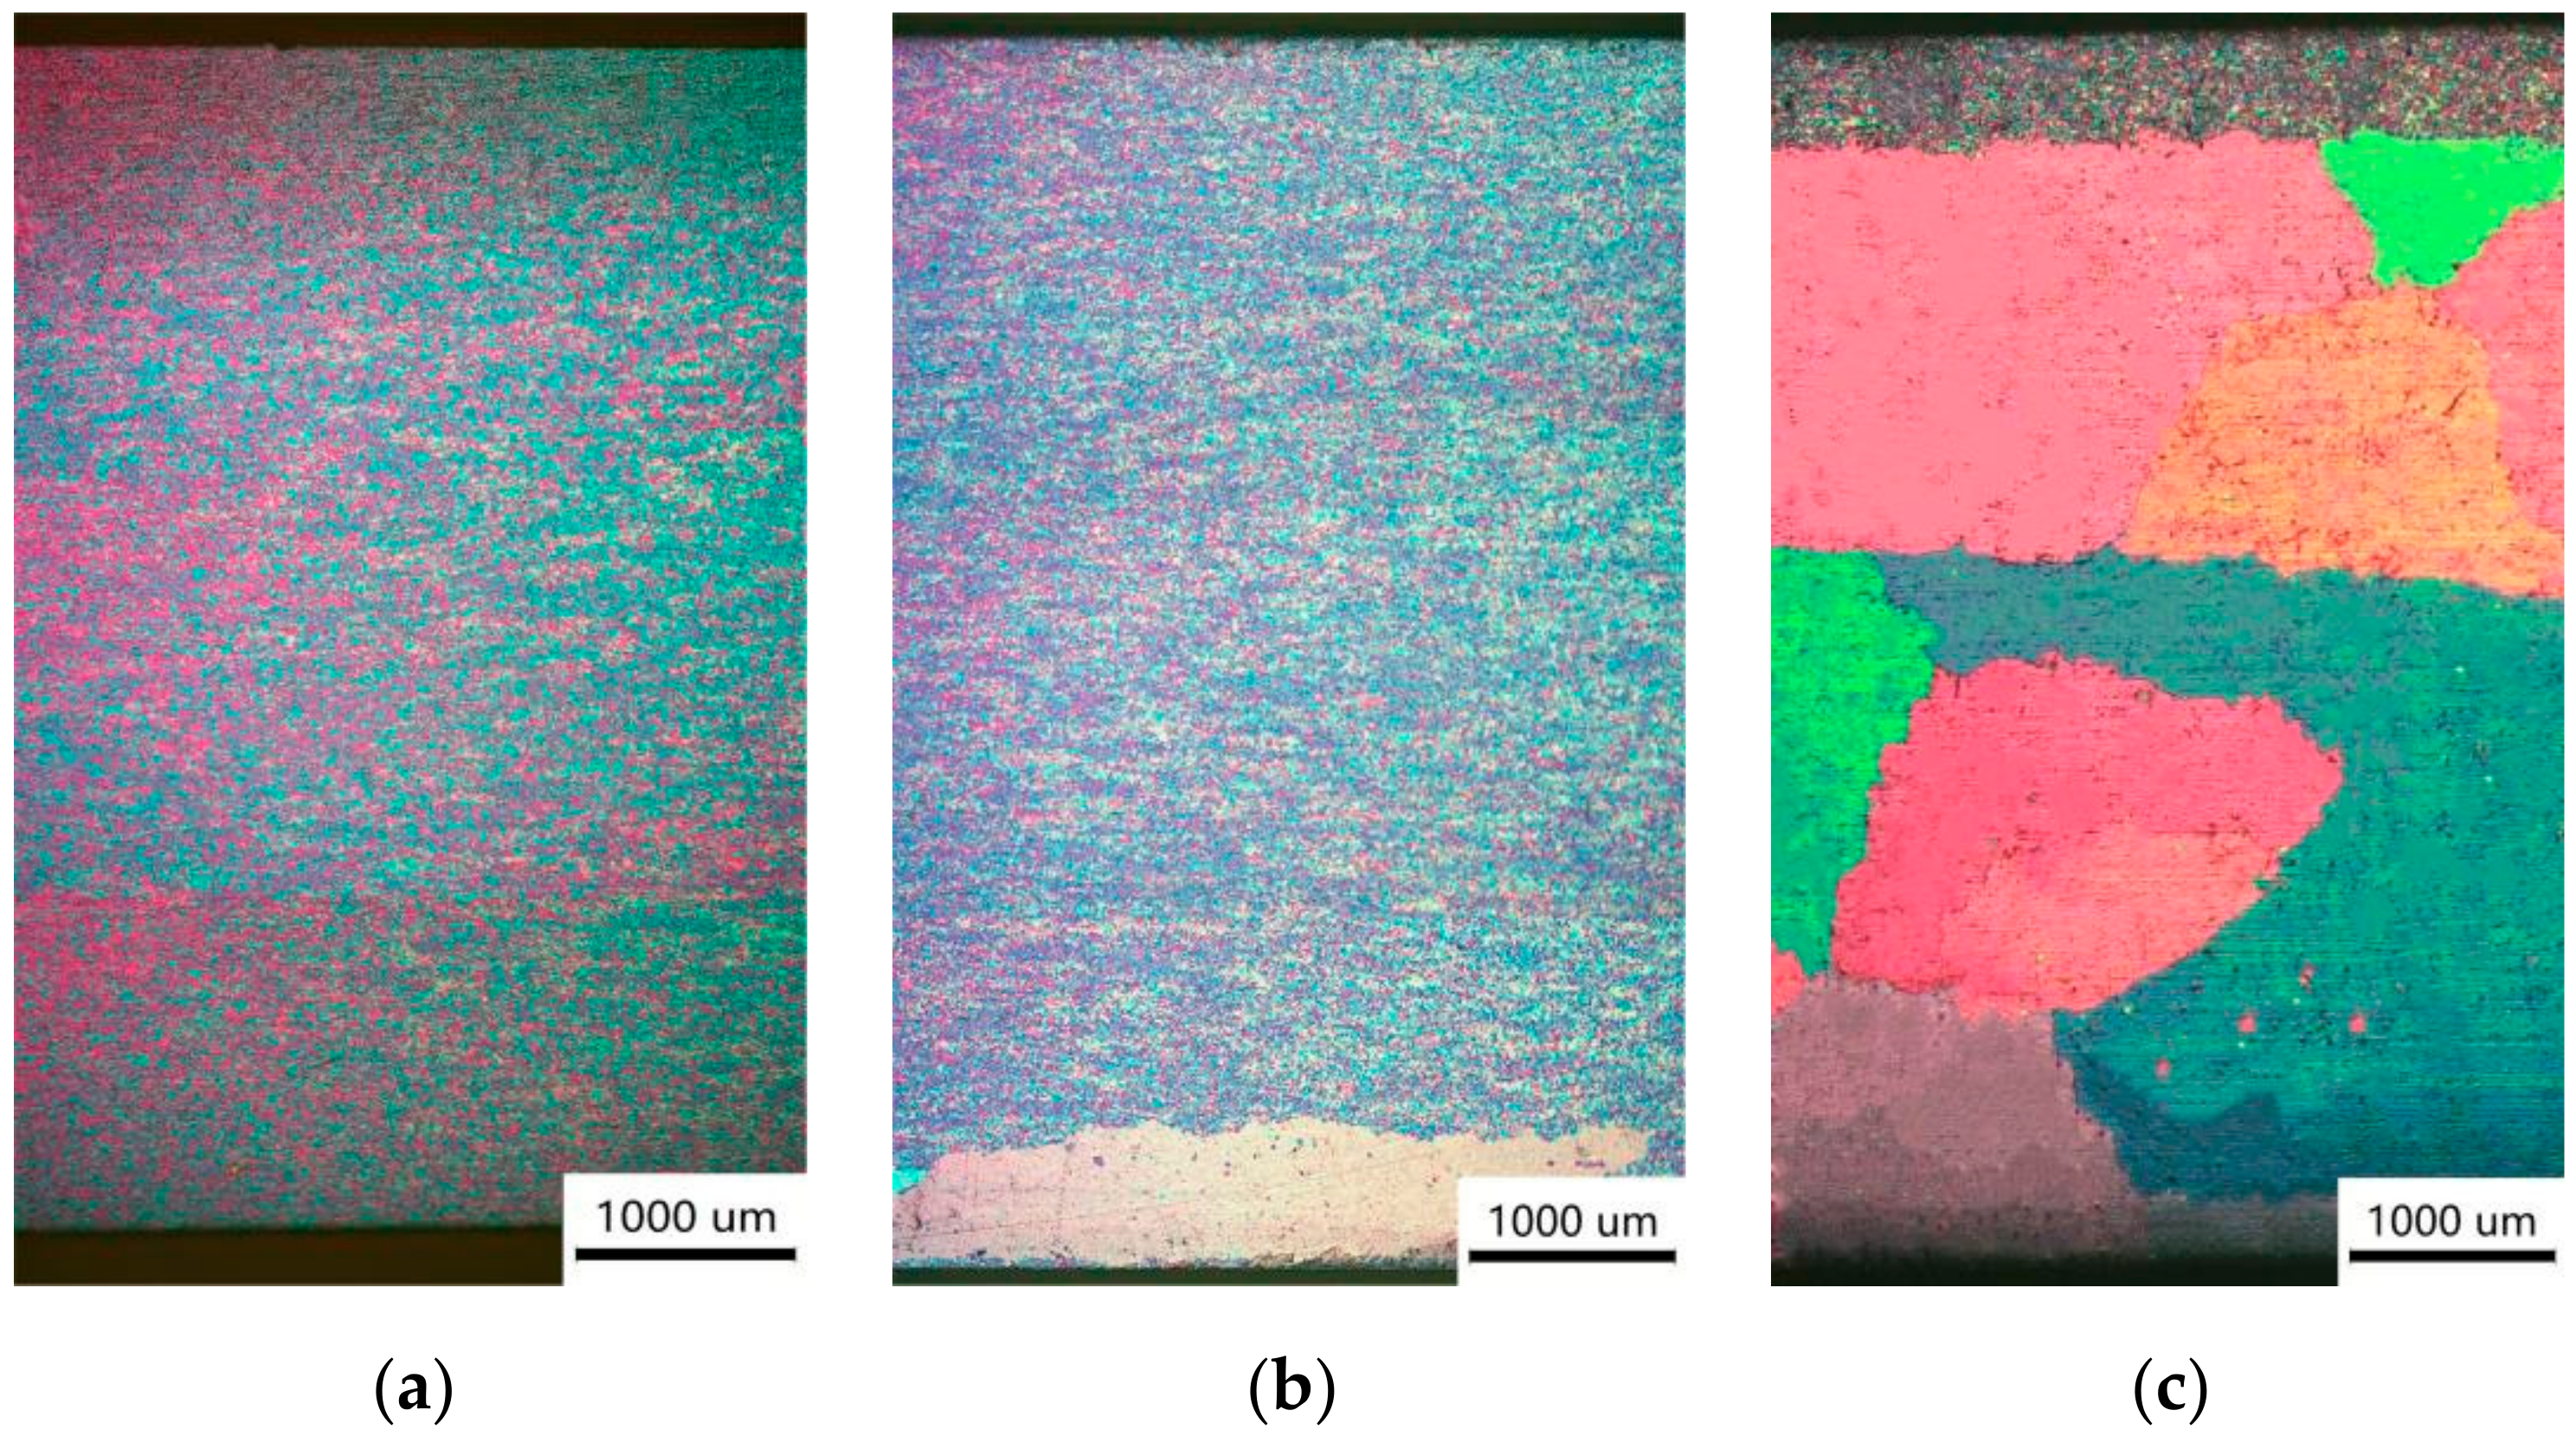
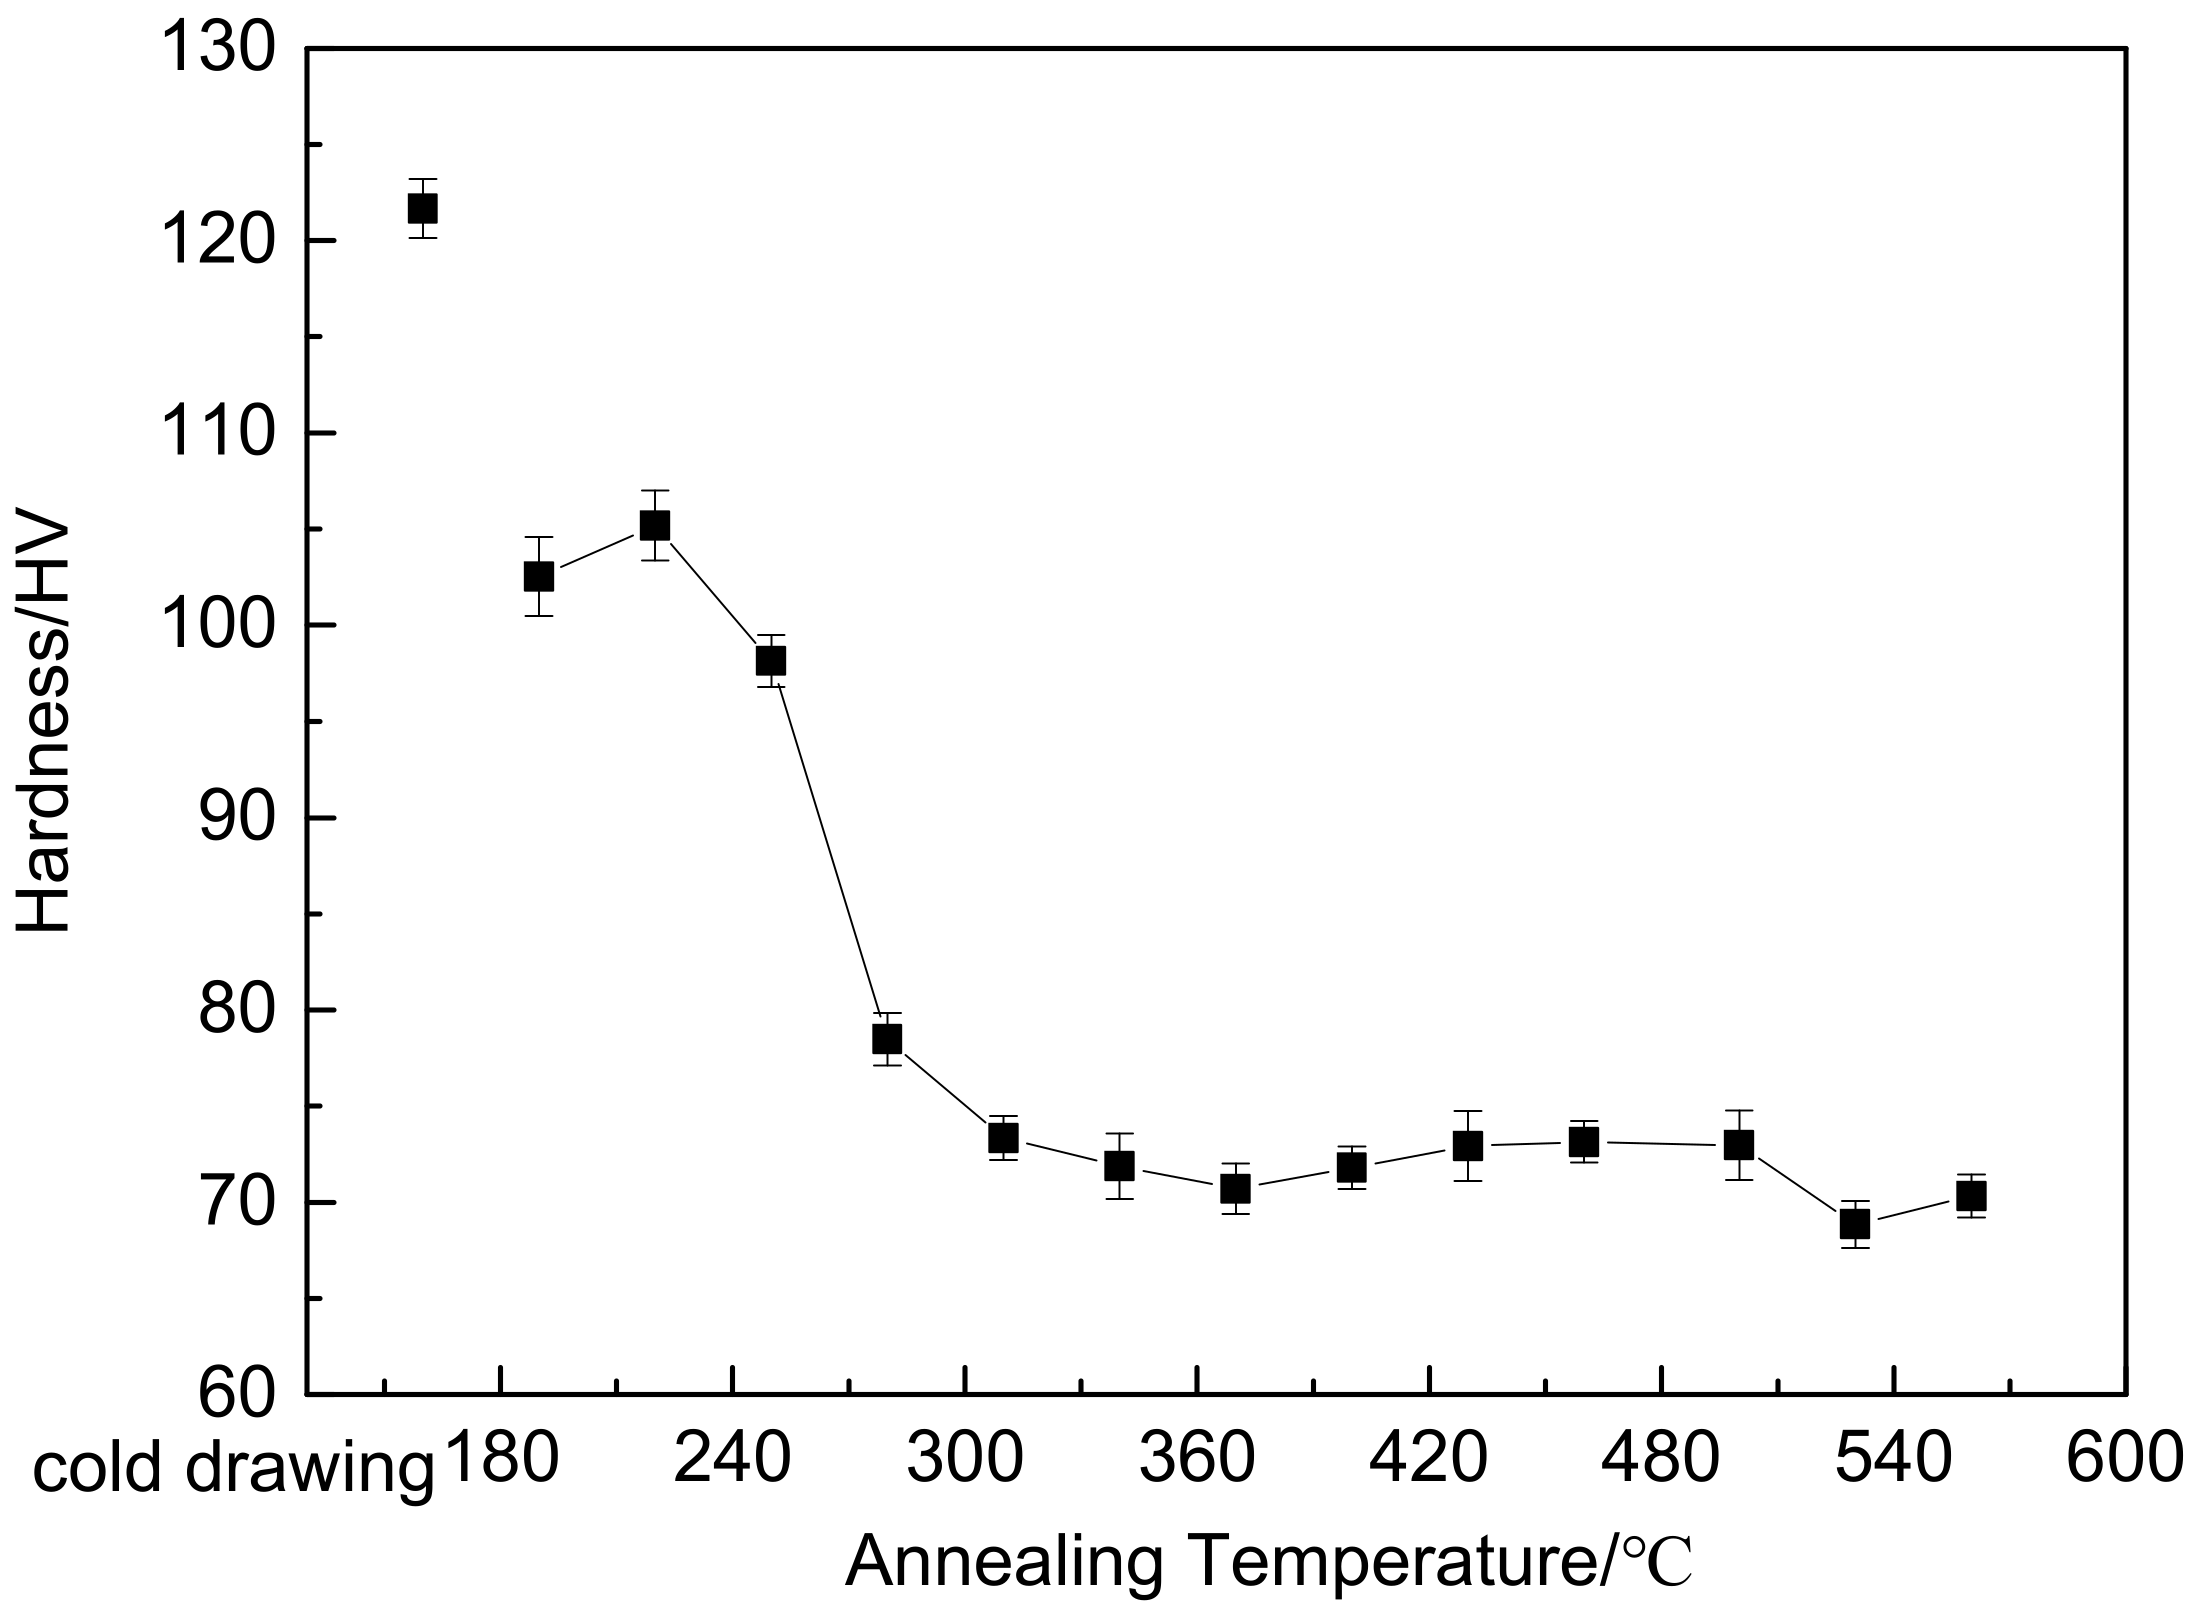
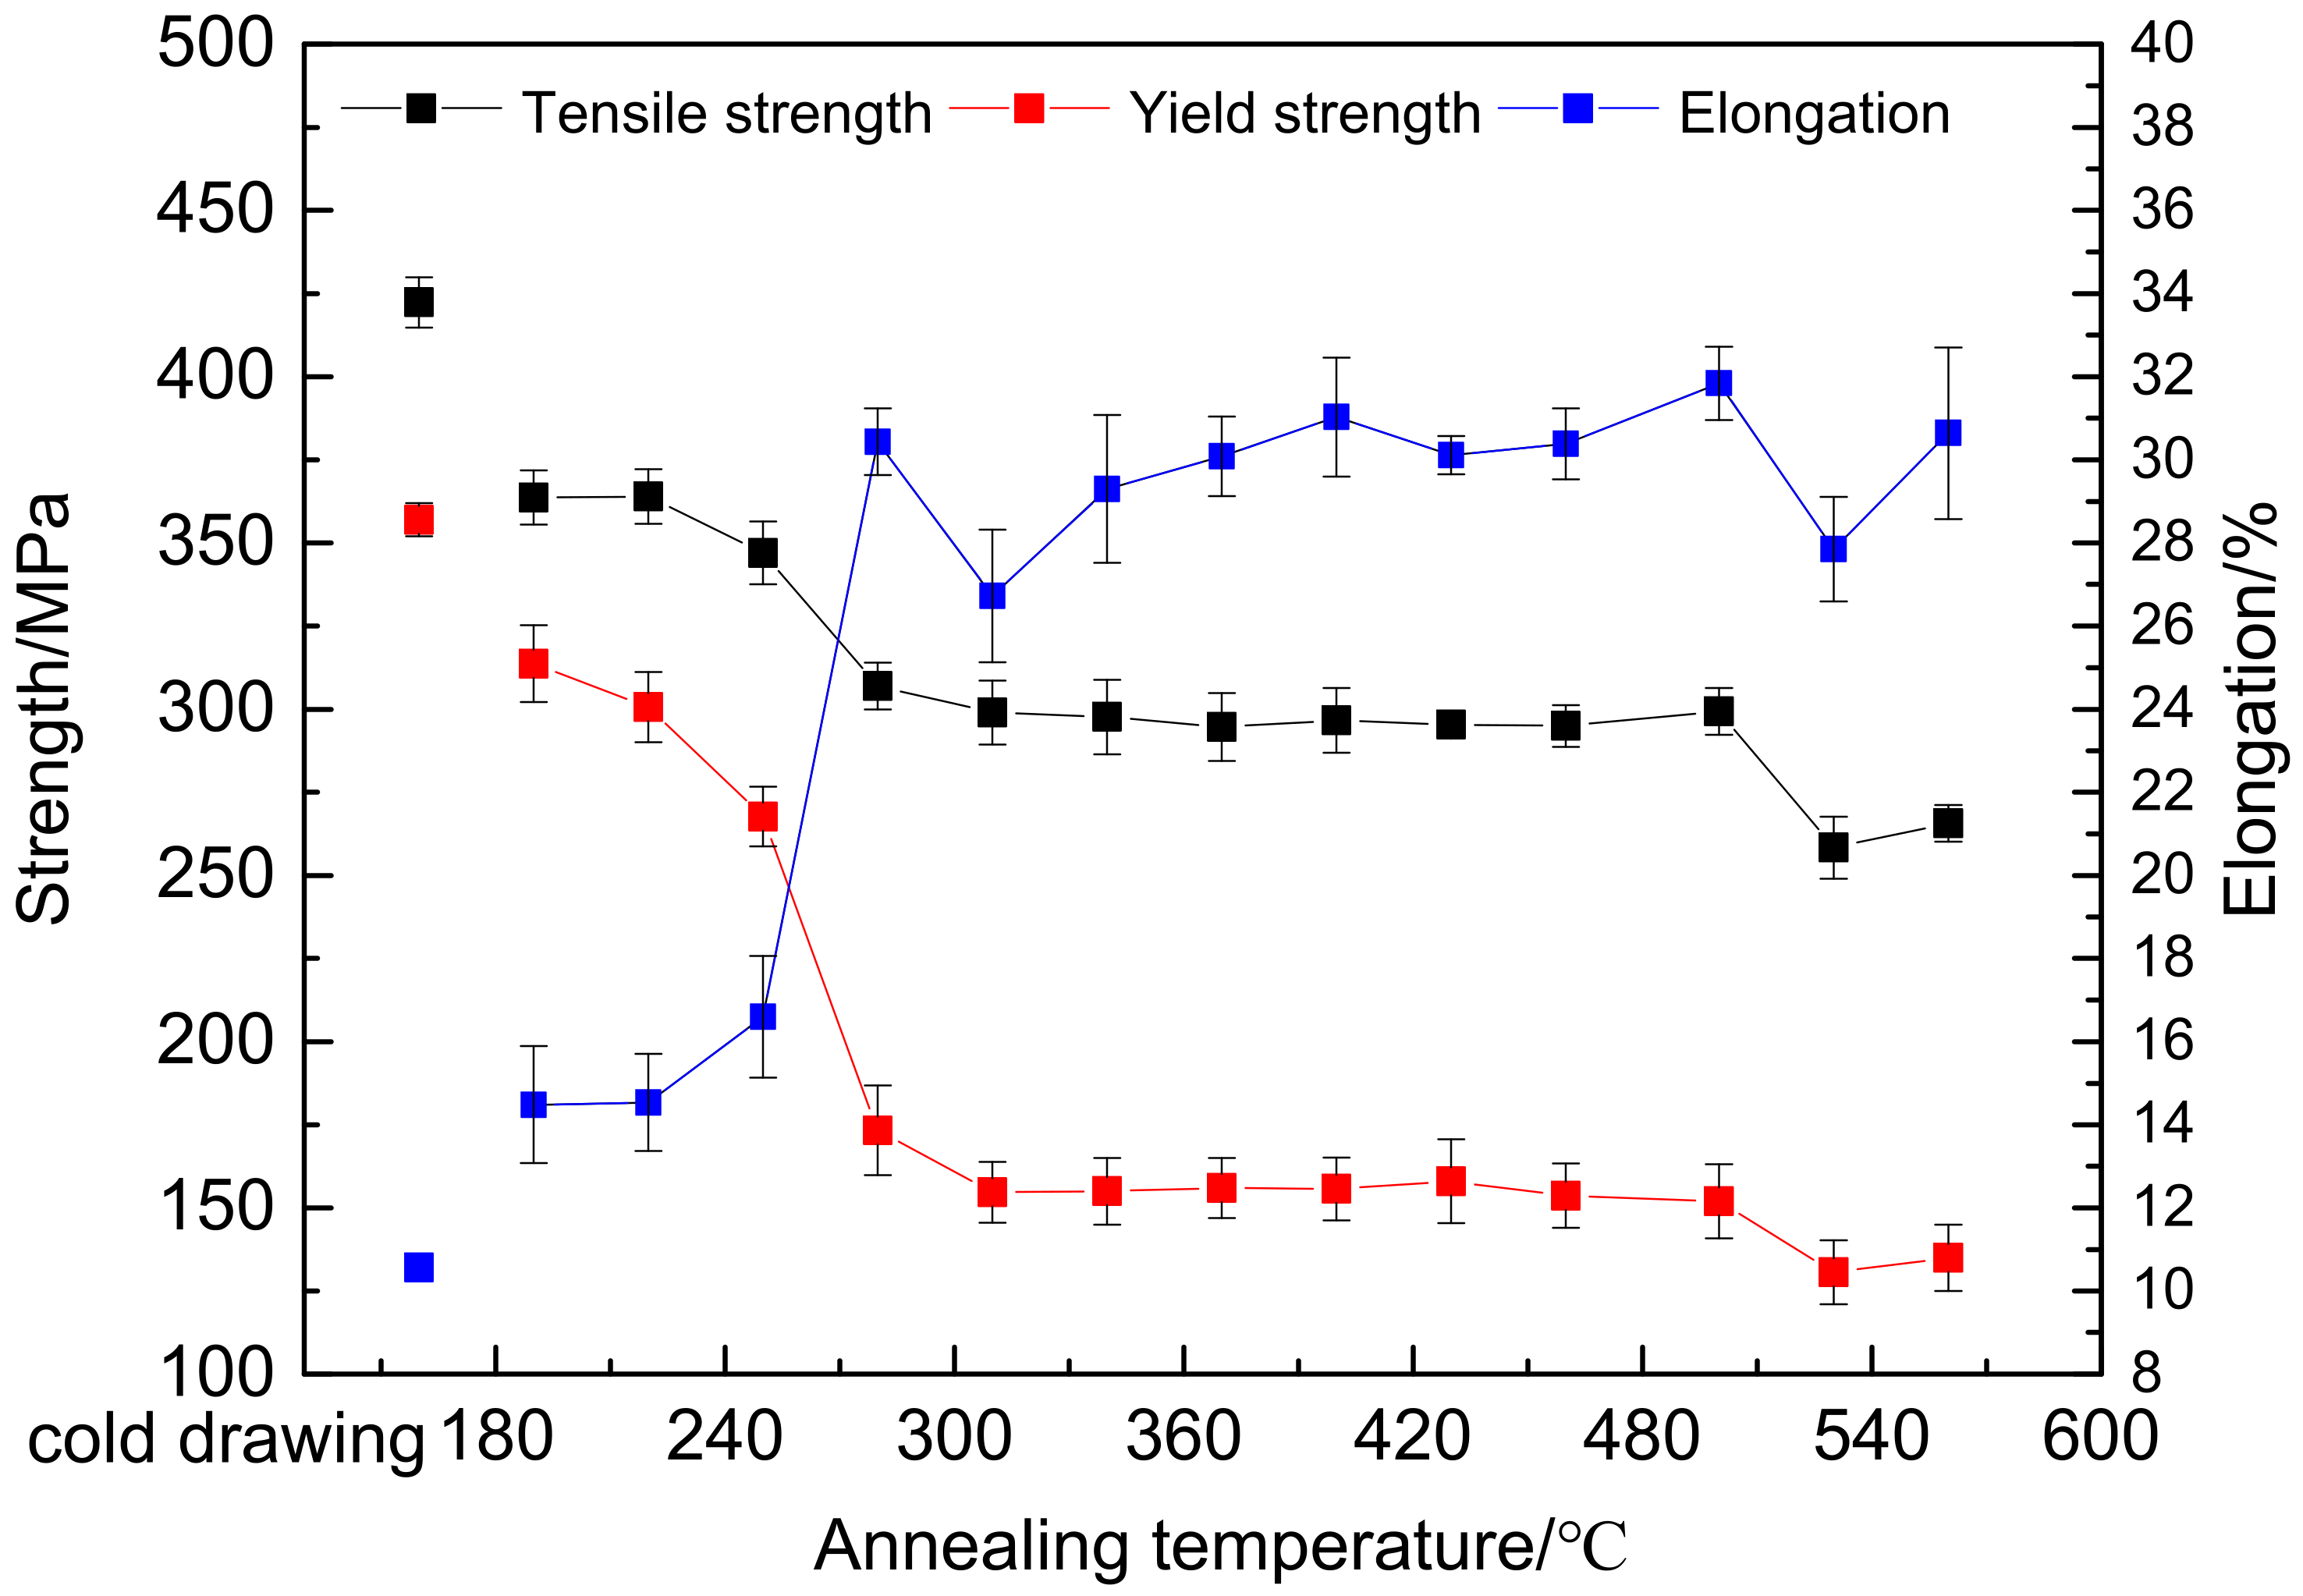
When the annealing temperature is up to 220 °C, the mechanical properties of the drawn wire after annealing are remarkable reduced compared with that of the unannealed drawn wire. Comparing Figure 2 and Figure 4a, it can be found that the grain size of the drawn wire after annealing at 220 °C has no obvious change. Hence, it is believed that the reason for the reduction of the strength of the drawn wire in this stage is dominantly resulted from the release of work-hardening effect at relative temperature;
(2)
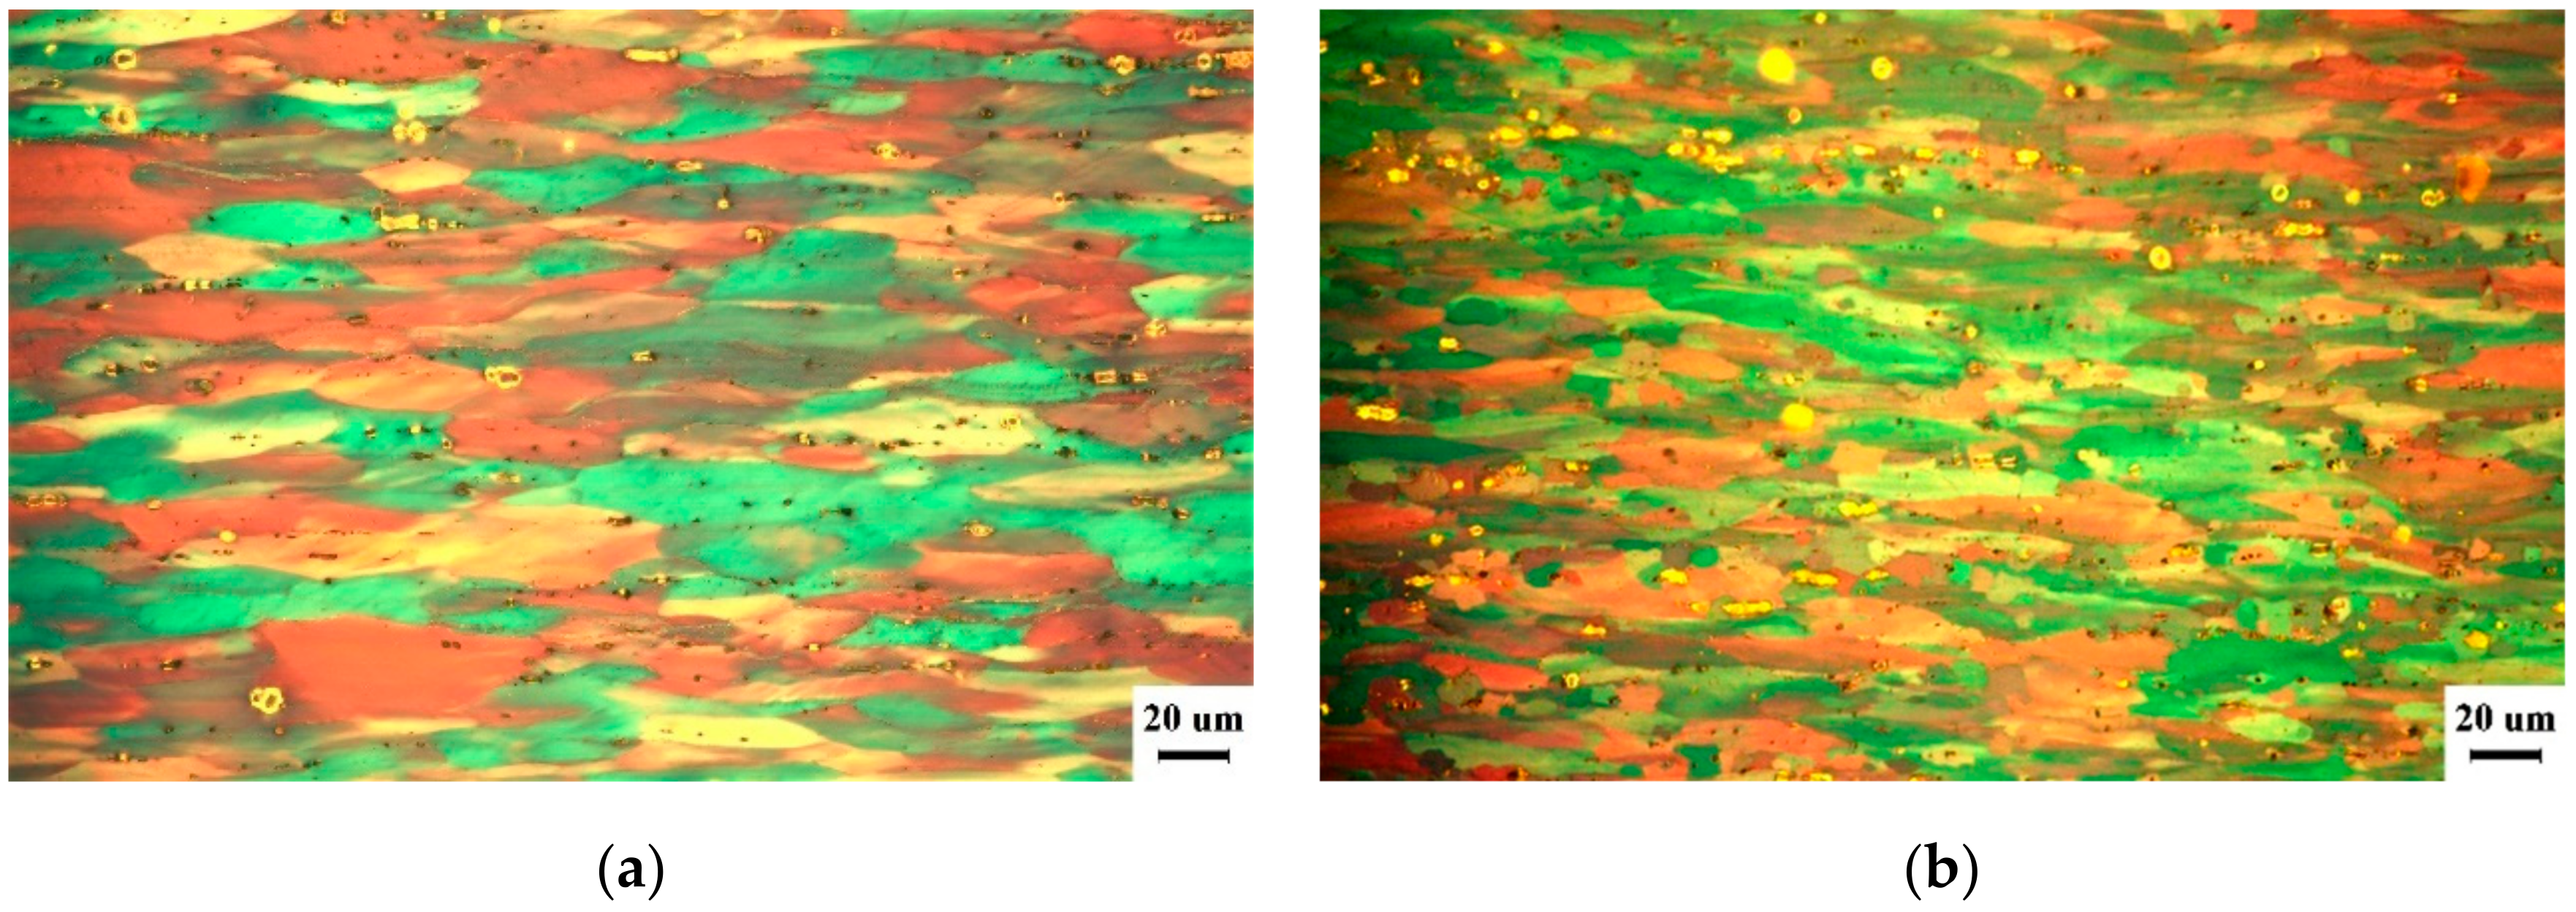
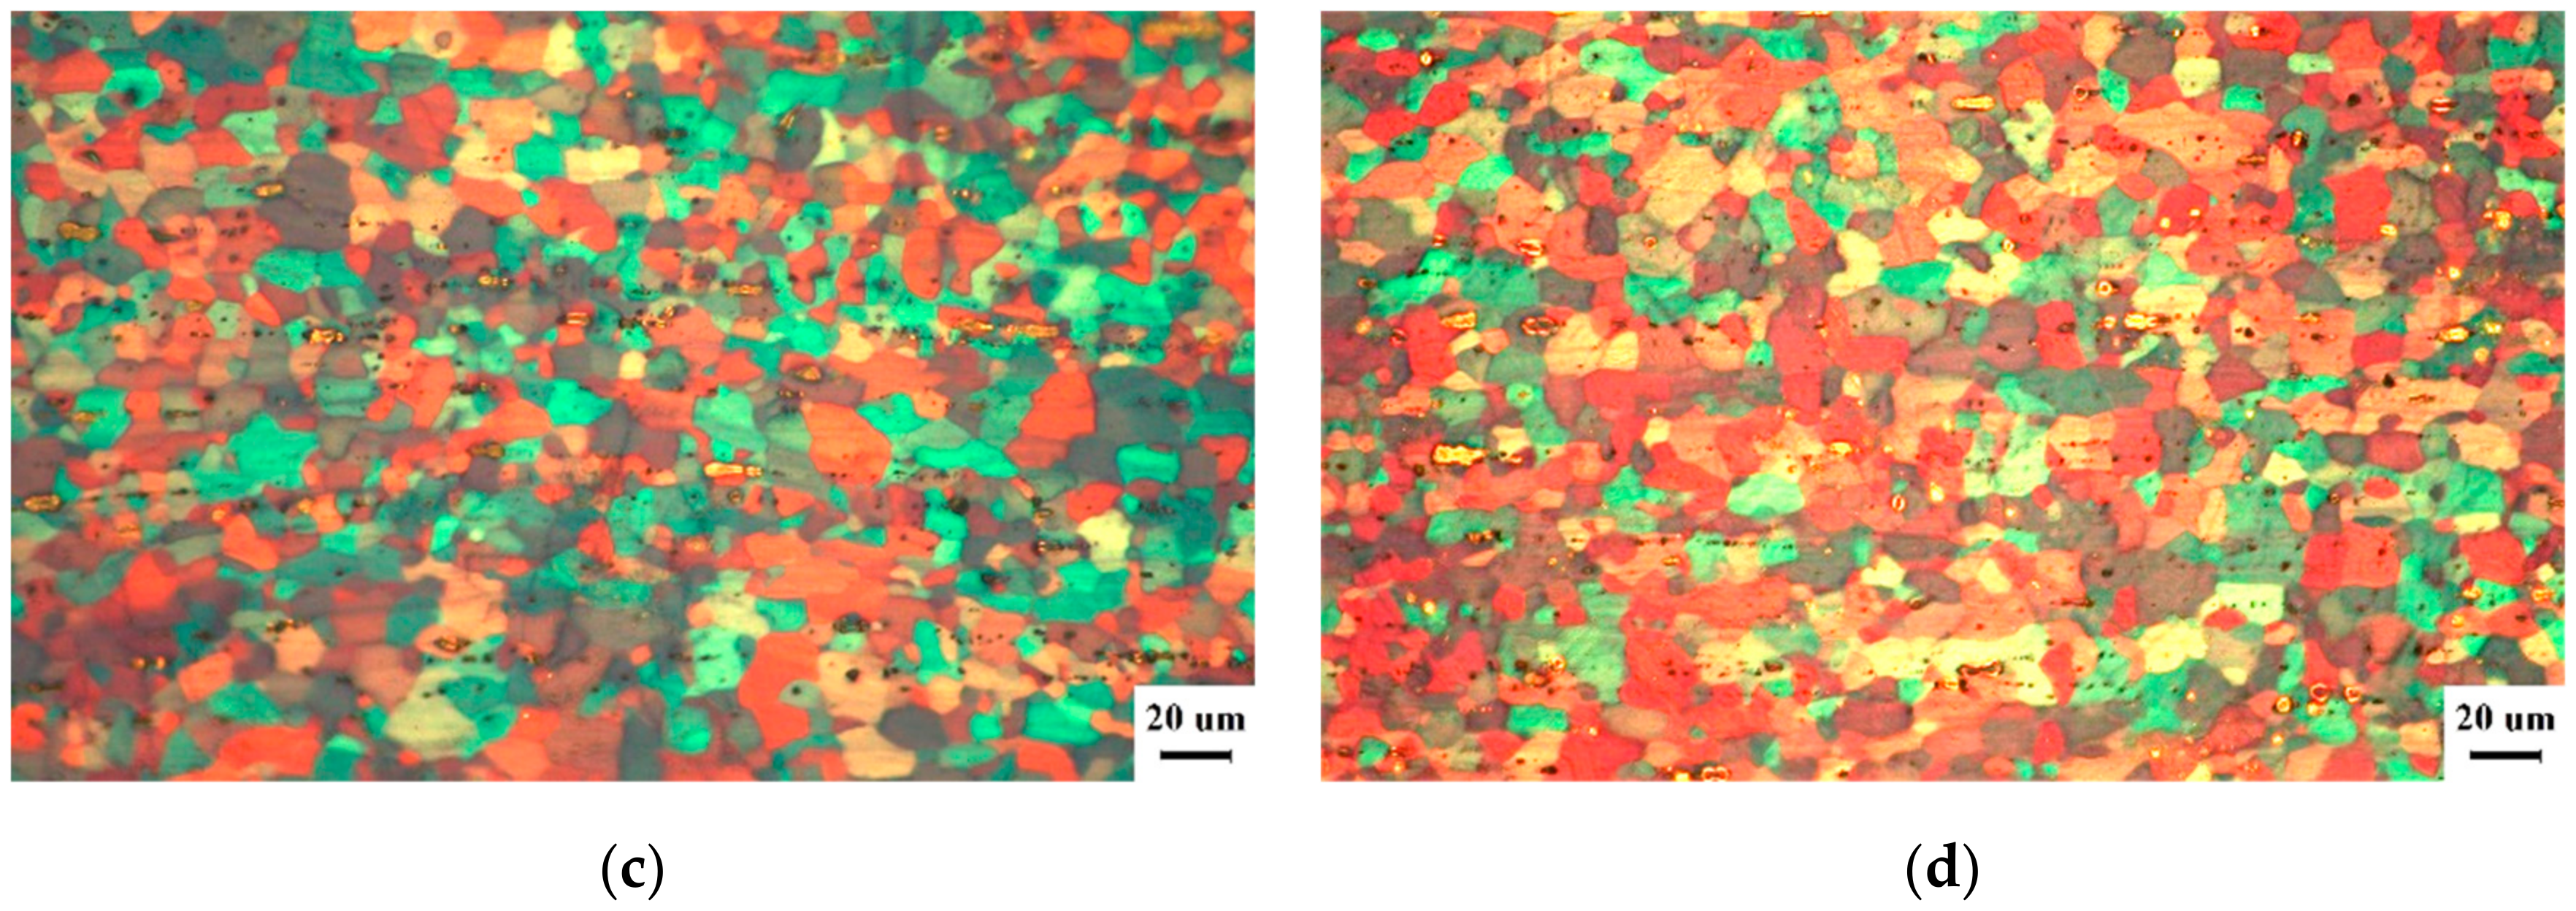
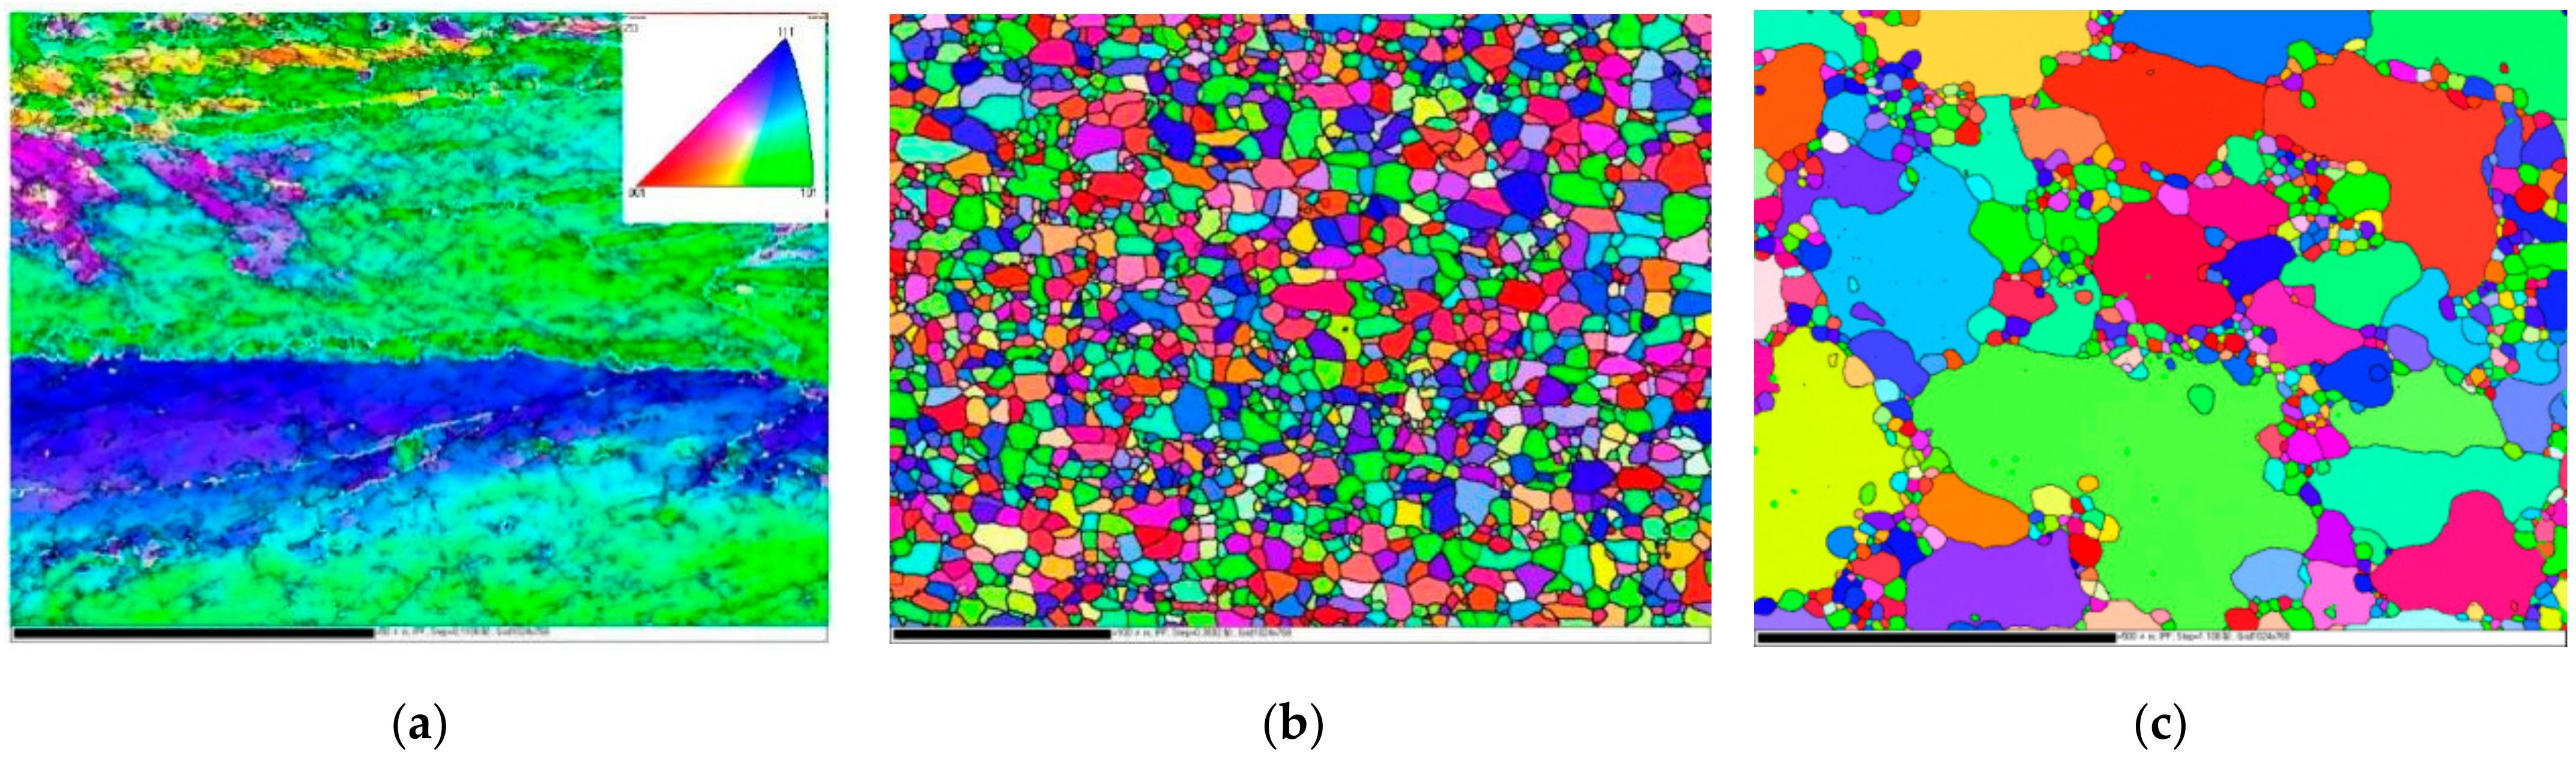
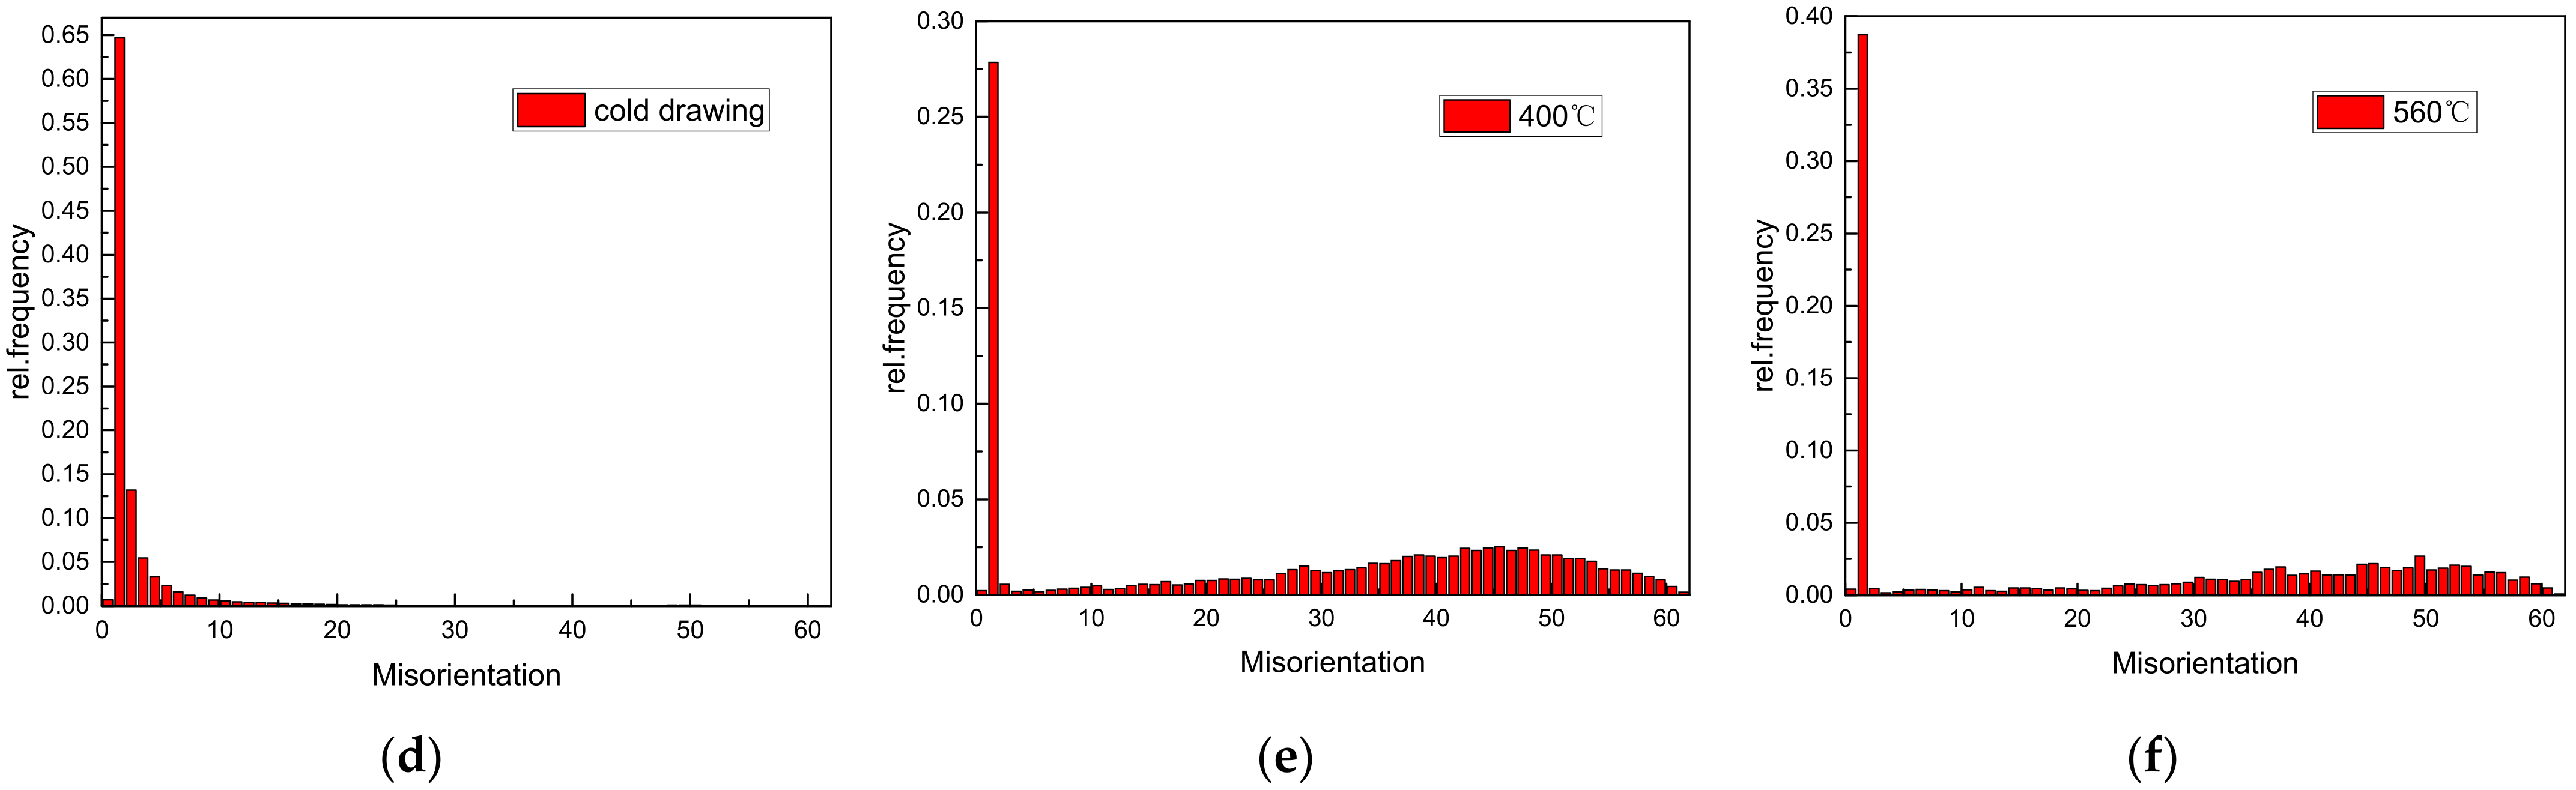
When the annealing temperature increased from 220 °C to 310 °C, the strength of the drawn wires decreases significantly, the elongation increases rapidly, which can be attributed to the static recrystallization during the annealing process. As shown in Figure 4a, the grains are still elongated when annealed at 220 °C while the some fine equiaxed grains along grain boundaries are observed (Figure 4b) when annealed at 250 °C. With further increasing annealing temperature to 310 °C (Figure 4c), all the grains are completely transformed into equiaxed grains. This is due to the fact that the higher the annealing temperature, the greater the driving energy of grain growth, so that the recrystallization of the drawn wire occurs;
(3)
When the annealing temperature increased from 310 °C to 500 °C, the strength of the drawn wires did not change significantly, which can be attributed to the stable stage of grain structure. Comparing Figure 4c,d, it can be found that the grain size of the drawn wire after annealing at 400 °C had no obvious change from that after annealing at 310 °C. From this it can be concluded that the drawn wire is fully recrystallized within this annealing temperature range, and the size change of the recrystallized grains inside the drawn wire is small, so that the hardness and strength of the drawn wire remain stable within this annealing temperature range [23];
Comparing Figure 4, Figure 5 and Figure 6, it is found that when annealed at 530 °C and 560 °C, the alloy underwent secondary recrystallization, and with the increase in the annealing duration, the number of secondarily recrystallized grains inside the alloy increased. The secondary recrystallization of the alloy led to a slight decrease in the hardness and strength of the alloy [24,25]. Furthermore, since the grain size at the annealing temperature of 560 °C was smaller than that at the annealing temperature of 530 °C, the hardness and strength of the alloy annealed at 560 °C were slightly higher than at 530 °C. At this time, the internal strengthening mechanism of the alloy was predominated by solid solution strengthening rather than by fine grain strengthening. Therefore, the strength and hardness of the alloy decreased insignificantly within this annealing temperature range.
The aluminum alloy underwent recovery and recrystallization while annealed, and the deformation texture tended to transform into a recrystallization texture along a specific crystallographic direction. The phenomenon that the constituents of deformation texture remained unchanged while the strength increased in the low-temperature annealing recovery stage has been reported in relevant studies [26,27]. The main reason is that the merger and rotation of substructures in the recovery stage leads to a decrease in the average orientation deviation between adjacent subgrains, so that the grains deviating from the central position of a specific orientation concentrate towards the central position during drawing, thereby increasing the strength of that orientation. As the annealing temperature rises, the alloy undergoes a recrystallization, while the evolution of the recrystallization texture is strongly dependent on the annealing temperature. With the further rise in the annealing temperature, the alloy undergoes secondary recrystallization, resulting in a decrease in the number of grains and an increase in the re-ratio of small-angle grains.

5. Conclusions

(1)
The interior microstructure of 5056 aluminum alloy wires in the as-extruded state is a recrystallization texture, and the size of recrystallized grains at the edge is smaller than at the core; after the 5056 alloy is drawn and deformed by a deformation amount of 60%, its edge texture is rougher and larger than its core texture due to the effect of the nonhomogeneous interior microstructure of the as-extruded state wires;
(2)
After 5056 aluminum alloy cold-drawn state wires were treated at different annealing temperatures, it was found that the hardness and strength of the alloy decreased significantly after annealing. When the annealing temperature reached 250 °C, the alloy became recrystallized; when the annealing temperature increased to 310 °C, it underwent the entire recrystallization. The hardness and strength of the alloy decreased significantly within this annealing temperature range. When the annealing temperature of 5056 aluminum alloy drawing wires was above 310 °C and below 530 °C, the interior microstructure of the alloy was predominated by equiaxial grains, without a significant fluctuation in the mechanical properties of the alloy;
(3)
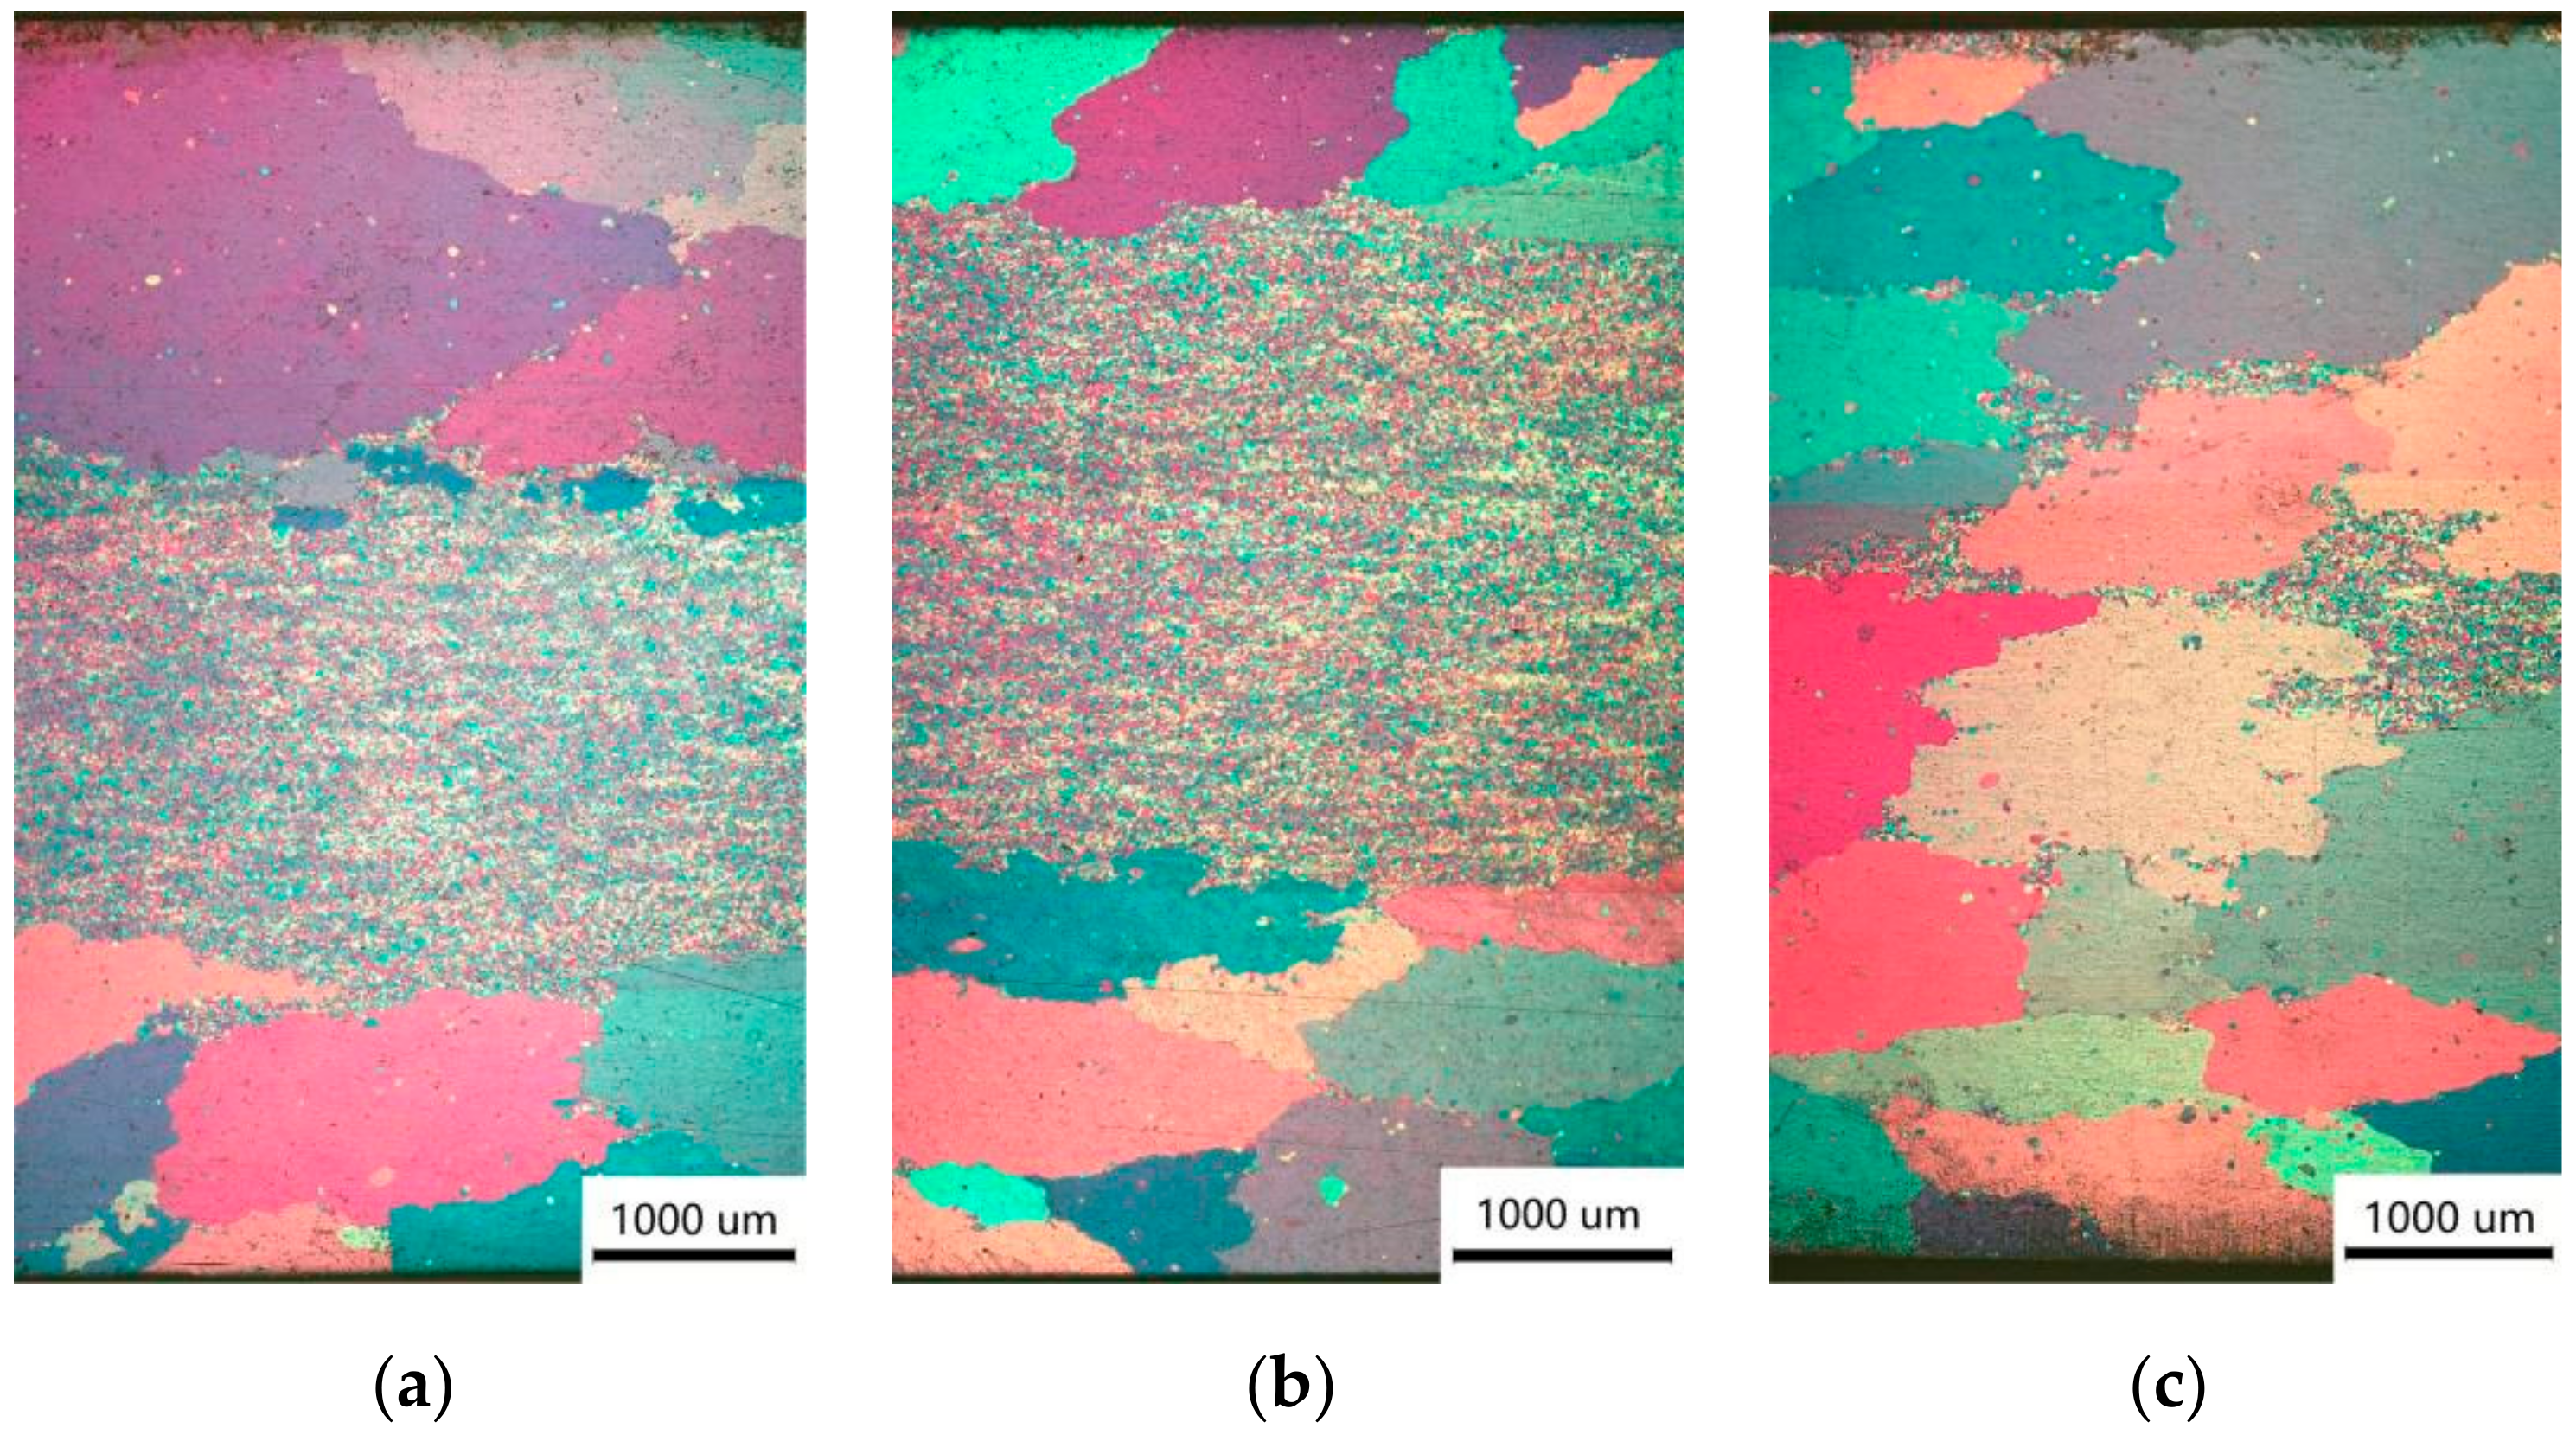
When the annealing temperature reached 530 °C, a few grains grew abnormally, gradually swallowing a large number of equiaxial grains, and the secondary recrystallization occurred. With the prolongation of the annealing duration, the number of secondarily recrystallized grains increased, at which time the hardness and strength of the alloy decreased. When the annealing temperature reached 560 °C, the size of the secondarily recrystallized grains was smaller than that at the annealing temperature of 530 °C, at which time the hardness and strength of the alloy were higher than when it was annealed at 530 °C.
(4)
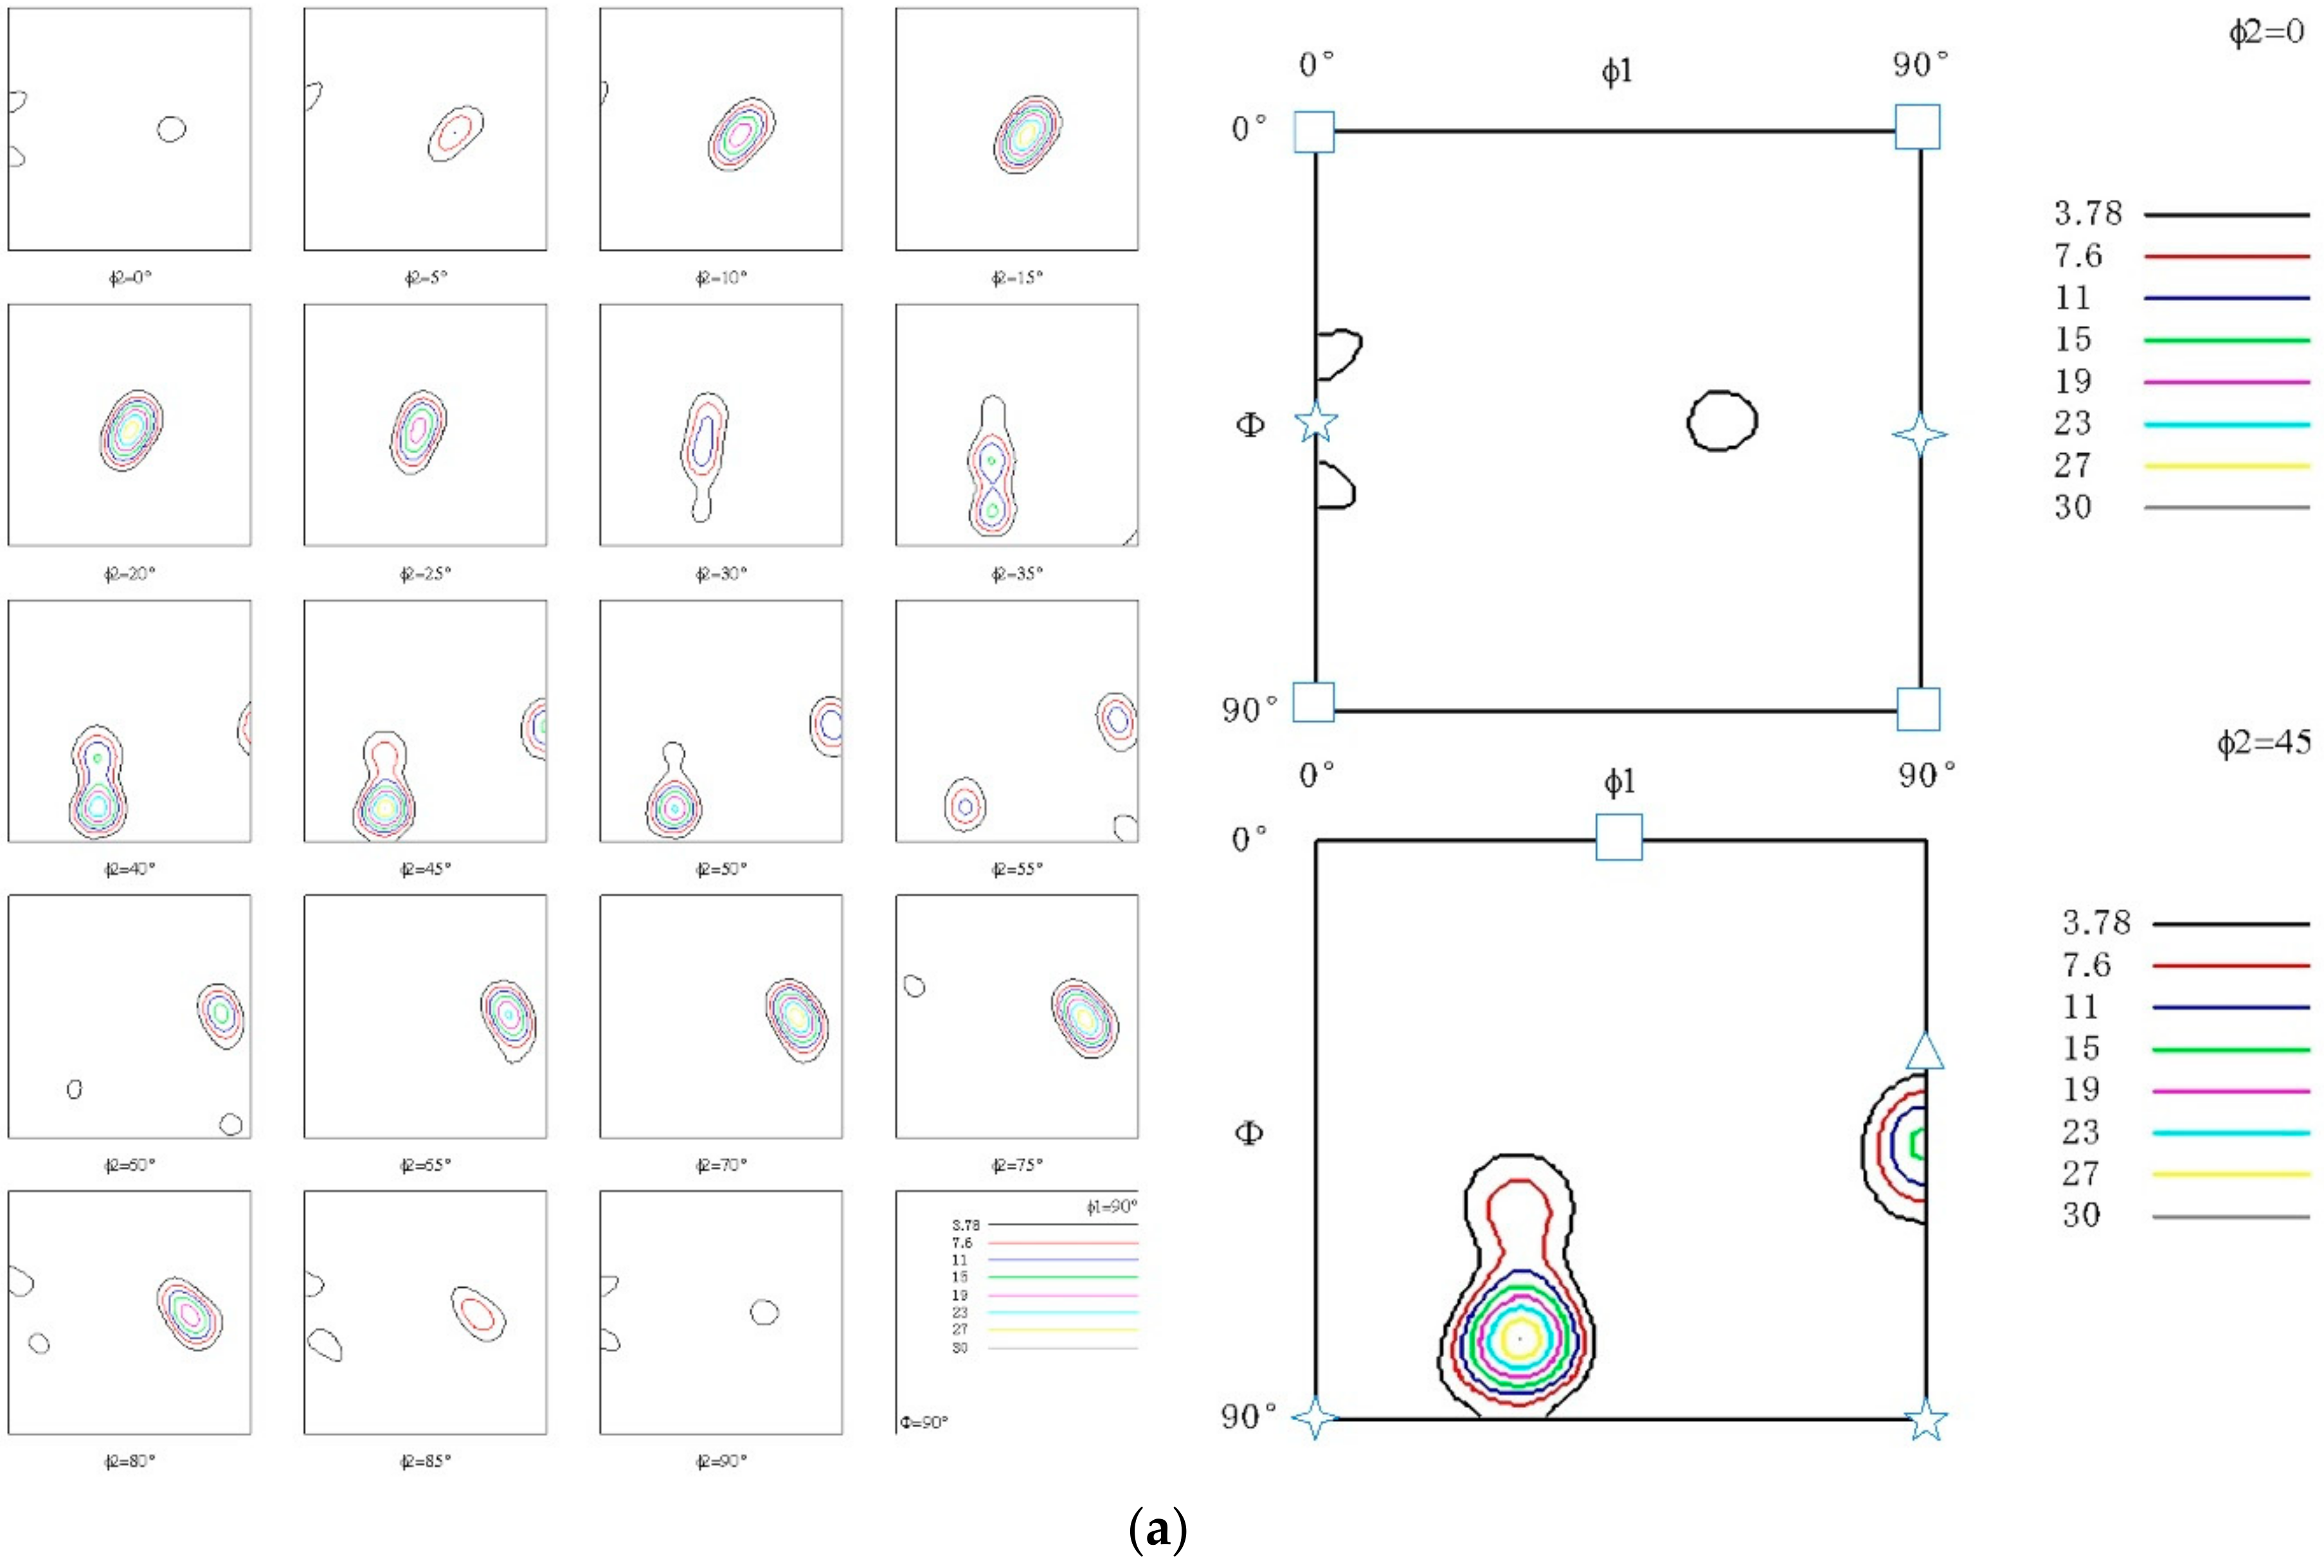
A strong microstructure predominated by a fiber texture was produced from the cold-drawn 5056 aluminum alloy wires. After recrystallization, the fiber texture transformed into the recrystallization texture. The strength of the recrystallization texture somewhat declined as compared to that of the cold-deformed 5056 aluminum alloy wires.

Author Contributions

Conceptualization, G.W. and K.L.; methodology, G.W. and C.P.; investigation, C.P., B.Z., Q.L. and P.L.; writing—original draft preparation, G.W. and C.P.; writing—review and editing, Z.X., G.W. and K.L.; supervision, G.W. and K.L. All authors have read and agreed to the published version of the manuscript.

Funding

This research was funded by the Fundamental Research Funds for the Central Universities (Nos. N2109006, N2002025).

Institutional Review Board Statement

Not applicable.

Informed Consent Statement

Not applicable.

Data Availability Statement

Not applicable.

Conflicts of Interest

The authors declare no conflict of interest. The funders had no role in the design of the study.

References

  1. Baudouy, B.; Four, A. Low temperature thermal conductivity of aluminum alloy 5056. Cryogenics 2014, 60, 1–4. [Google Scholar] [CrossRef]
  2. Ma, C.G.; Qi, S.Y.; Li, S. Melting purification process and refining effect of 5083 Al–Mg alloy. Trans. Nonferrous Met. Soc. China 2014, 24, 1346–1351. [Google Scholar] [CrossRef]
  3. Park, S.H.; Kim, J.S.; Han, M.S. Corrosion and optimum corrosion protection potential of friction stir welded 5083-O Al alloy for leisure ship. Bull. Chin. Soc. Nonferrous Met. Engl. Version 2009, 19, 6. [Google Scholar] [CrossRef]
  4. Barucci, M.; Ligi, C.; Lolli, L. Very low temperature specific heat of Al 5056. Phys. B Phys. Condens. Matter 2010, 405, 1452–1454. [Google Scholar] [CrossRef]
  5. Li, H.Z.; Gao, F.; Li, P.W.; Liang, X.P. Effect of annealing temperature on the texture and plastic anisotropy of cold-rolled 5083 aluminum alloy. J. Mater. Heat Treat. 2020, 41, 57–65. [Google Scholar]
  6. Jiang, J.Y.; Lai, S.B.; Lu, L.Y.; Fang, J.; Liu, G.; Meng, S.; Jiang, F. Research progress of 5XXX series aluminum-magnesium alloys. Manned Spacefl. 2019, 25, 411–418. [Google Scholar]
  7. Cho, C.H.; Son, K.T.; Lee, J.C.; Kim, S.K.; Yoon, Y.O.; Hyun, S.K. Effect of the Mg contents on the annealing mechanism and shear texture of Al–Mg alloys—ScienceDirect. Mater. Sci. Eng. A 2020, 786, 139741. [Google Scholar] [CrossRef]
  8. Nitol, M.S.; Adibi, S.; Barrett, C.D. Solid solution softening in dislocation-starved Mg–Al alloys. Mech. Mater. 2020, 150, 103588. [Google Scholar] [CrossRef]
  9. Humphreys, F.J.; Hatherl, M. Recrystallization and Related Annealing Phenomena; Elseiver Science: Oxford, UK, 1995. [Google Scholar]
  10. Gholinia, A.; Humphreys, F.J.; Prangnell, P.B. The Texture of Ultra-Fine Grained Al-Mg Alloys. Mater. Sci. Forum 2002, 408–412, 1519–1524. [Google Scholar] [CrossRef]
  11. Leng, J.F.; Ren, B.H.; Zhou, Q.B.; Zhao, J.W. Effect of Sc and Zr on recrystallization behavior of 7075 aluminum alloy. Trans. Nonferrous Met. Soc. China 2021, 31, 2545–2557. [Google Scholar] [CrossRef]
  12. Zhao, X.B. Grain Growth and Texture Changes During Annealing of Aluminum-Magnesium Alloys. J. Zhejiang Univ. (Nat. Sci. Ed.) 1994, 03, 268–272. [Google Scholar]
  13. Li, Z.; Yi, D.; Tan, C. Investigation of the stress corrosion cracking behavior in annealed 5083 aluminum alloy sheets with different texture types. J. Alloys Compd. 2019, 817, 152690. [Google Scholar] [CrossRef]
  14. Ma, P.C.; Zhang, D.; Zhuang, L.Z.; Zhang, J.S. Effects of Cold Rolling Process and Annealing Temperature on Microstructure and Properties of Al-Mg Alloy. Chin. J. Mater. Sci. Eng. 2014, 32, 792–797. [Google Scholar]
  15. Liu, J.N.; Wang, L.; Wan, G.; Wu, B.L.; Yu, H. Effect of Annealing on the Texture of 5B02 Aluminum Alloy Tube. J. Shenyang Univ. Aeronaut. Astronaut. 2013, 30, 72–76. [Google Scholar]
  16. Lin, S.; Nie, Z.; Hui, H. Annealing behavior of a modified 5083 aluminum alloy. Mater. Des. 2010, 31, 1607–1612. [Google Scholar] [CrossRef]
  17. Jiang, J.; Jiang, F.; Zhang, M. Effect of continuity of annealing time on the recrystallization behavior of Al-Mg-Mn-Sc-Zr alloy. Mater. Lett. 2020, 275, 128208. [Google Scholar] [CrossRef]
  18. Son, H.W.; Lee, J.C.; Cho, C.H. Effect of Mg content on the dislocation characteristics and discontinuous dynamic recrystallization during the hot deformation of Al-Mg alloy. J. Alloys Compd. 2021, 887, 161397. [Google Scholar] [CrossRef]
  19. Pan, H.J.; Qiu, S.T. Formation mechanism of secondary recrystallization of columnar grain high silicon electrical steel. Iron Steel 2019, 54, 7. [Google Scholar]
  20. Gao, Q.; Wang, X.H.; Li, J. Effect of aluminum on secondary recrystallization texture and magnetic properties of grain-oriented silicon steel. J. Iron Steel Res. Engl. 2021, 28, 9. [Google Scholar] [CrossRef]
  21. Li, F.; Liu, X.J.; Yuan, S.J. Effect of frictional conditions on flow behavior of aluminum alloy extrusion deformation. Chin. J. Nonferrous Met. 2008, 18, 6. [Google Scholar]
  22. Ding, S.; Zhang, J.; Khan, S.A.; Sato, Y.; Yanagimoto, J. Metadynamic recrystallization in A5083 aluminum alloy with homogenized and as-extruded initial microstructures. Mater. Sci. Eng. A 2022, 838, 142789. [Google Scholar] [CrossRef]
  23. Xyla, B.; Wjxa, B.; Jhca, B. Dynamic recrystallization, texture and mechanical properties of high Mg content Al–Mg alloy deformed by high strain rate rolling. Trans. Nonferrous Met. Soc. China 2021, 31, 2885–2898. [Google Scholar]
  24. She, X.W.; Jiang, X.Q.; Wang, P.Q.; Tang, B.B.; Chen, K.; Liu, Y.J.; Cao, W.N. Relationship between microstructure and mechanical properties of 5083 aluminum alloy thick plate. Trans. Nonferrous Met. Soc. China 2020, 30, 1780–1789. [Google Scholar] [CrossRef]
  25. Li, J.; Kim, S.; Lee, T.M. The effect of prestrain and subsequent annealing on the mechanical behavior of AA5182-O. Mater. Sci. Eng. A 2011, 528, 3905–3914. [Google Scholar] [CrossRef]
  26. Liu, W.C.; Man, C.S.; Raabe, D. Effect of hot and cold deformation on the recrystallization texture of continuous cast AA 5052 aluminum alloy. Scr. Mater. 2005, 53, 1273–1277. [Google Scholar] [CrossRef]
  27. Xiong, B.Q.; Zhang, Y.; Zhu, B.H. Research on Ultra-High Strength Al-11Zn-2.9Mg-1.7Cu Alloy Prepared by Spray Forming Process. Mater. Sci. Forum 2005, 475–479, 2785–2788. [Google Scholar] [CrossRef]
Figure 1. The polarization structure of the 5056 aluminum alloy extruded rod of φ9.5 mm after planing along the axis direction.
Metals 12 00823 g001
Figure 2. The polarized light microstructure of 5056 aluminum alloy drawn wires of φ6 mm after being planed axially.
Metals 12 00823 g002
Figure 3. Metallographic photographs of the as-extruded and as-drawn states: (a) As-extruded state (b) As-drawn state.
Metals 12 00823 g003
Figure 4. The polarized-light microstructure of a φ6 mm thick 5056 aluminum alloy wire after 2-h annealing: (a) 220 °C; (b) 250 °C; (c) 310 °C; (d) 400 °C.
Metals 12 00823 g004aMetals 12 00823 g004b
Figure 5. The polarized-light microstructure of as-drawn state 5056 aluminum alloy wires after thermal insulation at 530 °C for different durations: (a) 10 min; (b) 20 min; (c) 60 min.
Metals 12 00823 g005
Figure 6. The polarized-light microstructure of as-drawn state 5056 aluminum alloy wires after thermal insulation at 560 °C for different durations: (a) 5 min; (b) 10 min; (c) 20 min.
Metals 12 00823 g006
Figure 7. Vickers hardness of a cold-drawn 5056 aluminum alloy after annealing at different temperatures.
Metals 12 00823 g007
Figure 8. Tensile property curves of a cold-drawn 5056 aluminum alloy after annealing at different temperatures.
Metals 12 00823 g008
Figure 9. Curves and distribution of grain boundary misorientation angles after a 5056 aluminum alloy was annealed at different temperatures: (a,d) cold-drawn state; (b,e) 400 °C; (c,f) 560 °C.
Metals 12 00823 g009aMetals 12 00823 g009b
Figure 10. ODF cross-sectional views of a 5056 aluminum alloy after annealing at different temperatures (a) cold drawing; (b) 400 °C; (c) 560 °C.
Metals 12 00823 g010aMetals 12 00823 g010b
Figure 11. Orientation density of textures of the 5056 aluminum alloy was annealed at different temperatures (a) α-fiber; (b) β-fiber.
Metals 12 00823 g011
Table 1. Mass fraction of 5056 aluminum alloy elements.
ElementCuMgMnZnCrFeSiAl
Nominal0.104.5–5.60.05–0.200.100.05–0.20.400.30Bal
Experimental0.0035.010.160.010.150.120.04Bal
Publisher’s Note: MDPI stays neutral with regard to jurisdictional claims in published maps and institutional affiliations.

