Article

Role of Cr Content in Microstructure, Creep, and Oxidation Resistance of Alumina-Forming Austenitic Alloys at 850–900 °C

1
Materials Science and Technology Division, Oak Ridge National Laboratory, Oak Ridge, TN 37830, USA
2
Center for Nanophase Materials Sciences, Oak Ridge National Laboratory, Oak Ridge, TN 37830, USA
*
Author to whom correspondence should be addressed.
Metals 2022, 12(5), 717; https://doi.org/10.3390/met12050717
Submission received: 15 March 2022 / Revised: 16 April 2022 / Accepted: 21 April 2022 / Published: 23 April 2022
(This article belongs to the Special Issue Heat Resistant Steels and Alloys)

Abstract

:
Creep-rupture properties and oxidation behavior of a series of alumina-forming austenitic (AFA) alloys with variations of Cr contents, based on Fe-(13.5-18)Cr-25Ni-4Al-1.5Nb-0.1C in weight percent, have been evaluated at 850–900 °C. The study investigates material responses in the properties and microstructure through compositional modifications in AFA alloys, targeting performance optimization of alloys under high-temperature, corrosive industrial environments. The creep-rupture life of the alloys at 850 °C and 30MPa monotonically decreased with increasing Cr content, which was correlated with changes in secondary phase volume fractions, such as the reduction in B2-NiAl + Laves-Fe2Nb and increase in Sigma-FeCr with Cr content. The oxidation test at 900 °C in a water-vapor containing environment revealed a range of Cr content from 13.9 to 15.7 wt.%, enabling the formation of stable, protective external alumina scale as well as preventing internal oxidation/nitridation for up to total 7000 h exposure. On the other hand, the alloys with >16.7 wt.% Cr formed Sigma precipitates, which caused a reduction in not only Cr but also Al in the austenite matrix, resulting in less oxidation resistance than other alloys. The findings will guide the further optimization of material performance in the AFA alloy series.

1. Introduction

The demands of improved material durability are continuously increased for use under extreme industrial environments, such as high-temperature, high stress, and oxidation/corrosive atmospheres, as structural applications in energy conversion plants, chemical/petrochemical production plants, and so on [1]. The balance of material performances including mechanical properties, surface protection, manufacturability, and cost affordability would be key for material selection, although commercially available heat-resistant steels and alloys may not always satisfy all demands or requirements from various industries, resulting in compromising material limitations on using less aggressive service conditions [2,3]
A family of creep-resistant, alumina-forming austenitic (AFA) alloys has been developed at Oak Ridge National Laboratory in the early 2000s [4,5], which fills the gap between industrial demands and material performance. AFA alloys offer a unique combination of high-temperature creep resistance by strengthening multi-phase precipitation and promising oxidation resistance, especially in water-vapor containing environments, through protective, external alumina-scale formation [6,7,8,9,10,11]. The design strategy of AFA alloys is based on three pillars: (1) to balance Al, Cr, Ni, Nb, and C additions with Fe to maintain an FCC-Fe (austenite) single phase matrix for high-temperature strength and to minimize primary phase formation and maximize the secondary phase formation for precipitation strengthening similar to commercially available advanced heat-resistant alloys [12]; (2) to minimize Ti, V, and N additions to avoid deterioration of alumina-scale stability and promote Cr and Nb additions to reduce the required amount of Al to form stable, external alumina scale; and (3) to keep Fe content as a majority of the alloy composition to achieve inexpensive material costs. The study of AFA alloys with this design strategy has identified alloy compositions within Fe-(2.5-4)Al-(12-25)Cr-(12-35)Ni-(0.4-3.3)Nb-(0.03-0.5)C in weight percentage, together with other minor elements, in which the selection of compositional combinations depends on target temperatures, strengthening mechanism, processing route, and material cost. Other than the major elements described above, some minor elements were also added for multiple reasons, such as austenite stabilization (Mn and Cu), typical impurities in industrial grade products (Mn, Si, V, and Ti), additional strengthening effect (Cu, Mo, and W), improved oxidation resistance (Y, Hf, Zr, and B), and so on [6,7,8,11,13,14]. The compositional compromises among cost, creep, and oxidation resistance needs result in all AFA alloys exhibiting an upper temperature limit for alumina scale formation, ranging from 700 °C to over 1100 °C, depending primarily on Al, C, Cr, Nb, and Ni contents along with Hf/Zr/Y, beyond which a transition to internal oxidation and nitridation of Al can occur [4,5,6,7,8,9,10,11,12,13].
One of the potential structural applications of AFA alloys is balance-of-plant (BoP) components in high-temperature solid-oxide fuel cells (SOFC) that require a specific material durability to be operated at elevated temperatures (800−900 °C range) under humidified air conditions [15]. The application does not accept chromia-forming stainless steels or Ni-base alloys (e.g., 310 stainless steel or alloy 625, respectively [15]), since Cr evaporation attributed to the Cr volatilization of chromium-oxyhydroxide from structural materials can cause a major source of poisoning and deactivation of the cathode and can deteriorate long-term performances, e.g., Ref. [16]. On the other hand, an alumina scale is expected to be stable and provides long-term protection for such environments. The AFA alloys have been selected as one of the candidates of SOFC-BoP applications [15] not only from the viewpoint of promising surface protection but also a combination with better high-temperature mechanical properties than that of commercially available FeCrAl alloys and inexpensive material costs compared to alumina-forming Ni-base alloys [4,5].
Although the design concept of AFA alloys would meet with the demands of industries, such as the example described above, AFA alloys still require various types of approaches to optimize the performance to meet with the requirements. The developmental works of AFA alloys to date can be divided into three different types, such as (1) the compositional fine tuning to optimize material performance to fit with the requirements [6,8,10], (2) proposing a new strengthening mechanism to improve creep-rupture performance [7,14,17], and (3) fundamental approaches to scientifically understand the elemental effect on oxidation resistance [11,18,19]. Because of a wide range of elemental combinations available in AFA alloys, the studies of the elemental effect on comprehensive material responses are still important to provide further understanding of the role of each element and to guide the optimization of material performance.
The present study focuses on describing the role of the Cr addition on creep and oxidation resistance of AFA alloys at elevated temperatures. The Cr addition is essential for the AFA alloy design, although the effect of a wide range variation of the Cr content on the properties has not been experimentally evaluated to date. The expected impacts include mechanical properties, oxidation resistance, and microstructure, and the relationship among them are to be correlated to each other as a function of Cr content. The nominal AFA composition selected in the present study was based on Fe-25Ni-xCr (x = 13.5-18)-4Al-2Mn-2Mo-1.5Nb-0.5Cu-0.1Zr-0.1C-0.01B wt.%, which was specifically designed to optimize alumina-forming abilities at the 900 °C range for SOFC BoP applications [20].

2. Materials and Methods

Nominal and analyzed compositions of the AFA alloys in this study are summarized in Table 1. The alloys #135 to #180 have a same target alloy composition except for Cr contents varying from 13.5 to 18.0 wt.% (with a substitution of the Fe content). The composition was analyzed by combustion-infrared absorbance (C and S), inert gas fusion (N and O), inductively coupled plasma mass spectroscopy (B), and inductively coupled plasma atomic emission spectroscopy (rest of the elements).
A master alloy ingot (~12 kg, nominally 76 mm in diameter ×300 mm in length) containing all required elements with slightly less Fe and Cr contents than the targets was prepared by a vacuum induction melting. The ingot was sectioned into small pieces, and then they were re-melted by arc-melting with additional Fe and Cr to achieve target alloy compositions. This approach could minimize the compositional variations of minor alloying elements. The arc-melted ingots with a size of 25 × 25 × 150 mm3 were sectioned into small pieces (25 × 25 × 50 mm3), homogenized at 1100 °C in argon cover gas for 2 h, and followed by an upset forging to prepare ~19 mm thickness plates. The forged plates were re-heated at 1100 °C and then hot rolling was applied with 10–15% thickness reduction per pass with inter-pass re-heating, targeting the rolled plate samples that are ~6 mm in thickness. The plates were subsequently solution-annealed at 1100 °C for 1 h, followed by water-quenching, resulting in fully recrystallized microstructure with the austenite grain size of ~30 μm.
The solution-annealed plate samples were subjected to uniaxial, constant load creep-rupture testing in laboratory air at 850 °C and 30 MPa. A dog-bone shape sheet tensile specimen was machined from the plate samples with a gage section of 0.7 mm in thickness, 3.2 mm in width, and 13 mm in length by electrical discharge machining (EDM, Robocut a-0iA, FANUC, Yamanashi, Japan). An accelerated, aggressive oxidation test condition of 500 h cycles at 900 °C in air + 10% water vapor was chosen to provide rapid feedback of oxidation responses of the present alloys. Coupon specimens with a size of ~1 × 10 × 20 mm3 were also sectioned from the plate samples by an EDM. The specimen surface was ground using #600 (ANSI – US Unit) SiC paper prior to creep and oxidation tests.
Microstructure characterization was performed by using a Hitachi 4800 Scanning Electron Microscope (SEM, Hitachi Ltd., Tokyo, Japan) equipped with a cold field emission gun and X-ray energy dispersive spectroscopy (EDS, EDAX, Mahwah, NJ, USA) and a TESCAN MIRA3 SEM equipped with an electron backscattered diffraction system (EBSD, TESCAN, Brno, Czech Republic). The cross-sectional microstructures were acquired as backscattered electron images with the accelerating voltages of 10 or 20 kV and a working distance between 8 and 10 mm. The phases were identified by chemical compositions analyzed by using SEM-EDS spot or map analyses at 20 kV combined with crystallographic characterization by using SEM-EBSD. For phase volume fraction measurements, the SEM backscattered electron (BSE) images were manually colored to differentiate various phases based on SEM-EDS results as well as the differences of their Z-contrast; each phase with a color threshold was binarized; and then the area fraction (considered as the volume fraction) of each phase was measured using ImageJ software [21].
Two commercially available, chromia-forming heat resistant alloys (nickel-base alloy 625 and 310 austenitic stainless steel) were chosen as benchmark materials. An oxidation test was also performed at the same test condition above [15]. The analyzed compositions are summarized in Table 2.

3. Results

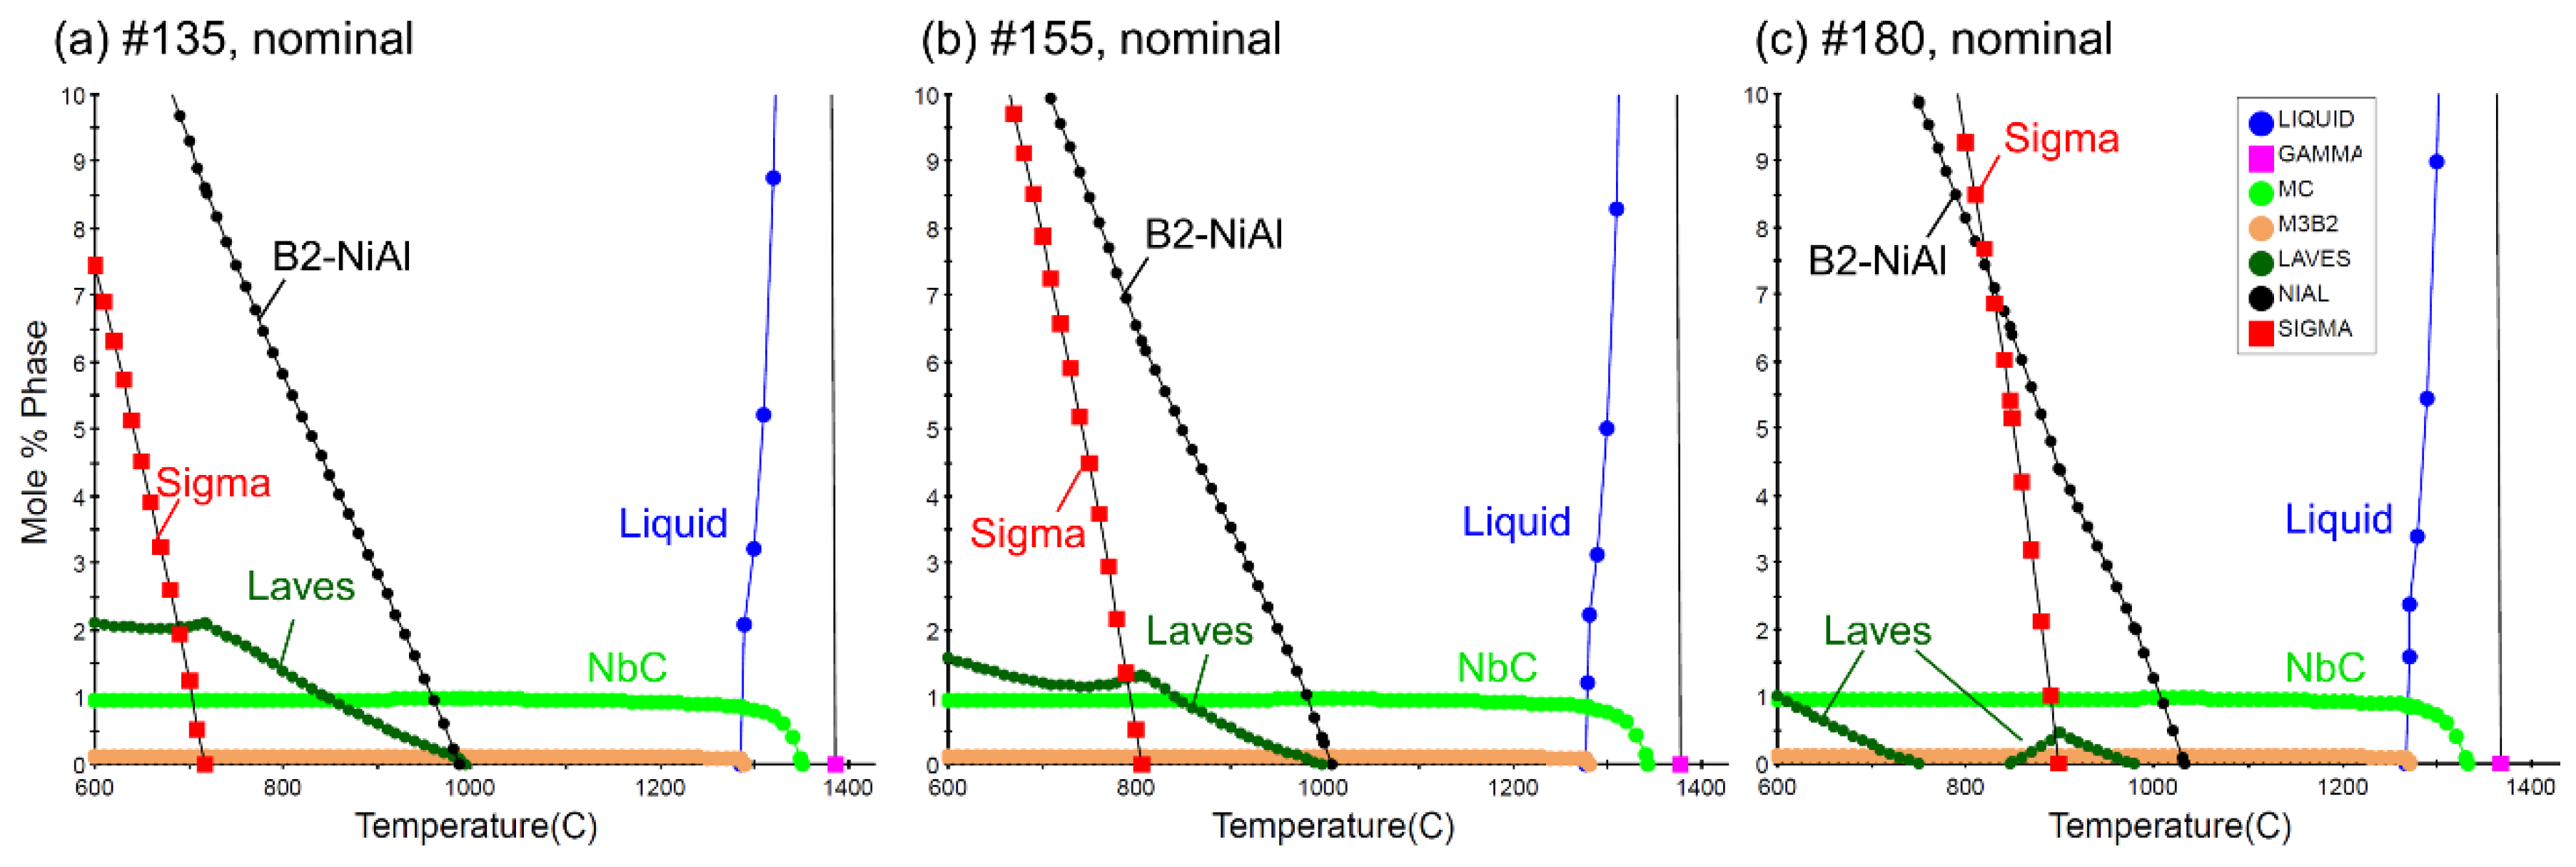
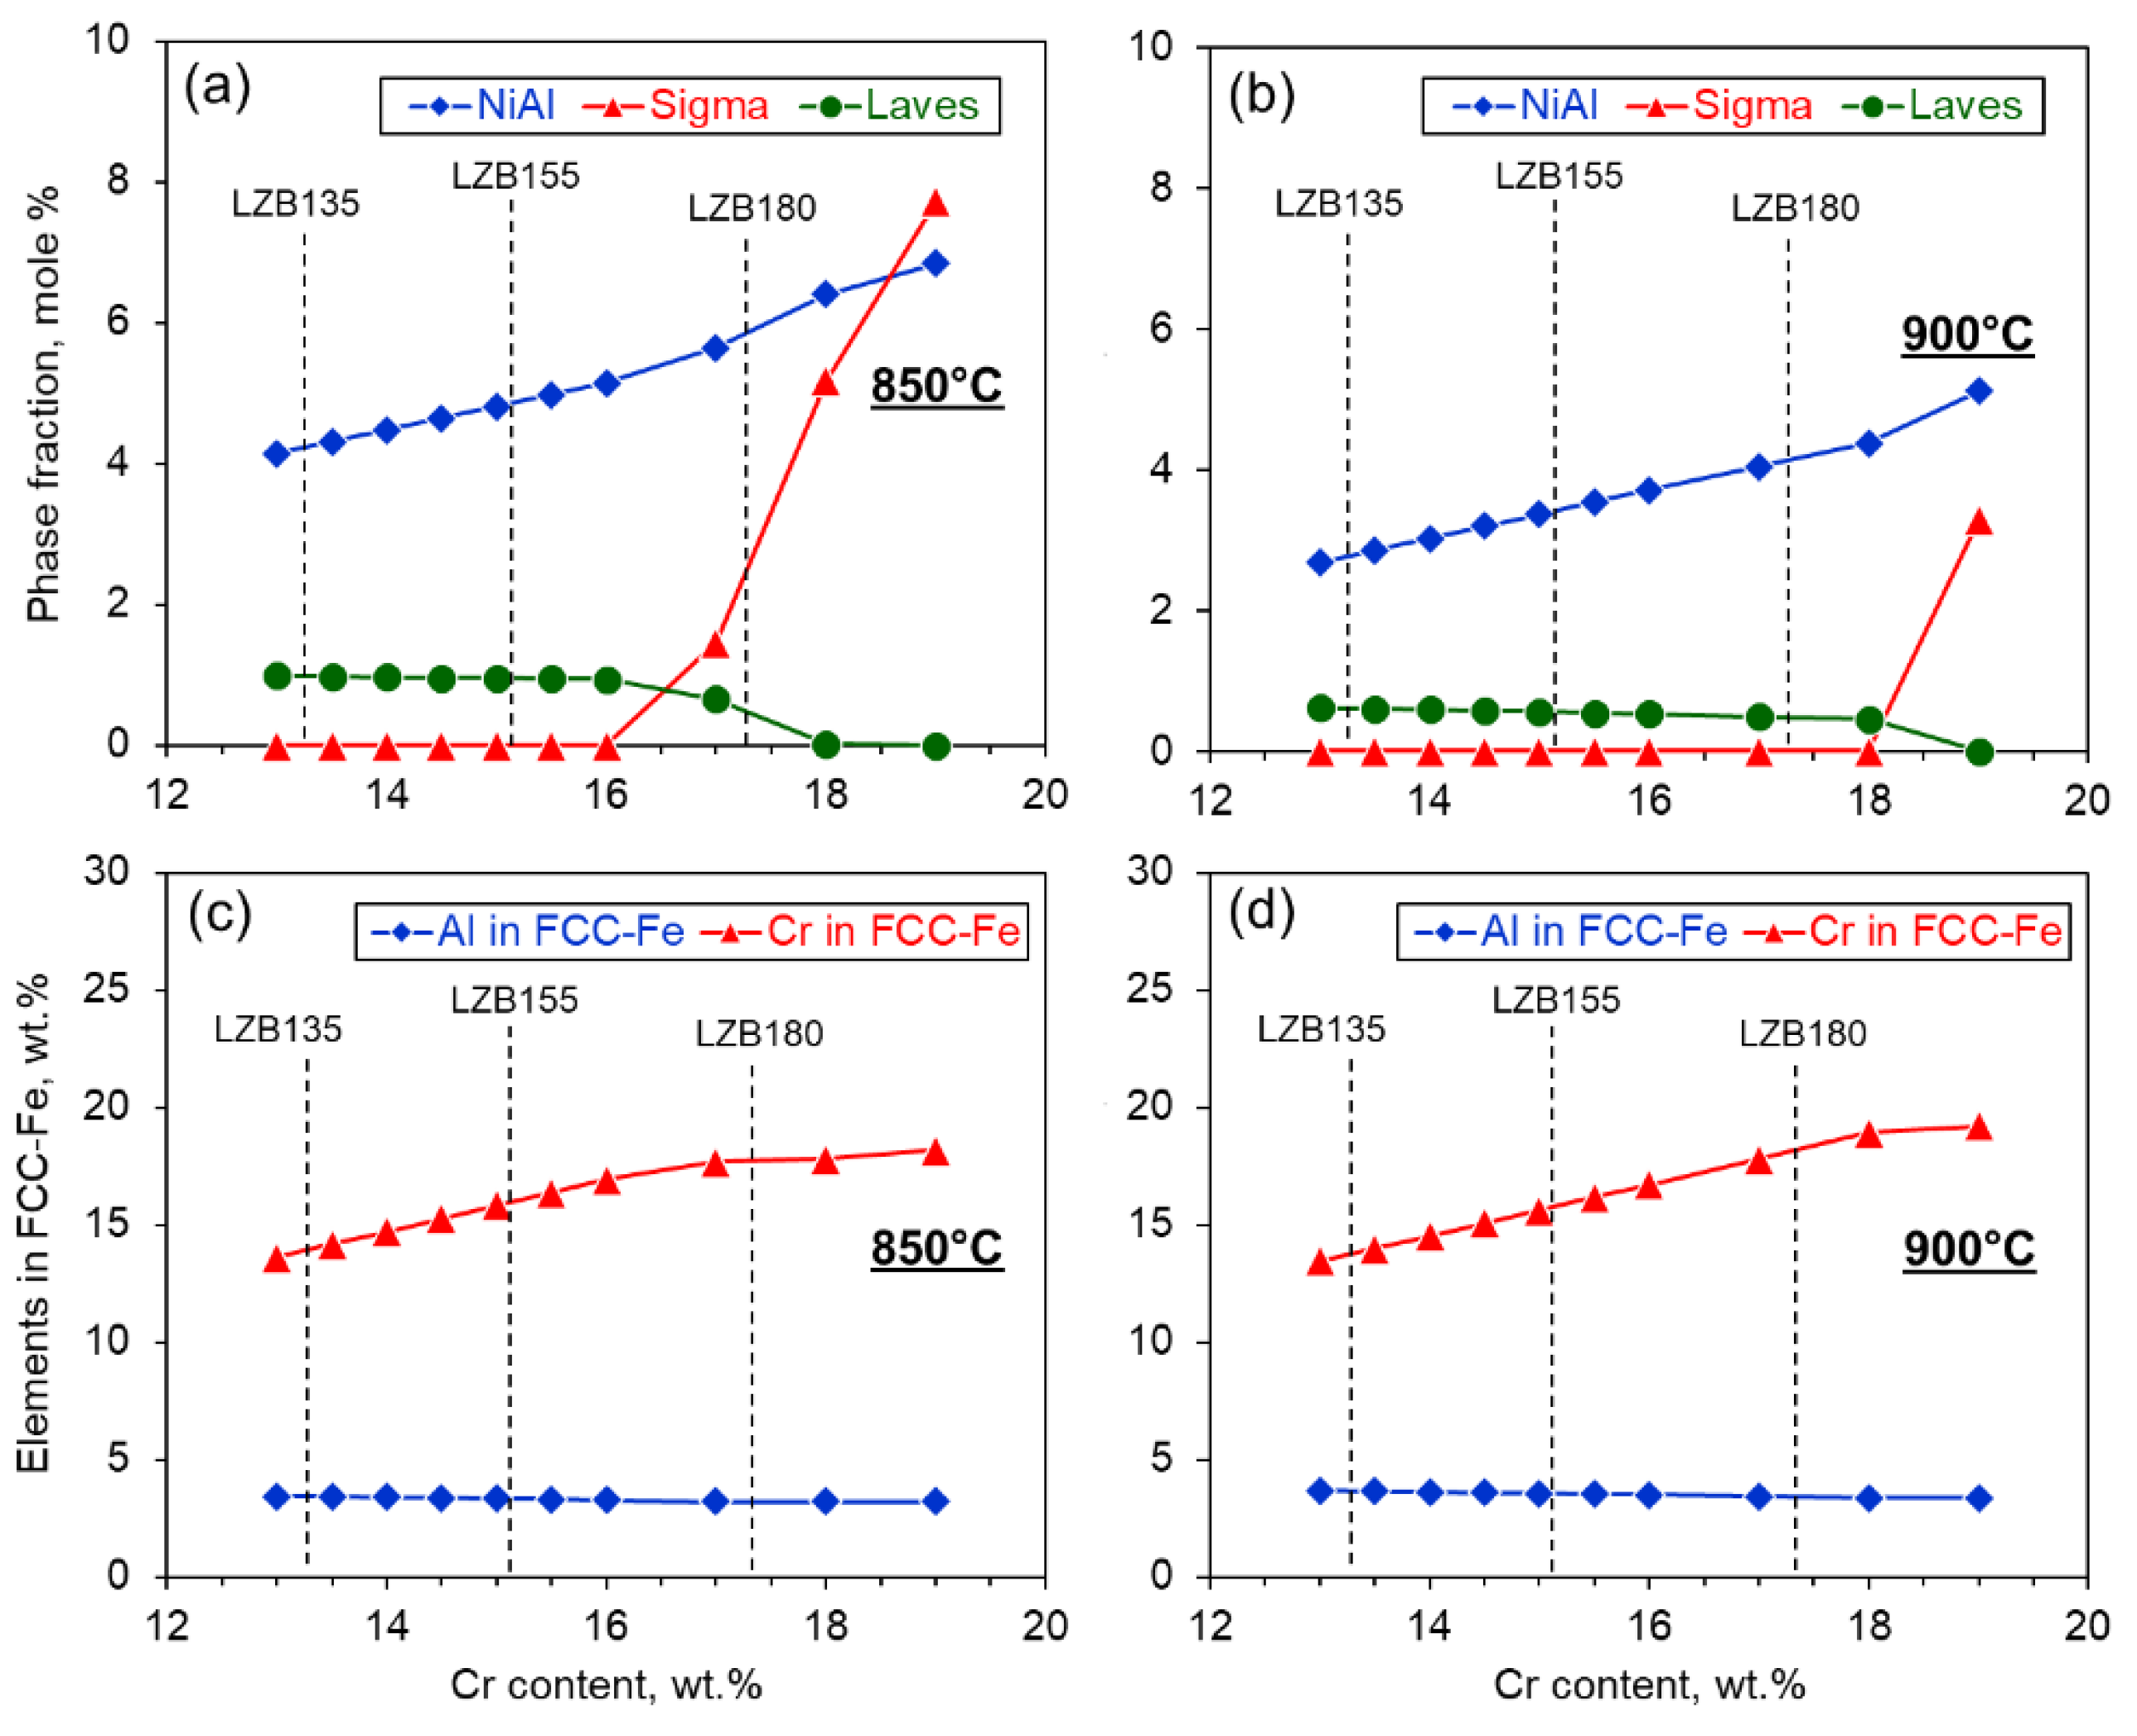
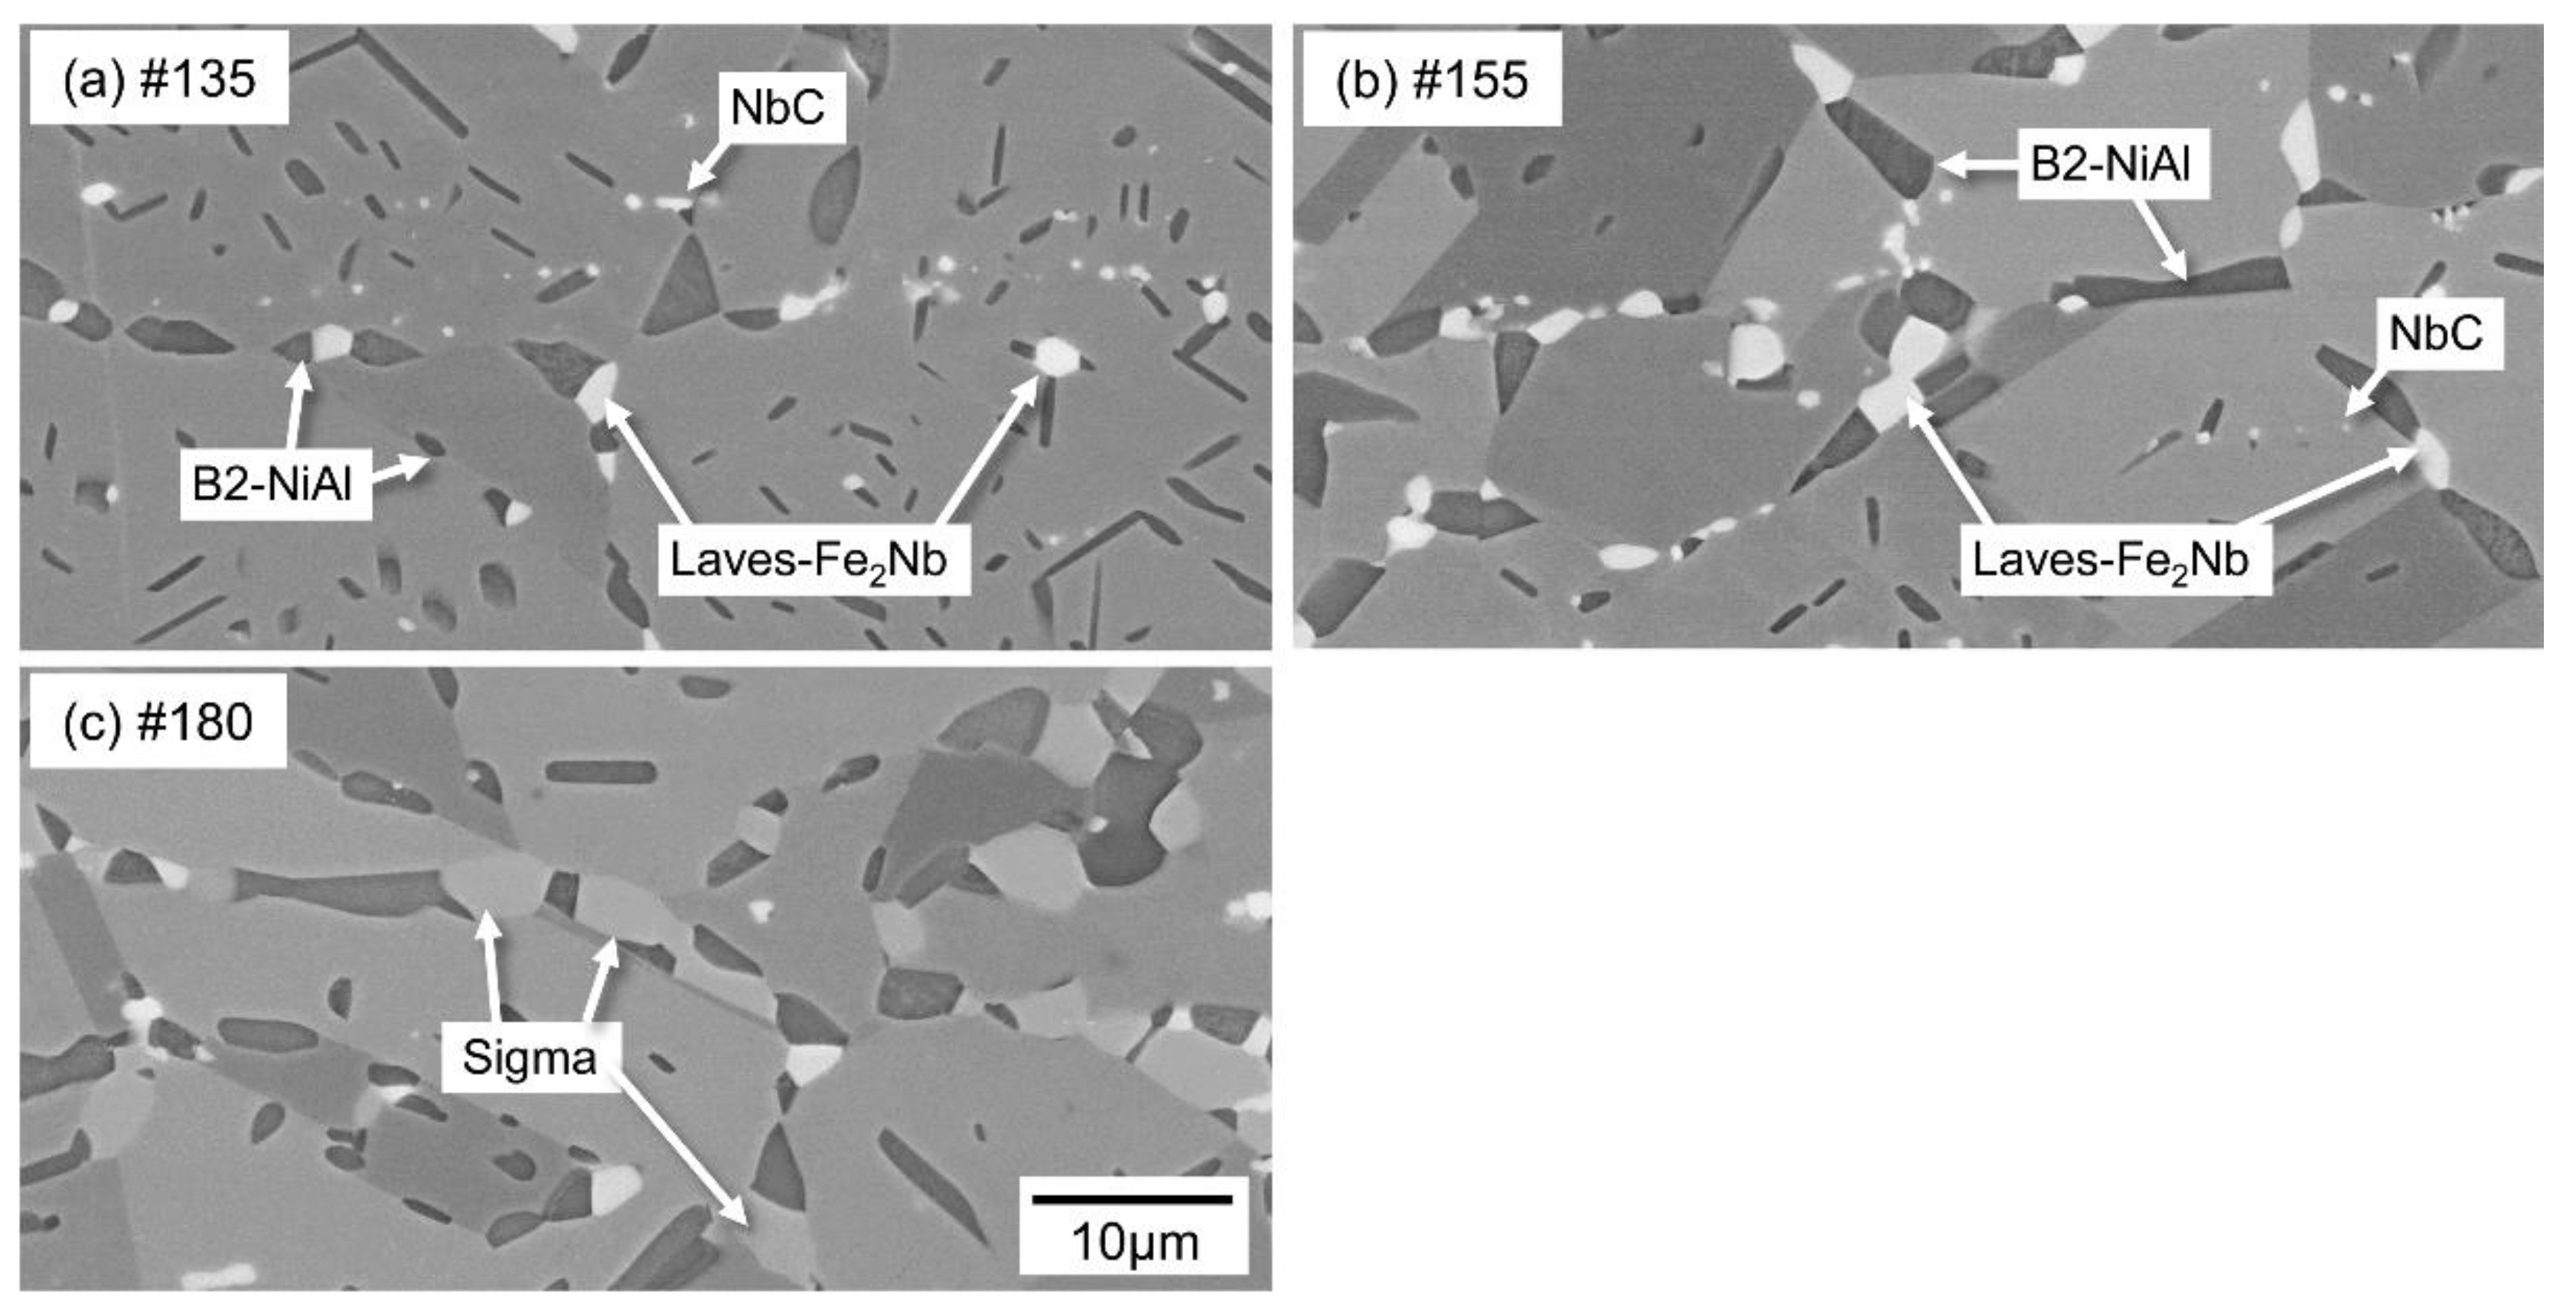
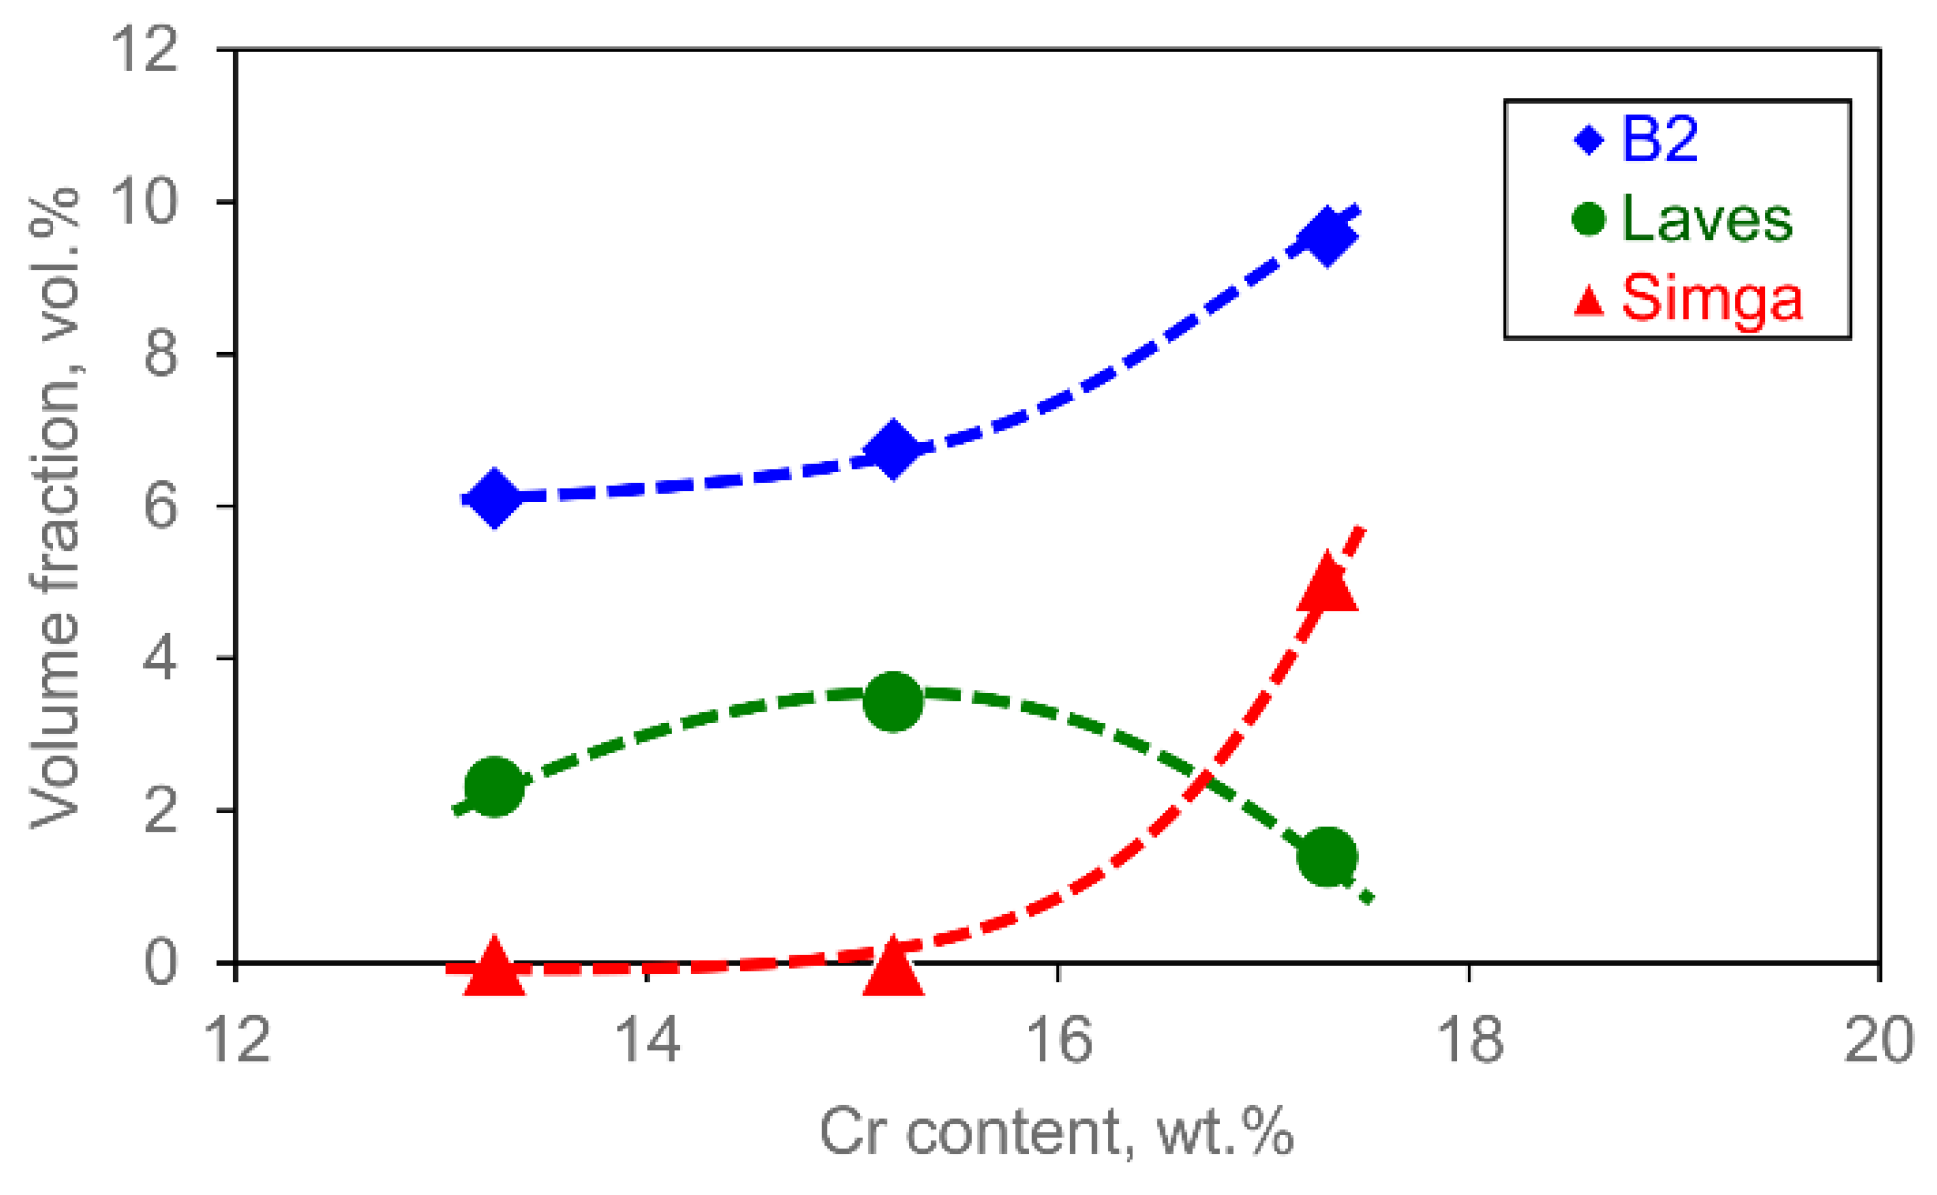
3.1. Calculated Phase Equilibrium

The phase equilibriums of the selected alloys (with nominal compositions) calculated by a thermodynamic calculation software, JMatPro v.9 (Sente Software Ltd., Guildford, United Kingdom), are shown in Figure 1. They consisted of a same combination of the phases, including MC (M: mainly Nb), B2-NiAl, Laves-Fe2Nb, Sigma-FeCr, M3B2 (M: mainly Cr), and FCC-Fe matrix. MC and M3B2 form during solidification as primary phases, and their amounts are almost unchanged below the melting point or among the present alloys; therefore, further details of MC and M3B2 will not be discussed in this study. The other phases (B2, Laves, and Sigma) appear below ~1000 °C, so they are expected to form as secondary phases during exposure below their solvus temperatures. When Cr content increases, Sigma becomes stable and nucleates at higher temperatures, whereas the amount of Laves decreases at a given temperature. The amount of B2 slightly increases with Cr content.
Figure 2 represents the calculated amounts of three major secondary phases at 850 and 900 °C, as well as the calculated Al and Cr contents in the FCC-Fe matrix, plotted as a function of the alloy Cr content. At 850 °C, B2 increases monotonically. Laves does not change much up to 16 wt.% Cr, but the amount is reduced above that and becomes zero at 18 wt.%. Sigma shows opposite trends that appears above 16 wt.%, and the amount increases rapidly with Cr content. Almost the same trend in the phases can be seen at 900 °C, although Sigma did not appear up to 18 wt.%. The FCC-Fe matrix contains ~3.2−3.4 wt.% Al at 850 °C and 3.4−3.6 wt.% Al at 900 °C, which are insensitive to Cr content. On the other hand, the Cr in FCC-Fe is almost the same (or even more than), and alloy Cr content measured up to 16 wt.% and 18 wt.% at 850 and 900 °C, respectively, suggesting that only Sigma-phase can consume Cr in the alloys and most elemental Cr stays in the FCC-Fe matrix.

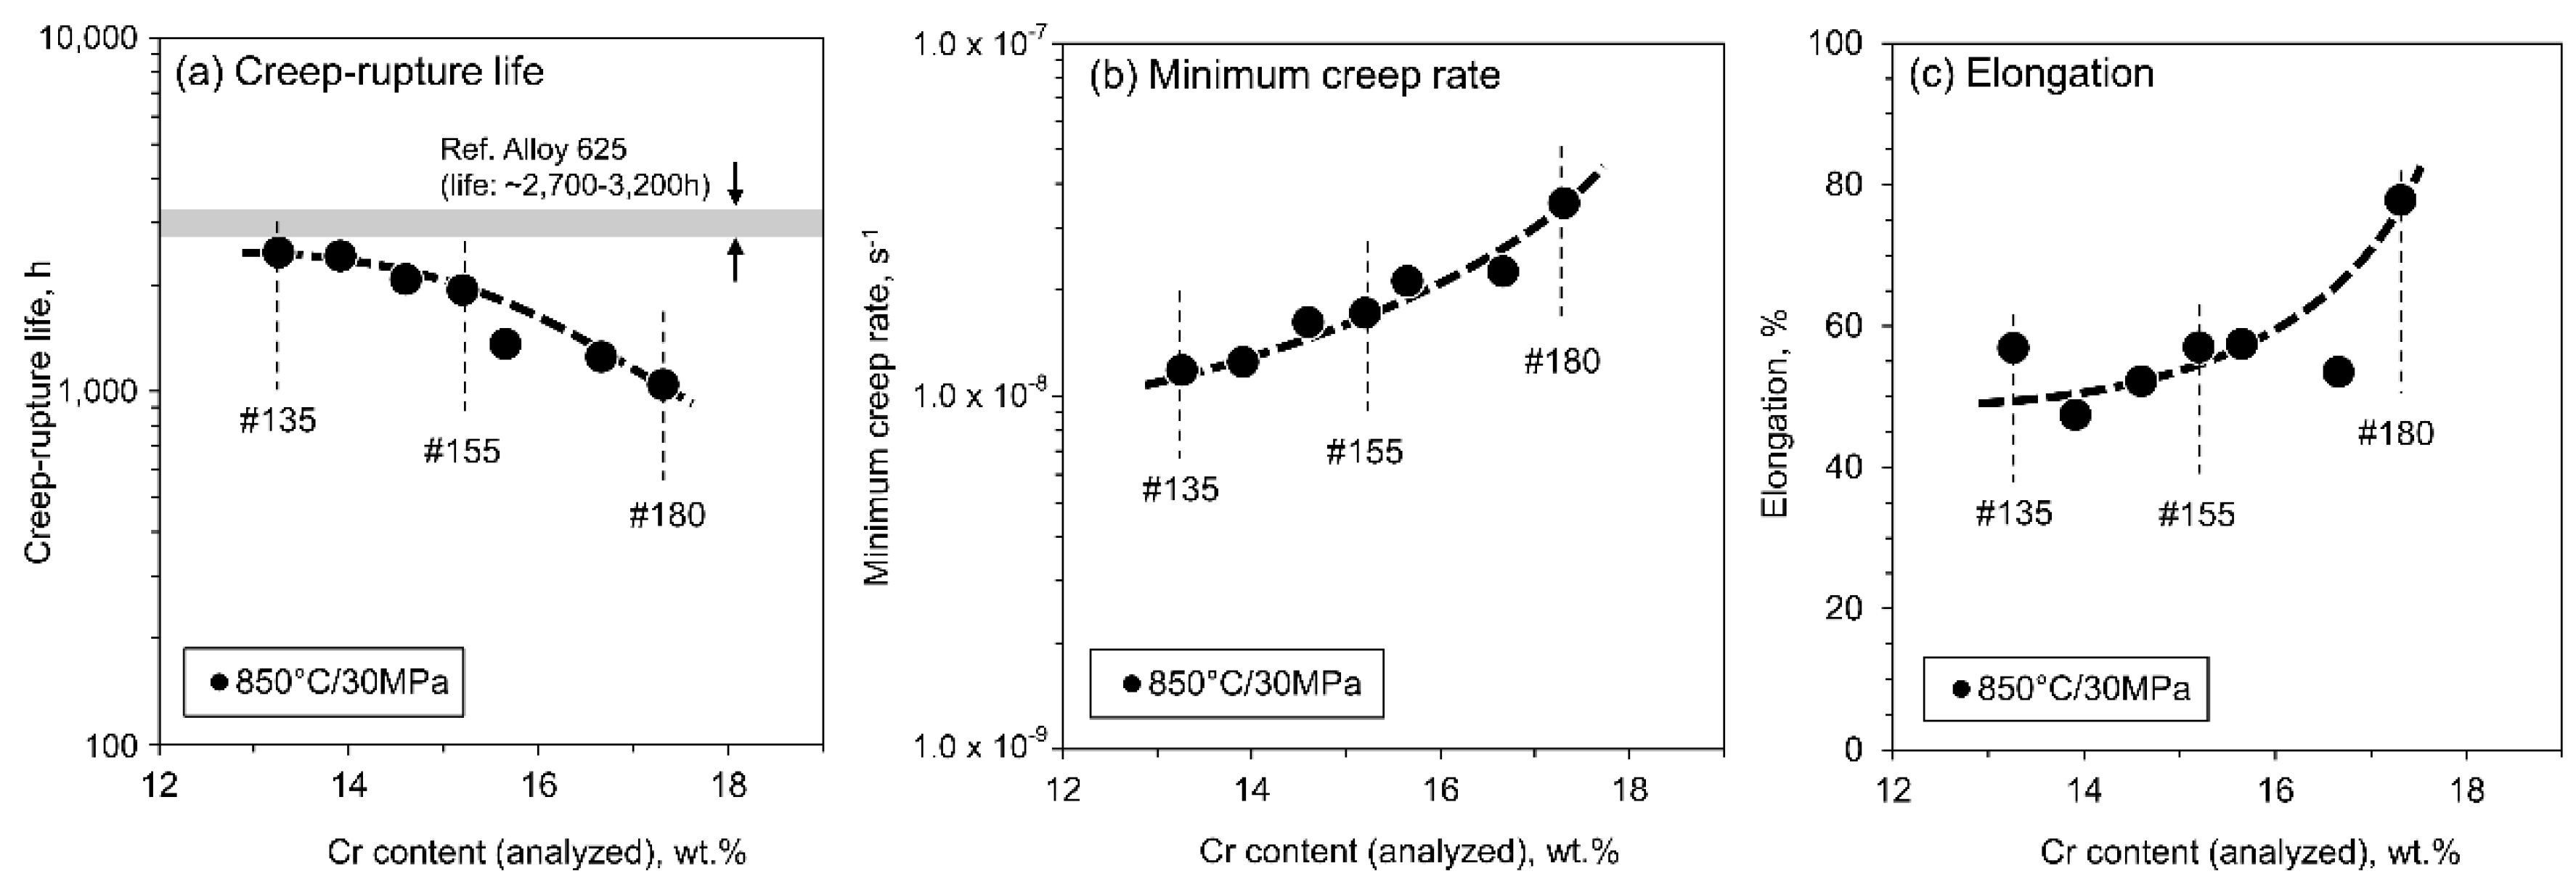
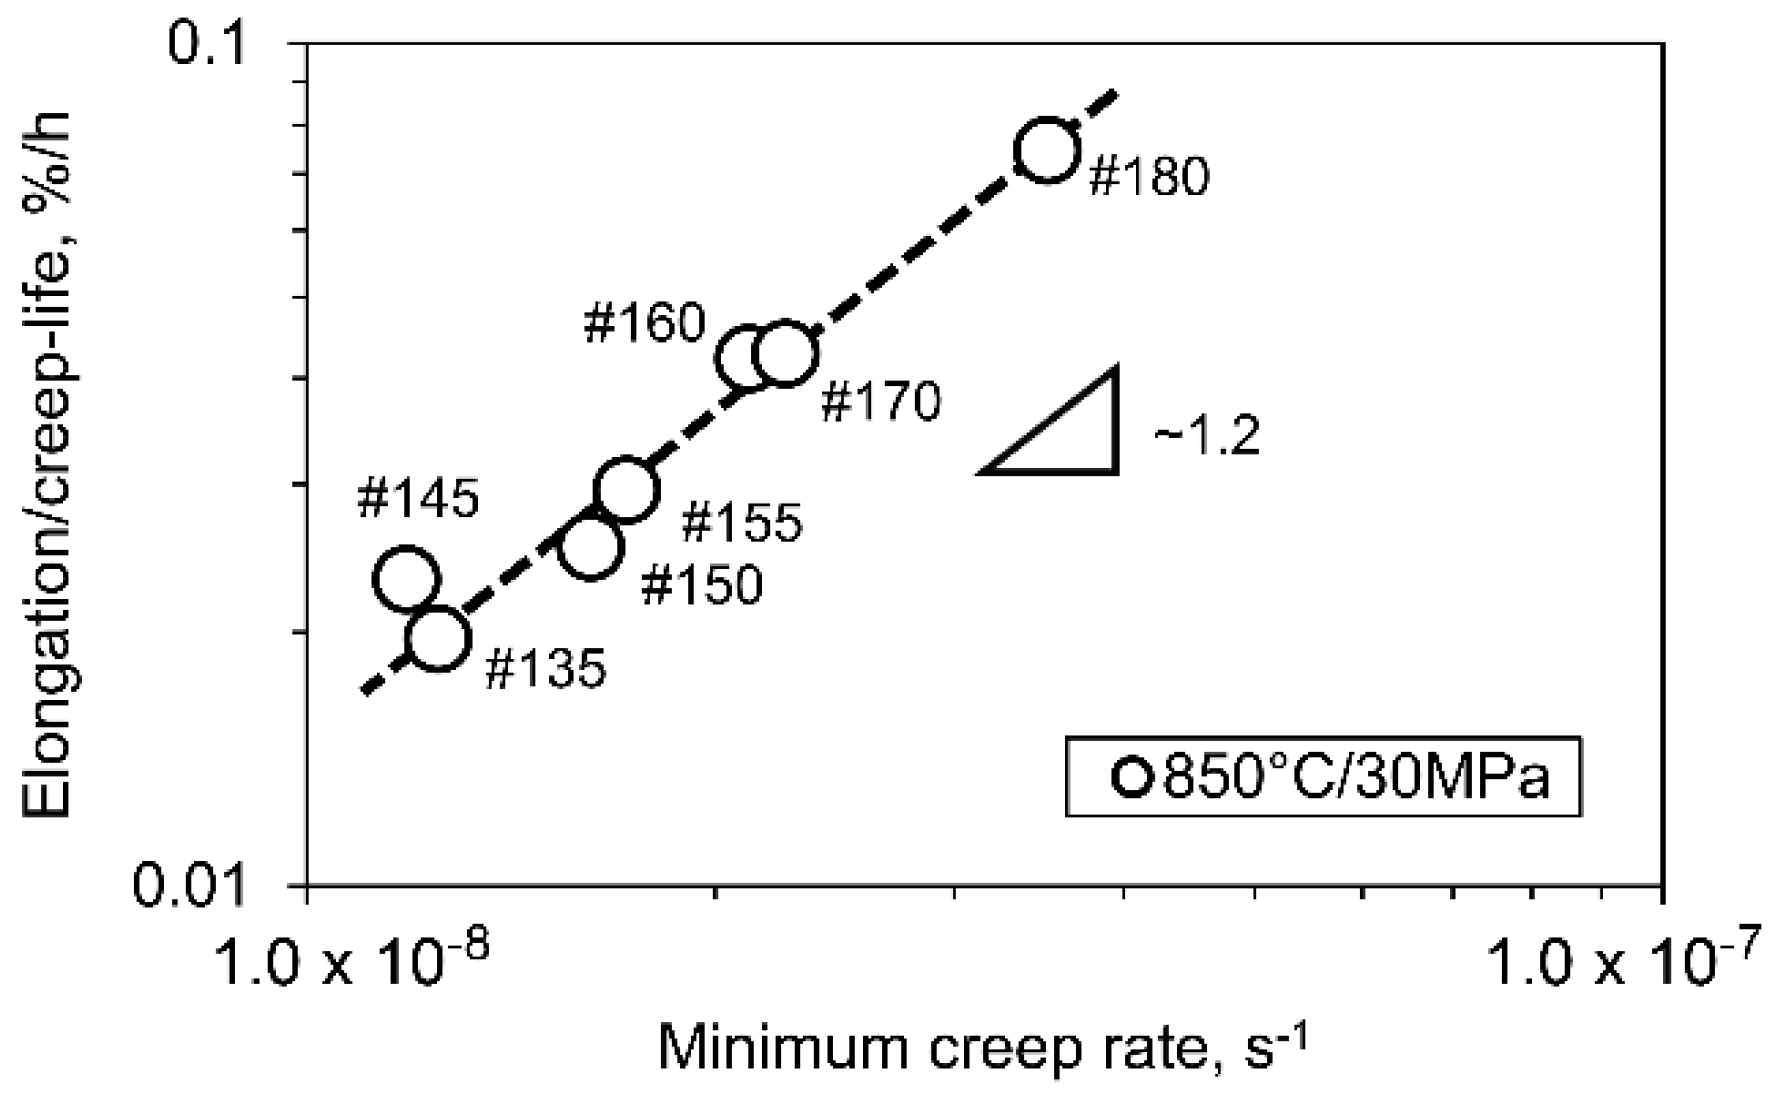
3.2. Creep-Rupture Properties

Figure 3 summarizes the creep-rupture life, the minimum creep rate, and the elongation to rupture of the AFA alloys tested at 850 °C and 30 MPa, plotted as a function of Cr content. Creep-rupture life varied from 2468 h (#135) to 1043 h (#180), which monotonically decreased with Cr content. The estimated creep-rupture life of the commercial nickel-base alloy 625 at the same test condition [22] is in the range of ~2700−3200 h, as shown in the plot, which suggests that the present AFA alloys could reach creep-rupture lives close to that of alloy 625 by further lowering Cr content. On the contrary, the minimum creep rate increased with Cr content, indicating that Cr addition has a negative impact on the creep deformation resistance. The elongation to rupture also increased with Cr content, although the lowest elongation among the present AFA alloys was 47%, which seemed sufficiently large for high-temperature structural materials.
Figure 4 represents the relationship between the elongation normalized by the rupture life and the minimum creep rate of the present AFA alloys tested at 850 °C and 30 MPa. The plot indicated a linear relationship between these parameters, which appeared similar to the modified Monkman–Grant relationship [23]. Although the relationship should be discussed only for a single material with multiple creep-rupture test conditions to find out the transition of the creep deformation mechanism, the linear relationship of the present AFA alloys shows that the alloys followed a same deformation mechanism (with a negative Cr dependence) in the present test condition.
Figure 5 shows an example of SEM-EDS spot analysis showing an SEM-BSE image from alloy #155 after creep-rupture testing, together with the acquired EDS-spectra from Laves, B2, NbC, and Sigma phase precipitates. The spectra clearly identified specific element enrichments in different types of the phases (e.g., Fe, Mo, Nb, and Si in Laves; Al and Ni for B2; and Cr and Mo in Sigma). In addition, SEM-EBSD analysis (not shown) was used to identify the crystal structure of each phase, which supported identifying the types of the phases. These results indicated that the Z-contrast of the secondary precipitates in the SEM-BSE images can be used to identify and distinguish each phase (e.g., B2: dark contrast; Sigma: light gray contrast; and Laves or NbC: bright contrast). It should also be noted that Laves and NbC were distinguished by morphology since NbC showed round-edge morphology, whereas Laves exhibited blocky shapes with flat interfaces relative to the matrix.
Figure 6 illustrates SEM-BSE images showing the microstructure of the creep-rupture tested AFA alloys #135, #155, and #180, sampling from the grip section and the uniformly deformed gage section. The images of the grip sections were assumed to be an isothermally aged microstructure (at 850 °C for 2468 h, 1934 h, and 1043 h, respectively) with almost negligible effects on stress, whereas the microstructure at the gage sections evolved under the stressed condition. Alloy #135 showed B2 (a dark contrast) and Laves (bright contrast) precipitates dispersed in austenite grains with sizes of ~1−3 μm and ~1 μm, respectively, and most of the grain boundaries were decorated by these precipitates as well. The primary NbC with a size of ~1 μm was also observed to be aligned along the hot-rolling direction (the horizontal axis of the images), and the size, morphology, and dispersion characteristics were almost unchanged from the as-solution-annealed microstructure (not shown). All tested alloys also showed a similar trend in primary NbC particles, which was consistent with the prediction from thermodynamic calculations. Alloy #155 showed almost the same configurations as #135 on secondary phase precipitation, although a limited number of Sigma phase (light gray contrast) was also observed, which formed mostly on grain boundaries. It should be emphasized that the Sigma phase was not observed in alloy #150, suggesting that the threshold Cr content of Sigma formation in present AFA alloys should be located between 14.6 and 15.2 wt.% (#150 and #155, respectively), which was lower than the predicted range in Figure 2a. Alloy #180 revealed a large amount of Sigma precipitates with a size of ~2−5 μm as a major secondary phase. B2 and Laves were also observed, although the amounts were lower than the other alloys.
Compared to the grip section, the secondary precipitates in the gage section were spheroidized and coarsened, especially for B2, which could be due to the dislocation glide splitting B2 precipitates and promoting a relatively rapid morphology change and coarsening process. This phenomenon is consistent with the results previously reported by the authors [24] and suggests that B2 dispersion inside the austenite matrix does not strongly contribute to increasing creep deformation resistance through precipitation strengthening. The grain boundary precipitates, on the other hand, were discontinuous in the gage section, indicating a strong interaction between creep deformation and grain boundary precipitates. It should be emphasized that the volume fractions of the secondary precipitates did not show a significant difference between grip and gage sections.
The volume fractions of the secondary phases in the creep-ruptured specimens were measured from SEM-BSE images shown in Figure 6, in which the phases were identified and differentiated to each other by their Z contrast. Figure 7 summarizes the measured volume fraction of each phase plotted as a function of Cr content and then compared with the predicted phase fractions from a thermodynamic calculation. It should be noted that the calculated phase fraction was available only for mole percentage so that the comparisons were made with an assumption that the molar volumes of the secondary phases in the alloy system would not be significantly different from that of the FCC-Fe matrix. The volume fraction of B2 was ~2−4 times more than the predicted ones in the entire Cr range. Cr dependence was negative in the low Cr range and showed a plateau of volume fraction changes above 15.2 wt.% Cr (#155), which were also inconsistent with the prediction. There was no significant difference between the gage and grip sections, indicating that the gap from the prediction was not due to stress. The Cr dependence of the Laves volume fraction was negative, which was consistent with the prediction, although the absolute values were ~3−4 times more than the predicted amounts. Both results suggest that thermodynamic calculation underestimates the stability of these phases significantly, which is consistent with the observed results in similar AFA alloys that have been previously reported [24,25]. Sigma phase formation was predicted above 16 wt.% Cr, whereas Sigma actually formed between 14.6 and 15.2 wt.%. Moreover, the volume fraction of Sigma phase in #180 was ~4-times more than the prediction. These results suggest that the stability of the Sigma phase was also underestimated.
Although it is out of the scope of this study, it is considered that the gap between the calculation and the experimental results is attributed to the present thermodynamic database, which may not contain sufficient amounts of steels with more than a certain amount of Al as well as that of Nb. When the amounts of Al and Nb intentionally increased to ~5−5.5 and ~2−4 wt.%, respectively, in nominal alloy compositions, the thermodynamic calculation predicted the phase fractions of B2, Laves, and Sigma similarly to those obtained from the experimental results, suggesting that the calculation with the current steel database underestimates the effects of both Al and Nb additions on the phase equilibria. Further experimental results such as the present study are expected to be published, which makes the database mature and provides an improved prediction of phase equilibrium in alloys such as AFA.

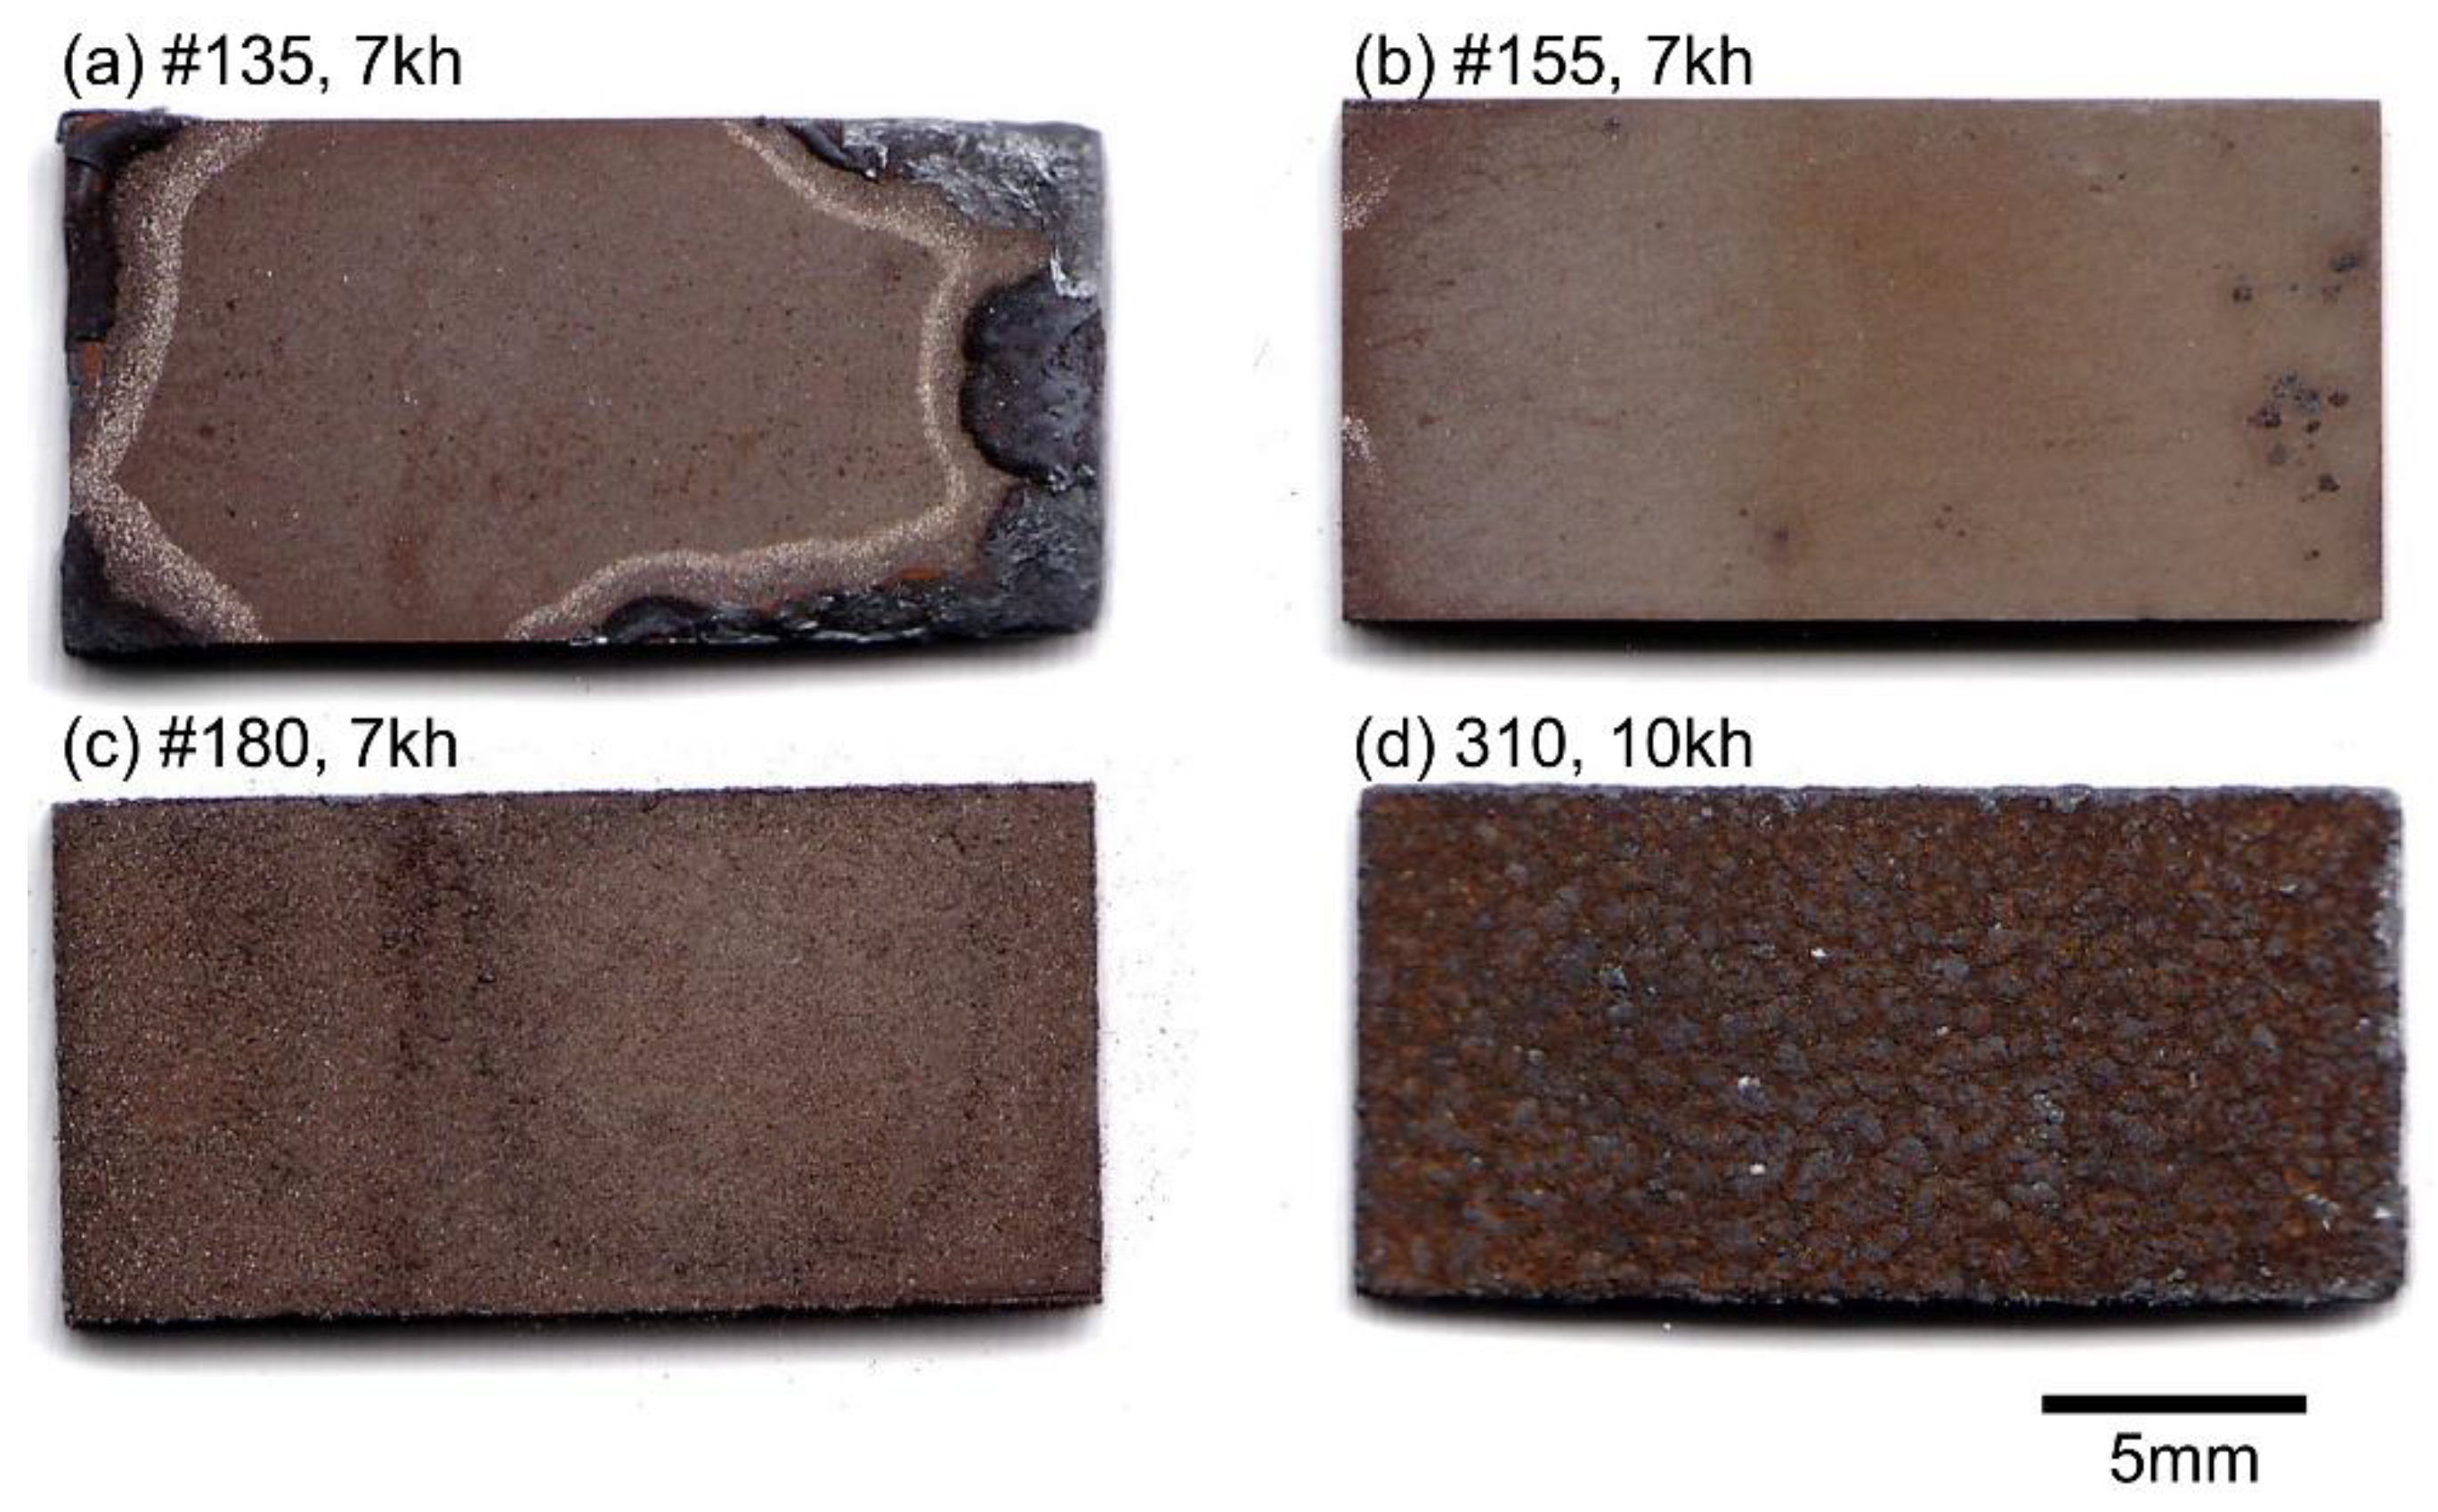
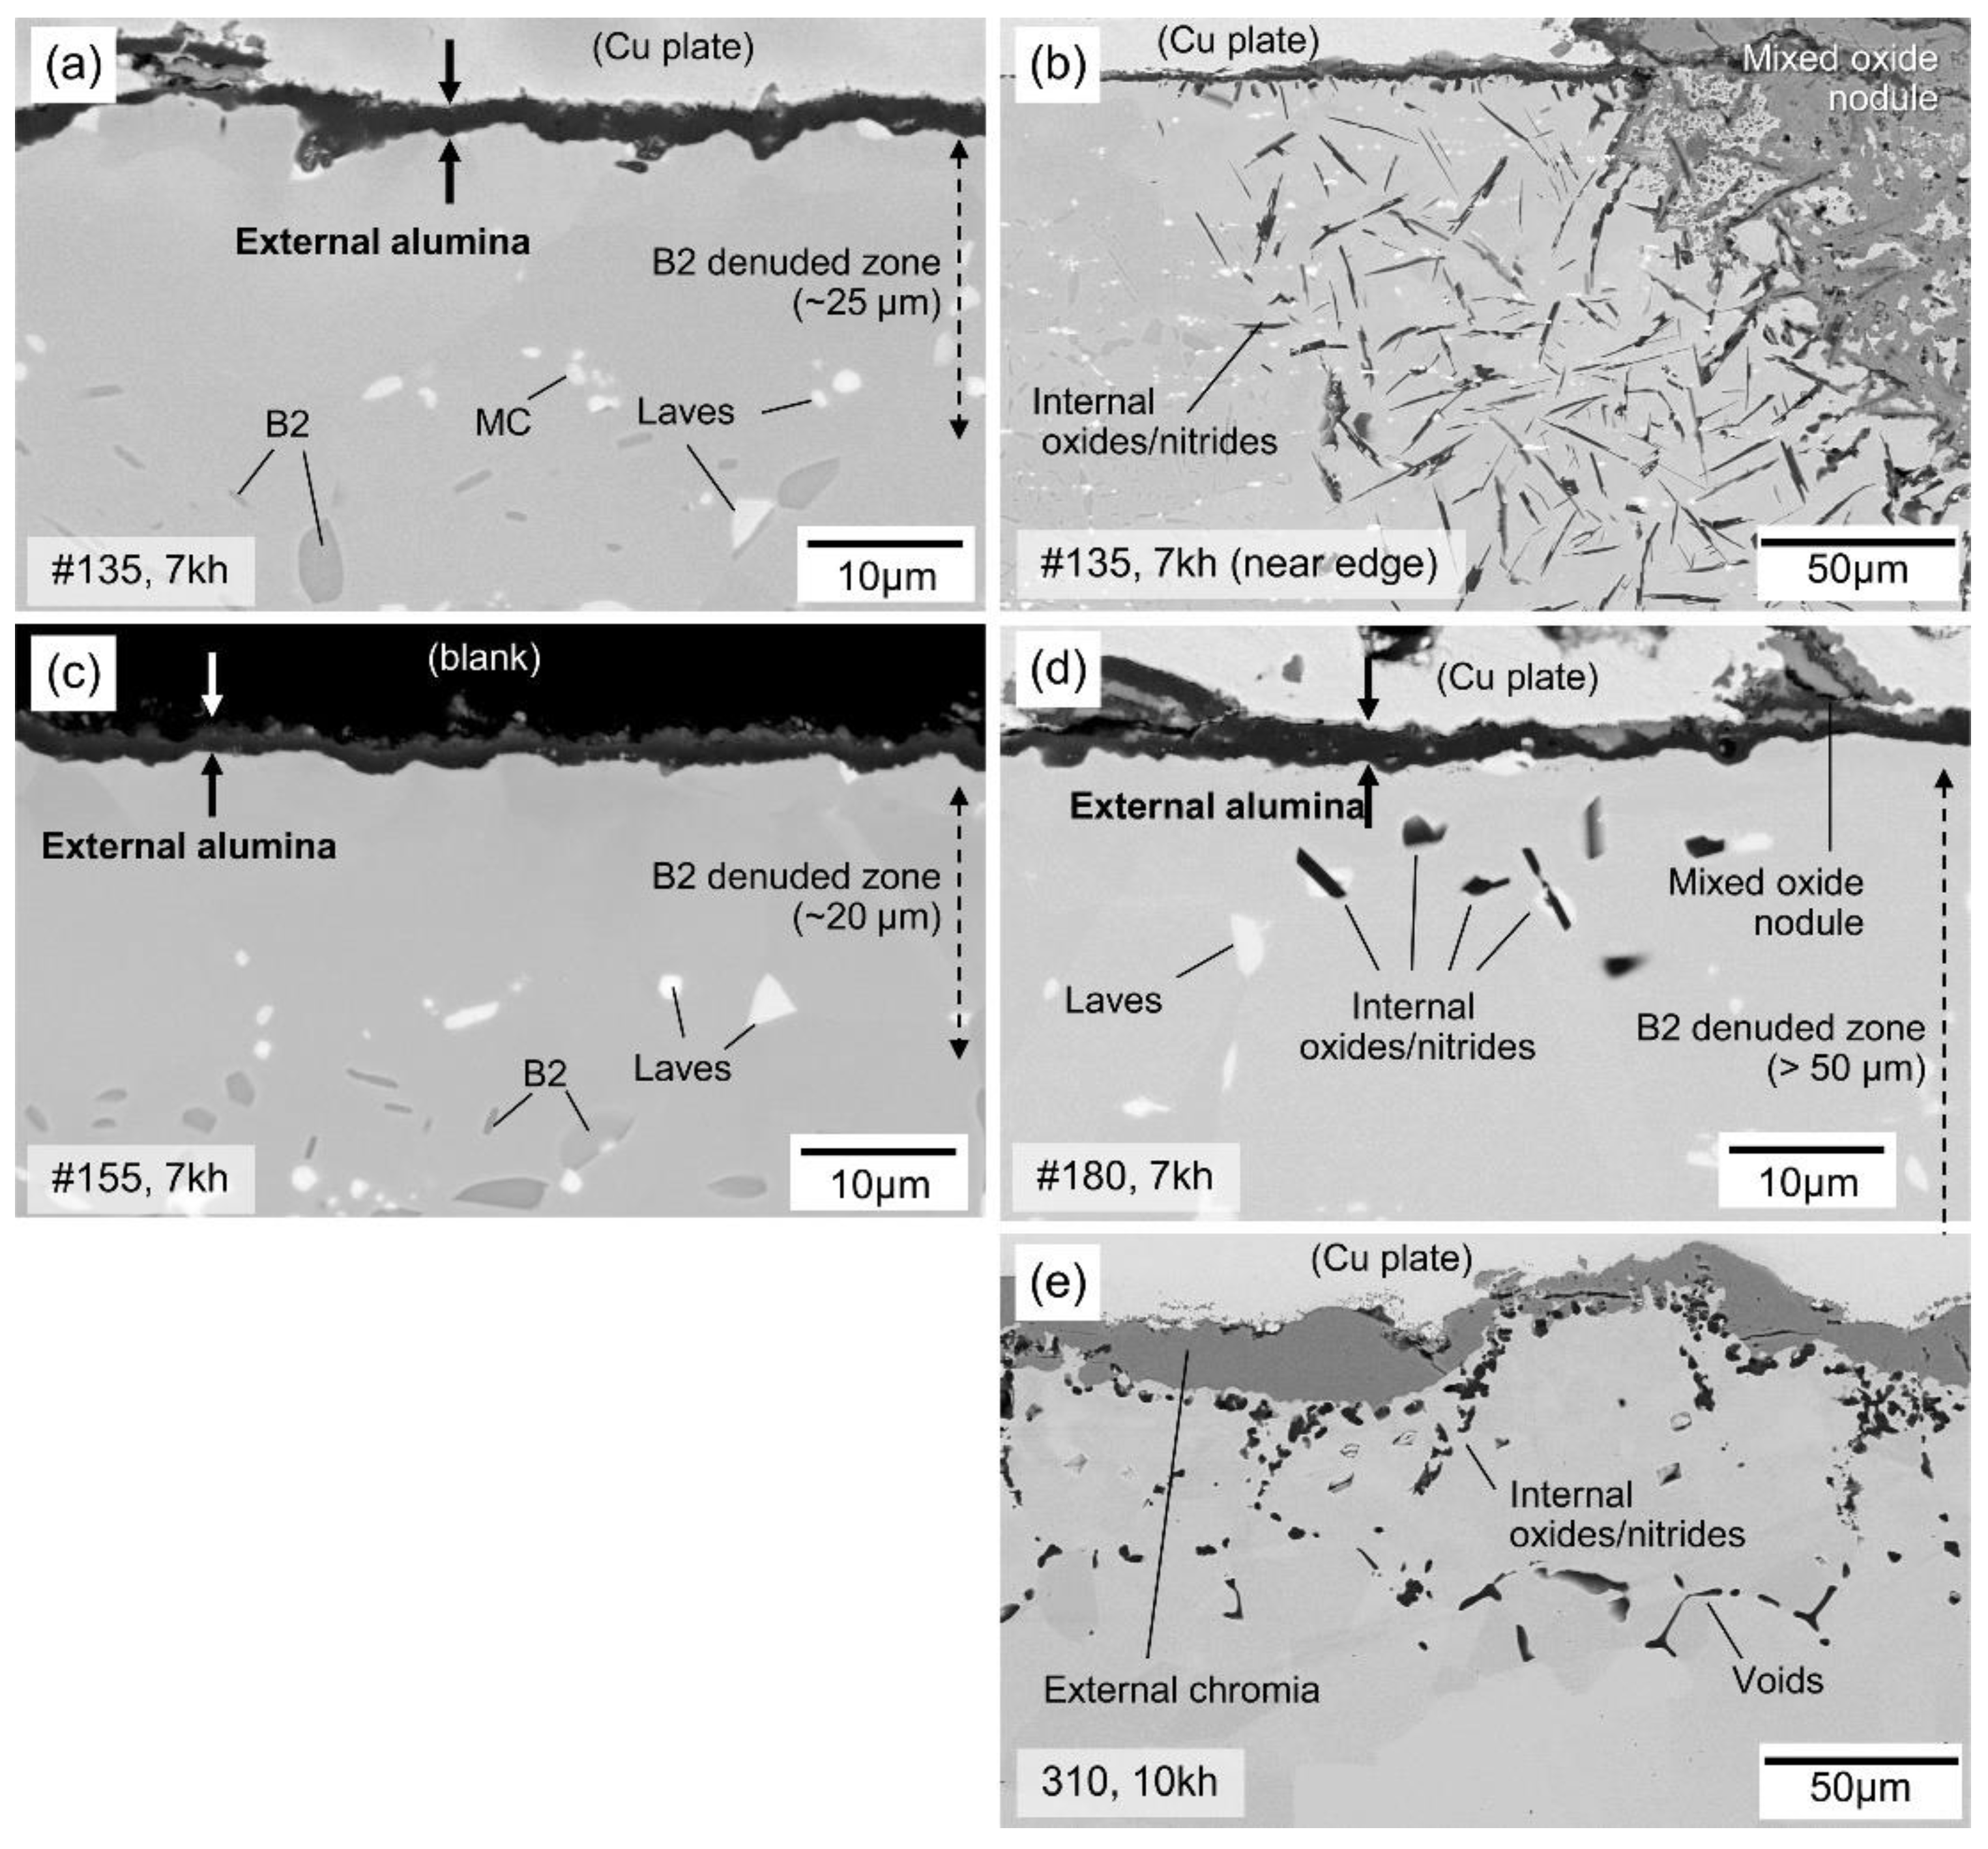
3.3. Oxidation Resistance

Figure 8 shows the mass change of the present AFA alloys exposed at 900 °C in air + 10% water vapor in 500 h cycle, together with those of commercial chromia-forming nickel-base alloy 625 (Ni-22Cr-8Mo base) and 310 austenitic stainless steel (Fe-26Ni-19Ni-C-N base) [15], plotted as a function of total exposure time. The chromia-forming alloys showed a mass gain in the earlier part of the oxidation test, and then they turned to mass loss after certain periods of exposure time. They correspond to the formation and volatilization of chromium-oxyhydroxide, along with oxide spallation, leading to less surface protectiveness in the aggressive oxidation environment used in the present study. The AFA alloy #135 showed very limited mass gain up to a total 4500 h exposure, although it turned to a significant mass loss after that, suggesting that #135 was on the borderline between protective and non-protective in the present test condition. On the other hand, AFA alloys other than #135 showed less than 0.5 mg/cm2 mass gain during the test for up to total 7000 h exposure, suggesting a promising surface protectiveness. The magnified plot shown in Figure 8b indicates that the oxidation kinetics of AFA alloys would be categorized into three different groups: (1) low Cr contents (#135, 13.3 wt.%) showing a limited surface protection, (2) medium Cr content (#145-#160, 13.9−15.7 wt.%) showing continuous parabolic-like mass gain, and (3) high Cr content (#170 and #180, 16.7−17.3 wt.%) showing relatively low mass gain and a transition to a minor degree of mass loss. It should be emphasized that the differences of mass changes between (2) and (3) were still very small from oxidation kinetics viewpoint, but they were categorized differently due to reasons discussed in the next section.
Figure 9 shows pictures of specimens #135, #155, and #180 tested for up to 7000 h, which belong to three different categories described above. Alloy #135 exhibited dark oxide scales surrounding most edges of the coupon specimen, which corresponded to non-protective, thick oxide nodules consisting of mixed Fe- and Cr-rich oxides. The mass loss after a 4500 h exposure was due to spallation of these thicker oxide regions. Alloy #155 showed no specific features on the specimen’s surface but only reflected a uniformly tinted color, corresponding to external, protective alumina scale formations. Alloy #180 also showed a uniform surface, although a slightly dark and rough surface was observed compared to alloy #155. For comparison, the surface of 310 austenitic stainless steel, tested for up to 10,000 h, was extremely rough and covered by thick oxide scales.
Cross-sectional SEM-BSE images near the surface of the oxidation tested specimens are displayed in Figure 10. Alloy #135 showed a ~2−3 μm thick continuous dark surface scale (Figure 10a), which corresponded primarily to external alumina scales (dark in the image), along with minor, irregular overlying patches of transient oxide(s) (grain in the image) observed near the center of the coupon specimens shown in Figure 9a. Beneath the surface scale, a B2 denuded zone formed at ~25 μm in depth was observed, which suggests that B2 precipitates act as an Al reservoir to provide the formation of an external alumina scale for elemental Al, similarly to the AFA alloy characteristics previously reported [11,18,19]. Alloy #135 also showed extensive (hundreds of microns deep) internal oxides/nitrides formed near mixed oxide nodule(s) observed at the edge of the coupon specimen (Figure 10b), indicating the loss of surface protection in the area. Alloy #155 showed a similar configuration as #135 in external alumina scale formation/minor transition oxide(s) as well as the B2 denuded zone (Figure 10c), although the thickness of the denuded zone was ~20 μm and no significant internal oxidation/nitridation was observed. Together, these results indicate that the addition of a medium Cr content in the range of 13.9−15.7 wt.% (corresponding to #145 through #160) promoted the establishment and continued formation of protective external alumina scales in this AFA base alloy composition at 900 °C in air with 10% H2O. The addition of Cr in this manner, which is known as a third element effect, lowers the required Al content to form and maintain an external alumina scale [26]. On the other hand, alloy #180 (Figure 10d) showed not only the external alumina scale but also, surprisingly, a minor amount of breakthrough internal oxide/nitride formation (~10 microns deep), and the B2 denuded zone nearly doubled in size (~50 μm) from that of #135/#155, which may be associated with the degradation of oxidation resistance. Although the detailed mechanism is not yet clear (discussed in Section 4.2), high Cr-containing AFA alloys such as #180 reveal less oxidation resistance than the medium Cr-containing AFA alloys such as #155 based on these observations.
A cross-section of chromia-forming 310 austenitic stainless steel after oxidation testing is shown in Figure 10e, which developed significantly thicker external chromium-rich oxides and internal oxides/nitrides along the alloy grain’s boundaries. It also showed void formations aligned mostly parallel to the surface, suggesting that they were formed as a result of the Kirkendall effect of outer Cr diffusion attributed to a loss of Cr from the surface by the volatilization of chromium-oxyhydroxides [27], as well as scale spallation.

4. Discussion

4.1. Role of Secondary Phase Precipitates on Creep Properties

The creep-rupture tests of the present AFA alloys with Cr variations revealed that creep-rupture properties were monotonically and continuously reduced with Cr content and without any obvious transitions in the trend. The elongation normalized by the rupture life and the minimum creep rate showed a linear relationship similar to the modified Monkman–Grant relationship, which also suggested that the creep deformation mechanism would possibly be similar to each other. However, Cr dependence on the secondary phase precipitation exhibited a transition at 15.2 wt.% in which B2 stopped decreasing, whereas Sigma formed and increased with Cr content. The observed transgranular precipitates after creep-rupture testing, such as B2, Laves, and NbC, are not considered to be contributing strongly to the precipitation strengthening of alloys because of their coarse sizes (>1 μm) and relatively low density dispersions. Since the grain boundaries are mostly decorated by B2, Laves, and Sigma precipitates and the creep deformation seems to be affecting the discontinuous arrangement of the grain boundary precipitation, the grain boundary precipitation is considered to play an important role of controlling creep deformation resistance in the present alloys and test condition.
The creep deformation mechanism in the present study has been considered by using the deformation mechanism maps proposed by Ashby [28]. Although there is no deformation mechanism map of the AFA alloys that are available as of today, it is speculated that the deformation mechanism maps of various highly alloyed stainless steels such as 304, 316, 310, alloy 800 H, and so on [29,30] could refer to the deformation mechanism of AFA alloys at a given temperature and stress. The calculated melting points, Tm, of the present AFA alloys range from 1266 to 1288 °C, so that the test temperature at 850 °C corresponds to ~0.72−0.73 Tm. The estimated shear modulus, μ, of AFA alloys is ~75 GPa [31], based on an assumption that the shear modulus is similar to that of a typical highly alloyed stainless steel such as 310 (Fe-25Cr-20Ni base). This leads to an estimated normalized shear stress, σs/μ, of ~2.8 × 10 −4 for the present creep stress, σ, of 30 MPa, where σs = σ/√2. Based on the consideration, the present test condition falls into the region of Coble creep in the deformation mechanism map of the highly alloyed stainless steels mentioned above. Therefore, it is hypothetically considered that the creep deformation of AFA alloys could also be controlled by grain boundary diffusion in the present test condition.
The grain boundary coverage by the secondary phase precipitates is now considered as an important factor to limit the elemental transportation along the grain boundary and, therefore, controlling creep deformation resistance. Although grain boundary coverage was not measured in the present study, the reduction in B2 volume fraction from #135 to #155 (from 13.3 to 15.2 wt.% Cr content) shown in Figure 7a would be expected to reduce the grain boundary’s coverage, especially during creep deformation, which negatively impacted creep deformation resistance. The volume fraction of Laves was mostly constant in the Cr range below 15.2 wt.%, indicating that Laves did not contribute to negative Cr dependence on creep deformation. However, the alternating configuration of B2 and Laves precipitation on grain boundaries helped prevent a rapid coarsening of both types of precipitates during exposure at elevated temperatures [13,25] so that the existence of the Laves phase next to B2 on the grain boundary could also be an important factor for the stability of grain boundary precipitation and providing creep deformation resistance in the present test condition.
On the other hand, the B2 volume fraction was mostly unchanged in the Cr range above 15.2 wt.% (#155 though #180), suggesting that B2 did not contribute to the reduction in observed creep deformation resistance. The Laves volume fraction slightly decreased from 3.4 to 2.4 vol.% with increasing Cr content from 15.2 to 17.3 wt.% Cr (#155 to #180), and the amount of Laves observed on the grain boundary also decreased in SEM-BSE images in Figure 6c–f, which might have negative impacts on creep deformation resistance. However, in the same Cr range, the Sigma volume fraction abruptly increased from 1.0 vol.% in #155 to 9.4 vol.% in #180 such that Sigma formation could highly influence the loss of creep deformation resistance rather than a reduction in Laves. After careful observation, many creep voids adjacent to Sigma precipitates and cracks inside Sigma, especially on the grain boundaries, were found to distribute uniformly in the entire gage section. In addition, the coarsening of Sigma precipitates was obvious in the gage section compared to that in the grip section (Figure 6e,f). Therefore, the defect formation combined with the promoted precipitate coarsening was attributed to the increase in total elongation and the minimum creep rate macroscopically. Although the formation of Sigma on the grain boundaries is known to reduce the creep ductility of various austenitic stainless steels, e.g., Ref. [32], it was not the case in the present study. It is hypothesized that the alternating precipitation of B2 and Sigma on the grain boundary, similarly to B2 and Laves, is considered to effectively prevent the propagation of the observed defects along the grain boundary. Another potential factor is the test temperature at 850 °C, which corresponds to a near nose temperature of Sigma formation C-curves in the TTP (time-temperature-precipitation) diagrams for highly alloyed austenitic stainless steels [33]; for example, 50% of Sigma formation would be completed within 100 h isothermal exposure at 850 °C for an austenitic stainless steel containing 25 wt.% Cr and 22 wt.% Ni. Therefore, the rapid formation kinetics of Sigma could also be expected in present AFA alloys, and it promoted elemental transportations, especially along the grain boundaries, to accelerate macroscopic creep deformations.
Based on the considerations above, the creep deformation resistance in the present AFA alloys is considered to rely on grain boundary precipitation, although the mechanisms reducing creep deformation resistance with Cr content showed a transition at 15.2 wt.% with a change in the majorly contributing secondary phases, from B2 to Sigma, on grain boundaries. The observed continuous reduction in creep-rupture properties could be attributed to the relatively smooth transitions of the secondary phase combination with the Cr content. It should be noted that other AFA formulations make significant use of secondary MC, M23C6, or L12 Ni3Al precipitates to optimize creep resistance [25], whereas the present AFA alloys were designed to optimize oxidation resistance at the expense of creep.

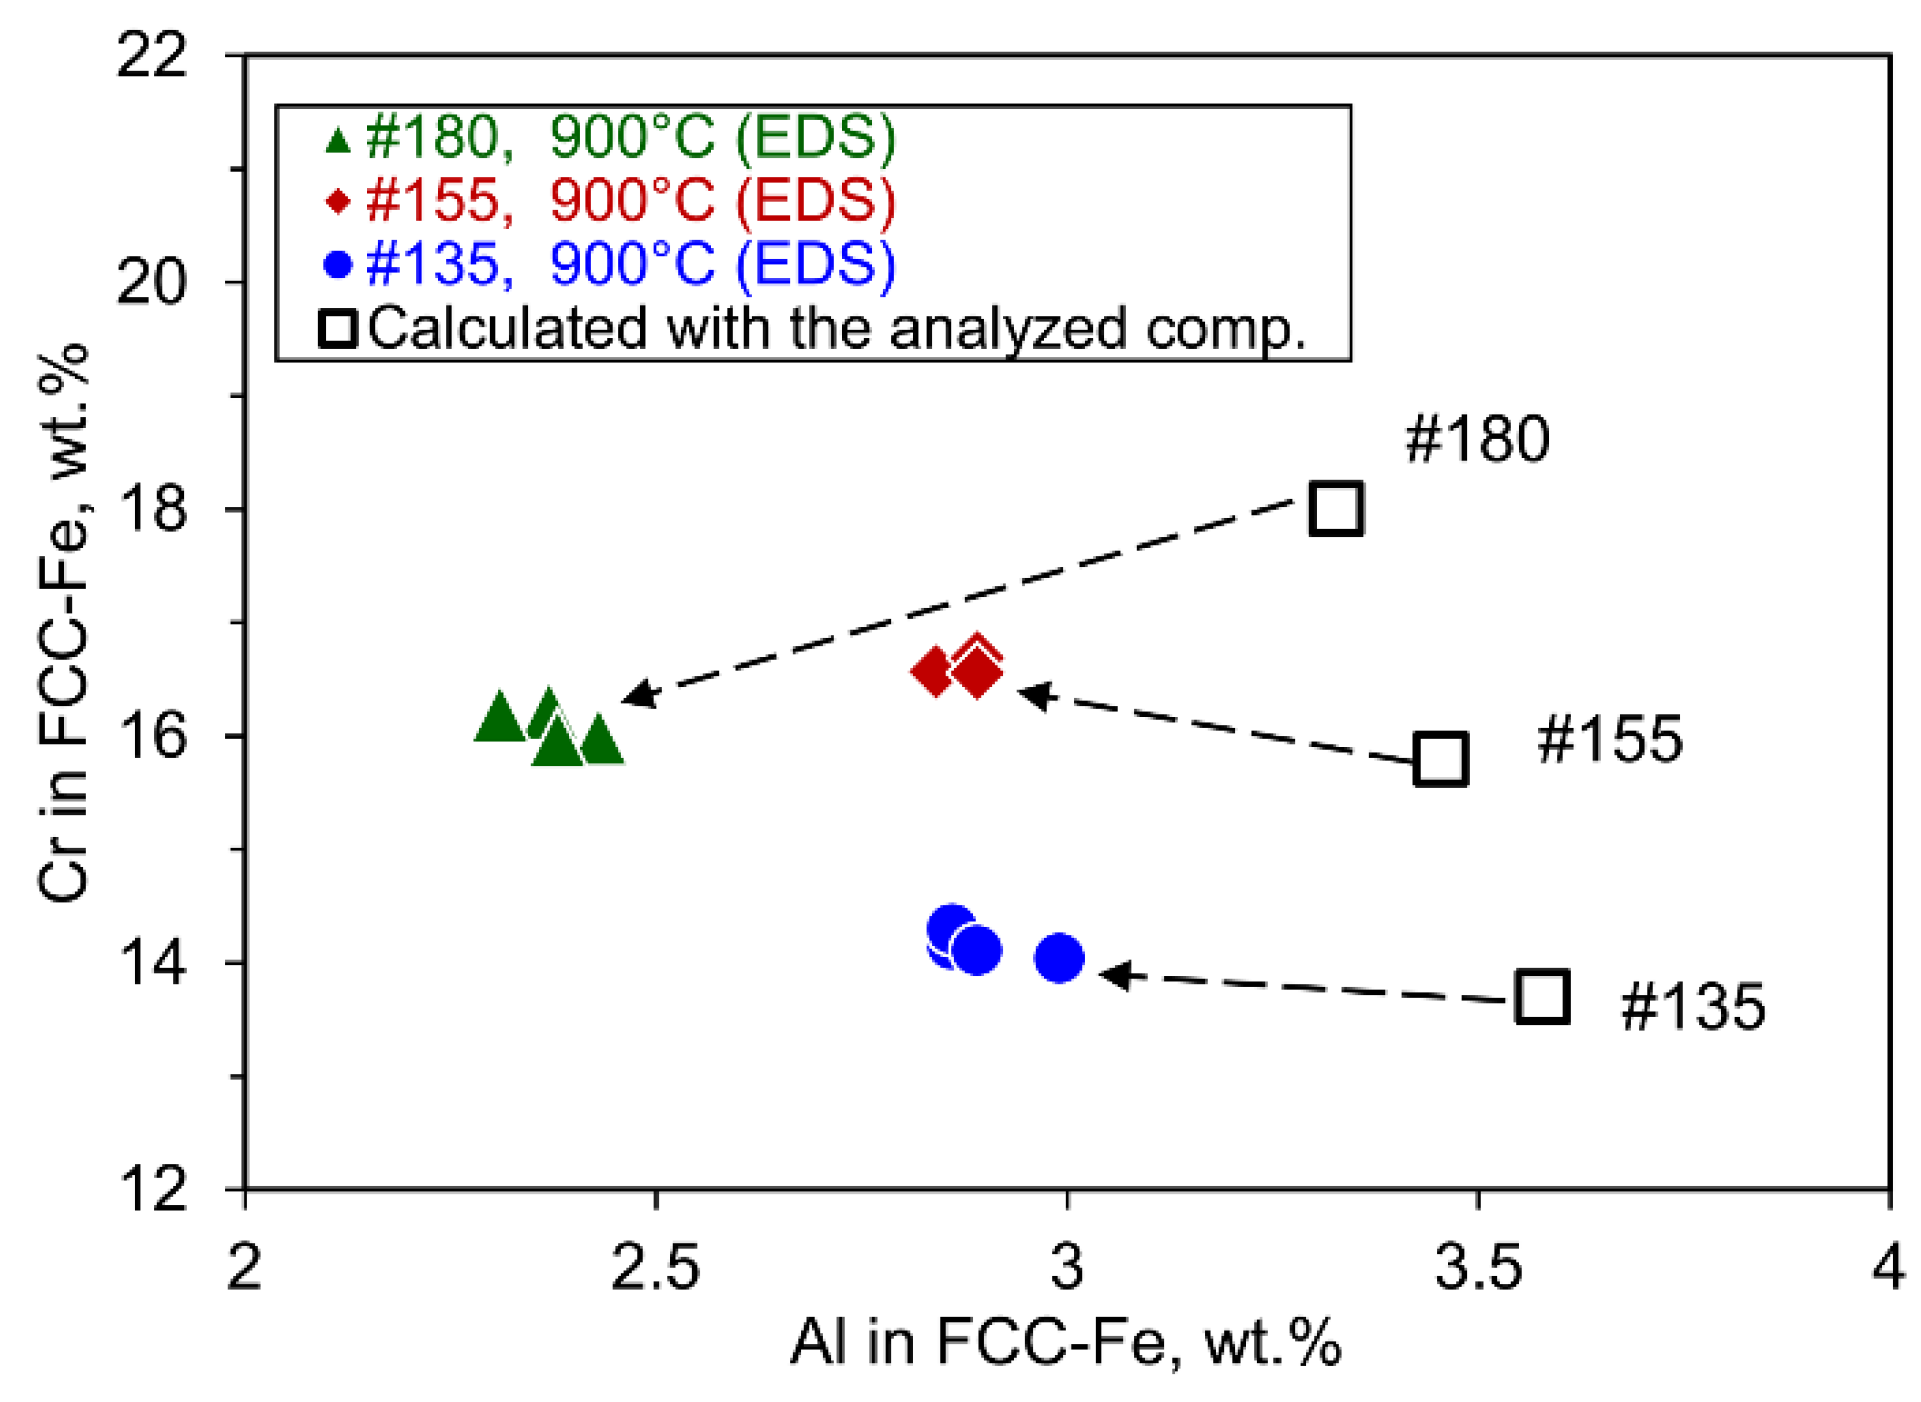
4.2. The Cr and Al Contents in the FCC-Fe Matrix

The required amount of Al in AFA alloys to form and maintain stable external aluminum-oxide formation, against the internal oxide formation, can be reduced by increasing Cr content, which is known as a third element effect [27]. The Al addition into steels strongly destabilizes FCC-Fe (austenite) relative to BCC-Fe (ferrite) so that the minimization of Al content in AFA alloys is essential for creep-resistant alloy designs. Therefore, Cr addition (which also destabilizes FCC, but not to the same extent as Al), combined with Al addition, plays an important role of both oxidation resistance and stabilization of the FCC-Fe matrix for AFA alloy design [11,18]. Because all AFA alloys in this study have a same nominal Al content (4 wt.%), as well as Nb, Ni, Zr, and C, which also significantly impacts AFA oxidation resistance [11,18,19,25], the oxidation resistance is expected to increase with the Cr content monotonically. However, the present AFA alloys exhibited three distinct responses, with respect to the Cr content, during oxidation testing at 900 °C in air + 10% water vapor: (1) a significant loss of surface protection in the low Cr containing alloy (#135), (2) promising oxidation resistance with continuous, parabolic mass gain in the medium Cr containing alloys (#145 through #160), and (3) relatively low mass gain followed by a transition to mass loss in high Cr-containing alloys (#170 and #180). Although the categorization is based on the nominal Cr content of the alloys, microstructural factors of the alloys could also contribute to a significant role in controlling oxidation resistance (e.g., B2 precipitates act as an Al reservoir). The authors previously reported that the Al content within the FCC-Fe matrix in the B2-denuded zone was constant beneath the protective, external alumina scale, whereas the depletions of both Al and Cr contents were observed in the matrix near non-protective oxide nodules [34]. Therefore, FCC-Fe matrix compositions are also considered to be an important factor to control the oxidation behaviors of AFA alloys.
The Al and Cr contents in the FCC-Fe matrix in three AFA alloys, #135, #155, and #180, after oxidation testing at 900 °C for 7000 h were measured by SEM-EDS, as plotted in Figure 11. Multiple measurements were conducted in each alloy at the areas quite far away from the surface. Compared to the calculated result (with the analyzed alloy compositions this time), alloys #135 and #155 showed a significantly lower Al content, which was possibly due to the larger B2 volume fraction in alloys than the calculation, similarly to the results at 850 °C. In contrast, the measured Cr content of the matrices in these alloys were slightly higher than the calculated Cr contents or alloy compositions. Since alloys #135 though #155 did not show Sigma formation but a large amount of B2 with relatively low Cr dissolution, as shown in Figure 12a,b, most of the elemental Cr are considered to be dissolved inside the FCC-Fe matrix. Note that alloy #145 showed similar oxidation kinetics to alloys #150 to #160 in Figure 8, suggesting that the lower Cr limit for promising surface protection of the series of alloys at 900 °C in air with 10% H2O is located between #135 and #145 (13.3 and 13.9 wt.%, respectively).
Alloy #180, on the other hand, revealed a depletion of both Al and Cr contents in the FCC-Fe matrix compared to those in the calculation. Since the Cr content in the matrix of #180 is similar to that of #155, the Cr solution limit in the matrix of the present AFA alloys is considered at around 16 wt.%, and excess Cr causes Sigma formation. In fact, a significant amount of Sigma formation was observed in #180 (Figure 12c). The measured volume fractions of the secondary precipitates are compared as a function of Cr content of the alloys, as shown in Figure 13. The results suggested that not only Sigma phase but also B2-NiAl increased with Cr content. Since a large amount of B2 formation could easily consume Al in the alloy, a significant Al reduction in the matrix in #180 occurred, which possibly promoted the transition from external to internal oxidation, as observed in Figure 10d. The trend of B2 increasing with the Cr content is completely opposite from the results in Figure 7, and the mechanism is still unknown. However, it is obvious that the loss of oxidation resistance in high Cr-containing alloys is attributed to the reduction in both Al and Cr contents in the FCC-Fe matrix, and Sigma formation is considered to have triggered the compositional transition from external to internal oxidation.
It should also be emphasized that oxidation lifetime modeling studies of AFA alloys would also be needed to better understand the condition(s) leading to the loss of protective alumina scale formation, which are more complicated than the straightforward Al or Cr depletion triggers seen in conventional alumina and chromia- forming alloys.

4.3. Alloy Design Implications

Taking all these facts and considerations together, the negative impact of Sigma phase formation in the high Cr-containing AFA alloys, on both creep-rupture properties and oxidation resistance at 850−900 °C, have been identified in the present study. The low Cr-containing alloy was preferred for creep-rupture performance, but the lowest Cr limit also appeared for surface protection through stable alumina-scale formation. The Cr range of 13.9 to 15.2 wt.% was found to show the best-balanced properties in present AFA alloys, and the degradation mechanism of both creep and oxidation properties were correlated with microstructure response. Since the role of the secondary phase precipitation on material performance becomes clear, it is expected to have more accurate phase prediction in thermodynamic calculation for steels containing Al and Nb, similarly to present AFA alloys, which will accelerate material development in the near future.

5. Conclusions

In the present study, the roles of Cr content on high-temperature material performance in a series of AFA alloys, nominally based on Fe-(13.5-18)Cr-25Ni-4Al-1.5Nb-0.1C in weight percent, have been evaluated and then correlated with the secondary phase precipitation observed after creep-rupture testing at 850 °C and 30 MPa and oxidation testing at 900 °C in air + 10% water vapor for up to total 7000 h exposure.
Cr addition negatively affected creep-rupture properties, and the reduction in the creep-deformation resistance seemed smooth in the range from 13.3 to 17.3 wt.% Cr, although the strengthening mechanism correlated with the secondary phase precipitation had a clear transition at 15.2 wt.% Cr. Creep-rupture life monotonically decreased, and the minimum creep rate as well as the elongation to rupture increased, with increasing Cr content. Creep deformation is considered to be controlled by the Coble creep mechanism, and the response of the creep-rupture properties with Cr content is correlated with the changes in the secondary phase precipitation on grain boundaries; the reduction in B2 volume fraction was up to 15.2 wt.% Cr and the increase in Sigma volume fraction was above 15.2 wt.% Cr. It was also found that the Sigma formation did not cause a reduction in creep ductility at the present test conditions.
The oxidation test at 900 °C in a water-vapor containing environment revealed three different mass change responses with Cr content: (1) the alloy with 13.3 wt.% Cr resulted in a significant mass loss; (2) the alloys with 13.9 to 15.7 wt.% Cr enabled the formation of stable, protective external alumina scales as well as prevented internal oxidation/nitridation for up to total 7000 h exposure; and (3) the alloys with >16.7 wt.% Cr formed Sigma precipitates as well as higher volume fraction of B2 than the others, which caused a reduction in not only Cr but also Al in the austenite matrix, resulting in less oxidation resistance than the other alloys.
The negative impact and its mechanism of Sigma phase formation in high Cr containing AFA alloys, on both creep-rupture properties and oxidation resistance at 850−900 °C, were identified in the present study. The low Cr-containing alloy was preferred for creep-rupture performance, but a lowest Cr limit also appeared for surface protection through stable alumina-scale formation. The present results will guide the Cr range optimized for balanced strength, creep, and oxidation properties supported by the microstructural response. It is also expected that the present study would have provided useful experimental results to support the further improvement of thermodynamic databases of steels containing Al and Nb, similarly to the present AFA alloys.

Author Contributions

Conceptualization, Y.Y. and M.P.B.; validation, Y.Y., Q.-Q.R. and M.P.B.; formal analysis, Y.Y. and Q.-Q.R.; investigation, Y.Y. and Q.-Q.R.; writing—original draft preparation, Y.Y.; writing—review and editing, Y.Y. and M.P.B.; visualization, Y.Y.; All authors have read and agreed to the published version of the manuscript.

Funding

This work was performed in support of the US DOE Office of Fossil Energy and Carbon Management (FECM) through the Solid Oxide Fuel Cell Core Technology and Innovative Concepts program (DE-FE0027947). SEM characterization was performed at ORNL’s CNMS, which is a US DOE office of science user facility. A part of the study was also supported by US-DOE, Office of FECM, the Advanced Research Materials Program and the Crosscutting Technology High Performance Materials Research Program.

Data Availability Statement

Not applicable.

Acknowledgments

The authors would like to thank Xingbo Liu of West Virginia University for leading the entire project; Kevin Hanson, Greg Cox, Dustin Heidel, and Daniel Moore of ORNL for material preparation; George Garner, Michael Stephens, Tracie Lowe, and Victoria Cox of ORNL for experimental works; and Rishi Pillai and Jon Poplawsky of ORNL for their thoughtful review and guidance for the manuscript preparation. Notice: This manuscript has been authored by UT-Battelle, LLC, under contract DE-AC05-00OR22725 with the US Department of Energy (DOE). The US government retains and the publisher, by accepting the article for publication, acknowledges that the US government retains a nonexclusive, paid-up, irrevocable, worldwide license to publish or reproduce the published form of this manuscript, or allow others to do so, for US government purposes. DOE will provide public access to these results of federally sponsored research in accordance with the DOE Public Access Plan (http://energy.gov/downloads/doe-public-access-plan (accessed on 22 April 2022)).

Conflicts of Interest

The authors declare no conflict of interest.

References

  1. ReferencesDi Gianfrancesco, A. The fossil fuel power plants technology. In Materials for Ultra-Supercritical and Advanced Ultra-Supercritical Power Plants; Di Gianfrancesco, A., Ed.; Woodhead Publishing: Duxford, UK, 2017; pp. 1–50. [Google Scholar]
  2. Viswanathan, R.; Bakker, W. Materials for Ultrasupercritical Coal Power Plants—Boiler Materials: Part 1. J. Mater. Eng. Perform. 2001, 10, 81–95. [Google Scholar] [CrossRef]
  3. Viswanathan, R.; Bakker, W. Materials for Ultrasupercritical Coal Power Plants—Turbine Materials: Part II. J. Mater. Eng. Perform. 2001, 10, 96–101. [Google Scholar] [CrossRef]
  4. Yamamoto, Y.; Brady, M.P.; Lu, Z.P.; Maziasz, P.J.; Liu, C.T.; Pint, B.A.; More, K.L.; Meyer, H.M.; Payzant, E.A. Creep-Resistant, Al2O3-Forming Austenitic Stainless Steels. Science 2007, 316, 433–436. [Google Scholar] [CrossRef] [PubMed]
  5. Brady, M.P.; Yamamoto, Y.; Santella, M.L.; Maziasz, P.J.; Pint, B.A.; Liu, C.T.; Lu, Z.P.; Bei, H. The Development of Alumina-Forming Austenitic Stainless Steels for High-Temperature Structural Use. JOM 2008, 60, 12–18. [Google Scholar] [CrossRef]
  6. Brady, M.P.; Magee, J.; Yamamoto, Y.; Helmick, D.; Wang, L. Co-optimization of wrought alumina-forming austenitic stainless steel composition ranges for high-temperature creep and oxidation/corrosion resistance. Mater. Sci. Eng. A 2014, 590, 101–115. [Google Scholar] [CrossRef]
  7. Yamamoto, Y.; Santella, M.L.; Liu, C.T.; Evans, N.D.; Maziasz, P.J.; Brady, M.P. Evaluation of Mn substitution for Ni in alumina-forming austenitic stainless steels. Mater. Sci. Eng. A 2009, 524, 176–185. [Google Scholar] [CrossRef]
  8. Yamamoto, Y.; Santella, M.L.; Brady, M.P.; Bei, H.; Maziasz, M.J. Effect of Alloying Additions on Phase Equilibria and Creep Resistance of Alumina-Forming Austenitic Stainless Steels. Met. Mater. Trans. A 2009, 40, 1868–1880. [Google Scholar] [CrossRef]
  9. Yamamoto, Y.; Brady, M.P.; Muralidharan, G.; Pint, B.A.; Maziasz, P.J.; Shin, D.; Shassere, B.; Babu, S.S.; Kuo, C.H. Development of creep-resistant, alumina-forming ferrous alloys for high-temperature structural use. In Proceedings of the ASME 2018 Symposium on Elevetad Temperature Application of Materials for Fossil, Nuclear, and Petrochemical Industries, Seattle, WA, USA, 3–5 April 2018. ETAM2018-6727. [Google Scholar]
  10. Muralidharan, G.; Yamamoto, Y.; Brady, M.P.; Leonard, D.; Cakmak, E.; Ros, T.; Fauske, S.; Hadley, G.; Pankiw, R.; Myers, J. Recent Developments in Cast Alumina-Forming Austenitic Stainless Steel Furnace Rolls. In Proceedings of the 2nd International Symposium on The Recent Developments in Plate Steels, AISI, Memphis, TN, USA, 3–6 June 2018; pp. 513–520. [Google Scholar]
  11. Brady, M.P.; Unocic, K.A.; Lance, M.J.; Santella, M.L.; Yamamoto, Y.; Walker, L.R. Increasing the Upper Temperature Oxidation Limit of Alumina Forming Austenitic Stainless Steels in Air with Water Vapor. Oxid. Met. 2011, 75, 337–357. [Google Scholar] [CrossRef]
  12. Sourmail, T. Precipitation in creep resistant austenitic stainless Steels. Mater. Sci. Technol. 2001, 17, 1–14. [Google Scholar] [CrossRef]
  13. Yamamoto, Y.; Brady, M.P.; Santella, M.L.; Bei, H.; Maziasz, P.J.; Pint, B.A. Overview of Strategies for High-Temperature Creep and Oxidation Resistance of Alumina-Forming Austenitic Stainless Steels. Met. Mater. Trans. A 2011, 42, 922–931. [Google Scholar] [CrossRef] [Green Version]
  14. Yamamoto, Y.; Muralidharan, G.; Brady, M.P. Development of L12-ordered Ni3(Al,Ti)-strengthened alumina-forming austenitic stainless steel alloys. Scr. Mater. 2013, 69, 816–819. [Google Scholar] [CrossRef]
  15. Zhou, L.; Zeng, Z.; Brady, M.P.; Leonard, D.N.; Meyer III, H.M.; Yamamoto, Y.; Li, w.; Collins, G.; Liu, X. Chromium evaporation and oxidation characteristics of alumina-forming austenitic stainless steels for balance of plant applications in solid oxide fuel cells. Int. J. Hydrogen Energ. 2021, 46, 21619–21633. [Google Scholar] [CrossRef]
  16. Zhou, L.; Mason, J.H.; Li, W.; Liu, X. Comprehensive review of chromium deposition and poisoning of solid oxide fuel cells (SOFCs) cathode materials. Renew. Sust. Energ. Rev. 2020, 134, 110320–110342. [Google Scholar] [CrossRef]
  17. Yamamoto, Y.; Takeyama, M.; Lu, Z.P.; Liu, C.T.; Evans, N.D.; Maziasz, P.J.; Brady, M.P. Alloying effects on creep and oxidation resistance of austenitic stainless steel alloys employing intermetallic precipitates. Intermetallics 2008, 16, 453–462. [Google Scholar] [CrossRef]
  18. Brady, M.P.; Yamamoto, Y.; Santella, M.L.; Walker, L.R. Composition, Microstructure, and Water Vapor Effects on Internal/External Oxidation of Alumina-Forming Austenitic Stainless Steels. Oxid. Met. 2009, 72, 311–333. [Google Scholar] [CrossRef]
  19. Brady, M.P.; Yamamoto, Y.; Santella, M.L.; Pint, B.A. Effects of minor alloy additions and oxidation temperature on protective alumina scale formation in creep-resistant austenitic stainless steels. Scr. Mater. 2007, 57, 1117–1120. [Google Scholar] [CrossRef]
  20. Brady, M.P.; Yamamoto, Y.; Leonard, D.N.; Meyer II, H.M.; Momono, S.; Fukada, S.; Uehara, T.; Ashary, A.; Zhou, L.; Liu, X. Development of Alumina-Forming Austenitic Alloys for Solid Oxide Fuel Cell Balance of Plant Components. Meet. Abstr. 2021, MA2021-01, 794. [Google Scholar] [CrossRef]
  21. Rasband, W.S. ImageJ, U.S. National Institutes of Health, Bethesda, MD, USA, 1997–2018. Available online: https://imagej.nih.gov/ij/ (accessed on 4 March 2022).
  22. HAYNES®625 Alloy Principal Features. Available online: https://www.haynesintl.com/docs/default-source/pdfs/new-alloy-brochures/high-temperature-alloys/brochures/625-brochure.pdf?sfvrsn=967229d4_26 (accessed on 4 March 2022).
  23. Kvapilova, M.; Dvorak, J.; Kral, P.; Svoboda, M.; Sklenicka, V. Application of the Monkman-Grant relationship for ultrafine-grained metallic materials. Key Eng. Mater. 2014, 577–578, 137–140. [Google Scholar] [CrossRef]
  24. Yamamoto, Y.; Brady, M.P.; Lu, Z.P.; Liu, C.T.; Takeyama, M.; Maziasz, P.J.; Pint, B.A. Alumina-Forming Austenitic Stainless Steels Strengthened by Laves Phase and MC Carbide Precipitates. Met. Mater. Trans. A 2007, 38, 2737–2746. [Google Scholar] [CrossRef]
  25. Yammaoto, Y.; Brady, M.P.; Ren, Q.Q.; Poplawsky, J.; Hoelzer, D.T.; Lance, M.J. Creep Behavior and Phase Equilibria in Model Precipitate Strengthened Alumina-Forming Austenitic Alloys. JOM 2022, 74, 1453–1468. [Google Scholar] [CrossRef]
  26. Stott, H.; Wood, G.C.; Stringer, J. The Influence of Alloying Elements on the Development and Maintenance of Protective Scales. Oxid. Met. 1995, 44, 113–145. [Google Scholar] [CrossRef]
  27. Opila, E. Volatility of Common Protective Oxides in High-Temperature Water Vapor: Current Understanding and Unanswered Questions. Mater. Sci. Forum 2004, 461–464, 765–774. [Google Scholar] [CrossRef] [Green Version]
  28. Ashby, M.F. A first report on deformation-mechanism maps. Acta Met. 1972, 20, 887–897. [Google Scholar] [CrossRef]
  29. Frost, H.J.; Ashby, M.F. Deformation-mechanism maps for pure iron, two austenitic stainless steels, and a low-alloy ferritic steel. In Fundamental Aspects of Structural Alloy Design, Plenum Press; Jaffee, R.I., Wilcox, B.A., Eds.; Plenum Press: New York, NY, USA, 1977; pp. 27–65. [Google Scholar]
  30. Beardsley, A.L.; Bishop, C.M.; Kral, M.V. A Deformation Mechanism Map for Incoloy 800H Optimized Using the Genetic Algorithm. Met. Mater. Trans. A 2019, 50, 4098–4110. [Google Scholar] [CrossRef]
  31. Vitos, L.; Korzhavyi, P.A.; Johansson, B. Elastic Property Maps of Austenitic Stainless Steels. Phy. Rev. Let. 2002, 88, 155501. [Google Scholar] [CrossRef] [PubMed]
  32. Sawada, K.; Sekido, K.; Kimura, K. Creep strength and microstructural change of 25cr-20ni-nb-n steel. In Proceedings of the Joint EPRI—123HiMAT International Conference on Advances in High Temperature Materials, Nagasaki, Japan, 21–24 October 2019; pp. 665–672. [Google Scholar]
  33. Hsieh, C.C.; Wu, W. Overview of Intermetallic Sigma (σ) Phase Precipitation in Stainless Steels. ISRN Met. 2012, 2012, 732471. [Google Scholar] [CrossRef]
  34. Brady, M.P.; Yamamoto, Y.; Pint, B.A.; Santella, M.L.; Maziasz, P.J.; Walker, L.R. On the Loss of Protective Scale Formation in Creep-Resistant, Alumina—Forming Austenitic Stainless Steels at 900 °C in Air. Mater. Sci. Forum 2008, 595–598, 725–732. [Google Scholar] [CrossRef]
Figure 1. Phase equilibrium of the alloys calculated by JMatPro v.9: (a) #135, (b) #155, and (c) #180.
Metals 12 00717 g001
Figure 2. Predicted phase fractions (a,b) and Al and Cr contents in the FCC-Fe matrix (c,d) of the AFA alloys at 850 °C (a,c) and 900 °C (b,d) plotted as a function of the nominal Cr content, calculated by JMatPro v.9.
Metals 12 00717 g002
Figure 3. Creep-rupture properties of the AFA alloys tested at 850 °C and 30 MPa plotted as a function of the analyzed Cr content: (a) creep-rupture life, (b) minimum creep rate, and (c) elongation.
Metals 12 00717 g003
Figure 4. Relationship between the elongation normalized by the creep-rupture life and the minimum creep rate of AFA alloys tested at 850 °C and 30 MPa.
Metals 12 00717 g004
Figure 5. A SEM-BSE image of the alloy #155 after creep-rupture testing (a), together with the acquired EDS-spectra of the observed secondary precipitates such as Laves (b), B2 (c), NbC (d), and Sigma (e).
Metals 12 00717 g005
Figure 6. SEM-BSE images showing the cross-sectional microstructure of the AFA alloys after creep-rupture testing at 850 °C and 30 MPa: (a) #135, grip section, (b) #135, gage section, (c) #155, grip section, (d) #155, gage section, (e) #180, grip section, and (f) #180, gage section.
Metals 12 00717 g006
Figure 7. Measured volume fractions of (a) B2-NiAl, (b) Laves-Fe2Nb, and (c) Sigma phases in creep-ruptured AFA alloys, compared with the predicted phase fractions at 850 °C.
Metals 12 00717 g007
Figure 8. Specific mass change data of AFA alloys exposed at 900 °C in air + 10% water vapor in 500 h cycle (a), plotted as a function of total exposure time (b). The mass gains of a commercial chromia-forming nickel-base alloy 625 and 310 austenitic stainless steel are also shown for comparison, with data from Ref. [15].
Metals 12 00717 g008
Figure 9. Pictures of coupon specimens after oxidation testing at 900 °C in air with 10% water vapor: (a) #135 tested for 7000 h, (b) #155 for 7000 h, (c) #180 for 7000 h, and (d) 310 for 10,000 h.
Metals 12 00717 g009
Figure 10. SEM-BSE images showing cross-sectional microstructure near the surface of AFA alloys after exposure at 900 °C in air with 10% water vapor for total 7000 h and that of commercial 310 austenitic stainless steel tested for total 10,000 h: (a) #135, near center; (b) #135, near edge; (c) #155, (d) #180; and (e) 310 austenitic stainless steel.
Metals 12 00717 g010
Figure 11. The Cr and Al contents in the FCC-Fe matrix of AFA alloys after oxidation testing at 900 °C (filled symbols) measured by SEM-EDS spot analyses, together with computationally predicted compositions (open square symbols).
Metals 12 00717 g011
Figure 12. SEM-BSE images showing cross-sectional microstructure, far from the specimen surface, of the AFA alloys after oxidation testing at 900 °C for 7000 h: (a) #135, (b) #155, and (c) #180.
Metals 12 00717 g012
Figure 13. Measured volume fractions of B2-NiAl, Laves-Fe2Nb, and Sigma phase in AFA alloys exposed at 900 °C for 7000 h.
Metals 12 00717 g013
Table 1. Nominal and analyzed composition of the AFA alloys in the present study, in wt.%.
AlloysFeCrMnNiCuAlSiNbVTiMoZrCB
#135Nominal51.0413.502.0025.000.504.000.151.500.050.052.000.100.10000.010
Analyzed 50.6913.261.9225.690.493.900.151.560.110.051.960.100.09190.015
#145Nominal50.0414.502.0025.000.504.000.151.500.050.052.000.100.10000.010
Analyzed 50.9213.911.8825.060.483.800.141.520.100.051.920.100.09210.015
#150Nominal49.5415.002.0025.000.504.000.151.500.050.052.000.100.10000.010
Analyzed 49.814.601.9025.380.483.860.141.540.100.051.930.100.09190.013
#155Nominal49.0415.502.0025.000.504.000.151.500.050.052.000.100.10000.010
Analyzed 48.9315.201.9125.590.483.870.141.560.110.051.940.100.09260.013
#160Nominal48.5416.002.0025.000.504.000.151.500.050.052.000.100.10000.010
Analyzed 48.5815.651.9025.560.483.860.141.530.100.051.940.100.09170.011
#170Nominal47.5417.002.0025.000.504.000.151.500.050.052.000.100.10000.010
Analyzed 47.4816.661.9125.590.483.860.141.550.110.051.940.100.09110.013
#180Nominal46.5418.002.0025.000.504.000.151.500.050.052.000.100.10000.010
Analyzed 47.6217.311.8725.040.483.770.131.500.110.041.900.100.09230.011
(S: 7–10 wppm, O: 10–19 wppm, N: 20–138 wppm)
Table 2. Analyzed composition of the benchmark commercial alloys (nickel base alloy 625 and 310 austenitic stainless steel, with data from Ref. [15]) in wt.%.
AlloysFeCrMnNiCuAlSiNbVTiMoZrCBN
625 *4.6022.060.36Bal.-0.180.243.38-0.218.22-0.04--
310 **Bal25.550.8419.160.20-0.57--0.0050.20-0.05-0.044
* Co: 0.02 wt.%; Ta: 0.01 wt.%; p: 100 wppm; S: 1 wppm; ** p: 200 wppm; S: 1 wppm.
Publisher’s Note: MDPI stays neutral with regard to jurisdictional claims in published maps and institutional affiliations.

