Article

Effect of Vacuum Heat Treatment on the Microstructure of a Laser Powder-Bed Fusion-Fabricated NiTa Alloy

1
Department of Mechanical and Industrial Engineering, University of Toronto, 5 King’s College Road, Toronto, ON M5S 3G8, Canada
2
Department of Materials Science and Engineering, University of Toronto, 184 College Street, Toronto, ON M5S 3E4, Canada
*
Author to whom correspondence should be addressed.
Metals 2022, 12(5), 700; https://doi.org/10.3390/met12050700
Submission received: 9 March 2022 / Revised: 12 April 2022 / Accepted: 13 April 2022 / Published: 19 April 2022
(This article belongs to the Topic Additive Manufacturing)

Abstract

:
The semiconductor industry uses a physical vapor-deposition process, with a nickel-tantalum (NiTa) alloy-sputtering target, to apply an amorphous NiTa thin film layer between the magnetic soft underlayer and substrate of a heat-assisted magnetic-recording hard disk drive. Currently, the alloy-sputtering target is produced through a hot-pressing (HP) process followed by a hot isostatic pressing (HIP). In this study, we demonstrate a better process for producing the sputtering targets, using laser powder-bed fusion (L-PBF) followed by vacuum heat treatment (VHT), to produce alloy targets with superior microstructural characteristics that will produce better-quality thin films. We compare as-fabricated (just L-PBF) specimens with specimens produced by L-PBF and then annealed at different conditions. Where the as-fabricated specimens are characterized by columnar dendrites, annealing at 1275 °C for 4 h produces a uniform equiaxed grain microstructure and a uniformly dispersed fcc Ta precipitate. In addition, the average microhardness value is reduced from 725 ± 40 to 594 ± 26 HV0.2 and the maximum compressive residual stress is reduced from 180 ± 50 MPa to 20 ± 10 MPa as the result of dislocation elimination during the recovery and recrystallization process. Finally, due to microstructure recrystallization, the VHT-treated L-PBF NiTa specimens exhibit a smaller grain size (2.1 ± 0.2 µm) than the traditional HIP-treated HP specimens (6.0 ± 0.6 µm).

1. Introduction

Nickel-tantalum (NiTa) thin films are extensively used by the semiconductor industry to enhance the adhesion and thermal properties of the magnetic soft underlayer in heat-assisted magnetic-recording (HAMR) hard disk drives, as reported by [1]. These thin films are produced by physical vapor deposition (PVD) with a NiTa-sputtering target. Currently, the sputtering-target manufacturers employ a hot-pressing (HP) process followed by a hot isostatic pressing (HIP) to form alloy powder into a dense and composition-homogenized structure [2,3]. However, the HIP treatment is time-consuming and tends to deform parts, resulting in significant cost and material loss. With the rapid growth of additive manufacturing (AM) technologies, it may be possible to adopt an AM technology to overcome existing manufacturing challenges.
Laser powder-bed fusion (L-PBF) is an AM process capable of fabricating complex metal parts with nearly full density, high dimensional precision, good mechanical properties and surface integrity, directly from metal powder [4,5]. Compared with traditional manufacturing technologies, L-PBF reduces production time, thereby significantly enhancing production efficiency. Much research has been conducted into the L-PBF of steel alloys [6,7], nickel superalloys [8,9,10], titanium alloys [11,12], and aluminum alloys [13,14,15], for aerospace, medical and automotive applications. Y. Zhou et al. [16] reported the mechanical properties, heat formation and lattice structure of NiTa binary intermetallic compounds. C. Zhou et al. [17] further investigated the microstructure and thermodynamic parameters of various phases in the as-cast NiTa system. To date, the research on NiTa alloys has focused only on metallurgical analyses of as-cast NiTa [16,17,18,19,20]. L-PBF fabrication of a NiTa alloy has never been investigated.
L-PBF of sputtering targets has great potential, as the process could use the same gas-atomized metal-powder feedstock as the current process, which would minimize the challenges and risks of technology integration into an existing production line, and due to the rapid heating and cooling rates during L-PBF, the microstructures obtained would be much finer. NiTa-sputtering targets made with the traditional process (HP follow by HIP) have an equiaxed grain structure with an average grain size of 6 ± 0.6 µm. If L-PBF could produce a finer microstructure in the sputtering target, it would allow the vaporized element to be more uniformly distributed on the surface of the disc substrate, and presumably increase the performance of the thin film applied on the disc substrate.
However, the final properties of parts fabricated by L-PBF remain difficult to control due to the formation of defects such as solidification cracks and porosity. One of the major challenges is the significant thermal gradients in regions adjacent to the heat-affected zone (HAZ) caused by rapid heating and cooling during L-PBF. The large thermal gradients in the HAZ lead to a mismatch of the coefficients of thermal expansion (CTE), that cause tensile stresses to develop across adjacent grains, resulting in the formation of solidification cracks [21]. Wang et al. [20] reported that NiTa alloy, a brittle binary bulk metallic glass, is prone to cracking under stress.
This study aims to present new data toward a better understanding of the influence of vacuum heat treatment on L-PBF-fabricated brittle metallic glass NiTa. Accordingly, in this work is an optimized L-PBF process for fabrication of NiTa alloy-sputtering targets; an optimized laser-scanning strategy to reduce the formation of defects; and a subsequent postprocess heat treatment to refine and homogenize the microstructure and to prevent accumulated thermal residual stresses from causing further crack propagation. Thirty-five NiTa alloy specimens were fabricated by L-PBF and then selectively vacuum-annealed to reduce residual stresses, as well as to homogenize and refine the microstructure. The microstructure of the specimens was characterized by optical microscopy (OM), scanning electron microscopy (SEM), and transmission electron microscopy (TEM). The crystal orientation was analyzed under electron backscatter diffraction (EBSD), the microhardness was measured by Vickers microindentation, and the residual stress was investigated by X-ray diffraction (XRD). The effects of the vacuum heat treatment on the phase composition, microstructure, crystal orientation, residual stress and microhardness of the L-PBF-fabricated specimens are presented and discussed. Finally, we compare the microstructure, density and microhardness of specimens fabricated by L-PBF followed by VHT, and HP followed by HIP.

2. Experimental

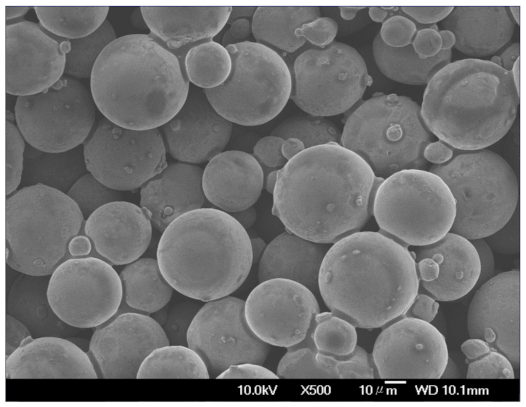
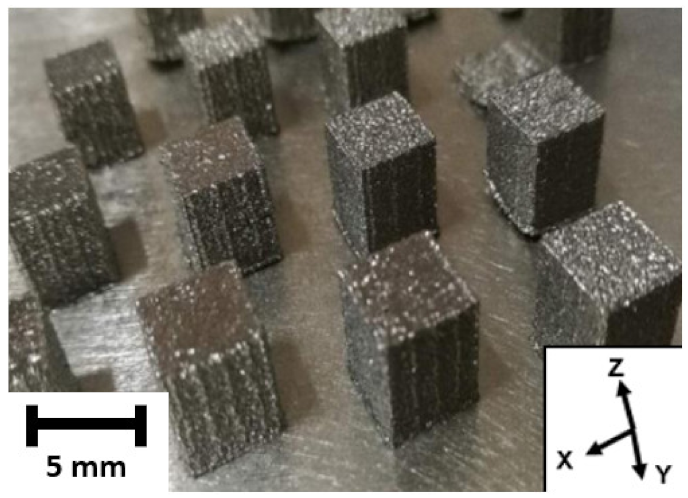
2.1. Fabrication of NiTa Alloy Specimens

The composition of the NiTa alloy powder was 64 at.% Ni and 36 at.% Ta, produced using a vacuum induction-melting gas-atomization (VIGA) technique. The powder was graded with a laser-diffraction particle-size analyzer; the particle-size distribution ranged from 20 µ m to 100 μ m with a mean particle diameter of ~30 ± 5 μm. As shown in Figure 1, the NiTa powder particles had a smooth spherical shape, with a small number of satellites.
The Farsoon M271 laser-sintering system (Farsoon, Hunan, China) consists of an ytterbium fiber laser in an argon atmosphere. The platform temperature was set to 30 °C, with no preheating. By varying the operating conditions, the scanning parameters were evaluated parametrically. To obtain a fully dense structure with minimal voids and microcracks, the optimized parameters were found to be as follows: laser speed 200 mm/s, laser power 200 W, layer thickness 120 µm, hatch spacing 120 µm, and laser spot size 300 µm. The input energy density was estimated to be 69 J/mm3. These scanning parameters ensured the consistent fabrication of high-relative-density (~99.5%) parts. As shown in Figure 2, a rectangular JIS S45C steel building platform with an area of 275 × 275 mm2 was utilized to fabricate 35 NiTa cubes with dimensions of 5 × 5 × 5 mm3. As shown in Figure 3, the scanning strategy used a continuous beam mode and employed a zig-zag pattern at a 45° rotation angle with respect to the substrate plate. The pattern minimized the interference between the recoating blade and the boundary of each individual part.

2.2. Vacuum Heat Treatment

Five as-fabricated specimens were set aside to compare to the annealed specimens. The other thirty cubes were divided into sets of five and annealed at different temperatures and times, as summarized in Table 1, and then allowed to cool naturally within the furnace to room temperature. The specimens were annealed in sealed and evacuated quartz capsules (6 × 10⁻² Pa) to minimize the effect of oxidation, because NiTa reacts with oxygen and nitrogen to form oxides and nitrides, respectively. The holding temperature was limited to well below 1394 °C which is the liquidus temperature for 64 at.% Ni and 36 at.% Ta, as reported by Okamoto et al. [22].

2.3. XRD for Chemistry Analysis

The as-fabricated specimens were removed from the base plate by a wire electric-discharge machine. Three as-fabricated specimens and three of each annealed case were examined by indexing the diffraction peaks measured by X-ray diffraction analysis. The surfaces of the transverse and sagittal planes of specimens were gently ground with SiC paper and polished using an alumina suspension. The XRD analysis used Cu-Kα radiation at 40 keV and a beam current of 30 mA. The XRD scan range was determined based on XRD analyses of the Ni-Ta system reported by Wang et al. [20]. The range of diffraction angle 2 θ was varied from 35 ° to 50 ° with a step size of 0.02 ° and a scanning rate of 0.2 ° /min.

2.4. XRD Two-Tilt Method for Residual Stress Evaluation

Chen et al. [23] reported that the shift of maximum diffracted intensity peaks at various X-ray incident angles, the two-tilt method could accurately estimate the surface residual stress field. The lattice spacing of diffracted intensity from an X-ray diffraction spectrum is an average diffraction value for grains on the surface of the specimen. The residual stress was then estimated based on the calculation of the macrostrain on the surface of specimens, expressed as:
ε 33 ϕ ψ = d ψ ϕ d 0 d 0 = 1 + υ E σ ψ sin ψ 2 υ E σ 11 + σ 22
We determined the XRD scan range based on other XRD analyses of the Ni-Ta system [17,20]. The range of diffraction angle 2 θ was varied from 42 ° to 46 ° with a step size of 0.01 ° and a scanning rate of 0.005 ° /s. Then, the residual stress on the surfaces of the specimens was determined as the distance between identical index peaks measured at different X-ray incident angles (0 ° to 10 ° and 20 ° ) on the transverse and sagittal planes of specimens.

2.5. Vickers Microindentation for Microhardness Analysis

Microhardness was measured with the Vickers microindentation method. For this study, the measuring surfaces of the as-fabricated specimens were gently ground with SiC paper and polished using an alumina suspension. As illustrated in Figure 4, measurements were taken along the dotted lines on the sagittal and transverse planes of specimens from each case. A load of 200 g-force (gf) with a loading time of 20 s was applied to the measurement point. The analysis was performed at regions without pores and cracks to mitigate their influence on the experimental results.

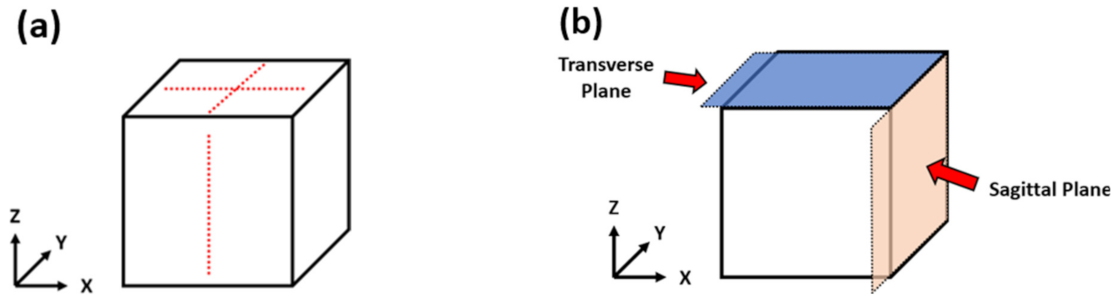
2.6. Microscopic and Metallurgical Characterization

The remaining two as-fabricated specimens and two of each annealed case were mounted in thermoset conductive phenolic compound. After metallographic preparation, the specimens were etched for 15 min in a Kroll etchant bath to reveal grain structures for OM and SEM analysis. For EBSD analysis, the specimens were vibration-polished with a colloidal silica suspension. The specimens were examined using a Hitachi SU5000 (Tokyo, Japan) and a JEOL JSM6610 SEM (Tokyo, Japan) using secondary electron and backscatter electron contrast (SE and BEC) imaging on the sagittal and transverse planes. EBSD was performed in a Hitachi S-3500 variable-pressure SEM with an Oxford EBSD system.
After OM and SEM analyses, one mounted specimen from each case was ion-milled with a focused ion beam on the top surface along the transverse plane, to acquire thin slices for further phase composition and crystallographic analysis by an HF 3300 ETEM (Hitachi, Tokyo, Japan) with energy-dispersive X-ray spectroscopy (EDX), and selected area electron-diffraction (SAED) setup.

3. Results

3.1. XRD Analysis

3.1.1. Phase Composition

Figure 5 compares XRD diffraction peaks of the as-fabricated specimen, NiTa powder and annealed specimens (cases 4 to 6). The XRD and microstructure analyses reveal that the crystalline structure of the primary phase, Ni2Ta, does not transform due to annealing. Figure 5b) shows that the as-fabricated L-PBF specimen has the same diffraction pattern as the NiTa powder. As shown in Figure 5c, both Ni 2 Ta and μ - NiTa phases are identified through XRD analyses. Since the diffraction intensity of μ - NiTa phase is small, the diffraction peaks for μ - NiTa are not as apparent compared to those of the Ni 2 Ta phase. The broadening of the diffraction peak in annealed specimens is the result of grain refinement during the recrystallization process [24]. Compared with the standard lattice parameter for Ni2Ta, the primary phase constitution of the as-fabricated and annealed specimens are in agreement with the work of C. Zhou et al. [17]. However, the μ - NiTa phase could not be clearly identified from the acquired XRD diffraction patterns. Thus, the as-fabricated and case 6 specimens were further examined under XRD, SEM and TEM to understand the effect of vacuum heat treatment on the constitution of the primary, secondary and eutectic phases of the L-PBF NiTa alloy.

3.1.2. Stress Evaluation

Due to the rapid heating and cooling of the molten pool during L-PBF, there is an accumulation of thermal residual stress, that heat treatment will relieve to prevent further propagation of microcracks. Figure 6 shows the surface residual stress of as-fabricated and annealed specimens as calculated from the XRD analysis using the two-tilt method. The data for the as-fabricated specimens show a much wider standard deviation than for the annealed specimens, due to the inhomogeneity of the columnar dendrite microstructure in the as-fabricated specimens.
Both the as-fabricated and annealed specimens show compressive stresses on both the transverse and sagittal planes. As the annealing temperature increases, the residual stress gradually decreases. The residual stresses in cases 4, 5 and 6 reduced to near zero after annealing, suggesting that the residual stresses are fully relieved, which creates a stress-free state, and that annealing for 4 h at 1275 is sufficient.

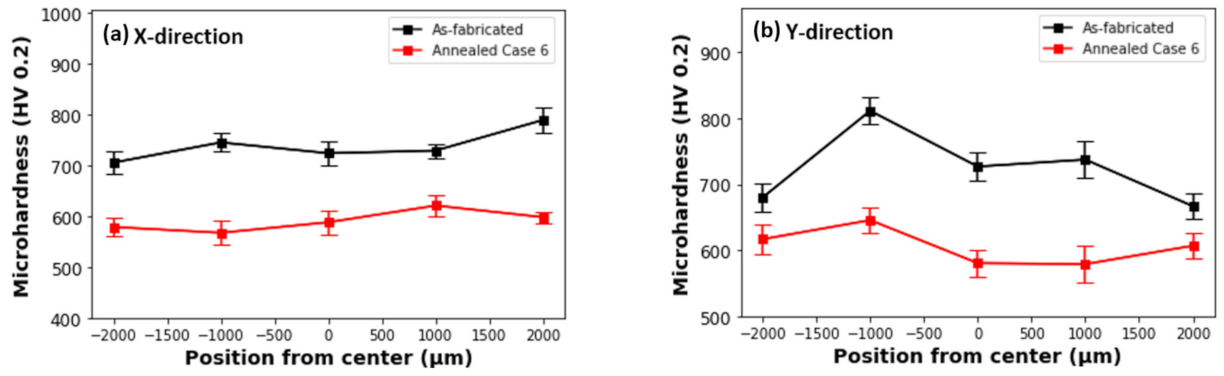
3.2. Comparison of Microhardness

Figure 7 presents the indented region on as-fabricated and annealed specimens. The contraction of the indented area (Areal) indicates the presence of compressive residual stress in the as-fabricated specimens. The observation aligns with the calculated residual stress from the XRD analysis. The annealed specimens have less contraction as the result of the annealing treatment.
As shown in Figure 8, the microhardness in cases 4, 5 and 6 are significantly reduced due to localized grain recrystallization. Compared to the case annealed under a shorter time (cases 2 and 4 for 1150 and 1220 ), an increase in annealing time to 4 h did not lead to a considerable reduction in microhardness of the specimens (for cases 3 and 5). This indicates that a much longer annealing duration is required to induce a further recrystallization process with an annealing temperature between 1150 and 1220 . Once complete recrystallization occurs in case 6, the microhardness of the specimens is further reduced on both the transverse and sagittal planes.
Figure 9 presents the comparison of the change in microhardness in L-PBF specimens of the as-fabricated and annealed specimens (case 6). The comparison shows that the microhardness values of specimens significantly reduced after annealing for 4 h at 1275 . The as-fabricated specimens have an average hardness (on the transverse plane) of 733 ± 41 HV0.2, while the annealed specimens have 594 ± 26 HV0.2. Most noticeably, in Figure 9c), a significant reduction of microhardness in the z-direction was measured. In addition, the microhardness of the as-fabricated specimen increases from 670 ± 15 to 730 ± 22 HV0.2 as the building height increases.

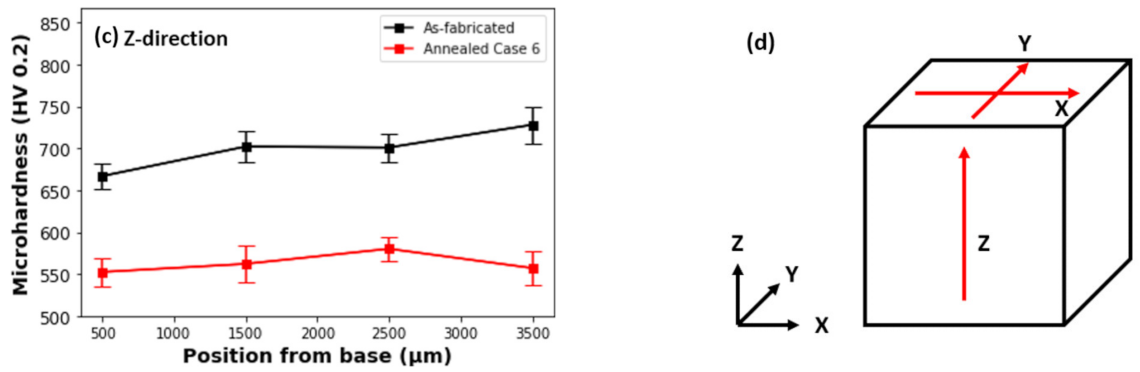
3.3. Microstructure of As-Fabricated NiTa

Figure 10 shows the inhomogeneously distributed coarse columnar dendrites which occur when metal experiences rapid solidification in processes such as L-PBF [25]. Figure 10a,b reveal columnar dendrites growing vertically from the center of the melt pool and across several melt-pool boundaries (highlighted with yellow lines) along the build direction of the specimen as a result of epitaxial growth [25]. Based on the measurement from twenty locations from four micrographs on two as-fabricated specimens, the as-fabricated specimens have columnar dendrites with an average length of 146 ± 30 µm and width of 3.5 ± 0.3 µm.

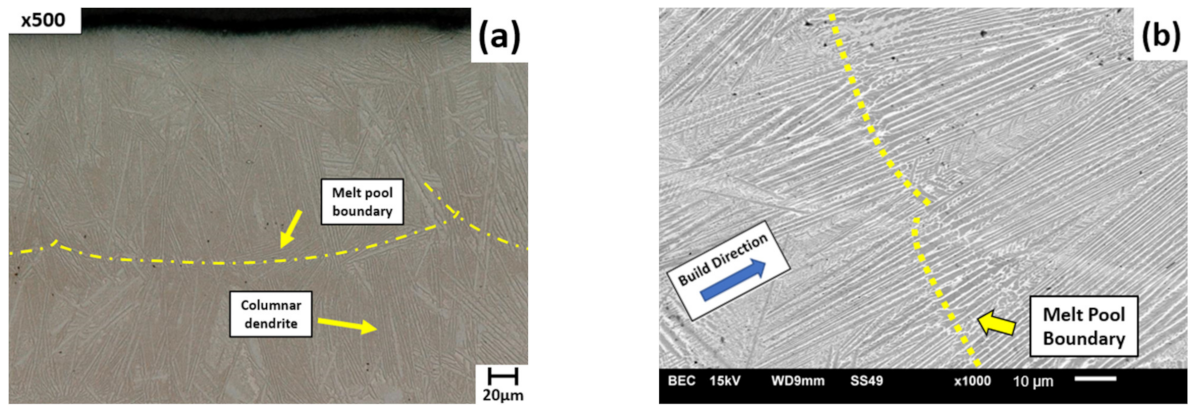
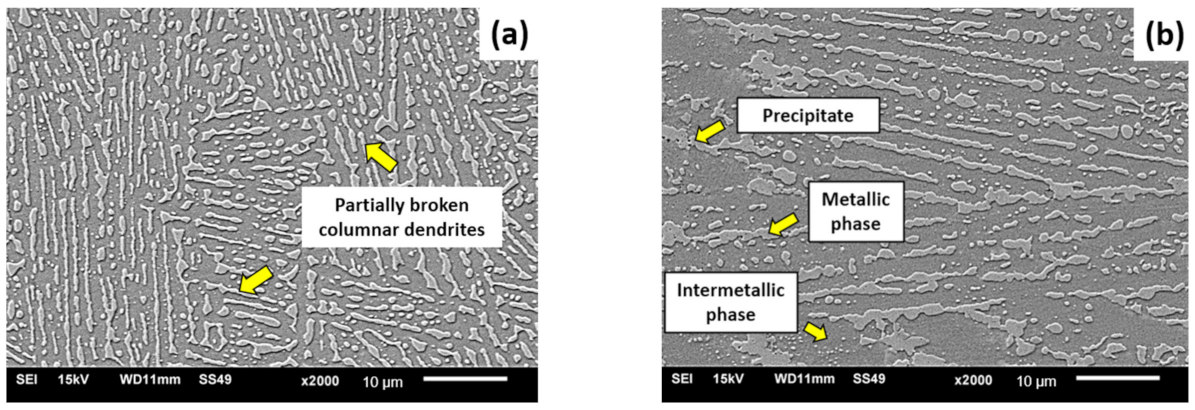
3.4. Effects of Vacuum Heat Treatment

The annealing conditions for cases 1, 2 and 3 did not result in the breakdown of columnar dendrites, as the columnar structure remained prevalent. In what follows, we focus on the specimens annealed at 1220 for 2 h (case 4), 1220 for 4 h (case 5), and at 1275 for 4 h (case 6). The densities of the annealed specimens in all cases remained the same as as-fabricated ones. Figure 11 is of case 4 and shows partially broken structures in the transverse and sagittal planes, obtained with annealing, as per case 4. Unlike cases 1, 2 and 3, the grain boundaries are broken, the columnar dendrites have shortened, smaller phases have formed, and precipitates can be seen in localized regions.
However, as shown in Figure 12, some of the columnar structures remain in specimens obtained with annealing, as per case 5. The result indicates that extending the duration of annealing from 2 to 4 h did not lead to considerable microstructural transformation. Figure 13 shows that case 6 has achieved a fully fine equiaxed Ni2Ta phase (bright area), a significant change from cases 4 and 5. The boundaries of columnar dendrites have been eliminated and the grains have grown larger due to recrystallization.
At higher magnification, Figure 14 shows dark spots that are angular in shape, and frequently located at interfaces between the primary and secondary phases. The dark spots range in size from 93 to 548 nm. The angular shapes rule out the possibility of gas-induced porosity, which would be spherical, thus confirming the formation of the precipitate.
From the residual stress, microhardness and microstructural analyses, we conclude that only the case 6 heat-treating condition is sufficient to promote complete recrystallization of the as-fabricated L-PBF NiTa specimens. Among all cases, only case 6 presents a uniform fine equiaxed grain microstructure, with the lowest residual stress, which is desirable for the sputtering-target disk application. Thus, in the remainder of the paper, we focus on comparing the crystallographic, and phase-composition analyses of as-fabricated and case 6 NiTa specimens.

3.5. Crystallographic Texture

To evaluate the influence of annealing on the orientation and texture of the grains, as-fabricated and case 6 specimens were examined under EBSD. In Figure 15a, the inverse-pole-figure map shows that the as-fabricated specimen has a microstructure dominated by elongated dendrites with preferred crystal orientation toward the <110> build direction. In contrast, case 6 exhibits a randomly oriented crystal structure after annealing. The measured average equivalent circle diameter of the equiaxed grains in the annealed specimens (case 6) is about 2.1 ± 0.2 µm. By comparison, the elongated columnar grains in the as-fabricated specimens are 146 ± 30 µm in length and 3.5 ± 0.3 µm in width.

3.6. Phase Composition and Crystallographic Analysis

According to the study conducted by C. Zhou et al. [17], the NiTa alloy used in this study is a two-phase metal alloy consisting of Ni 2 Ta as primary phase and Ni 2 Ta + μ - NiTa as eutectic phase. After annealing, the microstructure of an as-cast NiTa alloy reportedly transforms into two phases: N i 2 T a and μ - NiTa .
The NiTa powder and as-fabricated L-PBF NiTa were investigated under SEM-EDX and TEM-EDX to examine whether phase transformation occurs during L-PBF. As shown in Figure 16a, the NiTa powder has a dendritic structure. The dark region is identified as N i 2 T a and the bright region is NiTa. TEM-EDX was used only to identify the composition of fine dendritic structure in the as-fabricated L-PBF NiTa. As shown in Figure 16b, the dendritic structure in the as-fabricated L-PBF NiTa consists of N i 2 T a (dark region) and NiTa (bright region). The result indicates that no phase transformation occurred during L-PBF of NiTa, which agrees with the finding from the XRD analysis.

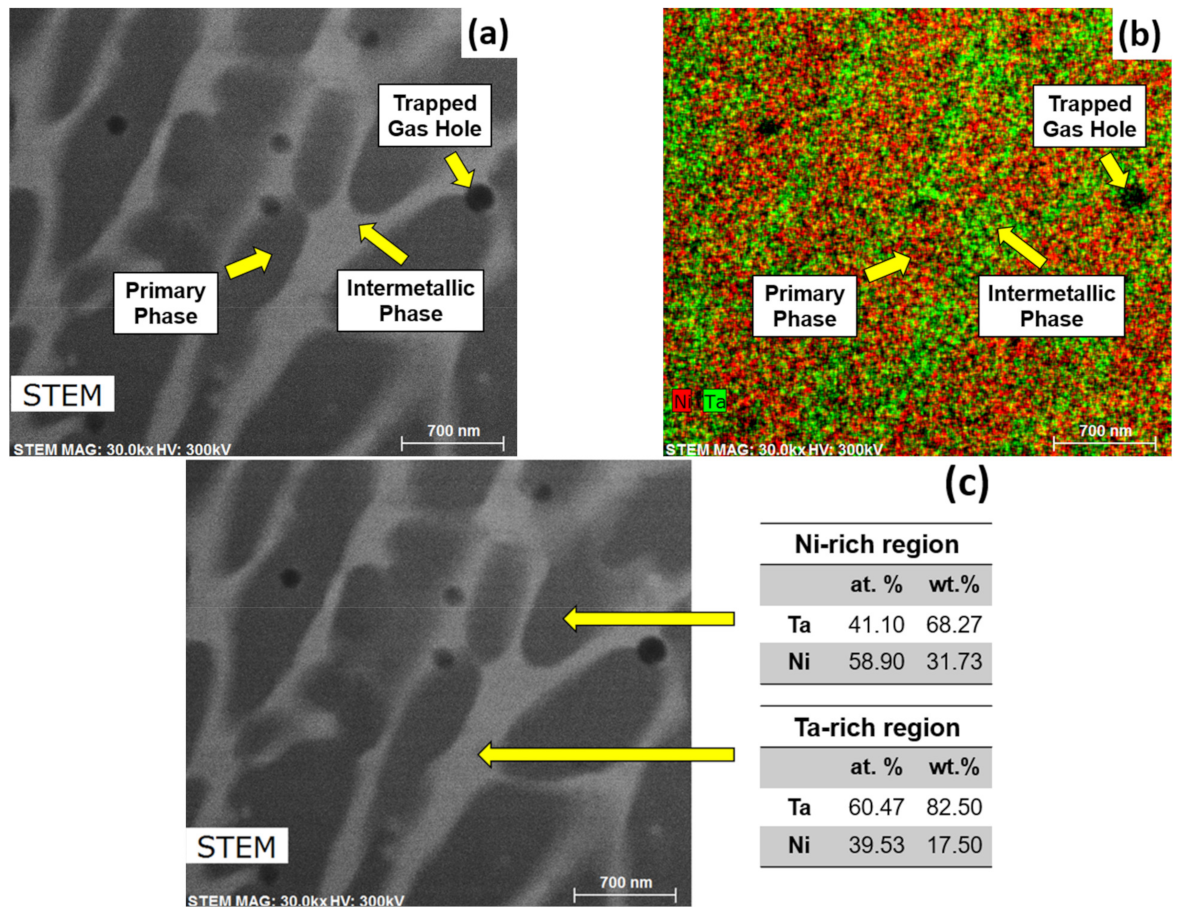
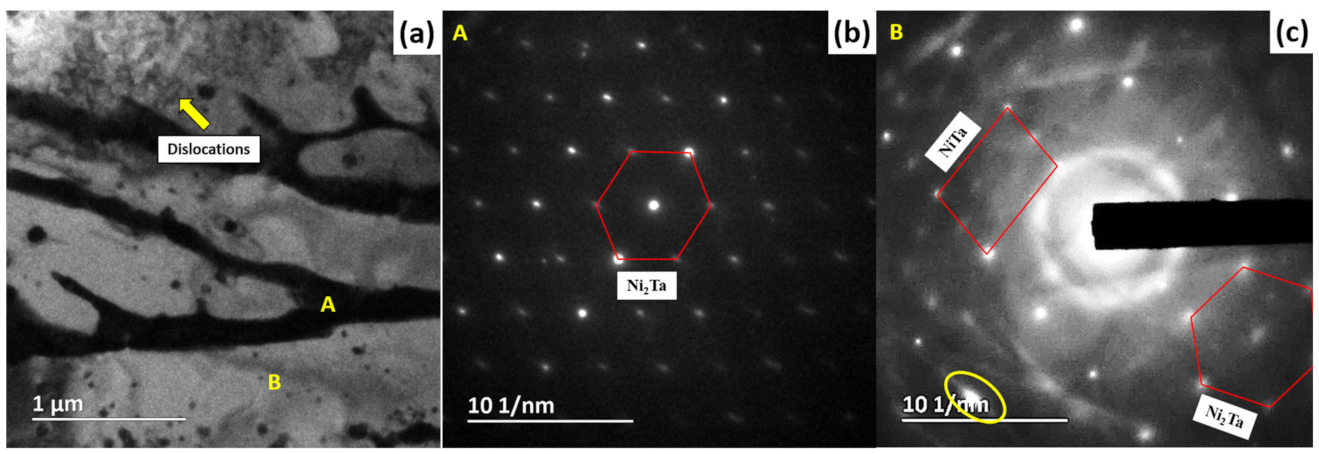
3.6.1. As-Fabricated Specimen

TEM-EDX analysis was carried out to analyze the phase composition of the fine dendritic structure of an as-fabricated specimen. Using EDX mapping, two distinct elements were identified on the sectioned surface: Ni (red) and Ta (green). As shown in Figure 17b, the qualitative elemental analysis reveals that the primary phase has a higher concentration of Ni. On the other hand, the Ta-rich region in green is the eutectic intermetallic phase.
Figure 17c shows the point EDX chemical composition analysis of the primary and intermetallic phases (the dark and bright regions), respectively. The primary phase, at the point of measurement, has 41.10 at.% Ta and 58.90 at.% Ni. An atomic ratio of 2 Ni to 1 Ta in the primary phase indicates a possible phase constitution of Ni 2 Ta . On the other hand, the secondary phase has a relatively higher concentration of Ta. However, the measured atomic concentration in the secondary intermetallic does not provide sufficient evidence to identify the exact phase constitution of a possible eutectic phase. Thus, a SAED crystallographic analysis was conducted on the as-fabricated specimen to identify the crystal structures and phase constitutions.
Figure 18a shows a high concentration of dislocations in the intermetallic phase of an as-fabricated specimen. As indicated in Figure 18c, the dislocations in the as-fabricated specimen have affected the diffraction of electrons, resulting in the streaks (highlighted in yellow) on the SAED spots pattern. Figure 18b,c show SAED patterns of the marked regions in the as-fabricated specimen. Figure 18b shows that the primary phase “A” has a tetragonal crystal structure with 0.29–0.32 nm d-spacing and I4mmm space group, which are similar to the space group and lattice structure of Ni2Ta reported by Y. Zhou et al. [16]. The clear spots appearing in Figure 18b indicate that the Ni2Ta has high crystallinity. These results confirm that the eutectic phase in the as-fabricated specimens consists of Ni 2 Ta   +   μ - NiTa because Figure 18c indicates the presence of both tetragonal Ni2Ta and rhombohedral NiTa in phase “B”.

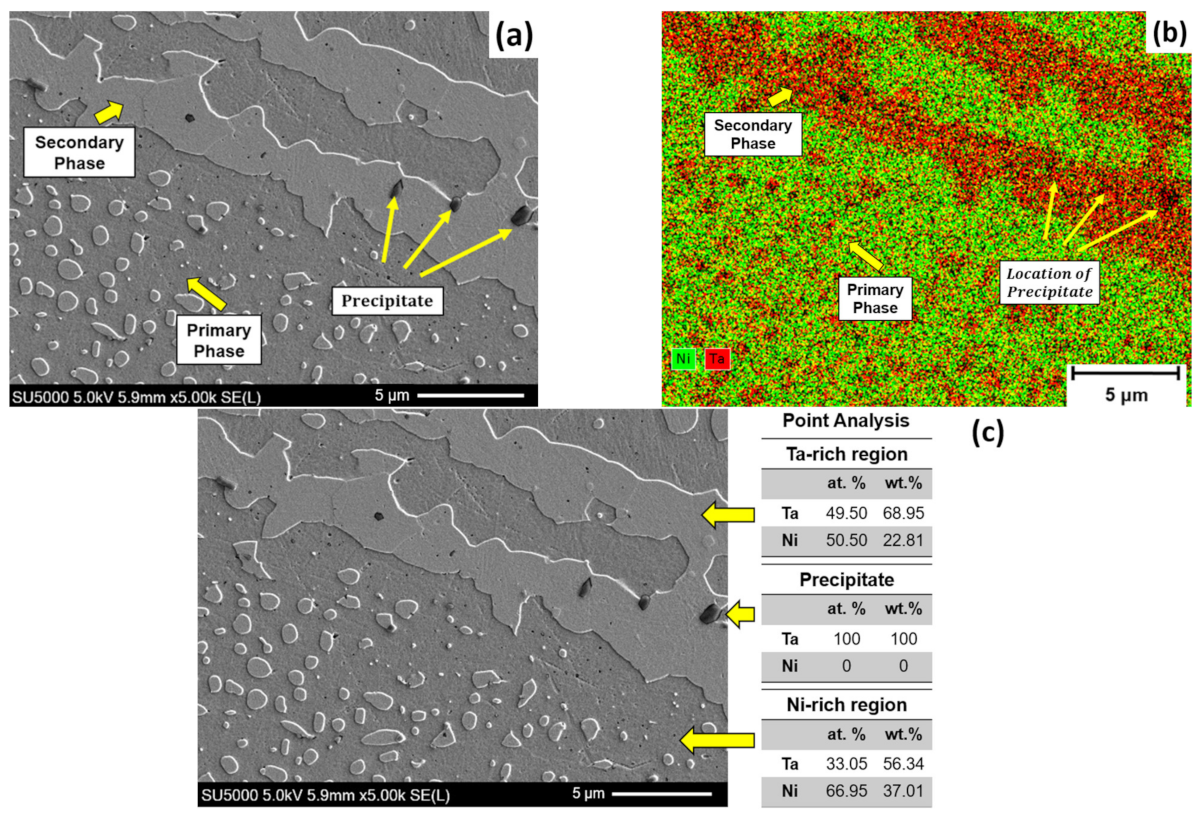
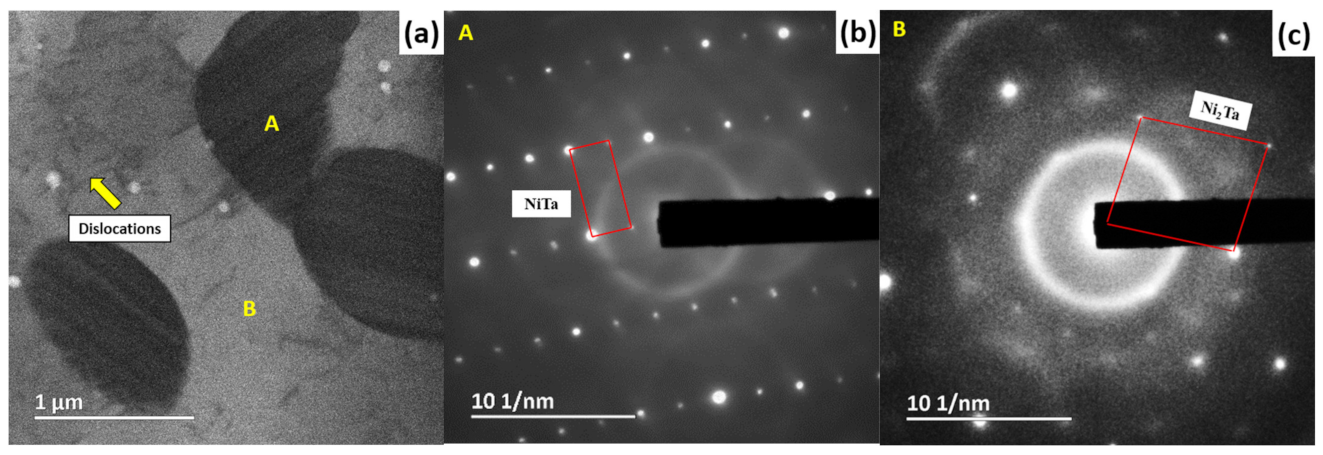
3.6.2. Annealed Specimen (Case 6)

Figure 19 presents the SEM and SEM-EDX micrographs of a case 6 specimen. In Figure 19a, the newly formed phases are marked as primary and secondary. The point chemical analysis identifies a 2:1 atomic ratio of Ni and Ta in the primary phase, and thus Ni 2 Ta . The SEM-EDX analysis of case 6 shows a shift in the phase composition. In Figure 19b, the EDX map shows that precipitates are located near high concentrations of Ta, suggesting that the precipitates form due to the rejection of Ta from a saturated Ta-rich solution. However, further SAED crystallographic analysis will be required to validate the phase composition of the precipitate. The change in the phase composition is due to microstructure homogenization during high-temperature annealing, which causes the gradual disappearance of the eutectic phase [26]. Subsequently, the saturated solution recrystallizes into two distinct crystal structures, Ni 2 Ta and NiTa .
SAED analysis was performed to validate the crystal structure and phase composition of case 6 and precipitate. Figure 20b,c show SAED patterns of marked regions in the as-fabricated specimen. Figure 20b shows that phase “A” has a rhombohedral NiTa crystal structure; Figure 20c shows that the secondary phase “B” has a tetragonal Ni2Ta crystal structure. The recrystallization of the grain structure during annealing results in the elimination of dislocations. This phenomenon correlates to a significant reduction in the concentration of dislocations in Figure 20a and a reduction in the streaks in the secondary phase of case 6 in Figure 20c. The clear distinction of the crystal structure in the primary and secondary phases confirms that the eutectic phase has homogenized and transformed into Ni 2 Ta and NiTa during annealing.
Figure 21a shows a Ta precipitate embedded in the Ta-rich secondary phase. The SAED pattern shows the Ta precipitate to have a fcc crystal structure, 0.43 nm in the [ 1 ¯ 11 ] direction. This is interesting, as the most common form of Ta, known as the α phase, has a bbc crystal structure, as reported by Janish et al. [27], although the formation of fcc Ta structure in Ta thin films has also been reported by Denbigh et al. [28]. Shen et al. [29] pointed out that the small particles may exhibit lower potential energy and can become thermodynamically stable fcc crystal structures before melting.

4. Discussion

4.1. Residual Stress and Microhardness

The residual stress and microhardness analyses show higher residual stress and microhardness in the as-fabricated specimens than in the annealed specimens, which can be attributed to the presence of high dislocation density and the fine subgrain cellular structure, which creates a significant lattice-orientation mismatch between grains at grain boundaries, and pins the movement of dislocations at the boundaries. Large activation energy is needed to overcome the pinning force at the grain boundaries, which results in the strengthening of the overall structure [30]. The Ta precipitates also act to ‘lock’ grains within the microstructure, which inhibits their movement. During annealing, the formation of strengthening precipitates and the recovery and recrystallization processes usually occur simultaneously. The former enhances the strength and hardness but reduces the ductility, while the latter improves the ductility [31]. The recovery and recrystallization of fine subgrain cellular structure into equiaxed grains also causes rearrangement of grain boundaries, which in turn eliminates the pinning of dislocations at grain boundaries, which reduces the microhardness. As shown in Figure 6 and Figure 8, the effect of microstructural recrystallization overcomes the precipitation strength-hardening effect, leading to the decreases in residual stress and microhardness in cases 4, 5 and 6. The variation of the microhardness at various locations across the as-fabricated specimens is the result of microstructure inhomogeneity. By contrast, the microstructural homogenized case 6 has a more consistent microhardness in all directions.
Figure 9 presents the anisotropy of the microhardness in the x and y-directions, as well as between the transverse and sagittal planes of as-fabricated specimens. The anisotropy of the microhardness in the as-fabricated L-PBF NiTa specimens correlates to the directional anisotropy of mechanical properties in L-PBF parts reported by researchers [32,33,34,35]. The variation in microhardness value along the x and y-direction of as-fabricated specimens is the result of the orientation of grain structure caused by the zig-zag scanning strategy [32,33]. The anisotropy of microhardness between the sagittal and transverse planes of the as-fabricated specimen is owing to the anisotropy of columnar grains [34,35]. The change in the microhardness along the building height of the as-fabricated specimen can be explained by the continuing effect of the thermal cycles on the underlying printed layers during L-PBF. The repeated heating causes a short period of annealing effect to the existing layer, which leads to a stress-relieving and grain-coarsening effect that lowers microhardness values [36].

4.2. Microstructural Evolution

The columnar dendrites in the as-fabricated specimen, Figure 10, are due to the significant thermal gradient between the substrate and HAZ caused by rapid heat conduction from the melt pool to the baseplate [25]. A large thermal gradient in the HAZ also causes a CTE mismatch between the HAZ and the surrounding region, and introduces large tensile stress that results in the formation of solidification cracks near the melt-pool boundary [37]. Figure 15a shows that the as-fabricated specimen has a microstructure dominated by elongated dendrites with preferred crystal orientation in the <110> along the build direction. The preferentially oriented microstructure can be explained by the rapid cooling (103–105 °C/s) of the melt pool, where the heat of the melt pool is conducted towards the baseplate [38]. Meanwhile, the rapid solidification of the melt pool during L-PBF results in non-equilibrium solidification in the interdendritic zone [39]. The inhomogeneously distributed coarse columnar dendrites observed on the as-fabricated specimens are not acceptable for a sputtering-target application. Thus, annealing was conducted to recrystallize the columnar dendrite grains and to homogenize the microstructure.
After annealing, the microstructure (case 6) changes significantly, due to the high dislocation density at boundaries of columnar dendrites (and hence high stored energy) inside the L-PBF part, as a result of the high thermal gradients during rapid solidification [40]. At an annealing temperature of 1275 °C, which reaches the recovery and static recrystallization temperature of the NiTa, the high stored energy in the L-PBF specimen acts as the driving force to promote the recrystallization of columnar dendrites [40,41]. Meanwhile, the migration of columnar dendrite grain boundaries and the diffusion of elements across boundaries accelerate the elimination of dendritic and cellular structures [42]. Hence, the microstructure transforms greatly under annealing.
As shown in Figure 15b, case 6 exhibits a randomly oriented crystal structure after annealing. The change in crystallographic orientation of grains is the result of grain-boundary migration during recovery and recrystallization. Petryshynets et al. [43] described the crystal orientation of newly formed equiaxed grains as significantly influenced by the movement of dislocations until the structure becomes thermodynamically stable. The randomly oriented crystal structure is caused by the absence of an external force during vacuum heat treatment, such as a mechanical or magnetic force [44].
Figure 17a of an as-fabricated specimen, and Figure 14 of an annealed specimen, both show nanoscale spherical pores, suggesting the introduction of gas into the NiTa either during the production of the powder feedstock or during L-PBF, the gas that was then unable to escape before solidification [45]. Then, the annealing process allows the gas elements to nucleate, grow, and coalesce [46], especially because during high-temperature annealing the mobility of dissolved gas elements increases due to the addition of kinetic energy, and thus the high density of dislocations in the L-PBF NiTa provides easier diffusion paths for gas elements to coalesce. The size of the pores suggests that these are dissolved nitrogen molecules, and as L-PBF takes place in an argon-purged environment, we conclude that the nitrogen was introduced during atmospheric gas atomization.
Figure 14 and Figure 19a show that prolonged annealing at elevated temperature causes the rejection of an element from a saturated solution, leading to the formation of precipitates [47]. Supersaturation of the solution is the result of the rapid cooling during the L-PBF process. Due to the high energy level of an intermetallic compound, precipitates tend to preferentially form at phase interfaces to pin grain boundaries and to achieve thermal stability through kinetic stabilization [31]. Compared between cases 4, 5 and 6, the increased population of precipitate in case 6 is due to the higher annealing temperature, which allows more grains to be recrystallized but also provides more opportunities for excess elements to be rejected from the solution forming precipitates. The observation correlates to the work conducted by Prashanth et al. on annealed L-PBF Al-12Si alloy. They report that Si is rejected from supersaturated Al to form small Si precipitates that are pinned at the cellular boundaries [48].
Figure 21 shows the finding of fcc Ta precipitate, which is the product of the annealing of fine-grain structures in the L-PBF NiTa. During annealing, the fine-grain structure in the as-fabricated specimen constrains the formation of the precipitates, which limits the size of Ta precipitates to the nanometer scale. The size of the precipitates helps the fcc Ta phase to remain thermodynamically stable throughout annealing. Finally, from the microstructural and metallurgical analyses, we see that the Ta precipitates are uniformly distributed and so are likely to be homogenized in vaporized ion fume during PVD, and thus are unlikely to hinder PVD performance.

5. Comparison of Specimens Produced by L-PBF with VHT, and HP with HIP

Specimens produced by HP with HIP (HP + HIP) were provided by Solar Applied Materials Corp. Figure 22 presents SEM micrographs of specimens produced by L-PBF with VHT (L-PBF + VHT), case 6, and specimens produced by HP + HIP. The HP + HIP treated specimens were pressed under HP at 1050 °C for four hours and HIP treated under 150 MPa at 1275 °C for six hours. The L-PBF + VHT treated specimens have a much finer equiaxed secondary phase.
The measured cross-sectional average grain size of the L-PBF + VHT treated specimen is about 2.1 ± 0.2 µm with a relative density of 99.5%; the HP + HIP treated specimen is about 6 ± 0.6 µm with a relative density of 98%. Compared to HP, L-PBF has a much more rapid cooling rate, which results in the formation of a denser part with finer microstructure, and annealing refines or recrystallizes the fine dendrites into much smaller equiaxed grains. Note also that the HIP process causes significant deformation of the hot-pressed sputtering target, which results in an average of 10% material loss during post-processing. On the other hand, VHT would not deform the L-PBF sputtering target, allowing the component to be made near-net-shape and reducing material loss.
Zuback et al. [49] demonstrated a positive correlation between hardness and yield strength of AM alloys fabricated through L-PBF and direct energy-deposition methods. The L-PBF process tends to produce parts with fine grains due to the high solidification rate. Farshidianfar et al. [50] reported a correlation of cooling rate to grain size and microhardness, and an inverse relationship between microhardness and average grain diameter, resulting in the Hall-Petch effect.
The Hall-Petch relation was initially developed for equiaxed grains and demonstrates good agreement in materials with grain size less than hundreds of microns. The HP + HIP-treated specimen has an average microhardness of 556 ± 14 HV0.2, while the L-PBF + VHT-treated specimen has a higher microhardness of 594 ± 26 HV0.2. We also observe that specimens with finer grains have higher microhardness.
As stated by Dunlop et al. [51] and Sarkar et al. [52], the performance of the sputtering target during the PVD process is in correlation with the averaged grain size of the sputtering target. Their works showed that the surface uniformity of the deposited thin film has an inverse correlation with the average grain size of the sputtering target. When operating under the same PVD condition, a smaller averaged grain size in the sputtering target is shown to improve the uniformity of the thin film compared to the one with coarser grain. Since the hard-disk drive consists of multiple layers of thin films, changes in the surface uniformity of any thin film layer can influence the uniformity of the final layer (lubricant layer). The uniformity of the final layer has a significant influence on the recording density and the performance of the hard disk drive [53].
Thus, based on the facts discussed above, we deduce that the L-PBF + VHT specimen has a much higher yield strength and could produce better quality thin film than the ones produced by HP + HIP.

6. Conclusions

NiTa alloy specimens were fabricated with L-PBF and annealed with VHT. The microstructure evolution and residual stress obtained from different annealing conditions were investigated by optical microscopy, scanning electron microscopy, and X-ray diffraction.
The following are the conclusions of this study:
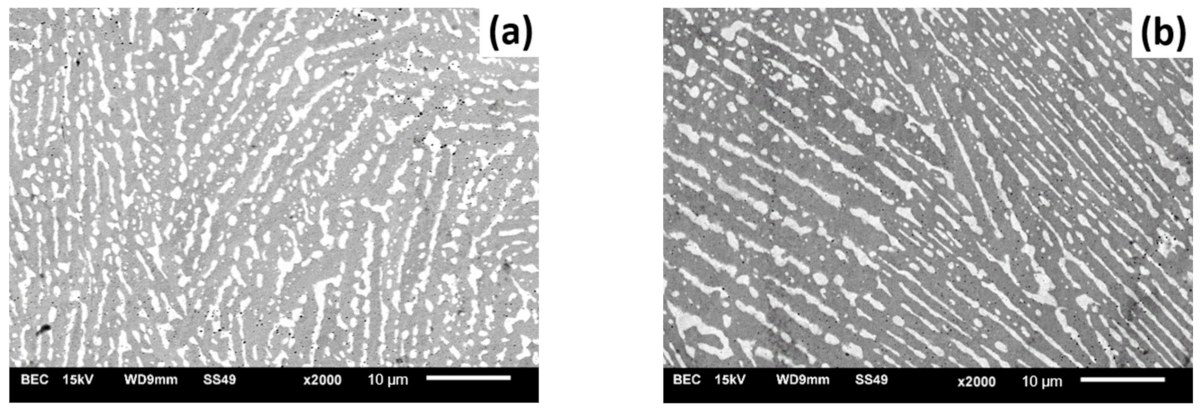
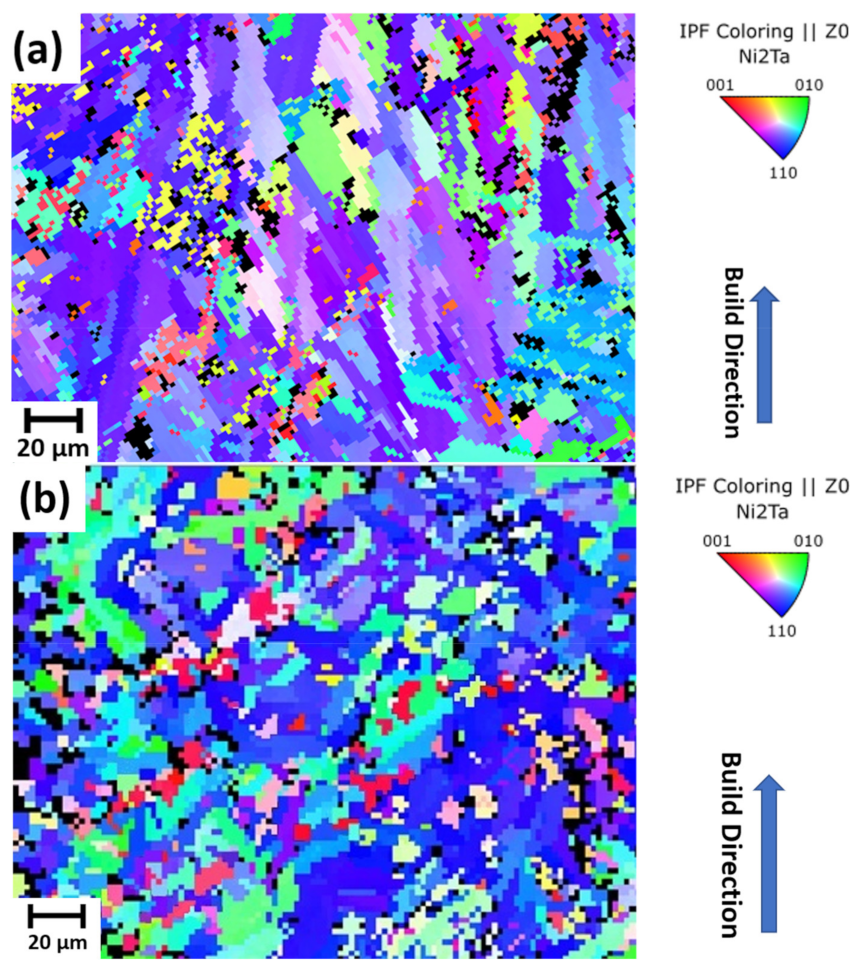
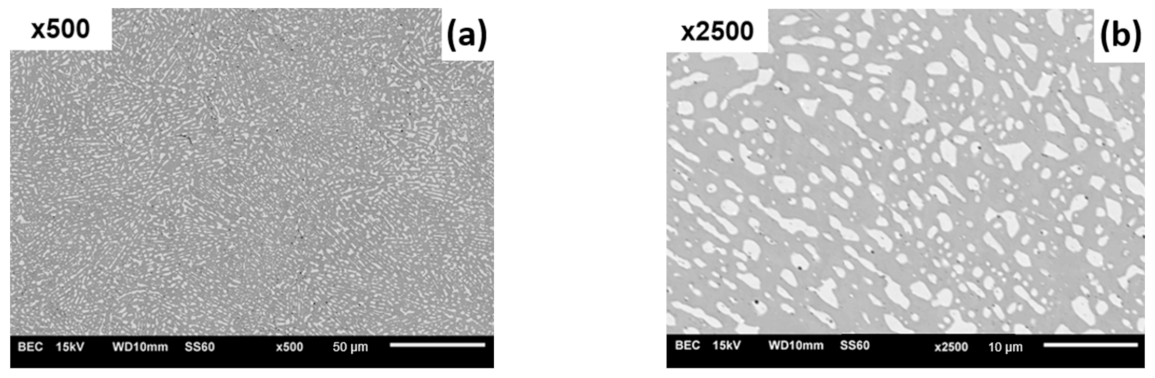
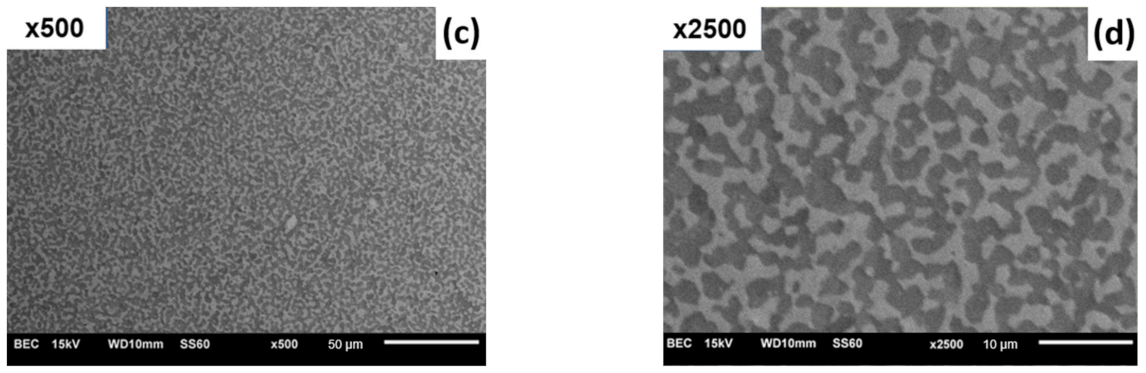
  • L-PBF NiTa specimens annealed below 1220 °C retained the columnar dendritic grains (length 146 ± 30 µm, width 3.5 ± 0.3 µm) of the as-fabricated L-PBF parts. At 1220 °C, partial grain refinement was initiated, where the columnar dendrite boundaries were partially broken in some regions. When annealed at 1275 °C, the columnar dendritic structure transformed into an equiaxed grain structure with an average size of 2.1 ± 0.2 µm. The rapid transformation of the grain structure at 1275 °C is the result of a recrystallization process driven by the high stored energy in the specimens, which accelerates grain-boundary migration and the diffusion of elements.
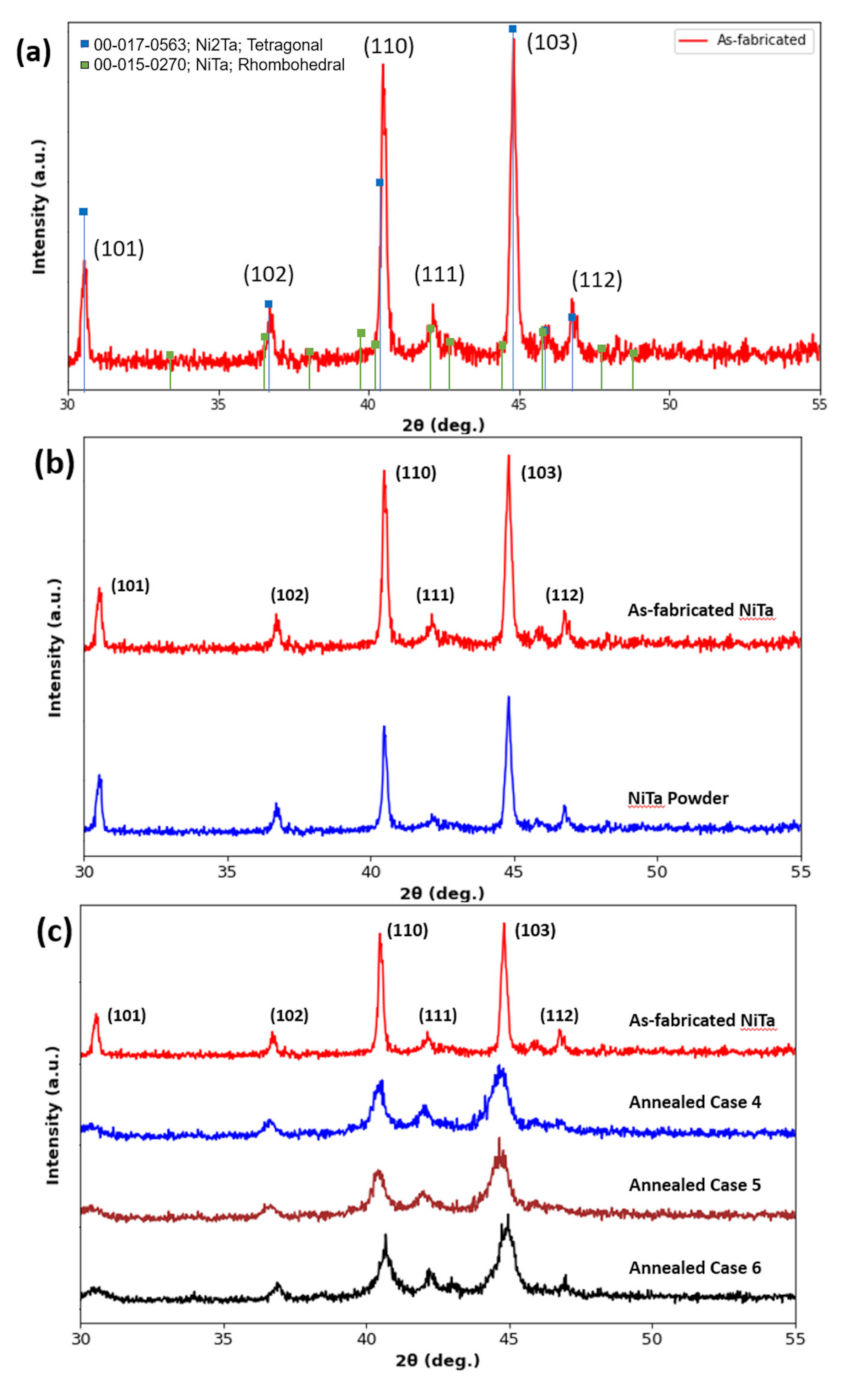
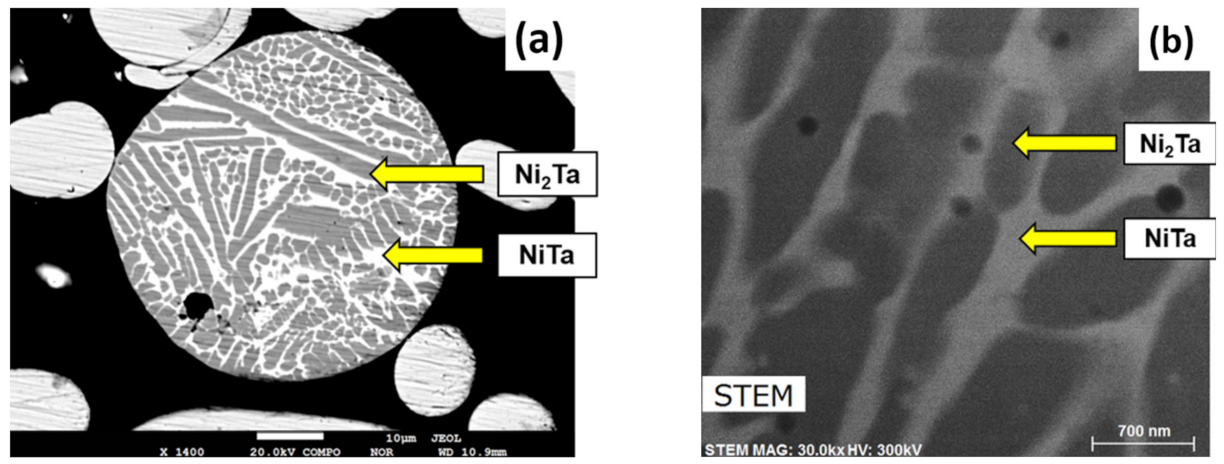
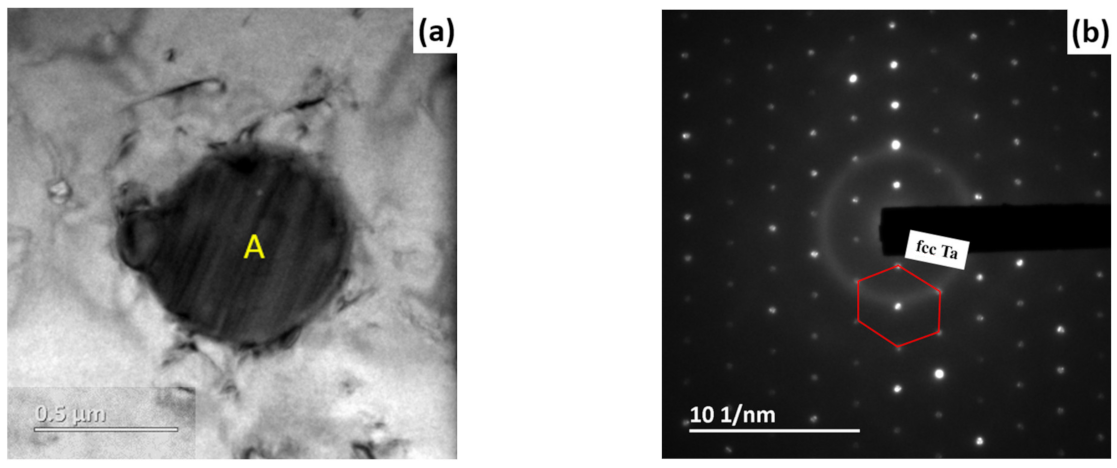
  • After annealing, the eutectic phase transformed into two phases: tetragonal Ni2Ta as a primary phase, and rhombohedral μ-NiTa as a secondary phase, with fcc Ta nanoscale precipitates that help stabilize the crystal structure.
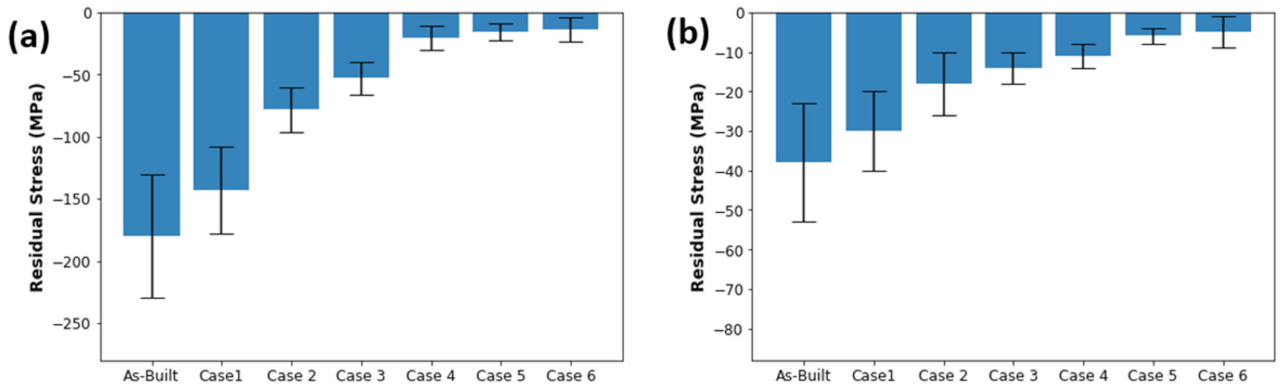
  • After heat treatment, the maximum compressive residual stress in NiTa specimens dropped from 180 ± 50 MPa to 20 ± 10 MPa as a result of dislocation elimination due to recrystallization.
  • The L-PBF + VHT-treated specimens demonstrate a finer equiaxed secondary phase than HP + HIP-treated specimens, and as a result a higher microhardness than HP + HIP-treated specimens.
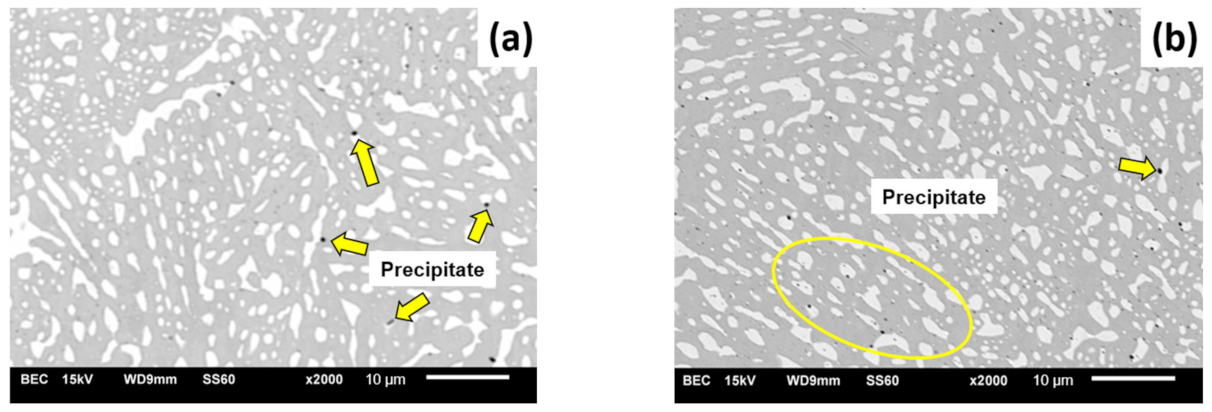
  • During VHT at 1220 °C, fcc Ta precipitates were distributed where columnar dendrite boundaries were broken. When annealed at 1275 °C, fcc Ta precipitates were dispersed more uniformly in the microstructure. Based on all the findings in this paper, this study recommends annealing at 1275 °C but for no more than 4 h, to minimize the formation of Ta precipitates.

Author Contributions

Conceptualization, C.-T.W.; investigation, C.-T.W.; writing—original draft preparation, C.-T.W.; writing—review and editing, M.B. and K.C.; funding acquisition, K.C. All authors have read and agreed to the published version of the manuscript.

Funding

This work was supported by Natural Sciences and Engineering Research Council of Canada (NSERC) Discovery grant [498465]; University of Toronto Dean’s Catalyst Professorship.

Institutional Review Board Statement

Not applicable.

Informed Consent Statement

Not applicable.

Data Availability Statement

The data presented in this study are available on request from the corresponding author.

Acknowledgments

The NiTa alloy powder used in this study was provided by M.W. from Taiwan Steel Group Aerospace Additive Manufacturing Corporation and C.Y.M. from Solar Applied Materials Corporation. The authors also acknowledge the Natural Sciences and Engineering Research Council of Canada (NSERC) Discovery grant and the University of Toronto Dean’s Catalyst Professorship provided by the University of Toronto to Kinnor Chattopadhyay, for funding this study.

Conflicts of Interest

The authors declare no conflict of interest.

References

  1. Yuan, H.; Ajan, A.; Chernyshov, A.S.; Acharya, B.R. Underlayers for Heat Assisted Magnetic Recording (HAMR) Media. U.S. Patent 2013/0314815 A1, 28 November 2013. [Google Scholar]
  2. Liverani, E.; Lutey, A.H.A.; Ascari, A.; Fortunato, A. The effects of hot isostatic pressing (HIP) and solubilization heat treatment on the density, mechanical properties, and microstructure of austenitic stainless steel parts produced by selective laser melting (SLM). Int. J. Adv. Manuf. Technol. 2020, 107, 109–122. [Google Scholar] [CrossRef]
  3. Qiu, C.; Yang, D.; Wang, G.; Liu, Q. Microstructural development and tensile behavior of a hot isostatically pressed nickel-based superalloy. Mater. Sci. Eng. A 2020, 769, 138461. [Google Scholar] [CrossRef]
  4. Srinivas, M.; Babu, B.S. A Critical Review on Recent Research Methodologies in Additive Manufacturing. Mater. Today Proc. 2017, 4, 9049–9059. [Google Scholar] [CrossRef]
  5. Yap, C.Y.; Chua, C.K.; Dong, Z.L.; Liu, Z.H.; Zhang, D.Q.; Loh, L.E.; Sing, S.L. Review of selective laser melting: Materials and applications. Appl. Phys. Rev. 2015, 2, 041101. [Google Scholar] [CrossRef]
  6. Kurzynowski, T.; Chlebus, E.; Kuźnicka, B.; Reiner, J. Parameters in selective laser melting for processing metallic powders. Proc. SPIE 2012, 8239, 317–322. [Google Scholar] [CrossRef]
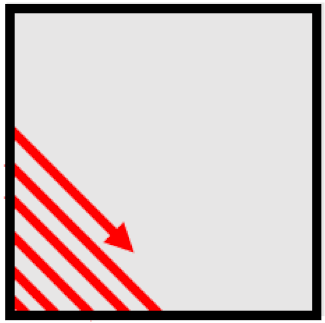
  7. Rashid, R.A.R.; Masood, S.; Ruan, D.; Palanisamy, S.; Brandt, M. Effect of scan strategy on density and metallurgical properties of 17-4PH parts printed by Selective Laser Melting (SLM). J. Mater. Process. Technol. 2017, 249, 502–511. [Google Scholar] [CrossRef]
  8. Tillmann, W.; Schaak, C.; Nellesen, J.; Schaper, M.; Aydinöz, M.; Hoyer, K.-P. Hot isostatic pressing of IN718 components manufactured by selective laser melting. Addit. Manuf. 2017, 13, 93–102. [Google Scholar] [CrossRef]
  9. Deng, D.; Peng, R.L.; Söderberg, H.; Moverare, J. On the formation of microstructural gradients in a nickel-base superalloy during electron beam melting. Mater. Des. 2018, 160, 251–261. [Google Scholar] [CrossRef]
  10. Mostafa, A.; Picazo Rubio, I.; Brailovski, V.; Jahazi, M.; Medraj, M. Structure, Texture and Phases in 3D Printed IN718 Alloy Subjected to Homogenization and HIP Treatments. Metals 2017, 7, 196. [Google Scholar] [CrossRef] [Green Version]
  11. Mazur, M.; Leary, M.; Sun, S.; Vcelka, M.; Shidid, D.; Brandt, M. Deformation and failure behaviour of Ti-6Al-4V lattice structures manufactured by selective laser melting (SLM). Int. J. Adv. Manuf. Technol. 2016, 84, 1391–1411. [Google Scholar] [CrossRef]
  12. Xu, W.; Brandt, M.; Sun, S.; Elambasseril, J.; Liu, Q.; Latham, K.; Xia, K.; Qian, M. Additive manufacturing of strong and ductile Ti–6Al–4V by selective laser melting via in situ martensite decomposition. Acta Mater. 2015, 85, 74–84. [Google Scholar] [CrossRef]
  13. Liu, M.; Takata, N.; Suzuki, A.; Kobashi, M. Microstructural characterization of cellular AlSi10Mg alloy fabricated by selective laser melting. Mater. Des. 2018, 157, 478–491. [Google Scholar] [CrossRef]
  14. Galy, C.; Le Guen, E.; Lacoste, E.; Arvieu, C. Main defects observed in aluminum alloy parts produced by SLM: From causes to consequences. Addit. Manuf. 2018, 22, 165–175. [Google Scholar] [CrossRef]
  15. Fieres, J.; Schumann, P.; Reinhart, C. Predicting failure in additively manufactured parts using X-ray computed tomography and simulation. Procedia Eng. 2018, 213, 69–78. [Google Scholar] [CrossRef]
  16. Zhou, Y.; Wen, B.; Ma, Y.; Melnik, R.; Liu, X. First-principles studies of Ni–Ta intermetallic compounds. J. Solid State Chem. 2012, 187, 211–218. [Google Scholar] [CrossRef]
  17. Zhou, C.; Guo, C.; Li, C.; Du, Z. Thermodynamic optimization of the Ni–Ta system supported by the key experiments. Thermochim. Acta 2018, 666, 135–147. [Google Scholar] [CrossRef]
  18. Yang, B.; Guo, C.; Li, C.; Du, Z. Experimental Investigation and Thermodynamic Modelling of the Fe-Ni-Ta System. J. Phase Equilibria Diffus. 2020, 41, 500–521. [Google Scholar] [CrossRef]
  19. Cui, Y.; Jin, Z. Experimental study and reassessment of the Ni-Ta binary system. Z. Met. 1999, 90, 233–241. [Google Scholar]
  20. Wang, Y.; Wang, Q.; Zhao, J.; Dong, C. Ni–Ta binary bulk metallic glasses. Scr. Mater. 2010, 63, 178–180. [Google Scholar] [CrossRef]
  21. Yan, Z.; Liu, W.; Tang, Z.; Liu, X.; Zhang, N.; Li, M.; Zhang, H. Review on thermal analysis in laser-based additive manufacturing. Opt. Laser Technol. 2018, 106, 427–441. [Google Scholar] [CrossRef]
  22. Okamoto, H. Ni-Ta (nickel-tantalum). J. Phase Equilibria Diffus. 1996, 17, 371. [Google Scholar] [CrossRef]
  23. Chen, Y.; Sun, H.; Li, Z.; Wu, Y.; Xiao, Y.; Chen, Z.; Zhong, S.; Wang, H. Strategy of Residual Stress Determination on Selective Laser Melted Al Alloy Using XRD. Materials 2020, 13, 451. [Google Scholar] [CrossRef] [PubMed] [Green Version]
  24. Maamoun, A.H.; Elbestawi, M.; Dosbaeva, G.K.; Veldhuis, S.C. Thermal post-processing of AlSi10Mg parts produced by Selective Laser Melting using recycled powder. Addit. Manuf. 2018, 21, 234–247. [Google Scholar] [CrossRef]
  25. Saboori, A.; Gallo, D.; Biamino, S.; Fino, P.; Lombardi, M. An Overview of Additive Manufacturing of Titanium Components by Directed Energy Deposition: Microstructure and Mechanical Properties. Appl. Sci. 2017, 7, 883. [Google Scholar] [CrossRef] [Green Version]
  26. Vončina, M.; Kresnik, K.; Volšak, D.; Medved, J. Effects of Homogenization Conditions on the Microstructure Evolution of Aluminium Alloy EN AW 8006. Metals 2020, 10, 419. [Google Scholar] [CrossRef] [Green Version]
  27. Janish, M.T.; Kotula, P.; Boyce, B.; Carter, C.B. Observations of fcc and hcp tantalum. J. Mater. Sci. 2015, 50, 3706–3715. [Google Scholar] [CrossRef]
  28. Denbigh, P.N.; Marcus, R.B. Structure of Very Thin Tantalum and Molybdenum Films. J. Appl. Phys. 1966, 37, 4325–4330. [Google Scholar] [CrossRef]
  29. Shen, T.; Meng, W.; Wu, Y.; Lu, X. Size dependence and phase transition during melting of fcc-Fe nanoparticles: A molecular dynamics simulation. Appl. Surf. Sci. 2013, 277, 7–14. [Google Scholar] [CrossRef]
  30. Divya, V.D.; Muñoz-Moreno, R.; Messé, O.M.D.M.; Barnard, J.S.; Baker, S.; Illston, T.; Stone, H.J. Microstructure of selective laser melted CM247LC nickel-based superalloy and its evolution through heat treatment. Mater. Charact. 2016, 114, 62–74. [Google Scholar] [CrossRef] [Green Version]
  31. Devaraj, A.; Wang, W.; Vemuri, V.R.; Kovarik, L.; Jiang, X.; Bowden, M.; Trelewicz, J.; Mathaudhu, S.; Rohatgi, A. Grain boundary segregation and intermetallic precipitation in coarsening resistant nanocrystalline aluminum alloys. Acta Mater. 2019, 165, 698–708. [Google Scholar] [CrossRef]
  32. Gu, D.; Guo, M.; Zhang, H.; Sun, Y.; Wang, R.; Zhang, L. Effects of laser scanning strategies on selective laser melting of pure tungsten. Int. J. Extreme Manuf. 2020, 2, 025001. [Google Scholar] [CrossRef]
  33. Zheng, Z.; Jin, X.; Bai, Y.; Yang, Y.; Ni, C.; Lu, W.F.; Wang, H. Microstructure and anisotropic mechanical properties of selective laser melted Ti6Al4V alloy under different scanning strategies. Mater. Sci. Eng. A 2021, 831, 142236. [Google Scholar] [CrossRef]
  34. Hitzler, L.; Hirsch, J.; Heine, B.; Merkel, M.; Hall, W.; Öchsner, A. On the Anisotropic Mechanical Properties of Selective Laser-Melted Stainless Steel. Materials 2017, 10, 1136. [Google Scholar] [CrossRef] [PubMed] [Green Version]
  35. Kempen, K.; Thijs, L.; Van Humbeeck, J.; Kruth, J.-P. Mechanical Properties of AlSi10Mg Produced by Selective Laser Melting. Phys. Procedia 2012, 39, 439–446. [Google Scholar] [CrossRef] [Green Version]
  36. Zhang, C.; Zhu, H.; Qi, Y.; Zeng, X. The Effect of Annealing on Microstructure and Mechanical Properties of Selective Laser Melting AlSi10Mg. IOP Conf. Series: Mater. Sci. Eng. 2019, 538, 012023. [Google Scholar] [CrossRef]
  37. Tokita, S.; Kadoi, K.; Kanno, Y.; Inoue, H. Microstructural evolution and solidification cracking susceptibility of grain boundary engineered fully austenitic stainless steel. Weld. World 2020, 64, 593–600. [Google Scholar] [CrossRef]
  38. Gu, D.; Hagedorn, Y.-C.; Meiners, W.; Meng, G.; Batista, R.J.S.; Wissenbach, K.; Poprawe, R. Densification behavior, microstructure evolution, and wear performance of selective laser melting processed commercially pure titanium. Acta Mater. 2012, 60, 3849–3860. [Google Scholar] [CrossRef]
  39. Sufiiarov, V.; Popovich, A.; Borisov, E.; Polozov, I.; Masaylo, D.; Orlov, A. The Effect of Layer Thickness at Selective Laser Melting. Procedia Eng. 2017, 174, 126–134. [Google Scholar] [CrossRef]
  40. Fousová, M.; Dvorský, D.; Michalcová, A.; Vojtěch, D. Changes in the microstructure and mechanical properties of additively manufactured AlSi10Mg alloy after exposure to elevated temperatures. Mater. Charact. 2018, 137, 119–126. [Google Scholar] [CrossRef]
  41. Hao, Z.; Tian, T.; Peng, S.; Ge, C.; Li, X.; Jia, C.; Guo, C.; Zhu, Q. Effect of Heat Treatment on Microstructure and Properties of FGH4096M Superalloy Processed by Selective Laser Melting. Met. Mater. Int. 2020, 26, 1270–1285. [Google Scholar] [CrossRef]
  42. Salman, O.; Gammer, C.; Chaubey, A.; Eckert, J.; Scudino, S. Effect of heat treatment on microstructure and mechanical properties of 316L steel synthesized by selective laser melting. Mater. Sci. Eng. A 2019, 748, 205–212. [Google Scholar] [CrossRef]
  43. Petryshynets, I.; Kováč, F.; Marcin, J.; Skorvanek, I. Influence of Thermal Processing in High Magnetic Field on Soft Magnetic Properties and Crystallographic Texture of Non-Oriented Fe-Si Steels. Acta Phys. Pol. A 2017, 131, 783–785. [Google Scholar] [CrossRef]
  44. Gorsse, S.; Hutchinson, C.; Gouné, M.; Banerjee, R. Additive manufacturing of metals: A brief review of the characteristic microstructures and properties of steels, Ti-6Al-4V and high-entropy alloys. Sci. Technol. Adv. Mater. 2017, 18, 584–610. [Google Scholar] [CrossRef] [PubMed] [Green Version]
  45. Ovcharenko, A.M.; Chernov, I.I.; Golubov, S.I. Modeling of the coalescence of gas pores during annealing. Sov. At. Energy 2011, 109, 385–395. [Google Scholar] [CrossRef]
  46. Parimi, L.L.; Ravi, G.; Clark, D.; Attallah, M.M. Microstructural and texture development in direct laser fabricated IN718. Mater. Charact. 2014, 89, 102–111. [Google Scholar] [CrossRef]
  47. Thijs, L.; Verhaeghe, F.; Craeghs, T.; Van Humbeeck, J.; Kruth, J.-P. A study of the microstructural evolution during selective laser melting of Ti–6Al–4V. Acta Mater. 2010, 58, 3303–3312. [Google Scholar] [CrossRef]
  48. Prashanth, K.G.; Scudino, S.; Klauss, H.J.; Surreddi, K.B.; Löber, L.; Wang, Z.; Chaubey, A.K.; Kühn, U.; Eckert, J. Microstructure and mechanical properties of Al–12Si produced by selective laser melting: Effect of heat treatment. Mater. Sci. Eng. A 2014, 590, 153–160. [Google Scholar] [CrossRef]
  49. Zuback, J.; Debroy, T. The Hardness of Additively Manufactured Alloys. Materials 2018, 11, 2070. [Google Scholar] [CrossRef] [Green Version]
  50. Farshidianfar, M.H.; Khajepour, A.; Gerlich, A.P. Effect of real-time cooling rate on microstructure in Laser Additive Manufacturing. J. Mater. Process. Technol. 2016, 231, 468–478. [Google Scholar] [CrossRef]
  51. Dunlop, J.A.; Yuan, J.; Kardokus, J.K.; Emigh, R.A. Sputtering Target with Ultra-Fine, Oriented Grains and Method of Making Same. WO1996020055A1, 4 July 1996. [Google Scholar]
  52. Sarkar, J. Performance of Sputtering Targets and Productivity. In Sputtering Materials for VLSI and Thin Film Devices; William Andrew: Norwich, NY, USA, 2014; pp. 171–195. [Google Scholar] [CrossRef]
  53. Mendez, A.R.; Bogy, D.B. Lubricant Dewetting on the Slider’s Air-Bearing Surface in Hard Disk Drives. Tribol. Lett. 2016, 61, 1–11. [Google Scholar] [CrossRef]
Figure 1. SEM micrograph of the NiTa powder used in this study.
Metals 12 00700 g001
Figure 2. As-fabricated cubes of NiTa.
Metals 12 00700 g002
Figure 3. L-PBF zig-zag scanning pattern at 45°.
Metals 12 00700 g003
Figure 4. (a) The locations of indentations for microhardness analysis and (b) the targeted planes of prepared specimens for XRD analysis.
Metals 12 00700 g004
Figure 5. X-ray diffraction analysis for (a) as-fabricated, (b) as-fabricated and NiTa powder and (c) as-fabricated and annealed specimens (cases 4 to 6).
Metals 12 00700 g005
Figure 6. Residual stress on the: (a) transverse plane, (b) sagittal plane.
Metals 12 00700 g006
Figure 7. Indentations of (a) as-fabricated and (b) annealed (case 6) specimens. Anominal is the area of the tip of indenter and Areal is the area of indented region.
Metals 12 00700 g007
Figure 8. Average microhardness of the specimens on transverse plane.
Metals 12 00700 g008
Figure 9. Comparison of microhardness between as-fabricated and annealed specimens (case 6) in the (a) x, (b) y and (c) z directions; (d) x, y and z directions.
Metals 12 00700 g009aMetals 12 00700 g009b
Figure 10. Micrographs of as-fabricated NiTa alloy specimens under (a) an optical microscope on the sagittal plane, (b) SEM-BSE on the sagittal plane under 1000× magnification.
Metals 12 00700 g010
Figure 11. Microstructure of case 4 under (a) SEM-BSE on the transverse plane, and (b) SEM-BSE on the sagittal plane.
Metals 12 00700 g011
Figure 12. Microstructure of case 5 under (a) SEM-SE on the transverse plane, and (b) SEM-SE on the sagittal plane.
Metals 12 00700 g012
Figure 13. Microstructure of case 6 under (a) SEM-BSE on the transverse plane, and (b) SEM-BSE on the sagittal plane.
Metals 12 00700 g013
Figure 14. Formation of precipitates and gas holes in the microstructure of case 6 under (a) SEM-SE, (b) SEM-BSE and (c) point EDX analysis.
Metals 12 00700 g014
Figure 15. EBSD inverse-pole-figure maps of the (a) as-fabricated and (b) case 6 specimens on the sagittal plane.
Metals 12 00700 g015
Figure 16. (a) SEM micrograph of NiTa powder and (b) TEM micrograph of L-PBF NiTa.
Metals 12 00700 g016
Figure 17. EDX mapping for phase composition and distribution of the as-fabricated specimen: (a) STEM micrograph, (b) EDX map (c) point EDX analysis.
Metals 12 00700 g017
Figure 18. TEM micrographs of an as-fabricated specimen. (a) Low-magnification dark-field image; (b) SAED pattern of the primary phase “A” in the [ 1 ¯ 11 ] direction; (c) SAED pattern of the secondary phase “B” in the [ 1 ¯ 11 ] direction.
Metals 12 00700 g018
Figure 19. EDX mapping for phase composition and distribution of case 6: (a) SEM micrograph, (b) EDX map, (c) point EDX analysis.
Metals 12 00700 g019
Figure 20. TEM micrographs of an annealed specimen. (a) Low-magnification dark-field image; (b) SAED pattern of primary phase “A” in [ 1 ¯ 11 ] direction; (c) SAED pattern of secondary phase “B” in [ 1 ¯ 11 ] direction.
Metals 12 00700 g020
Figure 21. TEM micrographs of an annealed specimen. (a) Low-magnification dark-field image; (b) SAED pattern of precipitate “A” in [ 1 ¯ 11 ] direction.
Metals 12 00700 g021
Figure 22. SEM micrographs of NiTa alloy: (a,b) L-PBF + VHT (Case 6), and (c,d) HP + HIP.
Metals 12 00700 g022aMetals 12 00700 g022b
Table 1. List of vacuum heat-treatment cases.
Case NumberHolding Temperature (°C)Holding Time (hour)
18644
211501.25
311504
412202
512204
612754
Publisher’s Note: MDPI stays neutral with regard to jurisdictional claims in published maps and institutional affiliations.

