Article

Investigations on Effects of Forming Parameters on Product Dimensions in Cold Drawing of AISI-316 Stainless Steel Rods

Department of Mechanical and Electro-Mechanical Engineering, National Sun Yat-sen University, Lien-Hai Rd., Kaohsiung 804, Taiwan
*
Author to whom correspondence should be addressed.
Metals 2022, 12(4), 690; https://doi.org/10.3390/met12040690
Submission received: 28 February 2022 / Revised: 11 April 2022 / Accepted: 14 April 2022 / Published: 18 April 2022
(This article belongs to the Special Issue Analysis and Design of Metal Forming Processes II)

Abstract

:
Cold drawing is a commonly used metal forming technique carried out by pulling a billet through a die cavity to obtain desired dimensions. Ideally, the cross-sectional area of the drawn product should be equal to that of the die at its exit; however, the former one is always larger after drawing, in practice. In this study, cold drawing of an AISI-316 stainless steel rod is investigated through finite element analysis. The difference between the product radius and the die radius is denoted by ∆R. A series of simulations using combinations of various forming parameters, including semi-die angle, bearing ratio, reduction ratio, drawing speed and friction coefficient, are conducted to find out the dominant factors of ∆R. It is found that ∆R is mainly affected by semi-die angle, reduction ratio and friction. An empirical formula for ∆R, including various parameters, is established according to the simulation results and verified by drawing experiments as well. Using this empirical formula, the product dimensions can be predicted in advance and proper forming parameters can be chosen to decrease ∆R and improve the product quality.

1. Introduction

Cold drawing is a commonly used metal forming technique, which works by pulling the billet through a die cavity, meaning products of desired shape and quality can be achieved efficiently under appropriate conditions. There are five frequently discussed forming parameters in cold drawing, including (1) semi-die angle, α, the incline angle in the die entry; (2) bearing length, L, length of the bearing zone in the die cavity; (3) reduction ratio, r, the percentage reduction in cross-sectional area of the product after drawing; (4) drawing speed, v, the forward speed of the billet and (5) friction coefficient, μ, a parameter indicating the friction between the billet and the die. These parameters have significant impacts on the drawing processes and drawn products, such as the drawing force, formability, central burst, surface smoothness, residual stress, etc. [1,2,3,4,5].
Some authors have discussed the optimal die design for a typical drawing process. For example, Tintelecan et al. [6] carried out 90 sets of steel wire drawing experiments, with different combinations of semi-die angle and bearing length, finding that the drawing force was minimized when the semi-die angle was between 6° to 8° and the bearing zone length was around 80% of the product radius. Suliga et al. [7] studied the multi-pass drawing process of low-carbon steel wire, with an initial diameter of 5.5 mm. The wire was drawn to 2.2 mm in the first stage and reduced to 1 mm in the second stage, with a speed of 25 m/s. Dies with semi-die angle α equaled to 3°, 4°, 5°, 6°, and 7° were used in different groups of experiments. They found that the optimal semi-die angle was 6° and proposed that an appropriate semi-die angle can improve the lubrication conditions and mechanical properties of the steel wire during high-speed drawing. Nagashima et al. [8] found the optimal drawing conditions of the copper wire using finite element analysis; they studied the irregular stretching of the die and the filling effectiveness analytically and predicted the shape and thickness of the product. They also found that when the semi-die angle reached 10°, the surface stress of the die increased significantly and this may reduce the tool life. Yamakawa [9] found that the optimal semi-die angle was 7–8°, considering that the evenness of stress distribution on the die surface and the optimal bering length should be 1/3–1/2 of the diameter of the die exit.
Lin et al. [10] studied the influence of forming parameters on non-uniform deformation and residual stresses of the drawn medium carbon steel rods using a finite element simulation software (DEFORM-2D). The results showed that the nonuniform distributions of the effective strain decreased with increasing reduction ratio, semi-die angle, and friction. Majzoobi et al. [11] conducted a series of numerical analyses and experiments using different combinations of friction coefficients, semi-die angle and drawing speed. They found that in the drawing of copper and steel bars, the redundant shear deformation would increase the energy required for material deformation. Besides, they tried to obtain the optimal conditions for the minimum energy with the optimal semi-die angle. The results showed that friction had significant effects on the optimal semi-die angle and the angle decreased slightly with the increase in the drawing velocity. Vega et al. [12] investigated the influence of semi-die angle, reduction ratio, and friction coefficient on the drawing force of copper wires through finite element analysis and drawing experiments. The results showed that both reduction ratio and friction coefficient had positive effects on the drawing force. On the other hand, when the radial plastic deformation zone of the wire became uniform, the optimal semi-die angle could be obtained.
Although the drawing issues have been explored for many years, few papers have mentioned the influence of the forming parameters on the precisions of product dimensions. Figure 1 shows the drawing process of a metal rod, where the product radius (Ro) is equal to the die radius (Rd) plus a small amount of ∆R. There are two sources causing this ∆R: (1) the elastic deformation of the die during the drawing process, owing to a repulsive stress exerted on it (i.e., the expansion of die cavity during the drawing process) and (2) the radial elastic recovery of the billet after drawing. In an ideal case, i.e., the die is a perfectly rigid body and the billet is a perfectly plastic body, Ro = Rd as ∆R = 0. However, these ideal bodies do not actually exist, which means ∆R must be larger than zero in practice. Although ∆RRd in most cases, it is not negligible when high dimensional precisions are required in some cases.
The purpose of this study is to investigate the effects of the forming parameters on ∆R. A series of simulations are carried out. An empirical formula is established according to the simulation results. Drawing experiments are conducted as well to verify the FE modeling. With this work, the product dimensions can be controlled more easily by choosing appropriate forming conditions.

2. Materials and Methods

First, 106 sets of simulations were carried out using finite element software DEFORM 2D (Version 11.0, manufactured by Scientific Forming Technologies Corporation, OH, USA). AISI-316 stainless steel rods with initial radius (Ri) = 5.3–5.6 mm and tungsten carbide dies with exit radius (Rd) = 5 mm, bearing length (l) = 3.5–5.0 mm and semi-die angle (α) = 5–8° were modeled; the flow curve of the material at room temperature is shown in Figure 2. Figure 3 and Table 1 show the definitions and the values of the forming parameters, respectively. The choice of parameters was based on the industry experience and some of the literature [6,7,8,9]. Since the optimal bearing length depends on the radius of the die at exit [6,9], bearing ratio (L) was adopted instead of the actual bearing length.
There were 5 forming parameters (α, L, r, v, μ) and 4 levels were assumed for each parameter. A forming condition α = 14°, L = 80%, r = 14%, v = 100 mm/s, μ = 0.05 was selected as the standard condition, which is one of the commonly used working conditions in the industry. A typical approach for finding the effects of a varying parameter (e.g., α) on the target parameter (∆R) is carrying out a series of simulations/experiments with different values of α and measuring the ∆R obtained (while other parameters are kept constant). However, this method cannot show the interactions between different parameters as there is only 1 variable each time. Hence, to have a better understanding of the interactions, 2 variables were studied in each group of simulations in our research.
Further, 2D Axial symmetric model was used in the simulation, quadrilateral elements were generated and the number of elements of the billet in the radial direction was around 20–25 in total, depending on the radius of the billet. Since most deformation happened near the billet’s surface, denser elements were set in the outermost 1/3 of the billet, and the average lengths of the surface element and the core element were 0.16 mm and 0.48 mm respectively (i.e., in a ratio of 1:3). The effects of α, L, r, μ and v on ∆R were analyzed and an empirical formula of ∆R was established according to the simulation results using the linear regression function of the statistical software Excel [13,14].

3. Results and Discussion
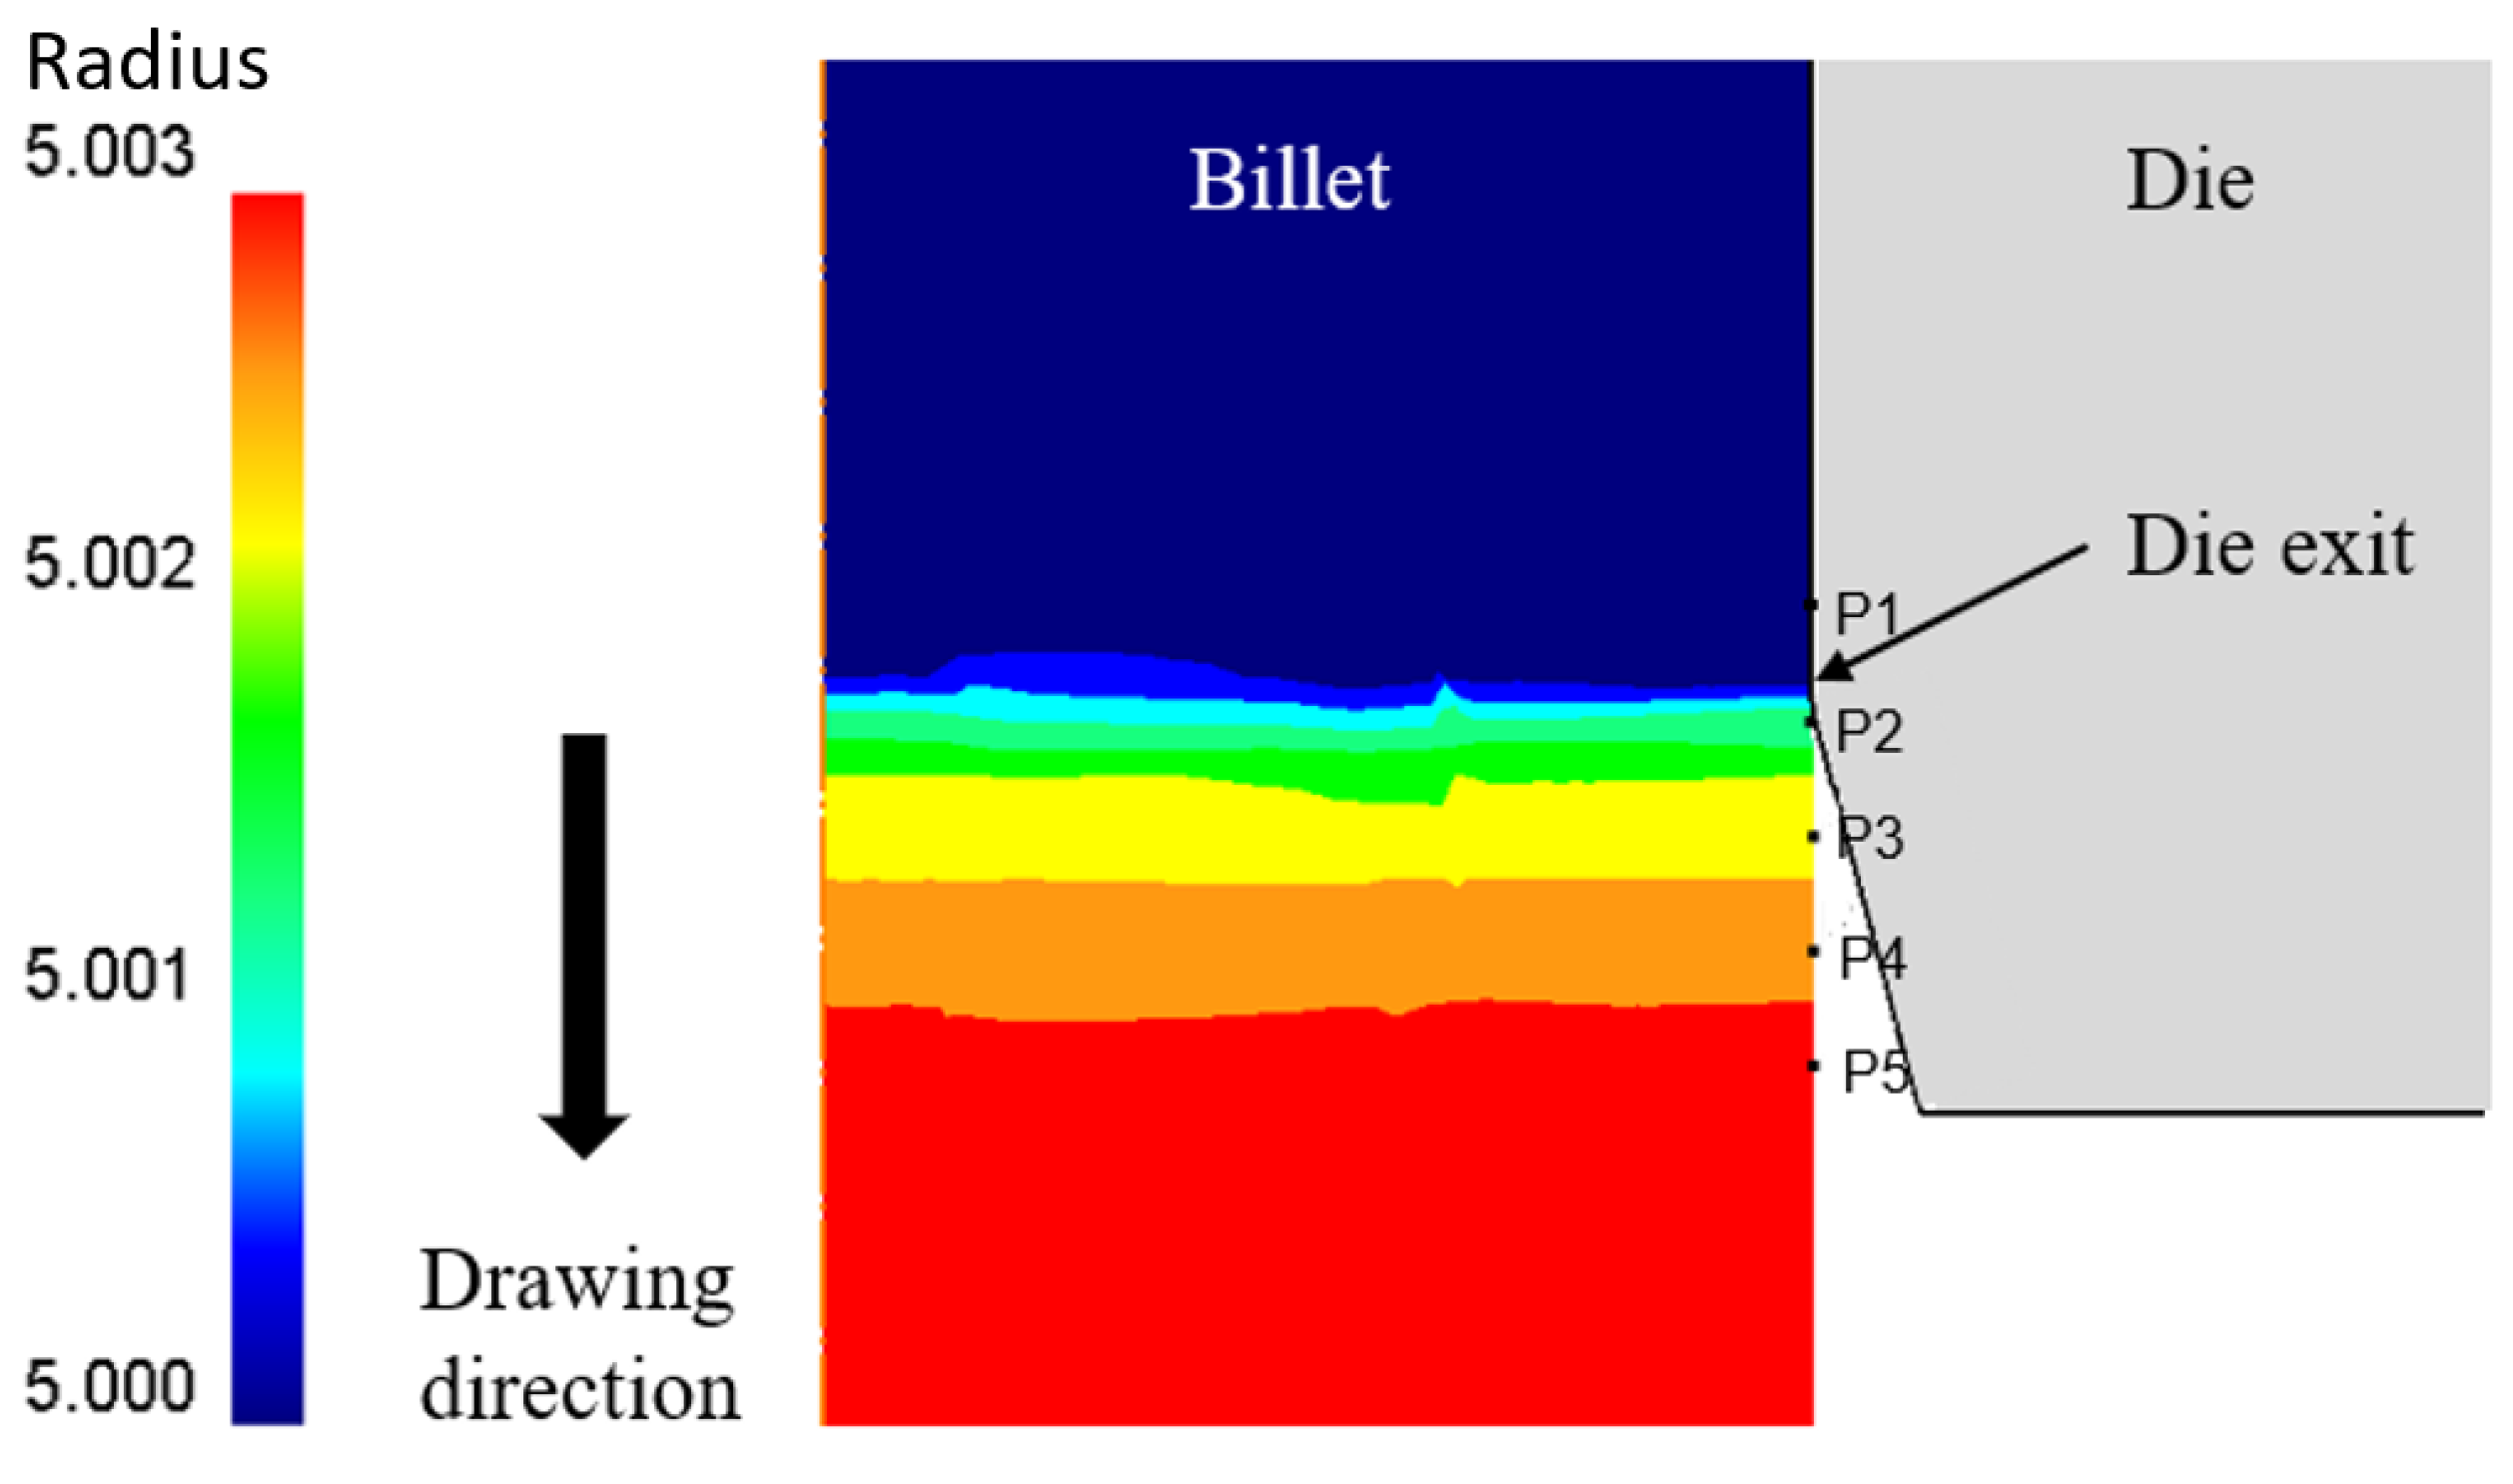
3.1. Analysis of R

As mentioned in Section 1, ∆R comes from the radial elastic recovery of the billet and the expansion of the die cavity during the drawing process. There are two stages for elastic recovery: (1) the first stage occurs when the billet leaves the die exit (i.e., the radial compression stress exerted on the rod from the die is just removed) and (2) the second stage happens when the drawing force is removed. Figure 4 shows the changes in the rod radius in stage 1 under the following conditions: α = 7°, L = 80%, r = 14.27%, v = 100 mm/s, μ = 0.05, deformation type of the billet = elastoplastic, deformation type of the die = rigid. The readings of the five tracking points were: P1 = 5.0000 mm, P2 = 5.0014 mm, P3 = 5.0023 mm, P4 = 5.0026 mm and P5 = 5.0030 mm, which means an elastic recovery of 0.0030 mm happened in this stage. In the second stage, further elastic recovery of 0.0014 mm was noticed on P1 to P5 when the drawing force was removed (i.e., the final radius of the drawn product was 5.0044 mm).
Apart from the elastic recovery, the expansion of the die cavity also contributes a significant amount to ∆R. Figure 5 shows the displacement of the die in the radial direction during the drawing process under the same conditions, except that the die was set as an elastic body this time to observe the die deformation. It can be seen that the maximum displacement happened near the entry of the bearing zone, which was 0.0043 mm and decreased gradually from that point to the die exit. The displacement of the die at its exit was 0.0012 mm, which means the radius of the die at the exit during the drawing process was actually 5.0012 mm, instead of 5 mm, the designed die radius. Hence, the value of ∆R for this case was 0.0044 mm + 0.0012 mm = 0.0056 mm. The same approach was used to find the values of ∆R for other sets of simulations.

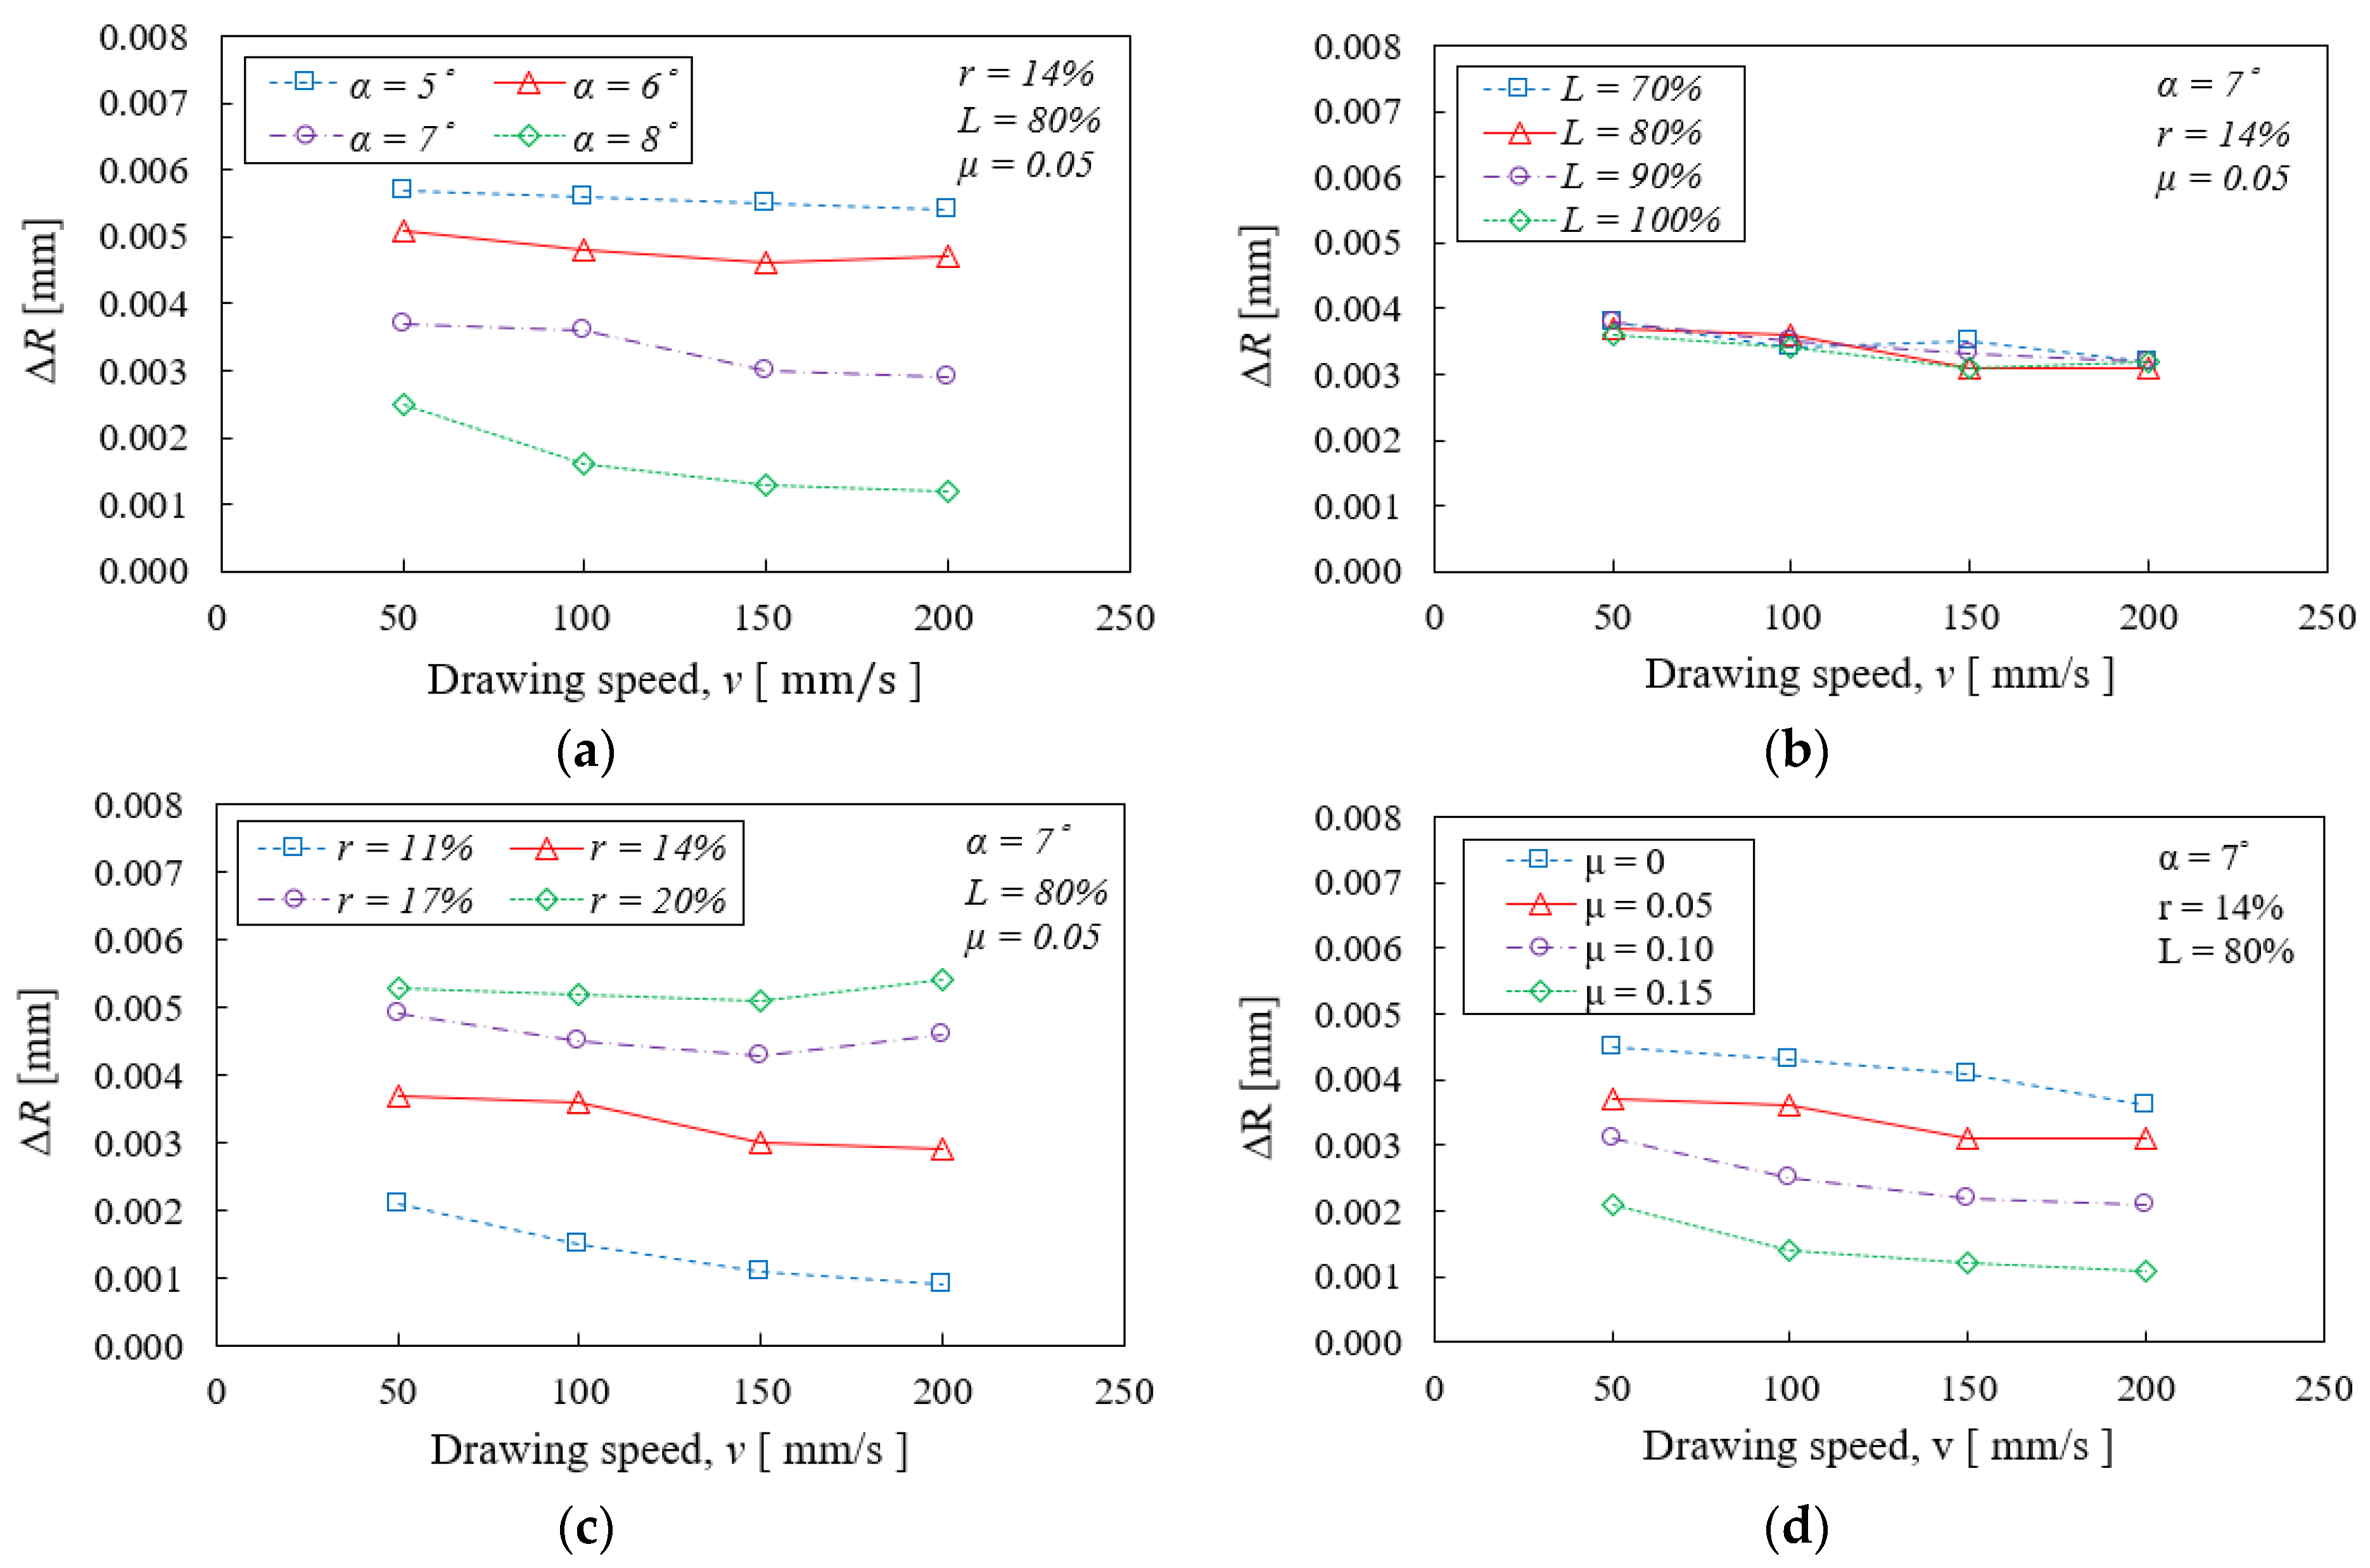
3.2. Effects of Different Forming Parameters on R

Figure 6a–d show the effects of semi-die angle (α) on ∆R under variations of L, r, v and μ, respectively. It can be seen that ∆R decreased with increasing α in all cases. When α increased, the contact area between the billet and the die decreased accordingly, which results in a decrease in the total frictional force and the drawing force. Hence, both the extent of die cavity expansion and the elastic recovery of the billet were reduced, and a smaller ΔR was obtained. Besides, from the shape of the curves, it is known that the interactions between α and other parameters were weak.
Figure 7a–d show the effects of bearing ratio (L) on ∆R under variations of α, r, v and μ, respectively. It is obvious that the change in L had practically no effect on ∆R compared to other parameters; the interactions between L and other parameters were weak as well.
Figure 8a–d show the effects of reduction ratio (r) on ∆R under variations of α, L, v and μ, respectively. It can be observed from the graphs that ∆R increased with r significantly in all cases. A higher reduction ratio implied a more severe deformation of the billet during the drawing process. Accordingly, larger stresses are exerted on the inner surface of the die, which causes a higher degree of cavity expansion. On the other hand, the extent of elastic recovery increased as well. As a result, ∆R increased. The interactions between r and other parameters were weak.
Figure 9a–d show the effects of drawing speed (v) on ∆R under variations of α, L, r and μ, respectively. The change in v did not have a significant effect on ∆R. Generally, ∆R decreased with v slightly.
Figure 10a–d show the effects of friction coefficient (μ) on ∆R under variations of α, r, L and v, respectively. When μ increased, it can be observed from the simulation results that the billet failed to fill the die cavity completely, owing to the increasing surface roughness; also, the radial stress exerted on the inner surface of the die decreased, i.e., the die cavity expanded less, causing the decrease in ∆R. Similar to the previous cases, the interactions between μ and other parameters were weak.

3.3. Empirical Formula

An empirical formula for ∆R is established by regression analysis from the 106 sets of simulation results. In general, more than 30 terms are expected in the multivariate linear regression of five parameters, including the 1st, 2nd and 3rd orders of the parameters α, L, r, v, and μ and their multiplication products. With the aid of the statistical software Excel, it is found that up to 2nd order is enough for our case. Besides, the influences of some terms, such as L, and their products are negligible. After a series of formula fitting, Formula (1) is established:
Δ R = 0.511 α 2 0.386 r 2 0.022 α + 0.097 r 0.076 μ 5.53 × 10 6 v + 0.537 α r + 0.511 α μ + 0.269   r μ 5.096   α μ r
where α is the semi-die angle, r is the reduction ratio, μ is the friction coefficient between the billet and the die and v is the drawing speed. The coefficient of v is 4 orders of magnitude lower than other coefficients because flow stresses are little influenced at room temperature by the applied strain rate, as shown in Figure 2.
Figure 11 shows the comparisons between the ∆R calculated by the empirical formula and the ∆R obtained from the 106 sets of simulation results. As shown, 93% of them show less than 0.001 mm error; the maximum error is 0.001 mm, which occurs under the conditions α = 7°, L = 80%, r = 20.28%, v = 200 mm/s, μ = 0.05. The coefficient of determination (R2) of the linear regression model is 0.9791, indicating the reliability of the empirical formula.

3.4. Drawing Experiments

In order to verify the applicability of the empirical formula, drawing experiments were conducted. A tungsten carbide drawing die with α = 8°, Rd = 3.75 mm and l = 6.0 mm was used. AISI-316 stainless steel rods with Ri = 4.0 mm were drawn through the die with v = 10 mm/s. The diameters of drawn products were measured by an electronic vernier caliper. The experiment was repeated three times and the average product diameter was 7.503 mm. The comparisons between the experiments, simulations and calculation results are shown in Table 2.

4. Conclusions

In this study, the effects of different forming parameters, including semi-die angle, bearing ratio, reduction ratio, drawing speed, and friction coefficient on ∆R were investigated through finite element analysis. The results can be summarized as below.
(1)
A positive ∆R always exists owing to the presence of elastic recovery in the billet and the die cavity expansion during the drawing process.
(2)
R increases significantly with reduction ratio and decreases significantly with semi-die angle and friction between the billet and the die. It also decreases slightly with drawing speed in most cases. The change in bearing ratio has nearly no impact on it.
(3)
The five forming parameters show weak interactions, according to the shape of the ∆R graphs.
(4)
With a better understanding of ∆R, the desired product dimensions can be achieved by proper die design and drawing conditions.

Author Contributions

Conceptualization, Y.-M.H.; methodology, Y.-M.H. and H.S.R.T.; software, H.S.R.T.; experiment, M.-R.L.; formal analysis, H.S.R.T.; resources, Y.-M.H.; writing—original draft preparation, H.S.R.T.; writing—review and editing, Y.-M.H.; supervision, Y.-M.H. All authors have read and agreed to the published version of the manuscript.

Funding

The authors would like to extend their thanks to the Ministry of Science and Technology of the Republic of China under Grant no. MOST 109-2622-E-110-006-CC3. The advice and financial support of MOST are greatly acknowledged.

Institutional Review Board Statement

Not applicable.

Informed Consent Statement

Not applicable.

Acknowledgments

The authors would like to extend their thanks to the Ministry of Science and Technology of the Republic of China under Grant no. MOST 109-2622-E-110-006 -CC3. The advice and financial support of MOST are greatly acknowledged.

Conflicts of Interest

The authors declare no conflict of interest.

References

  1. Chen, D.C.; Huang, J.Y. Design of brass alloy drawing process using Taguchi method. Mater. Sci. Eng. A 2007, 464, 135–140. [Google Scholar] [CrossRef]
  2. Kabayama, L.K.; Taguchi, S.P.; Martinez, G.A.S. The influence of die geometry on stress distribution by experimental and FEM simulation on electrolytic copper wiredrawing. Mater. Res. 2009, 12, 281–285. [Google Scholar] [CrossRef]
  3. Haddi, A.; Imad, A.; Vega, G. Analysis of temperature and speed effects on the drawing stress for improving the wire drawing process. Mater. Des. 2011, 32, 4310–4315. [Google Scholar] [CrossRef]
  4. Martinez, G.A.S.; Santos, E.F.D.; Kabayama, L.K.; Guidi, E.S.; Silva, F.D.A. Influences of different die bearing geometries on the wire-drawing process. Metals 2019, 9, 1089. [Google Scholar] [CrossRef] [Green Version]
  5. Martinez, G.A.S.; Qian, W.L.; Kabayama, L.K.; Prisco, U. Effect of Process Parameters in Copper-Wire Drawing. Metals 2020, 10, 105. [Google Scholar] [CrossRef] [Green Version]
  6. Tintelecan, M.; Sas-Boca, I.M.; Ilutiu-Varvara, D.A. The influence of the dies geometry on the drawing force for steel wires. Procedia Eng. 2017, 181, 193–199. [Google Scholar] [CrossRef]
  7. Suliga, M.; Wartacz, R.; Michalczyk, J. The influence of the angle of the working part of the die on the high speed drawing process of low carbon steel wires. Metall. Mater. Trans. A 2017, 62, 483–487. [Google Scholar] [CrossRef] [Green Version]
  8. Nagashima, R.; Yoshida, K. Development of shaped copper magnet wire for hybrid motor by drawing. Procedia Manuf. 2018, 15, 209–216. [Google Scholar] [CrossRef]
  9. Yamakawa, E. Technologies and issues of drawing dies. Bull. JSTP 2021, 4, 439–444. [Google Scholar]
  10. Lin, H.S.; Hsu, Y.C.; Keh, C.C. Inhomogeneous deformation and residual stress in skin-pass axisymmetric drawing. J. Mater. Process. Technol. 2008, 201, 128–132. [Google Scholar] [CrossRef]
  11. Majzoobi, G.H.; Saniee, F.F.; Aghili, A. An investigation into the effect of redundant shear deformation in bar drawing. J. Mater. Process. Technol. 2008, 201, 133–137. [Google Scholar] [CrossRef]
  12. Vega, G.; Haddi, A.; Imad, A. Investigation of process parameters effect on the copper-wire drawing. Mater. Des. 2009, 30, 3308–3312. [Google Scholar] [CrossRef]
  13. Rencher, A.C.; Christensen, W.F. Methods of Multivariate Analysis, 3rd ed.; John Wiley & Sons, Inc.: Hoboken, NJ, USA, 2012. [Google Scholar]
  14. Yan, X.; Su, X.G. Linear Regression Analysis: Theory and Computing; World Scientific: Singapore, 2009. [Google Scholar]
Figure 1. Schematic diagram of drawing processes.
Metals 12 00690 g001
Figure 2. Flow curve of AISI-316 at room temperature.
Metals 12 00690 g002
Figure 3. Forming parameters in a drawing process.
Metals 12 00690 g003
Figure 4. Radius changes of billet near die exit.
Metals 12 00690 g004
Figure 5. Displacement of the die in the radial direction during the drawing process.
Metals 12 00690 g005
Figure 6. Effects of semi-die angle on ∆R under different conditions. (a) Different bearing ratios; (b) different reduction ratios; (c) different drawing speeds; (d) different friction coefficients.
Metals 12 00690 g006
Figure 7. Effects of bearing length on ∆R under different conditions. (a) Different semi-die angles; (b) different reduction ratios; (c) different drawing speeds; (d) different friction coefficients.
Metals 12 00690 g007
Figure 8. Effects of reduction ratio on ∆R under different conditions. (a) Different semi-die angles; (b) different bearing ratios; (c) different drawing speeds; (d) different friction coefficients.
Metals 12 00690 g008aMetals 12 00690 g008b
Figure 9. Effects of drawing speed on ∆R under different conditions. (a) Different semi-die angles; (b) different bearing ratios; (c) different reduction ratios; (d) different friction coefficients.
Metals 12 00690 g009
Figure 10. Effects of friction coefficient on ∆R under different conditions. (a) Different semi-die angles; (b) different bearing ratios; (c) different reduction ratios; (d) different drawing speeds.
Metals 12 00690 g010
Figure 11. Comparisons between the calculated and simulated results.
Metals 12 00690 g011
Table 1. Forming parameters used in FE simulations.
Forming ConditionsValue
Modulus of elasticity of the die [GPa]669
Modulus of elasticity of the billet [GPa]210
Yield strength of the billet [MPa]204
Initial radius of the billet, Ri [mm] 5.3, 5.4, 5.5, 5.6
Radius of die exit, Ro [mm]5
Semi-die angle, α [ ° ]5, 6, 7, 8
Bearing length, l [mm]3.5, 4.0, 4.5, 5.0
Bearing ratio, L = l/Ro 70%, 80%, 90%, 100%
Reduction ratio, r = (Ri2Ro2)/Ri211.00%, 14.27%, 17.36%, 20.28%
Drawing speed, v [mm/s]50, 100, 150, 200
Friction coefficient, μ0, 0.05, 0.10, 0.15
Table 2. Comparisons of product diameter between experiments, simulations and calculation results.
BilletDiameter of the Drawn Product [mm]
FormulaSimulationExperiment
AISI-316 stainless steel rod with initial dimeter = 8.00 mm7.5027.5027.503
Publisher’s Note: MDPI stays neutral with regard to jurisdictional claims in published maps and institutional affiliations.

