Article

Primary Study on Medium and Low Carbon Ferromanganese Production by Blowing CO2-O2 Mixtures in Converter

School of Metallurgical and Ecological Engineering, University of Science and Technology Beijing, Beijing 100083, China
*
Author to whom correspondence should be addressed.
Metals 2022, 12(4), 682; https://doi.org/10.3390/met12040682
Submission received: 4 March 2022 / Revised: 10 April 2022 / Accepted: 14 April 2022 / Published: 15 April 2022

Abstract

:
The production of medium- and low-carbon ferromanganese (M-LCFeMn) using the converter method has not been industrialized to date in China due to the high manganese loss and serious erosion of the furnace lining. To solve the above problems and to improve the refining technology of M-LCFeMn, the introduction of CO2 gas into the traditional converter process is proposed. In this study, the oxidation behavior of C and Mn in various conditions was analyzed by blowing different proportions of CO2-O2 mixed gas into the high-carbon ferromanganese (HCFeMn) melt. The results showed that it is feasible to make M-CFeMn by blowing CO2-O2 mixtures, and the Mn loss can be effectively reduced during the decarburization process. It is considered that when the proportion of CO2 reaches 25%, the mixed gas has the best effect on the decarburization and manganese preservation under current experimental situation. Two hypotheses and corresponding rate formulas of decarburization kinetics by using pure oxygen are put forward, and the effect of CO2 on the kinetics of decarburization was studied according to different hypotheses.

1. Introduction

As a deoxidizer, desulfurizer and alloy element additive, manganese alloy is often used in the metallurgical industry. It can be classified into silicomanganese (SiMn), high-carbon ferromanganese (HCFeMn), medium-carbon ferromanganese (MCFeMn), low-carbon ferromanganese (LCFeMn), and manganese metal. Among them, medium and low carbon ferromanganese (M-LCFeMn) are usually used in the production of steel with strict requirements in terms of carbon content, such as stainless steel, high-manganese steel, acid-resistant steel, and tool steel, due to its high content of manganese and relatively low carbon content. In recent years, the continuous improvement of quality and production level of high-grade steels has driven the demand of high-quality M-LCFeMn.
Traditional technologies of smelting M-LCFeMn, such as the shaking ladle method and the electro-silicothermic method, cannot meet the needs of current production on account of their disadvantages of high power consumption, complicated process, poor utilization of heat, low recovery of manganese, and relatively high cost. The converter process for decarburization of HCFeMn to get M-LCFeMn has the characteristics of a short process, very little electricity consumption, high productivity, and low production cost [1]. Therefore, it is believed that the converter method will be the technology development trend for M-LCFeMn production in China.
A lot of investigations on the production of M-LCFeMn in converter have been conducted all over the world [2,3,4]. Many countries, such as South Africa, Germany [5], Norway [6], and Brazil [7], already have mature processes for industrial production. There are also some domestic studies on M-LCFeMn production using the converter method [8,9], but this method still has not been applied practically in the ferroalloy industry. The reasons for this are mainly [10]:
  • The reactions between O2 and elements in melt release huge quantities of heat that can raise temperature in the bath to a high level in a short time, which will accelerate refractory erosion.
  • Much manganese will be oxidized to slag or evaporated due to its high vapor pressure under high temperature, which leads to very low yield of Mn [11,12].
An innovative method was proposed wherein the temperature of the melt can be controlled by introducing CO2 to O2 gas in converter by taking advantage of the weak oxidability of CO2 and its endothermic reaction with C, and several researchers have studied the possibilities and advantages of this method. Wu et al. [13] studied the CO2 conversion in Fe-C alloys with different initial C content at 1873 K, and found that the average CO2 conversion rate was more than 80% when the carbon content was 4.0–1.0 wt%. Yin [14] and Ning [15] found that the use of CO2 decreased the temperature of the fire point and reduced the amount of dust generated in the converter. The introduction of CO2 can also reduce the loss of beneficial elements in the melt. According to Liu et al.’s study [16], in the smelting process of Twinning-Induced Plasticity (TWIP) Steel with high Mn content, the manganese loss due to evaporation decreased from 38.0 kg/t to 4.4 kg/t when the CO2 ratio increased from 0 to 40 vol%. The results obtained by Bi [17], who studied the application of CO2-O2 mixture in the production of stainless steel in the laboratory, also showed that this process can reduce the loss of chromium and nickel. In addition, the introduction of a certain amount of CO2 can also achieve the purpose of controlling the melt temperature; according to the thermal balance calculated by Xie et al. [18], every 50 Nm3 of oxygen is replaced by 100 Nm3 of CO2 for decarburization, which can reduce the temperature of the melt by about 9.4 °C.
The studies mentioned above have demonstrated the reliability of introducing CO2 gas into the converter process for M-LCFeMn production and inspired us to use CO2 to solve the problems of the high temperature of the bath and the serious manganese loss that exist in the conventional converter process. The investigation of the reaction mechanism of this process will help this method to be industrialized in China. At the same time, exploring the method of reuse of CO2 resource in the metallurgical industry not only has economic benefits, but also has important significance to the environment, which is in line with the requirement of carbon neutral. For these reasons, a preliminary exploration was carried out in the current study.
Experiments were performed to observe the influence of CO2-O2 mixtures in different ratios on the refining of M-LCFeMn in the converter. The oxidation behaviors of Mn as well as the decarburization behavior during the whole process were analyzed by tracing the variation in the elements as a function of time, and the optimal ratio of CO2 for practical M-LCFeMn production was determined. At the same time, the kinetics mechanism of the decarburization process and the effect of CO2 on the process were studied.

2. Experiment

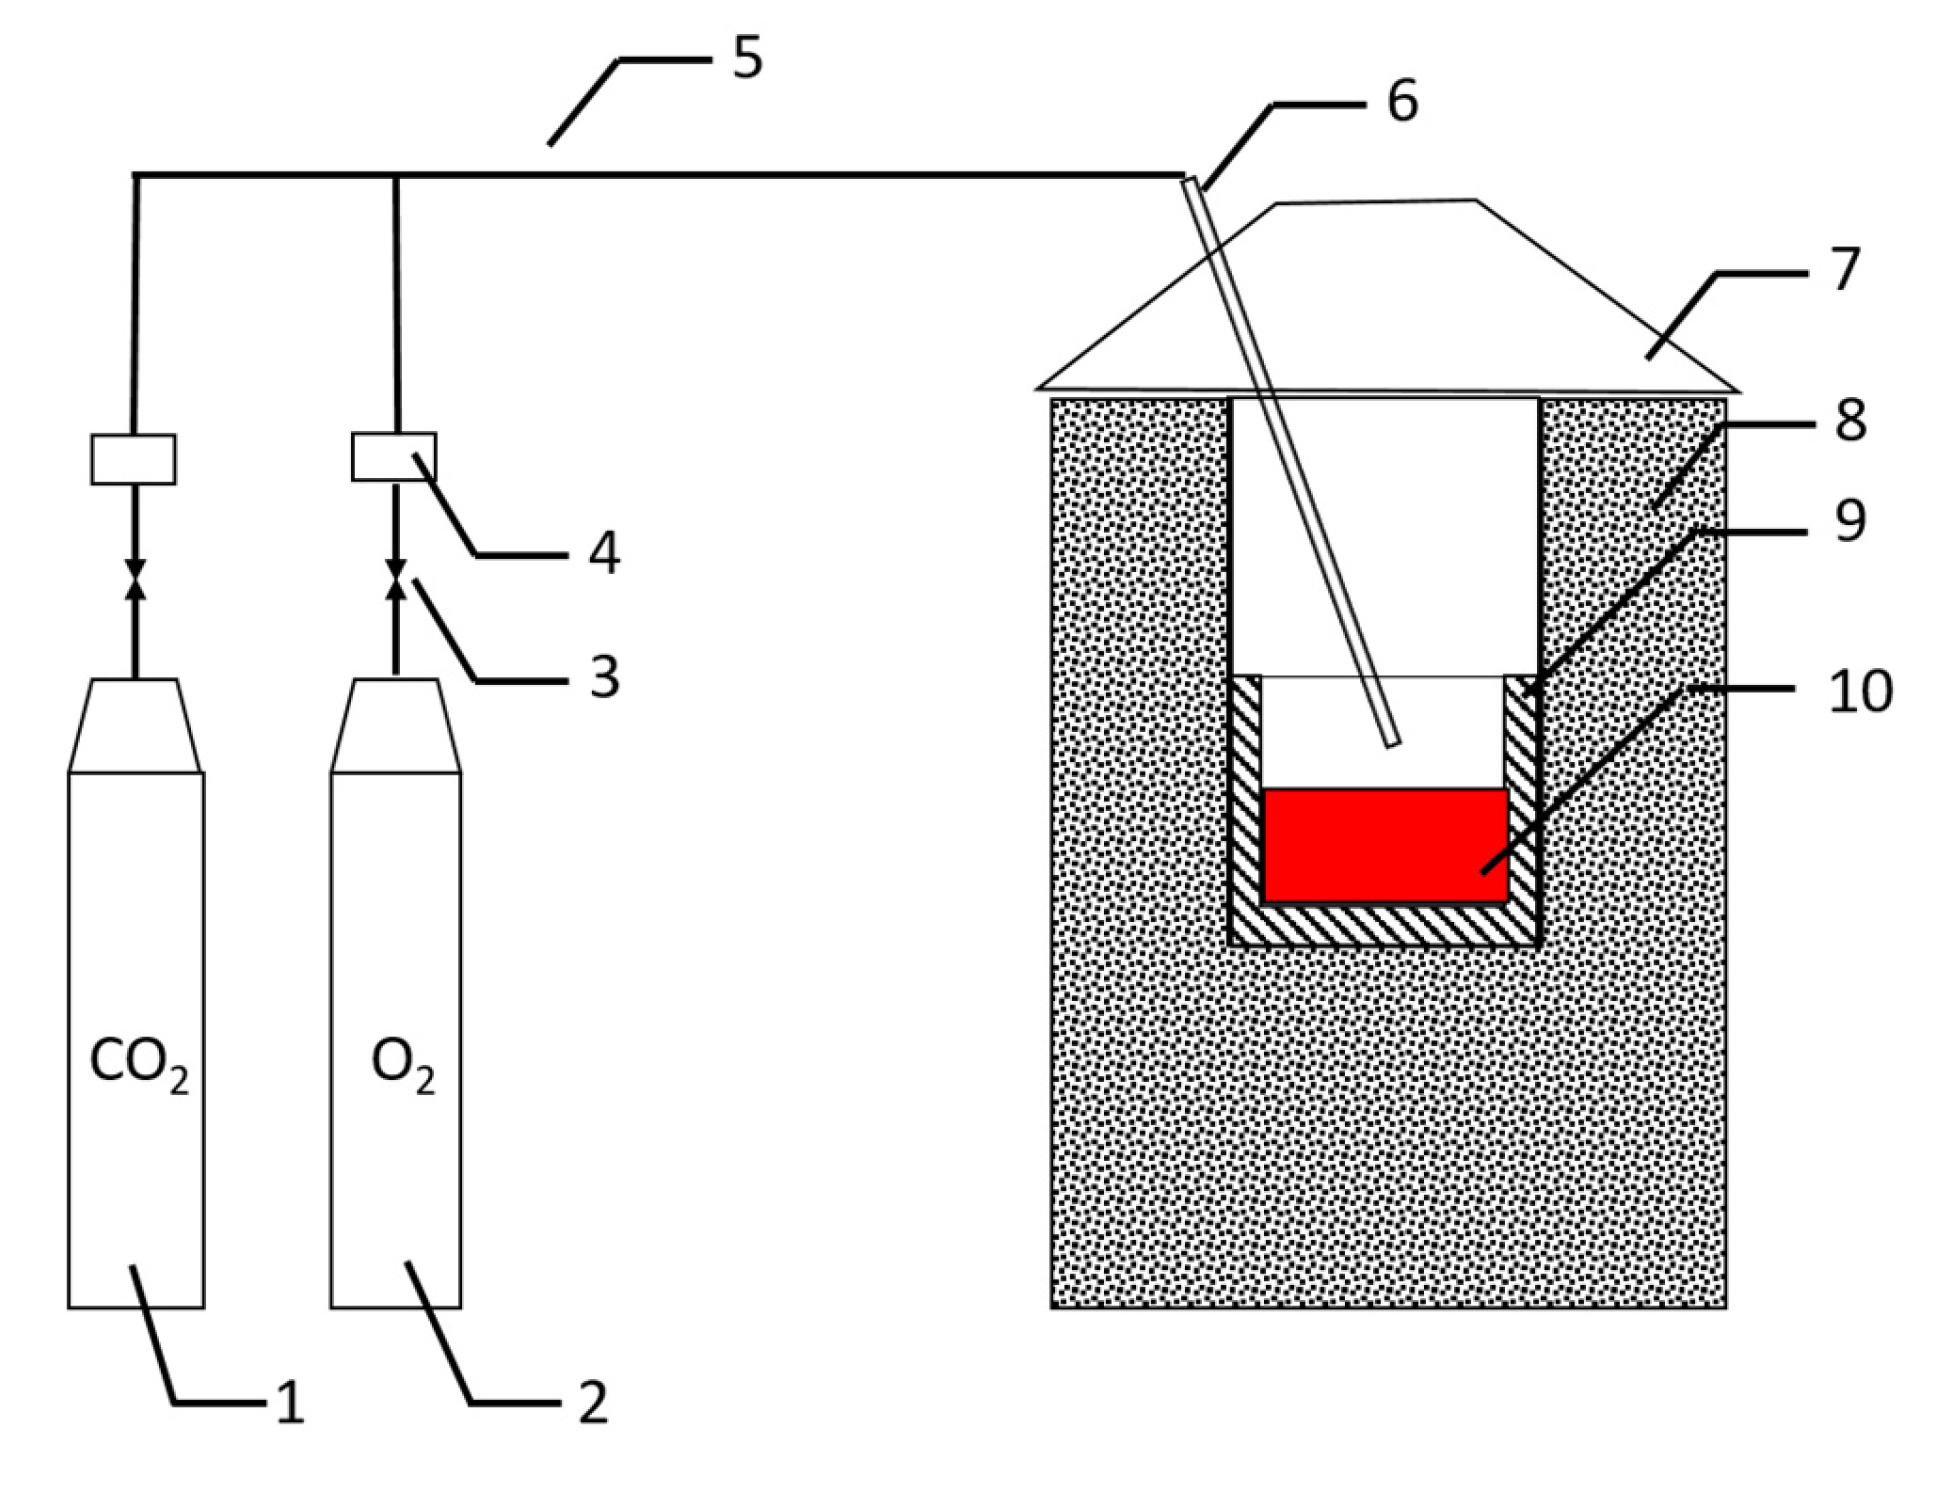
2.1. Apparatus and Materials

The experiments were conducted in an induction furnace with a schematic diagram as shown in Figure 1.
CO2 and O2 used in experiment were stored in bottles. Gas passed through the pressure-reducing valves and flow meters at set rate, were mixed in gas tube, and then injected into the HCFeMn melt through top lance. HCFeMn was placed in a MgO crucible (Φ90 mm×180 mm). It is difficult to melt HCFeMn in an induction furnace because of its weak magnetism; hence, some pig iron was also added into MgO crucible to make it easier to melt. The main compositions of HCFeMn and pig iron are listed in Table 1. A dust hood was placed on top of the furnace to reduce the release of dust generated during experiments and to protect operators.

2.2. Operation Procedure

First, 4 kg of HCFeMn and 1 kg of pig iron were placed in an MgO crucible. Then, induction furnace was heated to over 1450 °C to melt the metal. When all the ingredients were melted, top lance was ensured to be about 2 cm away from the surface of melt and started to blow gas. During the refining process, alloy samples were collected by silica tube every 10 min and detected afterwards to trace the content changes of manganese and carbon in melt.
The temperature measuring instrument used in this experiment was infrared temperature measuring gun. When all the materials were melted, the temperature of the melt was measured at the mouth of induction furnace with an infrared temperature measuring gun. In addition, the temperature of the melt was measured in the same way every 10 min when blowing gases.

2.3. Preliminary Experiments for Decarburization of HCFeMn

Since the utilization rate of gas is unknown in the experiment, it is difficult to know the proper gas flow rate for the decarburization of HCFeMn. O2 was blown into the melt with different flow rates in the preliminary experiment. In the preliminary experiments, three different gas flow rates of 6, 12, and 18 L/min, respectively, were set, and the blowing time for all three experiments was set as 70 min. The scheme for the preliminary experiments is shown in Table 2.
The contents of C and Mn of samples were detected, and the results are shown in Figure 2. Because the reaction was intensively fierce when flow rate of O2 was 18 L/min, and the experiment at 40 min had to be terminated, there are less experimental data under this condition.
It can be observed in Figure 2a that LCFeMn with carbon content lower than 0.30 wt% can be obtained by blowing O2 at any flow rate set in the scheme within 60 min. It is also indicated that 70 min is too long for the experiments. Hence, it is reasonable to adjust the experiment time to 60 min in the following steps. As can be seen from Figure 2b, when the O2 flow rate is 6 L/min, the decrease in Mn content in the melt is not obvious during the whole blowing process. However, when the O2 flow rates were 12 and 18 L/min, respectively, the Mn content decreased rapidly after gas blowing for 20 min. Considering the variations of carbon and manganese, and the complexity of operation, gas flow rate in the subsequent formal experiments was determined as 6 L/min.

2.4. Formal Experiments for Decarburization of HCFeMn

Formal experiments were conducted with 25% gradient of CO2 ratio in mixed gas to obtain the optimal ratio of CO2 in current study. According to the results of preliminary experiments, gas flow rate of 6 L/min and time of 60 min were applied in formal experiments. Experimental scheme is presented in Table 3.

3. Results and Discussion

Samples were taken during experiments and sent for examination. The results will be analyzed and subsequently discussed.

3.1. Effect of CO2 on Decarburization and Mn Preservation

3.1.1. Effect of CO2 Ratio on the Variation in C Content in Melt

The variation in carbon content in the melt during the process is shown in Figure 3. For the sake of comparing the effect of decarburization and manganese preservation during the process of blowing pure O2, the data of experiment 1 (displayed in the preliminary experiments) are also placed in Figure 3. It can be seen that the carbon content decreases regardless of the injection gas, which means it is feasible to introduce CO2 for decarburization of HCFeMn. In addition, MCFeMn could be obtained when varying the ratio of CO2 from 25% to 75% in the mixed gas, as it can be observed that the carbon content drops to less than 3.0 wt% at 60 min. When blowing pure O2, the carbon content can drop to LCFeMn, which is lower than 0.5 wt%, within 60 min; conversely, it was difficult to obtain MCFeMn after 60 min when blowing pure CO2 in the current experiments. It is also obvious that the decarburization ability of mixed gas is worse than that of pure O2. The reasonable explanation for this is that the oxidability of CO2 is poorer than that of O2.

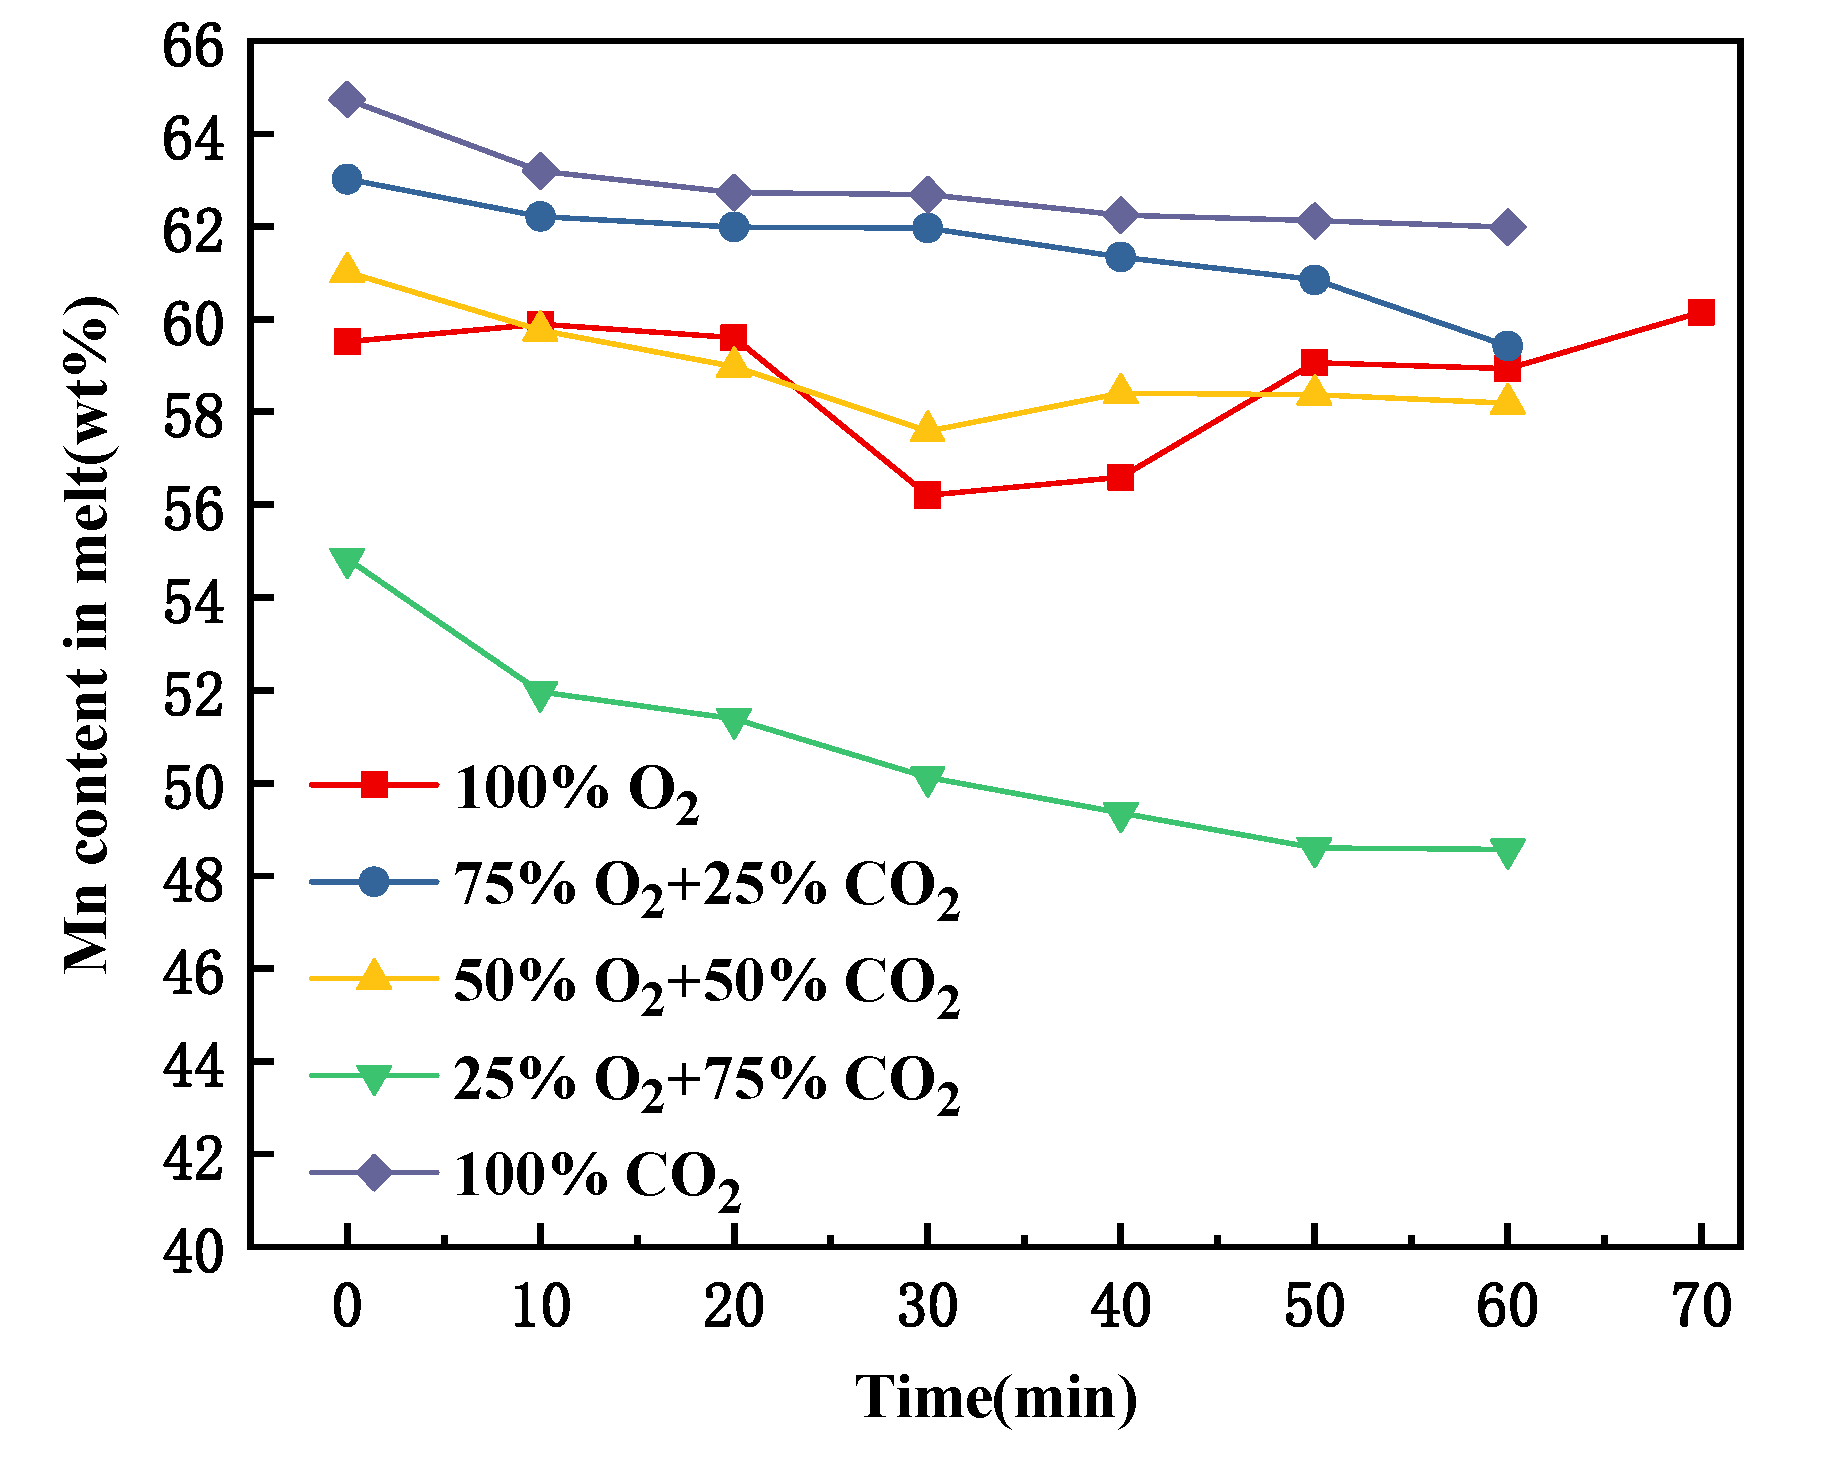
3.1.2. Effect of CO2 Ratio on the Variation in Mn Content in Melt

Manganese retention is another important target of the M-LCFeMn refining process. The variation in manganese content in melt was also detected in order to study the role of CO2 on the preservation of manganese, and the results are presented in Figure 4.
Due to the oxidation and evaporation of Mn during the refining process of M-LFeMn, it is impossible to avoid manganese loss. This is consistent with the decrease in manganese content in Figure 4. It can be seen in the figure that manganese content at the endpoint is lower than that at the start point when melt was blown by mixture gas, while the situation is the opposite when the blown gas was pure O2, with the terminal Mn content being slightly higher than the initial Mn content. It seems that the manganese loss increased and the manganese yield decreased when blowing CO2-O2 mixtures at first glance. However, the reaction was found to be extremely violent during the experiments, and the splash was severe; furthermore, the weight change of the melt should also be taken into account when discussing the manganese yield. The manganese yield in every experiment was calculated on the basis of data including the weights of the melt and manganese content at the beginning and endpoint of refining, and the results are shown in Table 4. It can be seen in the table that, when the proportion of CO2 increases from 0% to 50%, the manganese yield increases from 56% to 76%, and with a continuously increasing proportion of CO2, manganese yield decreases slightly at 75% CO2 introduction, before reaching its maximum value of 86% when blowing pure CO2. These results indicate that the introduction of CO2 has a positive effect on manganese retention during the converter refining process.

3.1.3. Optimum CO2 Ratio for Decarburization and Mn Preservation

The results presented above show that, as the ratio of CO2 increases in the gas mixture, the manganese yield increases, but the decarburization efficiency decreases gradually. Therefore, it is necessary to find an optimal CO2 ratio that can balance these two effects. For this purpose, the variation in manganese content with changing C content was investigated, and the results are shown in Figure 5.
As shown in Figure 5, when the melt is blown with pure O2, the Mn content increases slightly when the carbon content in the melt is above 5.00 wt%. Then, it decreases until the carbon content decreases to 3.00 wt%, and finally increases again when the carbon content reaches a value lower than 0.50 wt%. Meanwhile, when the melt is blown with CO2-O2 mixtures, the manganese content in the melt decreases constantly with decreasing carbon content, which is different from the situation when blown with pure O2.
It is worth noting that each line of the experiments employing blown mixer gas has an inflection point. Before the inflection point, the C content in the melt changes slowly, while the Mn content decreases rapidly; conversely, after the inflection point, the C content decreases rapidly while the Mn content remains almost unchanged. The reason for this phenomenon might be explained as follows: the introduction of CO2 changes the oxidized order of elements. When mixed gas is injected, silicon and manganese in the melt react in preference to carbon, so the manganese content decreases quickly when the carbon content is relatively high (like the trend of the initial period of the lines in Figure 5). On the one hand, during the refining process, the MnO in the slag is reduced by the carbon in the melt, generating CO, which could stir the melt to extend the area of the contact surface between slag and melt, consequently accelerating the reaction rate of MnO and carbon and reducing manganese loss due to oxidation. On the other hand, the introduction of CO2 results in the temperature being lower than in the case blown with pure O2, effectively reducing the manganese loss due to evaporation. The Mn content in the melt decreases less than that when blowing 100% O2 for these two reasons, and this is consistent with Figure 5, which shows that the change rate becomes slower after the inflection point.
To clarify how changing the injection gas influences the manganese loss, the degrees of manganese loss and decarburization in the melt at the beginning and end of the experiment were calculated and set as ΔMn and ΔC, respectively. Define A = ΔMn/ΔC, which represents the amount of manganese loss when carbon removal is 1.0 wt%. The results of the calculation are listed in Table 5. According to Table 5, the value of ‘A’ under different gas mixtures can be ranked in the following order: 100%CO2 < 75%O2 + 25%CO2 = 50%O2 + 50%CO2 < 25%O2 + 75%CO2 < 100%O2; this indicates that 100% CO2 has the best Mn retention effect, followed by 75%O2 + 25%CO2 and 50%O2 + 50%CO2. However, the degree of decarburization is only 39% when blowing pure CO2, and too much CO2 might lead to low melt temperature, which may lead to the potential risk of M-LCFeMn production. Although the experiments performed when blowing 75%O2 + 25%CO2 and 50%O2 + 50%CO2 have the same value of ‘A’, the degree of decarburization is higher when the CO2 ratio is 25%, reaching about 76%. Therefore, it is considered that the optimal proportion of CO2 in the mixed gas is 25% under the current experimental conditions, and that this can effectively reduce manganese loss while at the same time efficiently performing decarburization.

3.2. Hypothesis 1 on the Kinetics of Decarburization with CO2-O2 Mixtures

Compared with the decarburization of HCFeMn by O2, the kinetics mechanism is more complex for the decarburization process of HCFeMn with CO2-O2 mixtures. In this section, two hypotheses are proposed to analyze the decarburization rate during the process of blowing 100% O2 and CO2-O2 mixed gases, respectively. In addition, on the basis of this, the influence of CO2 on the decarburization kinetics mechanism is discussed.

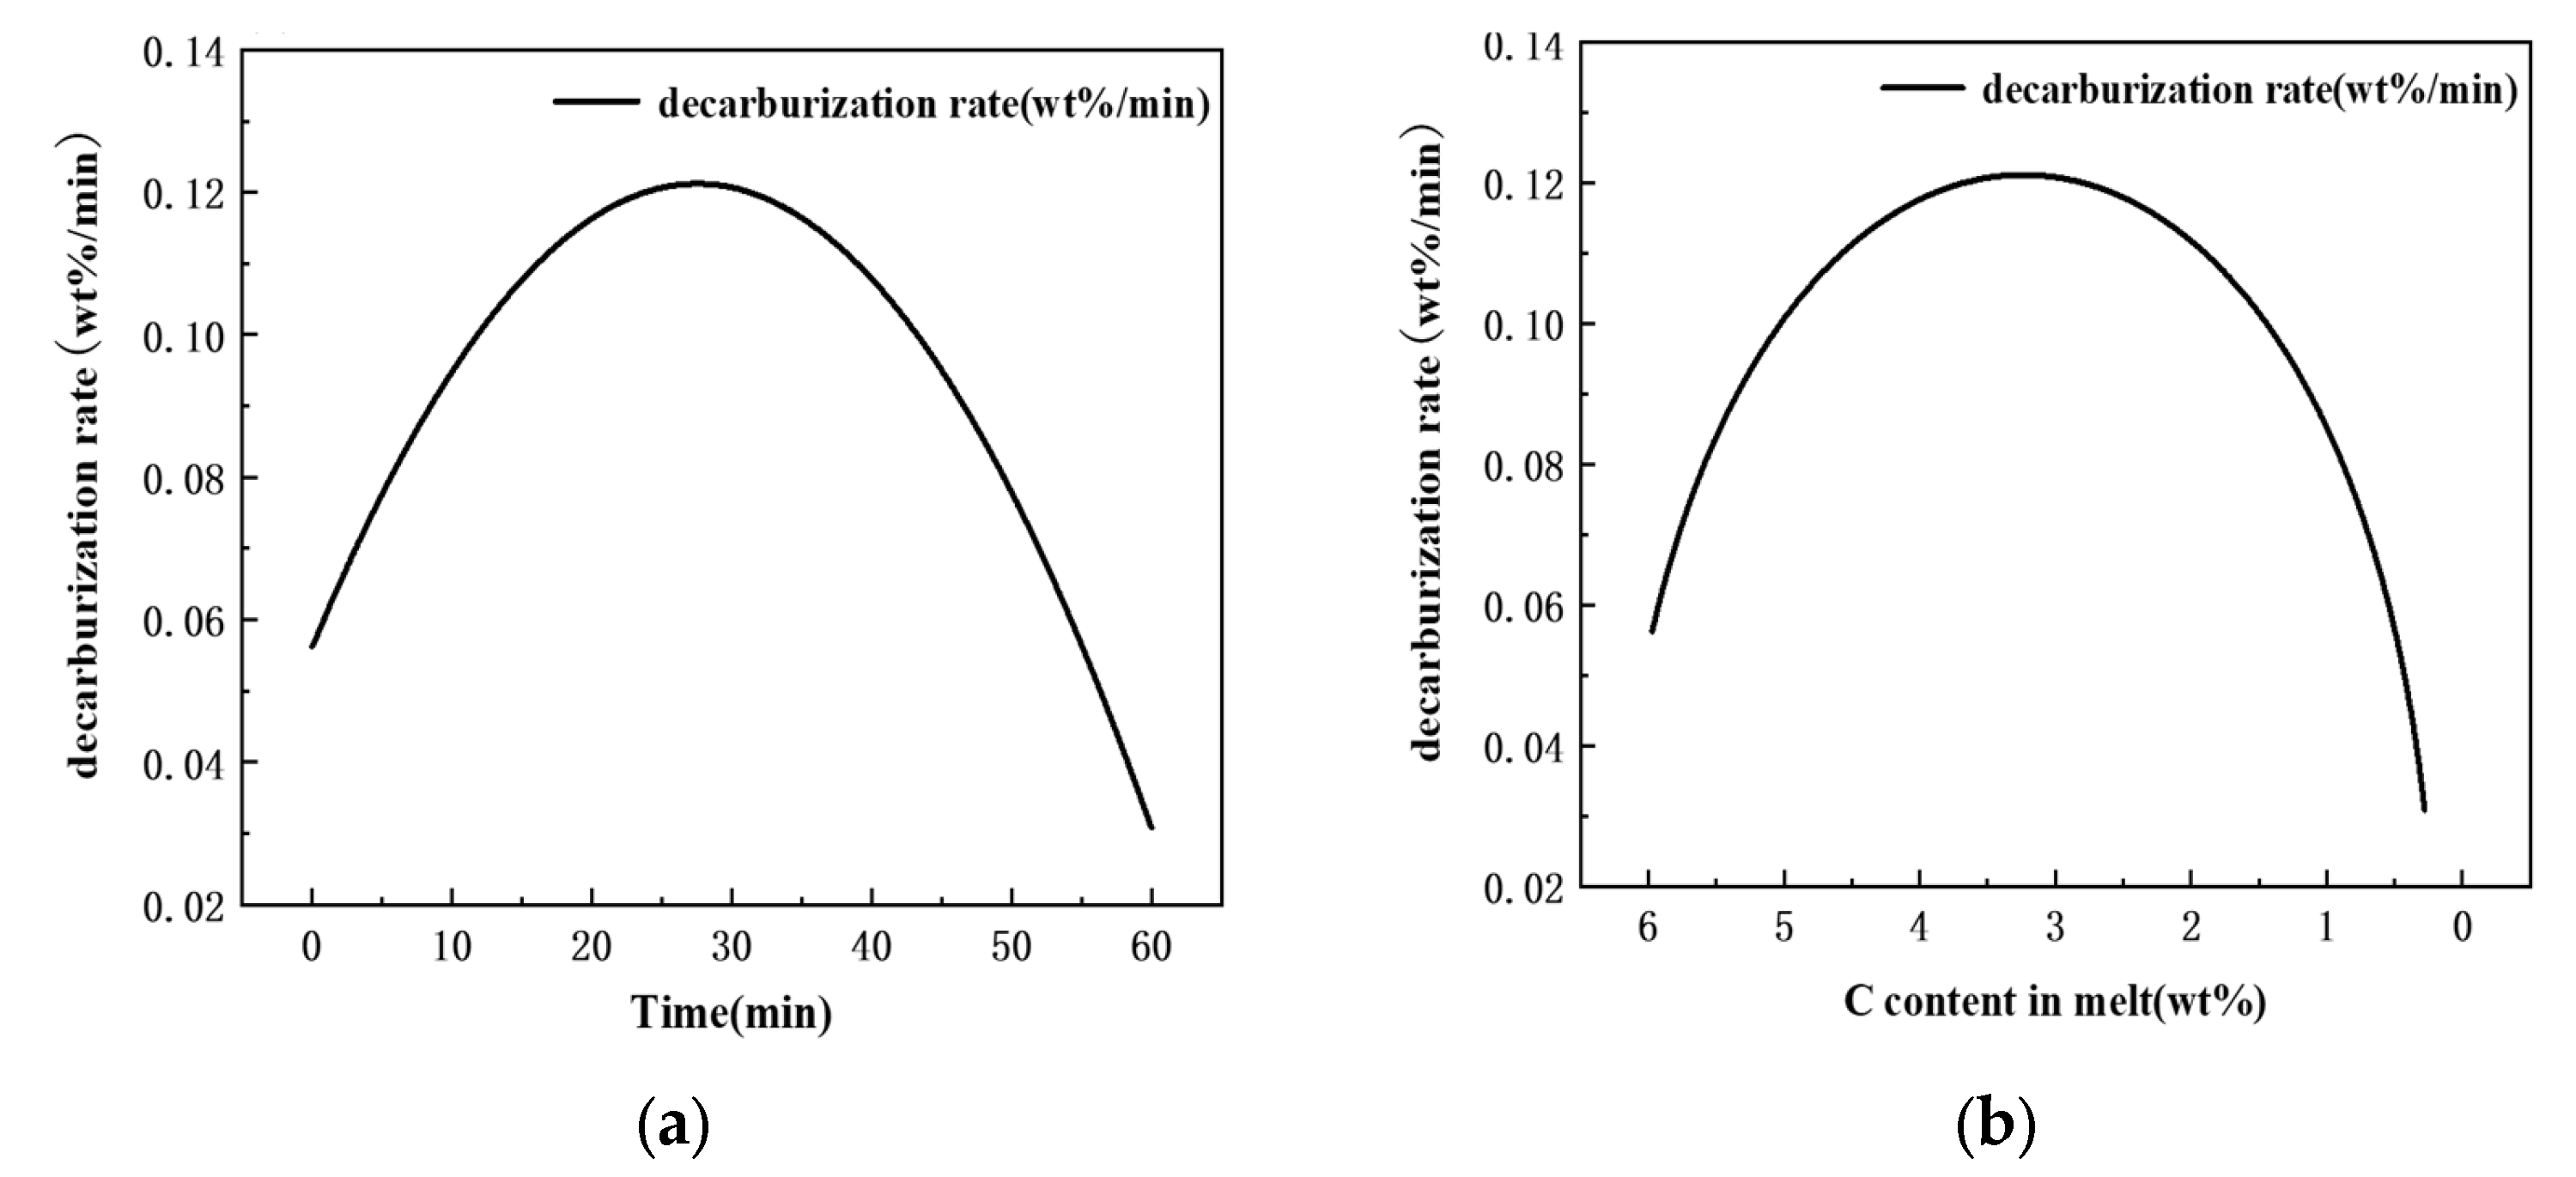
3.2.1. Effect of CO2 Ratio on the Decarburization Rate of HCFeMn

The experimental data regarding decarburization of HCFeMn with pure O2, different proportions of CO2-O2 mixtures, and pure CO2 were analyzed. The change curves for carbon content in the melt within 60 min can be seen in Figure 3 (found in Section 3.1.1). It can be seen from Figure 3 that the carbon content in the melt shows an approximately linear downward trend. On the basis of this phenomenon, we hypothesized that the whole decarburization process was controlled by chemical reaction. We performed curve fitting on the basis of this hypothesis, as shown in Figure 6. The fitting equations for the variation in C content with time under different CO2-O2 mixtures were also obtained, and are shown in Table 6.
The slope of each straight line is the decarburization rate when using the corresponding mixed gas. As can be seen from Table 6, the decarburization rate decreases with increasing CO2 proportion, which is in accordance with the thermodynamic analysis. It is assumed that the rate of decarburization when using CO2-O2 mixed gas is a superposition of the decarburization rate when blowing 100%CO2 and when blowing 100%O2, respectively. Taking this assumption into account, the decarburization rates with different proportions of CO2-O2 mixtures were calculated, and the results are shown in Table 7.
It can be seen from Table 7 that the rates of decarburization calculated by linear superposition are higher than those obtained by fitting the results of the three groups of experiments. We speculate that the introduction of CO2 might reduce the activity of O involved in the decarburization process, or that the endothermic reaction of CO2 and C lowers the temperature of the melt during this process.

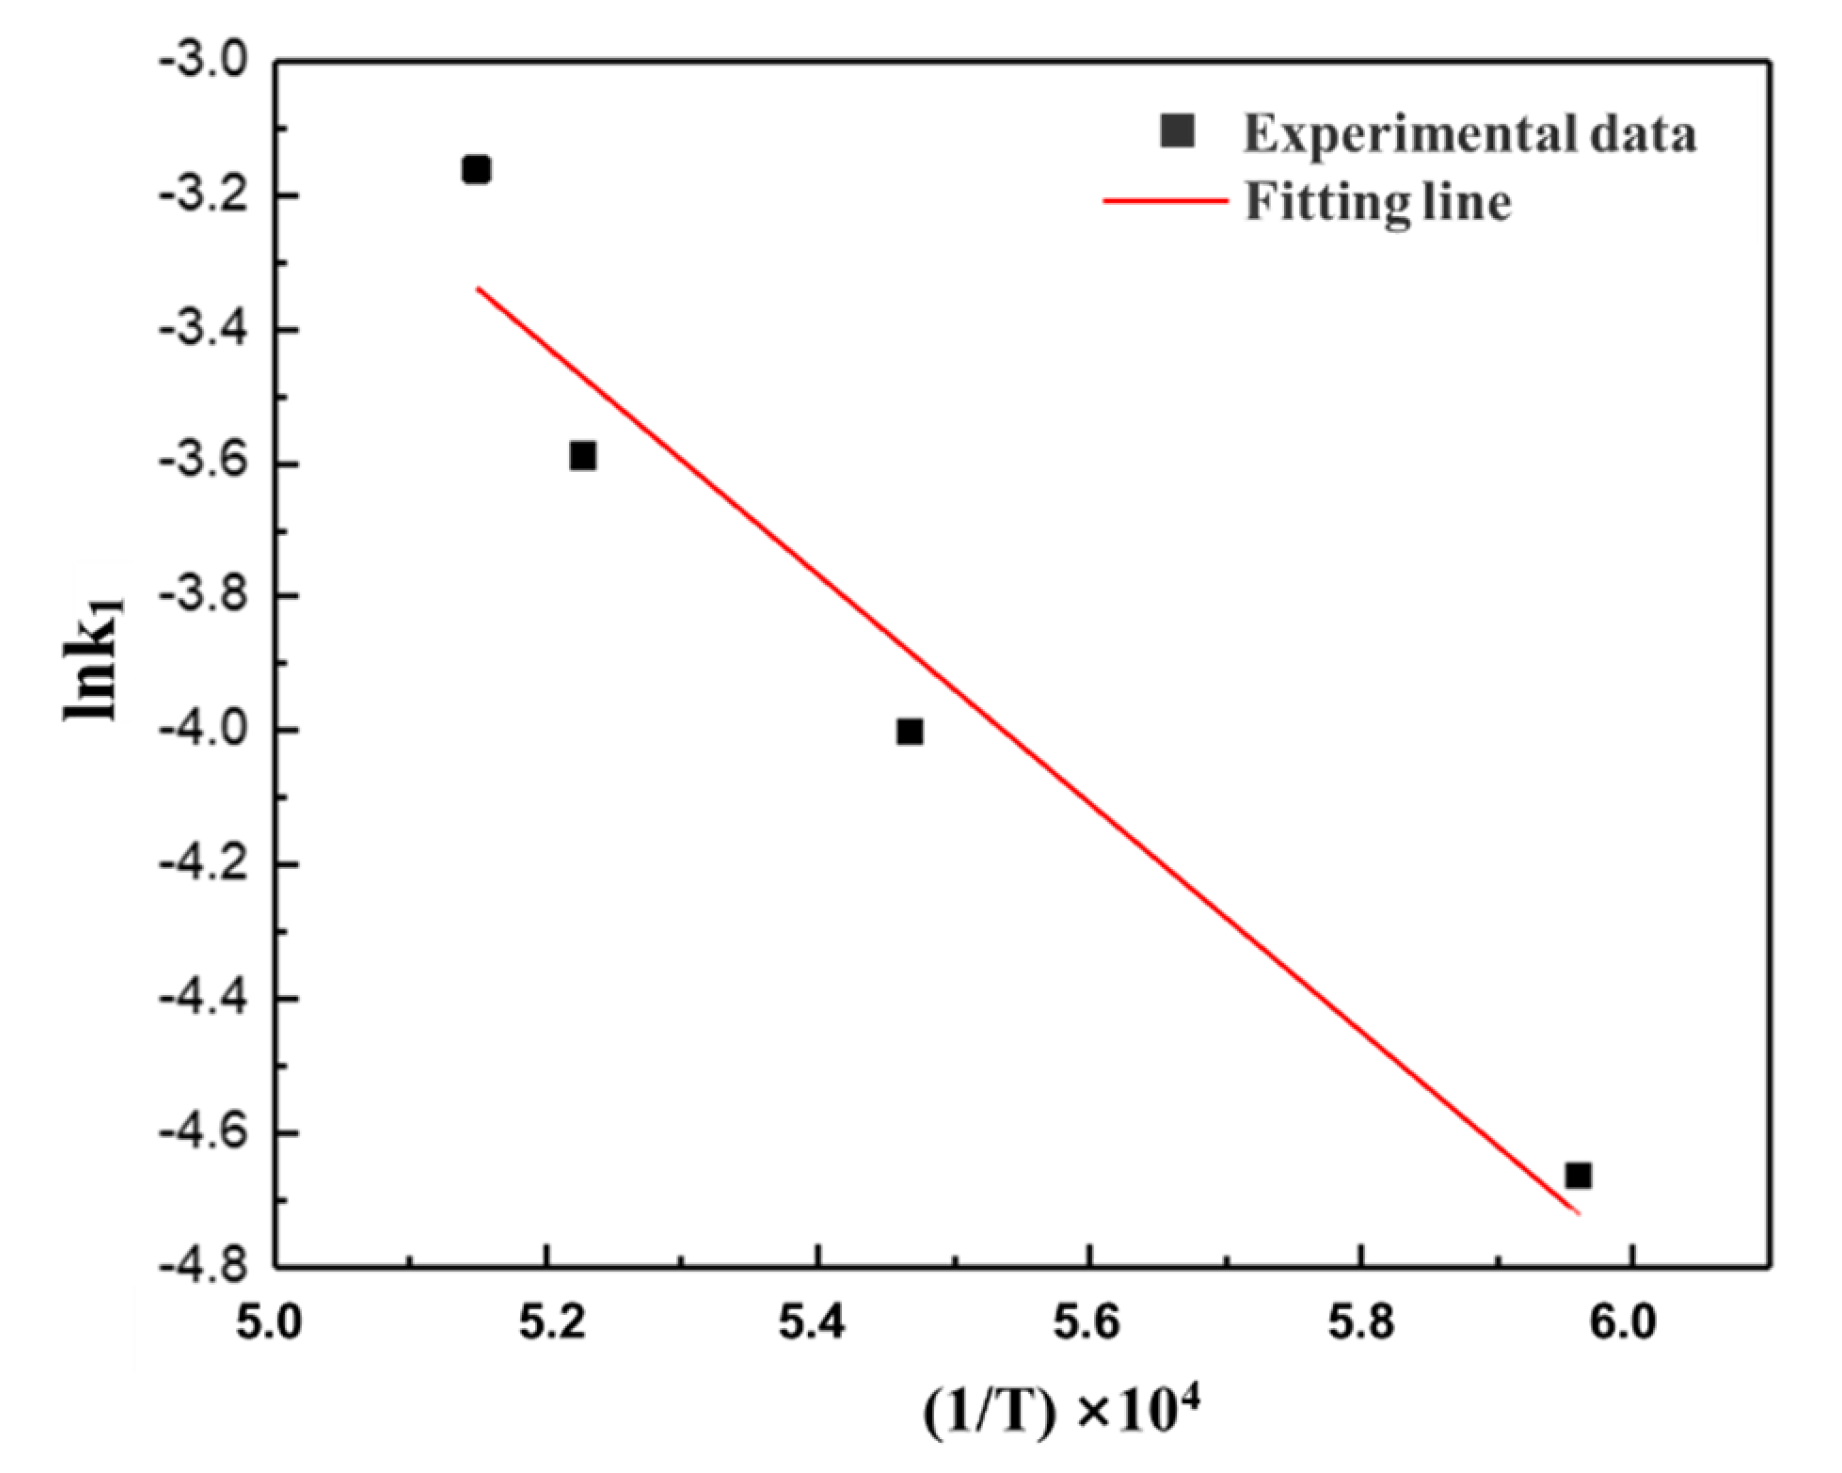
3.2.2. Kinetics of Decarburization of HCFeMn with 100%O2

In the process of decarburization with 100%O2, the C content in the melt decreases linearly with time. Hence, it is considered that the whole decarburization process is controlled by the chemical reaction of C and O2 in the melt at the gas–liquid interface. The reaction equation according to this hypothesis is:
[C] + 1/2O2 = CO(g)
Ignoring the reverse reaction, the reaction order of C and O2 is 1; therefore, the expression of the reaction rate is:
d C C d t = k 1 · C C
where
  • C C —concentration of C in the melt, mol/L;
  • t—time, min;
  • k1—rate constant, 1/min.
Suppose that the mass fraction of carbon in the melt is ωC, the melt density is ρ , and the relative atomic mass of carbon is MC.
C C = ω C · ρ M C
Substituting Equation (3) into Equation (2), and assuming that the melt density ρ is a constant value, the following equation can be obtained after simplification:
d ω C dt = k 1   ·   ω C
where
  • d ω C d t —decarbonization rate, wt%/min;
  • ω C —mass fraction of C in the melt at time t, wt%.
When the blowing gas is 100% O2, it can be seen from Table 6 that the corresponding decarbonization rate is 0.10064 wt%/min.
By substituting the corresponding carbon content in the melt at different times (as shown in Table 8) into Equation (4), the rate constant k1 corresponding to different carbon contents can be calculated. The carbon content of the melt at different times and the calculated rate constants k1 and lnk1 are shown in Table 8.
The Arrhenius equation shows that the rate constant k1 changes with temperature T. Therefore, taking lnk1 as the ordinate and (1/T) × 104 as the abscess, plots are drawn and fitted as shown in Figure 7.
The relational expression between lnk1 and 1/T obtained by fitting experiment data is:
lnk1 = 8.82196 − 22750.56534/T
As can be seen from Figure 7, the correlation between experimental data and the fitted lines is not accurate enough. This may be caused by the amount of smoke involved in the blowing process, which blocks the use of infrared temperature measurements, leading to low accuracy in the temperature measurement results. It is also suspected that the process of blowing is not controlled by chemical reaction homogeneously, or that the order of the chemical reaction equation changes in the later smelting period. Therefore, another hypothesis regarding the kinetics mechanism was put forward.

3.3. Hypothesis 2 on the Kinetics of Decarburization with CO2-O2 Mixtures

The variation in C content in the melt with time during the decarburization of HCFeMn when blowing pure O2 is displayed in Figure 8a, where it can be seen that the slope of the line increases gradually in the first 30 min and decreases gradually from 30 min to 60 min. Therefore, it is considered that the decarburization process can be divided into two parts. The experimental data were fitted by polynomial fitting, and the function image is shown in Figure 8b.
In order to show the variation in decarburization rate with time in an intuitive manner, this was derived from the polynomial fitted curve in Figure 8b and the result is shown in Figure 9a. At the same time, the decarburization rates were correlated with the C content in the melt at each moment, so as to obtain the relationship between the decarburization rate and the C content in the melt, as shown in Figure 9b.
As shown in Figure 9b, the curve appears to rise first and then fall, indicating that the decarburization process can be divided into two stages: the process with the C content in the range of around 6.00 wt% to 2.85 wt% can be regarded as the first stage. During this period, the decarburization rate increases with decreasing C content in the melt. The C content in this stage is relatively high, and the reaction speed is controlled by the chemical reaction between C and O2 at the interface. The process with carbon content lower than 2.85 wt% comprises the second stage. The C content is relatively low, and the decarburization rate decreases with decreasing C content in the melt; it is speculated that the reaction speed is controlled by the mass transfer of C from the melt to the reaction interface.

3.3.1. Kinetics of Decarburization of HCFeMn with Pure O2 during the First Stage

As mentioned above, the first stage of the decarburization process consists of the first 30 min, with carbon content decreasing from 5.97 wt% to 2.85 wt%. The speed is controlled by the chemical reaction of C and O2. According to the same calculation method and steps for acquiring the rate constant k1 and lnk1, as mentioned in the kinetic analysis of the decarburization process when blowing 100%O2 (discussed in Section 3.2.2), the relationship between the reaction rate constant k1 and (1/T) × 104 was calculated, plotted and fitted, as shown in Figure 10.
After fitting, the relation between k1 and temperature T was obtained, which can be represented as shown in Equation (6):
lnk 1 = 5.44588 17061.64843 / T
By comparing Figure 10 with Figure 7, it can be seen that the lnk1 obtained on the basis of hypothesis 2 is more accurate and closer to the reality.

3.3.2. Kinetics of Decarburization of HCFeMn with Pure O2 during the Second Stage

The speed of decarburization during the second stage is controlled by the mass transfer of C from the melt to the reaction interface, so the decarburization rate should be equal to the mass transfer rate. The formula is as follows:
d ω C dt = Ak 3 ρ W ω C ω Ce
where
  • (dωC)/dt—decarburization rate, wt%/min;
  • A—gas–liquid interface area, m2;
  • k3—mass transfer coefficient of C in melt;
  • ρ—density of ferromanganese melt, kg/m3;
  • ωC—mass fraction of C in the melt at time t, wt%;
  • ωCe—the equilibrium mass fraction of C at the gas–liquid interface, wt%.
A and ρ show little change and are set as constants; ωCe is close to zero, and can be regarded as negligible. Equation (7) can be simplified to Equation (8):
d ω C dt   =   k ω C
k—proportionality coefficient, Ak 3 ρ W .
By integrating Equation (8), the relationship between the carbon content in the melt and time during the second stage can be obtained as follows:
ln ω C   =   kt   +   C
where
  • ωC—carbon content of melt, wt%;
  • k—proportional coefficient, Ak 3 ρ W   .
  • t—experiment time, min;
  • C—the integral constant.
The experimental data were put into the formula, and the results were linearly fitted, so as to obtain the fitted curve, which is shown in Figure 11.
By fitting the experimental data, the following equations can be obtained:
ln ω C   =   0 . 07888 t   +   1 . 2204
k   =   0 . 07888   min 1

3.3.3. Influence of CO2 on the Decarburization Kinetics of HCFeMn Melt

Compared with the decarburization reaction with 100%O2, the introduction of CO2 changes the temperature and composition of the system. To obtain the new process to be industrialized, the kinetics of the decarburization of HCFeMn melt with CO2-O2 mixture is worth studying. The results obtained in Section 3.1.3 show that the target of decarburization can be effectively achieved when the ratio of CO2 in the mixture is 25%; hence, the influence of CO2 on the decarburization kinetics of HCFeMn melt was analyzed under this situation. Figure 12 shows the change in C content and its polynomial fitting curve when blowing 25%CO2 + 75%O2 (Experiment 4), as well as pure O2 (Experiment 1) gases, respectively.
It can be seen from Figure 12 that, as the blowing process continues, the C content in the melt decreases gradually in both experiments. However, compared with decarburization of HCFeMn using pure O2, the rate of C content decrease is slower when blowing 25%CO2 + 75%O2; in addition, the turning point that marks the transition into the downward trend appears comparatively later (Figure 13a). The variation in decarburization rate as a function of time was determined, and is presented in Figure 13a, on the basis of the derivative of the curves representing variation in C content presented in Figure 12b. Meanwhile, the curve for change in decarburization rate as a function of the C content in the melt was generated, and is shown in Figure 13b.
As can be seen from Figure 13a, the decarburization rate decreases at the beginning of the experiment when the CO2-O2 gas is applied. Then, it increases between 10 and 40 min, before decreasing rapidly after reaching its highest point. Meanwhile, the decarburization rate first increases and then decreases when pure oxygen is blown. According to Figure 13b, the decarburization rate when blowing 25%CO2 + 75%O2 is always lower than that when blowing pure O2 at the same C content. There is little difference in carbon content when the decarburization rate starts to decline under the two conditions, but the slope in the deceleration stage of the decarburization rate when blowing pure O2 is larger than that with mixed gas.
It can also be concluded from Figure 13 that the decarburization of HCFeMn with CO2-O2 mixture can be divided into three stages, as distinct from the two stages of pure O2. The range of C content from 6.0 wt% to 5.5 wt% is the first stage, during which the decarburization rate decreases with decreasing carbon content. In the second stage, the carbon content decreases from 5.5 wt% to 3.0 wt%, and the decarburization rate increases with decreasing C content. The reaction speed is controlled by the chemical reaction between the C in the melt and the CO2-O2 mixer gas at the interface. The period with C content lower than 3.0 wt% is regarded as the third stage, during which the decarburization rate decreases with decreasing carbon content. The mass transfer rate of carbon from the melt to the reaction interface controls the whole reaction speed of decarburization. As for the kinetics of the decarburization of HCFeMn when blowing CO2-O2 during the first stage, the mechanism of rate limitation for the decrease in decarburization rate is not clear, and may arise from complex conditions, such as the decomposited reaction of CO2, the influence of CO2 on the activity of O, the variation in temperature in the melt, etc.
The rate change during the second and third stages when blowing CO2-O2 mixture is the same as during the first and second stages of the refining process with pure O2, with the decarburization rate being controlled firstly by the chemical reaction at the interface, before gradually transitioning to being controlled by the mass transfer of the carbon in the melt. However, due to the complexity of the reaction mechanism when blowing mixed gas in thecurrent system, the rate equation for its decarburization was difficult to obtain in the current investigation, and the specific impact mechanism still needs further study.

4. Conclusions

The effects of CO2 on decarburization and manganese preservation during the refining process of HCFeMn melt were studied using CO2-O2 mixtures of different proportions. On the basis of two different hypotheses, the kinetics mechanism of decarburization with pure O2 was explored; meanwhile, the effect of CO2-O2 mixture on the decarburization kinetics was also analyzed. The following primary conclusions were obtained:
  • It is feasible to introduce CO2 as a partial oxidant for decarburizing HCFeMn. The manganese yield can be increased by introducing a certain amount of CO2 into O2 as the react gas. In the current study, the optimal proportion of CO2 in the mixed gas was found to be 25%.
  • Two hypotheses were proposed to analyze the kinetics of decarburization rate in the process of blowing pure O2. Hypothesis 1 holds that the decarburization is a one-stage process and is controlled by the interface reaction between C in the melt and O2. In hypothesis 2, the decarburization process can be divided into two stages, where the speed of the first stage is controlled by the interface reaction while the reaction rate during the second stage is controlled by the mass transfer of carbon.
  • In hypothesis 1, the expression of the reaction rate constant for the decarburization process when blowing pure O2 is lnk1 = 8.82196 – 22750.56534/T. The introduction of CO2 to O2 has no essential effect on the kinetics mechanism of decarburization.
  • According to hypothesis 2, the expression of the reaction rate constant for the decarburization process when blowing pure O2 during the first stage is lnk 1   =   5 . 44588     17061 . 64843 / T , and this expression of K1 is more accurate than that found on the basis of hypothesis 1. The second stage’s reaction rate constant expression is   K   =   0 . 09618   min 1 . In contrast, the decarburization of HCFeMn with CO2-O2 mixed gas can preliminarily be divided into three stages on the basis of the results in the current study, as distinct from the two stages found when blowing pure O2. However, the details and precision of these conclusions require further study.

Author Contributions

Methodology, C.L.; formal analysis, Y.H.; writing—original draft preparation, Y.H. and C.L.; writing—review and editing, Y.H. and H.W.; supervision, H.W. All authors have read and agreed to the published version of the manuscript.

Funding

This research was funded by Fundamental Research Funds for The Central Universities grant number (FRF-IDRY-20-029) and Chinese Academy of Science partial financial support through the Transfer and commercialization of scientific and technological achievements (Grant No.2020109).

Informed Consent Statement

Not applicable.

Data Availability Statement

Not applicable.

Acknowledgments

The authors are thankful for the partial financial support from “Fundamental Research Funds for The Central Universities” through project No. FRF-IDRY-20-029. Chinese Academy of Science is acknowledged for its partial financial support through the “Transfer and commercialization of scientific and technological achievements” project (No.2020109).

Conflicts of Interest

The authors declare no conflict of interest.

References

  1. Steenkamp, J.D.; Basson, J. The manganese ferroalloys industry in southern Africa. J. S. Afr. I. Min. Met. 2012, 113, 667–676. [Google Scholar]
  2. Montoya, A.; Sevilla, A. Refining manganese alloys by bottom blowing. Transactions 1991, 18, 233–239. [Google Scholar]
  3. You, B.D.; Park, K.Y.; Pak, J.J.; Han, J.W. Oxygen refining of molten high-carbon ferromanganese. Met. Mater. Int. 1999, 5, 395–399. [Google Scholar]
  4. Nell, J.; Nolet, L. Development of a dynamic model for a manganese oxygen refining (MOR) converter. In Proceedings of the 12th International Ferroalloys Congress: Sustainable Future, Helsinki, Finland, 6–9 June 2010. [Google Scholar]
  5. Schurmann, E.; Ender, A.; Hoffken, E.; Litterscheidt, H.; Schutz, C.H. Ferromanganese affine production by the TBM process. Stahl Eisen 1993, 113, 77–82. [Google Scholar]
  6. Zhang, K.T. Production and refining of ferromanganese by carbon ferromanganese oxygen blowing (MOR). Jiangxi Met. 1982, 2, 116–119. [Google Scholar]
  7. Barcza, N.A.; O’Shaughnessy, D.P. Optimum Slag–Alloy relationships for the production of medium- to low-carbon ferromanganese. Can. Met. Q. 1981, 20, 285–294. [Google Scholar] [CrossRef]
  8. Zhang, H.; Jia, Z.; Luo, D. Making medium-low carbon ferro-manganese in basic oxygen furnace. Iron Steel 1981, 5, 15–20. [Google Scholar]
  9. Li, N.; Zhang, H.; Luo, D. The smelting of medium carbon ferromanoanese by BF-BOF process. Iron Steel 1983, 8, 24–27. [Google Scholar]
  10. Yu, H.C.; Wang, H.J.; Chu, S.J.; XU, Z. Evaluation on heat and materials balance of CO2 involved in converter process for M-LCFeCr production. In Proceedings of the 14th Unternational Ferroalloys Congress, Kiev, Ukraine, 1–4 June 2015. [Google Scholar]
  11. You, B.D.; Lee, B.W.; Pak, J.J. Manganese loss during the oxygen refining of high-carbon ferromanganese melts. Met. Mater. Int. 1999, 5, 497. [Google Scholar] [CrossRef]
  12. Lee, Y.E.; Kolbeinsen, L. Kinetics of oxygen refining process for ferromanganese alloys. ISIJ Int. 2005, 45, 1282–1290. [Google Scholar] [CrossRef] [Green Version]
  13. Wu, W.H.; Zhu, R.; Li, Z.Z.; Wang, C.Y.; Wei, G.S. CO2 conversion and decarburization kinetics of CO2 gas and liquid Fe–C alloy at 1873K. J. Iron Steel Res. Int. 2021, 29, 425–433. [Google Scholar] [CrossRef]
  14. Yin, Z.J.; Zhu, R.; Yi, C.; Chen, B.Y.; Wang, C.R.; Ke, J.X. Fundamental research on controlling BOF dust by COMI steelmaking process. Iron Steel 2009, 44, 92–94. [Google Scholar]
  15. Ning, X.J.; Yin, Z.J.; Yi, C.; Zhu, R.; Dong, K. Experimental study on reducing steel dust with CO2. Steelmaking 2009, 25, 32–34. [Google Scholar]
  16. Liu, H.; Liu, J.; Johannes, S.; Penz, F.M.; Sun, L.; Zhang, R.; An, Z. Effect of CO2 and O2 mixed injection on the decarburization and manganese retention in High-Mn Twinning-Induced Plasticity Steels. Met. Mater. Trans. B 2020, 51, 756–762. [Google Scholar] [CrossRef]
  17. Bi, X.R.; Zhu, R.; Liu, R.Z.; Lv, M.; Yi, C. Fundamental research on CO2 and O2 mixed injection stainless steelmaking process. Steelmaking 2012, 28, 67–70. [Google Scholar]
  18. Xie, M.Y.; Xu, H.; Dong, X.B.; Liu, J.H. Thermodynamic analysis of decarburization and hold manganese by mixed blowing carbon dioxide in high manganese stainless steel. Ferroalloy 2021, 52, 16–18. [Google Scholar]
Figure 1. Schematic diagram of the experimental apparatus (1. CO2 gas bottle; 2. O2 gas bottle; 3. pressure reducing valve; 4. flowmeter; 5. gas tube; 6. top lance; 7. dust hood; 8. induction furnace; 9. MgO crucible; 10. HCFeMn melt).
Metals 12 00682 g001
Figure 2. Variations of carbon and manganese contents in melt with time by blowing O2 in different flow rates: (a) carbon; (b) manganese.
Metals 12 00682 g002
Figure 3. Variation in carbon content with time by blowing different CO2-O2 mixtures.
Metals 12 00682 g003
Figure 4. Variation in manganese content with time when blowing different CO2-O2 mixtures.
Metals 12 00682 g004
Figure 5. Variation in manganese content with change in carbon content when blowing different CO2-O2 mixtures.
Metals 12 00682 g005
Figure 6. Curve fitting for the variation in carbon content when blowing different CO2-O2 mixtures.
Metals 12 00682 g006
Figure 7. Relationship between rate constant lnk1 and temperature (1/T) × 104 at the reaction interface.
Metals 12 00682 g007
Figure 8. Variation in carbon content with time in melt when blowing pure O2: (a) variation in C content in melt; (b) fitted curve of variation in C content in melt.
Metals 12 00682 g008
Figure 9. Variation in decarburization rate when blowing pure O2: (a) variation in decarburization rate with time; (b) variation in decarburization rate with C content.
Metals 12 00682 g009
Figure 10. Variation in reaction rate constant k1 with increasing (1/T) × 104 in the first stage of decarburization when blowing pure O2.
Metals 12 00682 g010
Figure 11. Fitting of mass transfer coefficients of decarburization for the second stage when blowing pure O2.
Metals 12 00682 g011
Figure 12. Variation in carbon content in melt when blowing 25%CO2 + 75%O2 and pure %O2: (a) variation in C content with time; (b) fitted curve of variation in C content with time.
Metals 12 00682 g012
Figure 13. Variation in decarburization rate when blowing 25%CO2 + 75%O2 and 100%O2: (a) variation in decarburization rate with time; (b) variation in decarburization rate with C content in the melt.
Metals 12 00682 g013
Table 1. Main compositions of HCFeMn and pig iron used in the experiments (wt%).
MnSiPSC
HCFeMn75.001.000.140.016.40
Pig iron----4.00
Table 2. The scheme for preliminary experiments.
No.GasFlow Rate/L × min−1Time/minWeight of HCFeMn/kgWeight of Pig Iron/kgWeight of Melt/kg
1O26704.001.005.00
2O212704.001.005.00
3O218704.001.005.00
Table 3. Experimental scheme of formal experiments.
No.Time/minRatio of CO2Ratio of O2Weight of HCFeMn/kgWeight of Pig Iron/kgWeight of HCFeMn Melt/kg
46025%75%4.001.005.00
56050%50%4.001.005.00
66075%25%4.001.005.00
760100%0%4.001.005.00
Table 4. The manganese yield of formal experiments.
No.Ratio of CO2Weight of Melt at Beginning/kgWeight of Melt at Endpoint/kgContent of Mn at Beginning/wt%Content of Mn at Endpoint/wt%Yield of Mn
105.002.7859.5260.1556%
425%5.003.8163.0259.4272%
550%5.004.0361.0258.1976%
675%5.004.1654.8448.5774%
7100%5.004.4864.7461.9986%
Table 5. Degree of manganese loss (ΔMn) and decarburization (ΔC) in the melt, as well as A (ΔMn/ΔC), at the start and endpoint of the different experiments.
Number of Experiment14567
Ratio of CO2025%50%75%100%
Weight of melt at beginning/kg5.005.005.005.005.00
Weight of melt at endpoint/kg2.783.814.034.164.48
Content of Mn at beginning/wt%59.5263.0261.0254.8464.74
Content of Mn at endpoint/wt%60.1559.4258.1948.5761.99
ΔMn44%28%24%26%14%
Content of C at beginning/wt%5.975.865.694.756.16
Content of C at endpoint/wt%0.331.822.471.964.18
ΔC94%76%65%65%39%
A(ΔMn/ΔC)0.470.370.370.400.36
Table 6. Fitting equations for the carbon content variation with time by blowing different CO2-O2 mixtures.
GasEquationPrecisionDecarburization Rate/wt%/min
100%O2[%C] =−0.10064t + 6.039290.991950.10064
75%O2 + 25%CO2[%C] =−0.07179t + 6.175000.977790.07179
50%O2 + 50%CO2[%C] =−0.05282t + 5.961790.950960.05282
25%O2 + 75%CO2[%C] =−0.04579t + 4.629290.983110.04579
100%CO2[%C] =−0.03282t + 6.373210.932890.03282
Table 7. Comparison between results of linear superposition and results of fitting.
Proportion of CO2Component of O2 RateComponent of CO2 RateResults of SuperpositionResults of Fitting
25%0.075480.0082050.0836850.07179
50%0.050320.016410.066730.05282
75%0.025160.0246150.0497750.04579
Table 8. The C content in the melt at different times and the calculated rate constants k1 and lnk1.
Time/min0102030405060
C content/wt%5.975.194.212.851.780.880.26
k10.01690.01940.02390.03530.05650.11430.3871
lnk1−0.408−3.942−3.734−3.344−2.874−2.169−0.949
Publisher’s Note: MDPI stays neutral with regard to jurisdictional claims in published maps and institutional affiliations.

