Article

Research on High-Temperature Compressive Properties of Ti–10V–1Fe–3Al Alloy

1
School of Energy and Power Engineering, Changsha University of Science and Technology, Changsha 410114, China
2
Qingyuan Yuebo Technology Co., Ltd., Qingyuan 511500, China
*
Author to whom correspondence should be addressed.
Metals 2022, 12(3), 526; https://doi.org/10.3390/met12030526
Submission received: 30 January 2022 / Revised: 15 March 2022 / Accepted: 18 March 2022 / Published: 21 March 2022

Abstract

:
To investigate the thermal deformation behavior of Ti–10V–2Cr–3Al titanium alloy, the hot compression experiments were carried out via a strain rate of 0.1–0.001 s−1 and deformation temperature of 730~880 °C. The results showed that the rheological stress decreases when the deformation temperature increases or strain rate decreases. Due to the deformation conditions, some flow curves exhibited significant discontinuous yielding and flow softening. Flow softening in the α+β phase region was dominated by dynamic recrystallization (DRX), while in the β phase region, it was centered on dynamic recovery (DRV). A high-temperature constitutive equation, with good predictive power, was established.

1. Introduction

Titanium alloys have excellent properties, such as low density and high corrosion resistance. So, its application has ranged from a single military field to other fields, such as medical and industrial fields [1,2]. The properties of alloys can be optimized by reasonably adjusting their chemical composition, cooling rate, and hot deformation conditions (for example, deformation temperature and strain rate, etc.) [3,4,5,6]. T. Seshacharyul et al. [7] and A. Momeni et al. [8] have studied the microstructure evolution of commercial Ti–6Al–4V titanium alloy, under different hot deformation conditions, and confirmed that the hot deformation conditions have an effect on Ti–6Al–4V alloy.
During the hot working process of titanium alloy, its deformation mechanism is complicated. The phenomenological constitutive model equation can greatly reflect the work hardening and flow softening mechanism. When the constitutive equation of the material is obtained, a simulation software can be used to predict the flow stress of the material during high-temperature deformation, which saves a lot of cost. Some scholars [9,10,11] have conducted research on different titanium alloys and constructed constitutive equations, in line with titanium alloys. The feasibility of using constitutive equations to predict rheological behavior under different thermal deformation conditions has been proved. Sheikhali et al. [12] established the constitutive equation for the rheological behavior of the SP700 alloy at high-temperature via the Arrhenius equation and modified it. Yang [13] systematically expounded the work for hardening and flow softening effects of BT25y titanium alloy at high-temperature by constructing a hyperbolic sine equation. These studies have found a basic law: the rheological stress decreases with the deformation temperature increasing or strain rate decreasing [9,10,11,12,13,14,15,16]. The research revealed that the flow softening effect of α+β phase region is stronger than that of the β phase region, due to dynamic recrystallization and recovery [3,9,10,11,12,13,14,15,16,17,18].
In this paper, a new metastable Ti–10V–1Fe–3Al alloy was investigated as a candidate alloy with great potential for industrial applications. The alloy can be compared to the Ti–10V–2Fe–3Al alloy, due to the small difference in the alloying elements. Previous studies have shown that this alloy has stress-induced martensitic transformation under specific conditions and strong adjustability of mechanical properties. It is a titanium alloy with great application prospects [19]. The purpose is to investigate the relationship between different deformation temperature, strain rate, stress, and strain during high-temperature compression process of the alloy and study the rheological behavior and microstructure changes of sub-stable Ti–10V–1Fe–3Al alloys in high-temperature environments. The constitutive model of the alloy is constructed under a high-temperature environment.

2. Materials and Methods

In order to determine the transition temperature of the Ti–10V–1Fe–3Al alloy, Li et al. [3] studied the microstructure of the alloy at different temperatures. The results showed that the β phase transition temperature of the alloy is about 810 °C. The alloy was provided by the Institute of metals, Chinese Academy of Sciences (Shenyang). Each ingot weighs about 5 kg. Table 1 shows the chemical composition. The [Mo]eq value is 6.5, which indicates that the alloy is metastable. The initial microstructure is shown in Figure 1.
Before the experiment, cylindrical samples with a diameter of 5 mm and length of 10 mm were processed by electron discharge machined (EDM) technology. In order to reduce the friction between the anvil and sample, a molybdenum disc with a diameter of 8 mm and thickness of 0.1 mm was welded on the end surface of the specimen. To measure and control the actual temperature and record the change of temperature field with time, the S-type thermocouple was welded on the sample surface and molybdenum disk surface.
In the experiment, cylindrical samples were subjected to hot compression test by using TA DIL805D dilatometer in vacuum. The deformation temperature ranged from 730 to 880 °C, and the strain rate ranged from 0.1 to 0.001 s−1. Firstly, heat the sample to the target temperature, at a rate of 10 °C/s. After maintaining the target temperature for 3 min, the samples started compression, until the deformation of the sample reached 50%. Deformed samples were quenched with argon gas immediately after high-temperature compression. The deformed specimen was cut axially, parallel to the compression direction. It was embedded in cold setting resin.
After the experiment, according to the standard metallographic preparation method, samples were polished and washed by ultrasonic cleaning. The samples were corroded for 15 s by Kroll reagent (3 mL HF + 6 mL HNO3 + 100 mL H2O) and then cleaned them. The microstructures were determined by optical microscopy and high-resolution JEOL scanning electron microscopy.

3. Results and Discussion

3.1. Flow Stress Analysis

Figure 2 shows true stress-true strain curves of Ti–10V–1Fe–3Al alloy at deformation temperatures of 730, 790, 820, and 880 °C and strain rates of 0.1–0.001 s−1. In the initial stage of the experiment, the work hardening effect was much stronger than the flow softening effect. With the increase of strain, the energy stored in the microstructure was released, and the flow softening effect was strengthened. Under the action of softening mechanisms, such as dynamic recrystallization and recovery [20], the work of hardening and flow softening mechanisms reached a dynamic balance. Therefore, the general properties of the flow profile were significantly influenced by the temperature and strain rate under all deformation conditions, which divided the stress-strain diagram into a yield point phenomenon region and steady-state flow region [3,13].
Due to the increase of material deformation, dislocations gradually accumulate at the boundary. When the critical value was reached, the effect of the softening mechanism, such as dynamic recovery, was greater than that of work hardening. It leads to the sudden decrease of flow stress and release of dislocations [3]. This is the reason why discontinuous yielding occurs in the yield point region. In the steady-state region, the flow stress decreases with the increase of deformation temperature and decrease of strain rate.

3.2. Constitutive Equation

During the process of high-temperature deformation, the relationship between stress (σ), deformation temperature (T), and strain rate (έ) can be described by the Arrhenius constitutive equation [21,22,23,24,25,26].
ε ˙ = A · σ n 1 · e x p ( Q R T ) α σ < 0.8  
ε ˙ = A · e x p ( b σ ) · e x p ( Q R T ) α σ > 1.2
ε ˙ = A · [ s i n h ( α σ ) ] n · e x p ( Q R T )
A, α, b, and n1 are material constants. Q is deformation activation energy (kJ/mol), and R is the gas constant (8.314 J/(mol·K)). T is the absolute temperature (K); n1 is the stress exponent, which is related to the stain rate sensitivity exponent.
By taking the logarithm of Equations (1)–(3), we get:
l n ε ˙ = l n A + n 1 · l n σ Q R T α σ < 0.8  
l n ε ˙ = l n A + b σ Q R T α σ > 1.2  
l n ε ˙ = l n A + n · l n ( s i n h ( α σ ) ) Q R T
The partial derivatives of σ and lnσ are obtained, respectively:
b = ( l n ε ˙ ) σ  
n 1 = ( l n ε ˙ ) ( l n σ )  
α = b n 1
Generally, when ασ < 0.8, the power law equation is commonly used, and the strain rate is lower. On the contrary, as the strain rate is high (ασ > 1.2), the exponential equation is commonly used. The hyperbolic sine equation is universally used. When ε is selected as 0.1, Figure 3a,b is obtained, and the α value can be calculated.
In Table 2, as the deformation temperature increases, the α value also increases. According to the Equations (1)–(3), it is found that the exponential equation can be used when the strain rate is higher than 0.05 s−1. On the contrary, the hyperbolic sine equation is adopted.

3.3. Exponential Equation and Correction

It can be known from last section that, when the strain rate is higher than 0.05 s−1, the exponential equation can be used. When the strain is 0.1, the deformation activation energy, Q, is calculated by the following formula:
Q = b · S · R = ( ( l n ε ˙ ) σ ) · ( σ ( 1 T ) ) · R
Q is the deformation activation energy, b is the material constant, S is the slope of σ-T−1 line, as shown in Figure 4a, and R is the gas constant.
After calculating the b and Q values, the corresponding lnA values can be calculated by using the stress and Equation (5), under different high-temperature deformation conditions. Table 3 shows the values of the parameters for strain 0.1.
In general, during high-temperature plastic deformation, the value of deformation activation energy and microstructure can determine the deformation mechanism [14]. The deformation activation energy Q in α+β phase region is 789.836 kJ/mol, much higher than the α-Ti (169 kJ/mol) [13] and β–Ti diffusion energy (153 kJ/mol) [27]. It indicates that the softening mechanism may be dominated by dynamic recrystallization in the α+β phase region. In contrast to α-phase of HCP structure, the β phase of the BCC structure has a stronger deformation feasibility and less activation energy. This is the result of the excellent active slip system and high diffusion coefficient [28]. In the β phase region, the Q value is 189.6516 kJ/mol. It indicates that dynamic recovery plays an important role in the softening mechanism. When the value of Q is same as the diffusion activation energy, the thermal deformation is controlled by the diffusion-related process [28]. The Q value in that single-phase region is very close to that in the β–Ti phase region (153 kJ/mol). Deformation mechanism may be caused by diffusion recovery.
Substituting the calculated parameters into Equation (5), for the α+β phase region, the Equation (11) is obtained; for the β phase region, the Equation (12) is obtained.
l n ε ˙ = 81.7769 + 0.060 σ 789836 / 8.314 T  
l n ε ˙ = 12.0051 + 0.066 σ 189652 / 8.314 T  
The predicted data can be obtained through the calculation of Equations (11) and (12). The experimental and predicted data fit well. The constitutive equation has good prediction ability, and it can reasonably conjecture the flow stress.
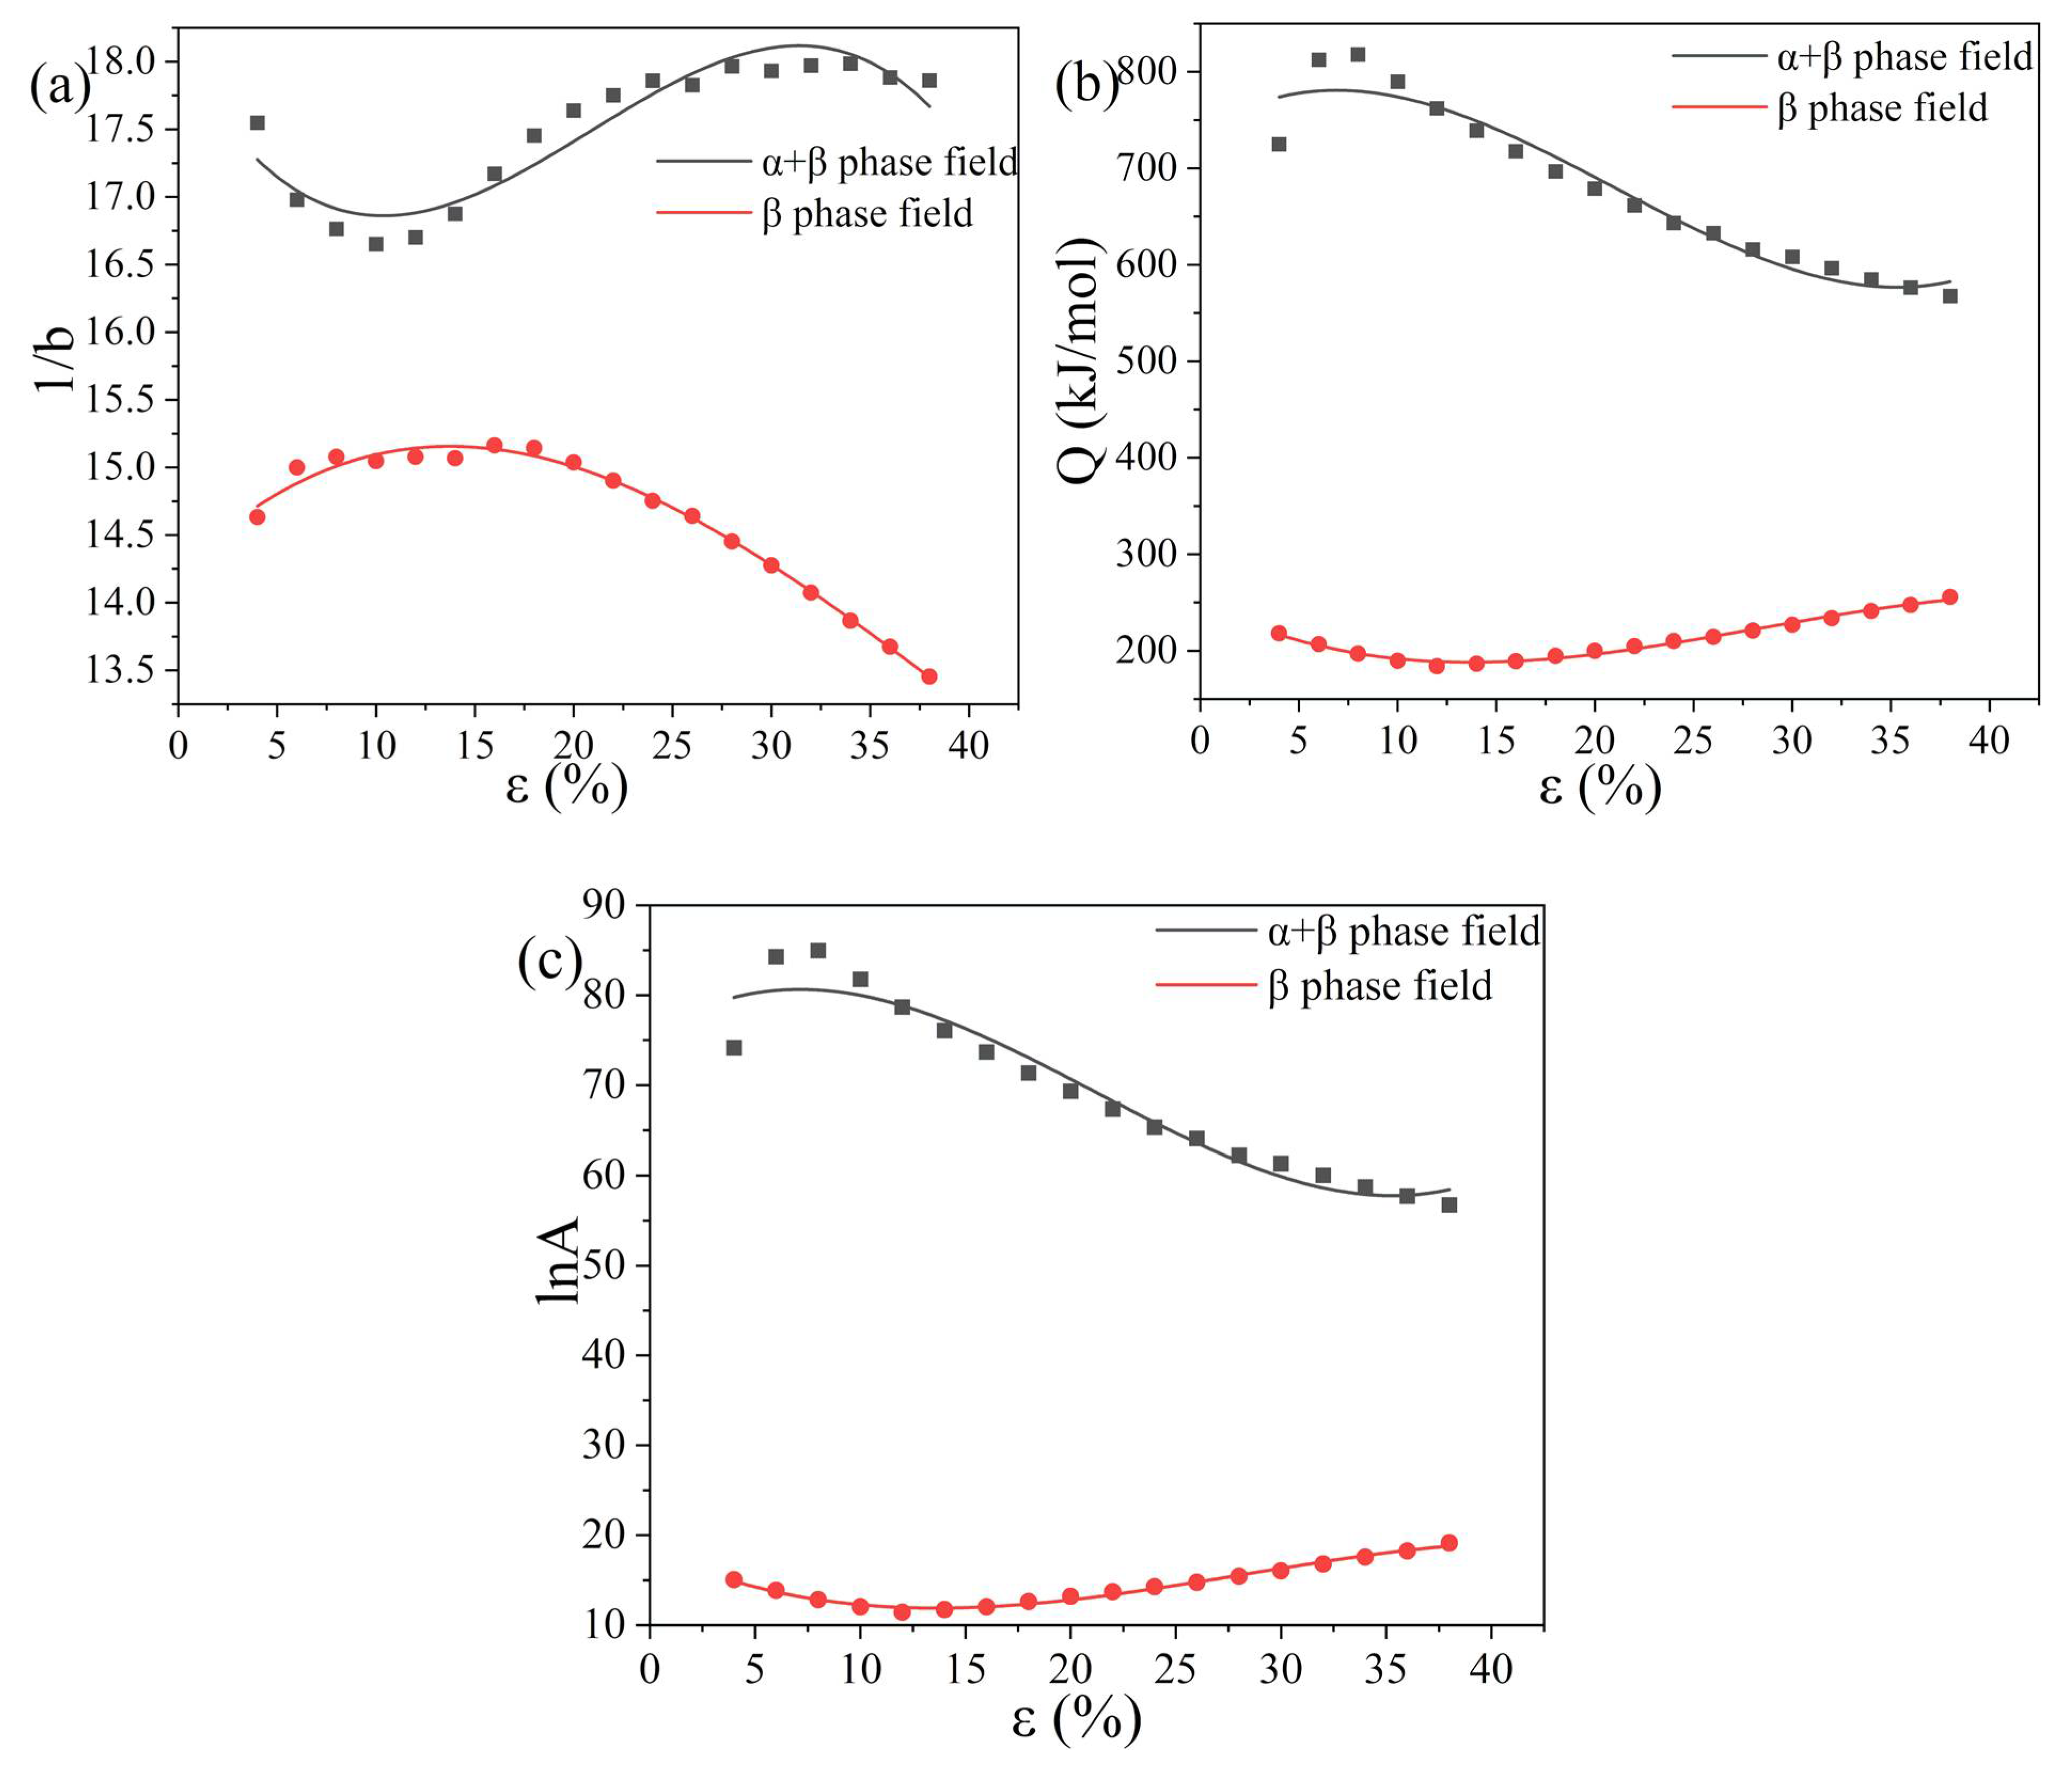
By the same method, the constants (b, Q, and lnA) are calculated in different strains. The range of experimental strains is 0–0.38. The interval strain is set at 0.02, and the starting value is set at 0.04.
When thermal deformation begins to occur, the softening mechanism of the microstructure gradually increases. However, it cannot be balanced with the process hardening effect. The increase of crystal defects, such as dislocations and vacancies, causes lattice distortion. A large amount of deformation activation energy is stored, the Q value rises rapidly. When the flow stress reaches the critical value, the dynamic recrystallization nucleates rapidly, and the deformation activation energy is consumed greatly. As the growth rate of the volume fraction of nucleation rate decreases, the Q value begins to decrease.
When the strain is 0.07, the Q value begins to decrease, as shown in Figure 5b. It can be seen that, in the α+β phase region, discontinuous yield occurs. Dislocation accumulation [29] or locking leads to energy increase, which promotes a large number of nucleation and growth of dynamic recrystallization. The Q value is greater than the α-Ti diffusion energy (169 kJ/mol). The deformation activation energy required by dynamic recrystallization is ensured. When the strain reaches 0.25, the dynamic recrystallization is basically complete, and quantities of tiny, recrystallized grains are formed.
Dynamic recrystallization occurs more easily because the deformation temperature in the β phase region is higher than the transition temperature. Therefore, when the strain reaches 0.12, the dynamic recrystallization is completed. After nucleation, only a part of deformation activation energy is needed for grain growth. However, as the thermal deformation continues, the Q value gradually increases. The softening mechanism may be dominated by dynamic recovery. In the two-phase regions, the change of lnA value with strain is basically consistent with the Q value.
In fact, in addition to strain rate and deformation temperature, strain also has important influence on flow stress [30,31]. In order to get a more accurate equation, a third-order polynomial fitting is used. The results are shown in Table 4 and Table 5.
b = B 3 ε 3 + B 2 ε 2 + B 1 ε + B 0
Q = Q 3 ε 3 + Q 2 ε 2 + Q 1 ε + Q 0
l n A = A 3 ε 3 + A 2 ε 2 + A 1 ε + A 0

3.4. Hyperbolic Sine Equation and Correction

The hyperbolic sine equation is used for strain rates of 0.01, 0.005, and 0.001 s−1. In Table 2, when the strain was chosen as 0.1, by linear fitting (as shown in the Figure 6), the values of stress index n was 3.726 and 2.347.
The deformation activation energy Q can be calculated by Equation (17).
n = l n ε ˙ [ l n ( s i n h ( α σ ) ) ]  
Q = n · S · R
Q is the deformation activation energy, n is the material constant, S is the slope of ln(sinh(ασ))-T−1 (as shown in Figure 7), and R is the gas constant.
After calculating the n, α, and Q values, the corresponding lnA values can be calculated by using the stress and Equation (6). Table 6 shows the values of the parameters for strain 0.1.
In the α+β phase region, the Q value decreases with the decrease of the strain rate. However, the deformation activation energy has less change in the β phase region.
Substituting the calculated parameters into Equation (6), for the α+β phase region, Equation (18) is obtained; for the β phase region, Equation (19) is obtained.
l n ε ˙ = 37.075 + 3.726 . l n ( s i n h ( 0.012 σ ) ) 359857 / 8.314 T
l n ε ˙ = 14.854 + 2.347 . l n ( s i n h ( 0.021 σ ) ) 192420 / 8.314 T
The constants (α, n, Q, and lnA) in the hyperbolic sine equation are calculated by the same method. The range of experimental strain was 0–0.38. Therefore, the interval strain was set at 0.02, and the starting value was set at 0.04.
In Figure 8a, when the strain rose, the α value showed an overall upward trend. The α value differed widely in the two-phase regions. As shown in Figure 8b, the value of n increased and then decreased, and the peak value was about 4 in the α+β phase region. At the beginning of thermal deformation, the value of n rose rapidly, due to grain boundary sliding. With the increase of strain, the dislocation viscous slip mechanism gradually occupied a dominant position. In the β phase area, the value of n is always between 2.25 and 2.45. The grain boundary movement and dislocation sticking-slip mechanism played a significant role in the microstructure [32,33].
In Figure 8c, in the α+β phase region, work hardening plays a more important role than softening mechanisms when strain begins to occur, which makes the Q value rise rapidly. After reaching the peak value, the softening mechanism gradually dominates. As the strain increased, the dynamic recrystallization nucleated rapidly, and the softening mechanism became dominant. The strain reached 0.35, and the dynamic recrystallization was basically completed. However, in the β phase region, the smaller variation of the Q value indicates that the strain rate was less influential on the microstructure, which was close to the self-diffusion energy of the α-Ti phase (169 kJ/mol), thus ensuring the deformation activation energy needed for dynamic recrystallization. The softening mechanism may be dominated by dynamic recovery, and the α phase may self-diffuse. In the two-phase regions, the change of lnA values, with strain, was basically consistent with the Q value.
The strain rate sensitivity coefficient m is related to the strain rate. It can well-reflect whether the material is superplastic by m = 1/n [34]. In Figure 8e, the difference in m-values between the two different phase regions is obvious. The fluctuation of the m-value is larger when the deformation temperature is lower than the transition temperature. However, as the deformation temperature increased, the mechanisms associated with dislocation annihilation drove microstructural evolution [35]. The flow stress was gradually stable, and the change of the m value was small.
When the third-order polynomial fitting was used, the relationship between the parameters and strain is shown in Equations (20)–(23). The results are shown in Table 7 and Table 8.
1 n = N 3 ε 3 + N 2 ε 2 + N 1 ε + N 0
Q = Q 3 ε 3 + Q 2 ε 2 + Q 1 ε + Q 0
l n A = A 3 ε 3 + A 2 ε 2 + A 1 ε + A 0
α = X 3 ε 3 + X 2 ε 2 + X 1 ε + X 0
By constructing a third-order polynomial equation, the material constants at different strains can be calculated. After the material parameter is obtained, the rheological stress of different conditions can be predicted by Zener–Hollomont parameter equation [28,36]:
Z = ε ˙ · e x p ( Q R T ) = A · [ s i n h ( α σ ) ] n
Therefore
σ = 1 α l n { ( Z A ) 1 n + [ ( Z A ) 2 n + 1 ] 1 2 }

3.5. Verification for Constitutive Equation

The accuracy of the constitutive equation is verified by comparing the experimental flow stress and true predicted flow stresses. Figure 9 shows the predicted and experimental flow stress, when the deformation temperature is 730–880 °C and in the range of 0.1–0.001 s−1. In general, the experimental flow stress is consistent with the predicted flow stress, which indicates that the modified constitutive equation is feasible. While the strain rate is 0.01 or 0.005 s−1, the experimental flow stress is higher than the predicted flow stress in the α+β phase region. The reasons may be caused by experimental errors, rounding errors in the calculation process, and inaccurate use of formulas.
To determine whether the predicted flow stresses are reasonable, the standard statistical parameters, such as the correlation coefficient (R) and average absolute relative error (AARE), are used. Equations are shown in Equations (26) and (27) [23,24,25,26]:
R = i = 1 N ( x i x ¯ ) ( y i y ¯ ) i = 1 N ( x i x ¯ ) 2 i = 1 N ( y i y ¯ ) 2  
A A R E ( % ) = 1 N i = 1 N | x i y i x i | × 100 %  
where xi is the flow stress in experimental, yi is the predicted flow stress obtained in the modified constitutive equation, x is the average values of flow stress in experimental, y ¯ is predicted flow stress, N is total number of collected stress, and R is a statistical index, which reflects the correlation quality between different variables. Additionally, AARE is the average absolute value of related error, which is an impartial statistical index for testing the predictability of the equation. The results are confirmed in Figure 9.
Figure 10 reflects the fit of the experimental flow stress to the predicted flow stress. The values of R2 (R) and AARE were 0.979 (98.94%) and 6.883% by Equations (26) and (27). This indicates that the two flow stresses had good coherence. It shows that the modified constitutive equation had good prediction ability.

3.6. Microstructure Analysis

As shown in Figure 11, the microstructure is shown at different deformation temperatures at 0.01 s−1. As the temperature increased, the volume fraction of the α phase decreases gradually. The secondary α phase, formed at the α/β grain boundary, was dense, while it was relatively small in other areas of the β phase. It shows that dynamic recrystallization starts from the grain boundary and then nucleates in other areas of the β phase. With the increase of temperature, the force for the nucleation and growth of dynamic recrystallization drove more strongly, especially when it was higher than the transition temperature of the Ti–10V–1Fe–3Al alloy, and the grains have sufficient time to grow. In Figure 11c,d, the high deformation temperature played a significant role in the growth of recrystallization, and the recrystallized grains were needle-like. When the deformation temperatures were 730 and 790 °C only fine or short rod-like recrystallized grains existed. This is consistent with the changing trend of deformation activation energy at different temperatures.

4. Conclusions

By revealing the flow behavior of Ti–10V–1Fe–3Al alloy under a deformation temperature of 730–880 °C and strain rate of 0.1–0.001 s−1, the following conclusions are drawn:
(1) Under the condition of a constant deformation temperature, the flow stress increased, following the increase of the strain rate; under the condition of a fixed strain rate, with the rise of the deformation temperature, the stress decreased.
(2) The modified constitutive equation can well-reflect the effect of the deformation temperature, strain rate, and strain on the flow stress. The values of R2 and AARE were 0.979 and 6.883%, which indicates that the constitutive equation has good prediction ability for the Ti–10V–1Fe–3Al titanium alloy at high temperature.
(3) With the increase of deformation temperature, especially in the β phase region, the microstructure shows superplasticity. Due to the deformation temperature, the softening mechanism may be dominated by dynamic recovery. In the α+β phase region, the softening mechanism may be dominated by dynamic recrystallization, which is strongly influenced by strain and strain rate.

Author Contributions

Conceptualization, C.L.; methodology, Z.D.; software, X.Z.; writing—original draft preparation, C.H.; writing—review and editing, C.L. All authors have read and agreed to the published version of the manuscript.

Funding

This research was funded by the National Natural Science Foundation of China (grant no. 51775055, 51975061), Natural Science Foundation of Hunan Province (grant no. 2019JJ40300), and Research Foundation of Education Bureau of Hunan Province (grant no. 19B033).

Institutional Review Board Statement

Not applicable.

Informed Consent Statement

Not applicable.

Data Availability Statement

The data used to support the findings of this study were included within the article. Should further data or information be required, these are available from the corresponding author upon request.

Conflicts of Interest

The authors declare that there are no conflict of interest.

References

  1. Hwang, Y.J.; Hong, S.H.; Kim, Y.S.; Park, H.J.; Jeong, Y.B.; Kim, J.T.; Kim, K.B. Influence of silicon content on microstructure and mechanical properties of Ti-Cr-Si alloys. J. Alloys Compd. 2018, 737, 53–57. [Google Scholar] [CrossRef]
  2. Li, C.; Li, M.; Li, H.; Chen, J.; Xiao, H. Influence of solution treatment on microstructural evolution and mechanical properties of a new titanium alloy. Met. Mater. 2020, 58, 41–48. [Google Scholar] [CrossRef]
  3. Li, C.; Ding, Z.; Van Der Zwaag, S. The Modeling of the Flow Behavior Below and Above the Two-Phase Region for Two Newly Developed Meta-Stable β Titanium Alloys. Adv. Eng. Mater. 2020, 23, 1901552. [Google Scholar] [CrossRef]
  4. Hong, S.H.; Hwang, Y.J.; Park, S.W.; Park, C.H.; Yeom, J.-T.; Park, J.M.; Kim, K.B. Low-cost beta titanium cast alloys with good tensile properties developed with addition of commercial material. J. Alloys Compd. 2019, 793, 271–276. [Google Scholar] [CrossRef]
  5. Liu, B.; Matsumoto, H.; Li, Y.P.; Koizumi, Y.; Liu, Y.; Chiba, A. Dynamic Phase Transformation during Hot-Forging Process of a Powder Metallurgy α+β Titanium Alloy. Mater. Trans. 2012, 53, 1007–1010. [Google Scholar] [CrossRef] [Green Version]
  6. Manshadi, A.D.; Dippenaar, R.J. Strain-induced phase transformation during thermo-mechanical processing of titanium alloys. Mater. Sci. Eng. A 2012, 552, 451–456. [Google Scholar] [CrossRef] [Green Version]
  7. Seshacharyulu, T.; Medeiros, S.; Frazier, W.; Prasad, Y. Microstructural mechanisms during hot working of commercial grade Ti–6Al–4V with lamellar starting structure. Mater. Sci. Eng. A 2002, 325, 112–125. [Google Scholar] [CrossRef]
  8. Momeni, A.; Abbasi, S. Effect of hot working on flow behavior of Ti–6Al–4V alloy in single phase and two phase regions. Mater. Des. 2010, 31, 3599–3604. [Google Scholar] [CrossRef]
  9. Pilehva, F.; Zarei-Hanzaki, A.; Ghambari, M.; Abedi, H. Flow behavior modeling of a Ti–6Al–7Nb biomedical alloy during manufacturing at elevated temperatures. Mater. Des. 2013, 51, 457–465. [Google Scholar] [CrossRef]
  10. Song, H.-W.; Zhang, S.-H.; Cheng, M. Subtransus deformation mechanisms of TC11 titanium alloy with lamellar structure. Trans. Nonferrous Met. Soc. China 2010, 20, 2168–2173. [Google Scholar] [CrossRef]
  11. Jia, W.; Zeng, W.; Zhou, Y.; Liu, J.; Wang, Q. High-temperature deformation behavior of Ti60 titanium alloy. Mater. Sci. Eng. A 2011, 528, 4068–4074. [Google Scholar] [CrossRef]
  12. Sheikhali, A.H.; Morakkabati, M.; Abbasi, S.M. Constitutive Modeling for Hot Working Behavior of SP-700 Titanium Alloy. J. Mater. Eng. Perform. 2019, 28, 6525–6537. [Google Scholar] [CrossRef]
  13. Yang, X.; Guo, H.; Liang, H.; Yao, Z.; Yuan, S. Flow Behavior and Constitutive Equation of Ti-6.5Al-2Sn-4Zr-4Mo-1W-0.2Si Titanium Alloy. J. Mater. Eng. Perform. 2016, 25, 1347–1359. [Google Scholar] [CrossRef]
  14. Jia, B.-H.; Song, W.-D.; Tang, H.-P.; Wang, Z.-H.; Mao, X.-N.; Ning, J.-G. Hot deformation behavior and constitutive model of TC18 alloy during compression. Rare Met. 2014, 33, 383–389. [Google Scholar] [CrossRef]
  15. Quan, G.-Z.; Lv, W.-Q.; Liang, J.-T.; Pu, S.-A.; Luo, G.-C.; Liu, Q. Evaluation of the hot workability corresponding to complex deformation mechanism evolution for Ti–10V–2Fe–3Al alloy in a wide condition range. J. Mater. Process. Technol. 2015, 221, 66–79. [Google Scholar] [CrossRef]
  16. Li, J.; Wang, B.; Huang, H.; Fang, S.; Chen, P.; Shen, J. Unified modelling of the flow behaviour and softening mechanism of a TC6 titanium alloy during hot deformation. J. Alloys Compd. 2018, 748, 1031–1043. [Google Scholar] [CrossRef]
  17. Weiss, I.; Semiatin, S. Thermomechanical processing of alpha titanium alloys—An overview. Mater. Sci. Eng. A 1999, 263, 243–256. [Google Scholar] [CrossRef]
  18. Cui, W.; Jin, Z.; Guo, A.; Zhou, L. High temperature deformation behavior of α+β-type biomedical titanium alloy Ti–6Al–7Nb. Mater. Sci. Eng. A 2009, 499, 252–256. [Google Scholar] [CrossRef]
  19. Li, C.; Li, H.; van der Zwaag, S. Unravelling the abrasion resistance of two novel meta-stable titanium alloys on the basis of multi-pass-dual-indenter tests. Wear 2019, 440–441, 203094. [Google Scholar] [CrossRef]
  20. Fan, J.; Kou, H.; Lai, M.; Tang, B.; Chang, H.; Li, J. Characterization of hot deformation behavior of a new near beta titanium alloy: Ti-7333. Mater. Des. 2013, 49, 945–952. [Google Scholar] [CrossRef]
  21. Wanjara, P.; Jahazi, M.; Monajati, H.; Yue, S.; Immarigeon, J.-P. Hot working behavior of near-α alloy IMI834. Mater. Sci. Eng. A 2005, 396, 50–60. [Google Scholar] [CrossRef]
  22. McQueen, H.; Ryan, N. Constitutive analysis in hot working. Mater. Sci. Eng. A 2002, 322, 43–63. [Google Scholar] [CrossRef]
  23. Quan, G.-Z.; Zou, Z.-Y.; Wang, T.; Liu, B.; Li, J.-C. Modeling the hot deformation behaviors of as-extruded 7075 aluminum alloy by an artificial neural network with back-propagation algorithm. High Temp. Mater. Process. 2016, 36, 1–13. [Google Scholar] [CrossRef]
  24. Lv, J.; Ren, H.; Gao, K. Artificial neural network-based constitutive relationship of inconel 718 superalloy construction and its application in accuracy improvement of numerical simulation. Appl. Sci. 2017, 7, 124. [Google Scholar] [CrossRef] [Green Version]
  25. Opěla, P.; Kawulok, P.; Schindler, I.; Kawulok, R.; Rusz, S.; Navrátil, H. On the Zener–Hollomon Parameter, Multi-Layer Perceptron and Multivariate Polynomials in the Struggle for the Peak and Steady-State Description. Metals 2020, 10, 1413. [Google Scholar] [CrossRef]
  26. Lin, Y.C.; Liang, Y.-J.; Chen, M.-S.; Chen, X.-M. A comparative study on phenomenon and deep belief network models for hot deformation behavior of an Al–Zn–Mg–Cu alloy. Appl. Phys. A 2017, 123, 68. [Google Scholar] [CrossRef]
  27. Guo, L.; Fan, X.; Yu, G.; Yang, H. Microstructure control techniques in primary hot working of titanium alloy bars: A review. Chin. J. Aeronaut. 2016, 29, 30–40. [Google Scholar] [CrossRef] [Green Version]
  28. Peng, X.; Guo, H.; Shi, Z.; Qin, C.; Zhao, Z.; Yao, Z. Study on the hot deformation behavior of TC4-DT alloy with equiaxed α+β starting structure based on processing map. Mater. Sci. Eng. A 2014, 605, 80–88. [Google Scholar] [CrossRef]
  29. Liu, D.; Liu, D.; Zhang, X.; Ma, A.; Liu, C. Microstructural evolution mechanisms in rolled 17-4PH steel processed by ultrasonic surface rolling process. Mater. Sci. Eng. A 2020, 773, 138720. [Google Scholar] [CrossRef]
  30. Sung, J.H.; Kim, J.H.; Wagoner, R. A Plastic Constitutive Equation Incorporating Strain, Strain-Rate, and Temperature. Int. J. Plast. 2010, 26, 1746–1771. [Google Scholar] [CrossRef]
  31. Zhou, P.; Deng, L.; Zhang, M.; Gong, P.; Wang, X.-Y. Characterization of hot workability of 5052 aluminum alloy based on activation energy-processing map. J. Mater. Eng. Perform. 2019, 28, 6209–6218. [Google Scholar] [CrossRef]
  32. Langdon, T.G. Identifiying Creep Mechanisms at Low Stresses. Mater. Sci. Eng. A 2000, 283, 266–273. [Google Scholar] [CrossRef]
  33. Mahmudi, R.; Rezaee-Bazzaz, A.; Banaie-Fard, H. Investigation of Stress Exponent in the Room-temperature Creep of Sn-40Pb-2.5 Sb Solder Alloy. J. Alloys Compd. 2007, 429, 192–197. [Google Scholar] [CrossRef]
  34. Sheikhali, A.H.; Morakkabati, M.; Abbasi, S.M.; Rezaei, A. Superplasticity of coarse-grained Ti-13V-11Cr-3Al alloy. Int. J. Mater. Res. 2013, 104, 1122–1127. [Google Scholar] [CrossRef]
  35. Luo, J.; Li, M.; Yu, W.; Li, H. The Variation of Strain Rate Sensitivity Exponent and Strain Hardening Exponent in Isothermal Compression of Ti-6Al-4V Alloy. Mater. Des. 2010, 31, 741–748. [Google Scholar] [CrossRef]
  36. Zener, C.; Hollomon, J.H. Effect of Strain Rate upon Plastic Flow of Steel. J. Appl. Phys. 1944, 15, 22–32. [Google Scholar] [CrossRef]
Figure 1. The initial microstructure of Ti–10V–1Fe–3Al alloy.
Metals 12 00526 g001
Figure 2. True stress-true strain curve: (a) 730, (b) 790, (c) 820, and (d) 880 °C.
Metals 12 00526 g002
Figure 3. (a) Linear fitting of σlnέ; (b) linear fitting of lnσlnέ.
Metals 12 00526 g003
Figure 4. (a) The relationship between the flow stress (σ) and deformation temperature (T−1). (b) Fitting relationship between the experimental flow stress and predicted flow stress, when the strain is 0.1.
Metals 12 00526 g004
Figure 5. The relationship between the constants and strain: (a) the material constant (b), (b) deformation activation energy Q value, and (c) material constant (lnA).
Metals 12 00526 g005
Figure 6. Fitting curve of n value.
Metals 12 00526 g006
Figure 7. The relationship between ln(sinh(ασ)) and the deformation temperature (T−1).
Metals 12 00526 g007
Figure 8. The relationship between various constants and strain: (a) ε-α diagram, (b) ε-1/n diagram, (c) ε-Q diagram, (d) ε-lnA diagram, and (e) ε-m diagram.
Metals 12 00526 g008
Figure 9. Contrast between experimental flow stress (solid line) and predicted flow stress (dot line): (a) 730, (b) 790, (c) 820, and (d) 880 °C.
Metals 12 00526 g009aMetals 12 00526 g009b
Figure 10. Fitting relationship between experimental and predicted flow stress.
Metals 12 00526 g010
Figure 11. High-temperature compression microstructure of Ti–10V–1Fe–3Al alloy at strain rate of 0.01 s−1: (a) 730, (b) 790, (c) 820, and (d) 880 °C.
Metals 12 00526 g011
Table 1. Composition of Ti–10V–1Fe–3Al titanium alloy.
Alloy ElementVFeAlOCNH[Mo]eq
ω/%9.970.973.020.110.0510.0140.0016.5
Table 2. Corresponding α values at different temperatures.
Temperature (°C)730790820880
α value0.009474200.016310880.0187351150.023240403
Table 3. Parameter values of exponential equation at strain 0.1.
Parameterα+β Phase Regionβ Phase Region
b0.0600.066
S999473.0786342629.6996
Q (kJ/mol)789.863189.6516
lnA81.776912.0051
Table 4. Third-order polynomial fitting results of parameters, with strain, for the α+β phase region.
bQlnA
B018.0788Q0738.630A036.339
B1−0.26396Q113.041A10.380
B20.01693Q2−1.128A2−0.0461
B3−0.00027Q30.0178A30.00205
Table 5. Third-order polynomial fitting results of parameters, with strain, for the β phase region.
bQlnA
B014.235Q0249.901A018.265
B10.144Q1−10.101A1−1.0151
B2−0.00632Q20.486A20.0509
B30.0000523Q3−0.00575A30.000604
Table 6. Parameter values of hyperbolic sine equation at strain 0.1.
Parameterα+β Phase Regionβ Phase Region
α0.0120.021
n3.7262.347
S11,617.2379858.146
Q(kJ/mol)359.587192.42
lnA37.07514.854
Table 7. Third-order polynomial fitting results of parameters with strain for α+β phase region.
αnQlnA
X00.0115N00.2828Q0352.405A036.339
X14.3 × 10−5N1−0.00352Q12.42A10.380
X2−2.30 × 10⁻⁷N22.81 × 10−4Q2−0.4A2−0.0461
X31.32 × 10−8N3−4.22 × 10⁻⁶Q30.00633A37.33 × 10−4
Table 8. Third-order polynomial fitting results of parameters with strain for β phase region.
αnQlnA
X00.02149N00.41199Q0178.060A013.294
X1−8.58 × 10⁻⁵N10.00258Q11.806A10.196
X24.34 × 10−7N2−9.79×10⁻⁵Q2−0.0074A2−9.77 × 10−4
X3−3.07 × 10⁻⁸N37.69×10−7Q3−0.000607A3−5.98 × 10⁻⁵
Publisher’s Note: MDPI stays neutral with regard to jurisdictional claims in published maps and institutional affiliations.

