Article

Experimental and Modeling Study of Deformability of Glassy CaO-(MnO)-Al2O3-SiO2 Inclusions

1
Process Metallurgy Research Unit, University of Oulu, P.O. Box 4300, FI-90014 Oulu, Finland
2
School of Metallurgical and Ecological Engineering, University of Science and Technology Beijing, Beijing 100083, China
*
Author to whom correspondence should be addressed.
Metals 2022, 12(3), 522; https://doi.org/10.3390/met12030522
Submission received: 11 January 2022 / Revised: 17 March 2022 / Accepted: 18 March 2022 / Published: 20 March 2022
(This article belongs to the Special Issue Inclusion Precipitation during Solidification of Steels)

Abstract

:
The occurrence of non-deformable, non-metallic inclusions is the dominant reason for failure of wire during drawing and degrades service life for some steel grades, e.g., tire cord steel. To investigate the deformability of glassy inclusions in CaO-Al2O3-SiO2 and MnO-Al2O3-SiO2 systems, experimental and numerical methods were used. Young’s modulus values of some glasses based on the CaO-Al2O3-SiO2 and MnO-Al2O3-SiO2 systems, which correspond to typical inclusions in tire cord steel, were measured with resonant ultrasound spectroscopy. The effect of basicity, defined as the ratio of mass percentage of CaO to SiO2, on Young’s modulus and Poisson’s ratio were investigated. The Young’s moduli of glasses are enhanced with increasing basicity, which could be attributed to the high field strength of calcium ions. The Poisson’s ratios of glasses also show an increase tendency with increasing basicity, which could be due to the loss of rigidity of network with introduction of calcium ions. The equations in the literature for Young’s modulus calculation were evaluated based on the present and literature data. Appen’s equation is modified by re-fitting the present and literature data to give accurate estimation of Young’s modulus with the mean deviation of 2%. The iso-Young’s modulus diagrams for CaO-Al2O3-SiO2 systems were constructed. It is proposed that the iso-Young’s modulus diagram could be combined with liquid area in CaO-Al2O3-SiO2 ternary phase diagram to optimize the inclusion composition during both hot rolling and cold drawing.

1. Introduction

As de-oxidation products during secondary steelmaking, non-metallic inclusions could be detrimental to steel production and performance. During the steel forming process, non-deformable, non-metallic inclusions could bring failures to the hot rolling and cold drawing of steels [1]. Especially for some steel grades, e.g., tire cord steel, non-deformable non-metallic inclusions are the dominant reason for failure of wire during drawing and service [1,2]. Accordingly, the deformability of inclusions is of vital importance to the production and service of tire cord steels.
The tire cord steels are mainly refined by employing silicon de-oxidation, resulting in main inclusions based on CaO-Al2O3-SiO2 and MnO-Al2O3-SiO2 system. During production of tire cord steel, hot rolling and cold drawing are usually applied to obtain final products. Extensive work has been conducted on improving the plasticity of inclusions at high temperatures to meet the demand of hot rolling [3,4,5,6,7,8,9,10,11,12,13,14,15,16,17,18]. It is well accepted that the composition of inclusions should be controlled within the liquidus area in phase diagram of CaO-Al2O3-SiO2 and MnO-Al2O3-SiO2 systems to obtain the liquid inclusions in steels [6]. During hot rolling, the adequate plasticity remains for rolling due to the softening of glassy inclusions. Many thermodynamic investigations were performed on controlling inclusions within the liquidus areas in the literature [3,4,5,6,7,8,9,10,11,12,13,14,15,16,17,18,19]. Modifications of inclusions by adding Ti and Li were reported to achieve liquid state inclusions [3,4]. Top slag control is a proposed method to optimize the composition of inclusions [5,6,7,8]. Alkali metal oxide and boron oxide were also added in top slag to improve the inclusion absorption of slag and control the composition of inclusions [9,10]. However, all these studies mainly targeted on the inclusion control during hot rolling. The tire cord steel still needs to be subject to the cold drawing process. The deformability of inclusions in steel at low temperatures is also important for achieve better production and service of steel. There are fewer investigations on the deformability of inclusions at low temperatures. Kimura et al. [20] investigated the fracture behavior of oxide inclusions during hot rolling and cold drawing of steel rod and wire. They concluded that the magnitude of fracture of oxide inclusions is affected by the compressive strength of oxides and can be predicted from Young’s modulus and mean atomic volume of the oxides. However, they only investigated some simple oxides, e.g., alumina, zirconia and silica, and there is no study on complex oxides in their work. Zhang et al. [21] evaluated the factors influencing deformability of inclusions at low temperatures using Young’s modulus. They also proposed an empirical formula by fitting Young’s modulus of the oxides as a function of the mean atomic volume. Still, there is a lack of experimental validation for their formula. The investigation on deformation of inclusions at different temperatures was continued in work by Yang et al. [22].
In the present work, the Young’s modulus values of some glasses based on the CaO-(MnO)-Al2O3-SiO2 systems which correspond to typical inclusions in tire cord steel were measured by using resonant ultrasound spectroscopy. The equations in the literature for Young’s modulus calculation were evaluated based on the new data. As a result, the most appropriate equations for calculating Young’s moduli were obtained. Based on the present results, controlling the inclusion composition in CaO-(MnO)-Al2O3-SiO2 system was clarified.

2. Materials and Methods

Raw materials for preparation CaO-(MnO)-Al2O3-SiO2 inclusions were reagent grade CaCO3, MnO Al2O3 and SiO2 with purity higher than 99%. CaCO3 was heated at 1273 K overnight to decompose into CaO. Other powders were heated at 873 K for 2 h to remove moisture. The chemical compositions of samples investigated in the present work were shown in Table 1.
Glassy inclusions were prepared using a conventional melting and quenching method. Raw materials were mixed with appropriate ratios in an agate mortar and taken in a platinum crucible. Then, the samples were melted using a vertical tube furnace with MoSi2 as heating elements. The samples were held at 1873 K for 60 min for melting and homogenization. High purity of argon (99.999%) with a flow rate of 600 mL/min was purged from bottom of tube. After melting, the crucible was quickly taken out of the furnace and poured on the stainless-steel plate. To verify the glassy state of quenched samples, X-ray diffraction were performed on a 18 kW X-ray diffractometer (model: RIGAKU TTRIII) with Cu-Kα radiation. The XRD patterns are shown in Figure 1. The XRD patterns showed no crystalline peaks for any samples, indicating that all samples were in glassy state.
The samples were annealed in a tube furnace with SiC as heating elements to eliminate residual stress in glass. High purity of argon with a flow rate of 600 mL/min was purged to protect the samples (more precisely no. 5 containing MnO) from oxidation. The samples were heated to 1023 K with a heating rate of 3 K/min, and held at 1023 K for 2 h, then cooled to room temperature with a cooling rate of 3 K/min.
The obtained glassy block was cut into the cube with the dimension of 1 cm × 1 cm × 1 cm by using a diamond blade. The cube was ground with fine sandpaper and polished with polishing paste. After being washed with ultrasonic cleaner, the samples were subjected to Young’s modulus measurements.
Young’s modulus (E) and shear modulus (G) values were measured using resonant ultrasound spectroscopy (RUSpec, Magnaflux). The spectra were gathered from 1 KHz to 3 MHz on prepared cubic glassy samples. The first five resonant peaks in the frequency domain were employed to calculate the elastic modulus with errors less than 1%. The longitudinal Vl and shear (transversal) acoustic velocities Vt were measured by pulse–echo technique. Then, Young’s modulus (E), bulk modulus (K), shear modulus (G), and Poisson’s ratios (ν) can be calculated by the following equations:
E = ρ V t 2 3 V l 2 4 V t 2 V l 2 V t 2
K = 1 / 3 ( 3 V l 2 4 V t 2 )
G = ρ V t 2
ν = V l 2 2 V t 2 2 ( V l 2 V t 2 )
where ρ is the density of glass.
The liquid areas of CaO-Al2O3-SiO2 system at 1673 K were calculated using the FactPS and FTOxid databases in FactSage (Version 7.0). The “Phase diagram” module was employed in the liquid area calculation of the present work.

3. Results and Discussion

3.1. Young’s Modulus Measurements

Young’s modulus, elastic modulus and bulk modulus values of various glassy samples were measured and shown in Table 2. The Poisson’s ratios of the samples were also calculated and shown in Table 2 according to the following equation.
ν = E/(2G) − 1
where ν is Poisson’s ratio; E is the Young’s modulus of glass; and G is the shear modulus of glass.
Figure 2 shows the basicity dependence of Young’s modulus of glassy samples. It was shown that the Young’s modulus of glasses increases with increasing basicity of glasses. The field strength of cations has an important influence on Young’s modulus [23]. The addition of high field strength cations in silicate glass would lead to the higher Young’s modulus values [24,25]. The calcium ion has a high field strength, which could be reflected by the very high melting point of CaO (2886 K). Accordingly, the Young’s modulus increases with increasing w(CaO)/w(SiO2).
The basicity dependence of Poisson’s ratio of glassy sample was plotted in Figure 3. It can be seen in the figure that the Poisson’s ratios of samples are enhanced with increasing basicity. A high Poisson’s ratio of a glass is found when the rigid glass structure is softened [23]. It is well known that the increase of CaO would lead to more non-bridging oxygen, which would break the linkage of various silicate tetrahedrons [26] and loosen or even brake the rigid 3D silicate network, leading to increased Poisson’s ratios.
Sample no. 4 is mainly based on a CaO-Al2O3 system with a minor SiO2 addition. Both the Al2O3 content and basicity are higher than in samples 1–4. This sample has the highest Young’s modulus value of all samples. Sample no. 5 has a similar Young’s modulus value with sample no. 1, for the contents of SiO2 and Al2O3 in sample no. 5 are the same as those in sample no. 1, However, the Poisson’s ratio of sample no. 5 is significantly lower than that of sample no. 1, indicating the type of ratio in aluminosilicate glass has some effects on Poisson’s ratio.

3.2. Young’s Modulus Calculation

There are many empirical and semi-empirical equations proposed in the literature to calculate the Young’s modulus of glass, which were summarized by Scholze [23]. These equations are briefly introduced as follows.
Winkelmann and Schott [27] firstly proposed an equation to calculate the Young’s modulus (E) of glass from the chemical composition of glass.
E = i E i w i
where E is Young’s modulus for glasses; wi is the mass percentage of component i; Ei is a factor for component i. For CaO-Al2O3-SiO2 system, E(CaO) = 7.0, E(Al2O3) = 18.0, E(SiO2) = 7.0 (in kBar).
Appen [28] later proposed a new equation based on new factors Ei to calculate Young’s modulus from mole percentage of components.
E = i E i p i
where E is Young’s modulus for glasses; pi is the mole percentage of component i; Ei is a factor for component i. For CaO-(MnO)-Al2O3-SiO2 system, E(CaO) = 11.15, E(MnO) = 12.8, E(Al2O3) = 11.4, E(SiO2) = 6.5 (pi < 67), E(SiO2) = 5.3 + 0.018p(SiO2) (p(SiO2) > 67) (in kBar).
Philips et al. [29] employed the same equation as Equation (2), but the factors for various components are as follows: E(CaO) = 12.6, E(Al2O3) = 12.1, E(SiO2) = 7.3. (in kBar).
Makishima and Mackenzie [30] considered the dependence of the Young’s modulus on the packing density of the ions Vt and the dissociation energy U (based on the unit volume):
E = 2 V t U
For a multi-component glass, the packing density of the ions could be calculated from the summation of different components.
V t = ρ i V i p i / i M i p i
where ρ is the density of the glass, Xi is molar percentage of component i, Mi is molar mass of component I, and Vi is the factor for packing density of component i. For CaO-(MnO)-Al2O3-SiO2 system, V(CaO) = 9.4, V(Al2O3) = 21.4, V(SiO2) = 14.
The dissociation energy U could be calculated by the following equation:
U = U i p i / 100
Ui is the factor for packing density of component i. For the CaO-(MnO)-Al2O3-SiO2 system, U(CaO) = 64.9 kJ/cm3, U(Al2O3) = 134 kJ/cm3, U(SiO2) = 64.5 kJ/cm3.
Ashizuka [31] proposed that Young’s modulus and the mean atomic volume of oxides have the following relationship:
E = k V g
where V is the mean atomic volume, k and g are parameters fitted by experimental data.
Mean atomic volume (V) could be calculated as follows:
V = M ρ n
where M is molar mass; and n is the number of atoms in the oxide.
Based on Ashizuka’s work, Zhang et al. [21] fitted the experimental data in the literature to obtain the following correlation between Young’s modulus and mean atomic volume:
E = 39811 V 2.9
Density of glasses at room temperature could be calculated using the equation by Fluegel [32] as follows:
For CaO-Al2O3-SiO2 system:
ρ = b 0 + b Ca p CaO + b Ca 2 p CaO 2 + b Al p Al 2 O 3 + b Al 2 p Al 2 O 3 2 + b CaAl p CaO p Al 2 O 3
where b0 = 2.122, bCa = 0.01800, bCa2 = −0.0000547, bAl = 0.0105260, bAl2 = −0.00007692, bCaAl = −0.000102444. p CaO and p Al 2 O 3 are molar percentages of CaO and Al2O3, respectively.
For MnO-Al2O3-SiO2 system:
ρ = b 0 + b Mn p MnO + b Al p Al 2 O 3 + b Al 2 p Al 2 O 3 2
where b0 = 2.122, bMn = 0.01800, bAl = 0.0105260, bAl2 = −0.00007692. p MnO and p Al 2 O 3 are molar percentages of MnO and Al2O3, respectively. The unit for all b parameters are all g/cm3.
To evaluate the performance of various equations introduced in the last section, the Young’s modulus values of various samples were calculated by using different equations and the calculated values are compared with experimental data. The experimental data in references [33,34,35] are also included for evaluating the performance of various equations. The details of data are shown in Table 3.
The relative deviations (∆) between calculated (Ecal) and measured values (Emea) were calculated using the following equation:
Δ = | E c a l E m e a | E m e a × 100 %
The comparisons between calculated and measured Young’s modulus values were shown in Figure 4. It can be seen that the estimated Young’s modulus values by various equations do not agree with the measured values. The performances of various equations for calculating the Young’s modulus of glasses were evaluated through comparing the relative deviations generated by the various equations. The relative deviations by various equations are 14.7%, 5.6%, 6.5%, 6.0% and 34.2% for Winkelmann–Scott’s, Appen’s, Phillips’, Makishima–Mackenzie’s and Ashizuka–Zhang’s, respectively. This indicates that none of these equations can be suitable for estimating the Young’s modulus of CaO-Al2O3-SiO2 glasses.
Based on the Appen’s equation, multiple linear fitting has been employed in this work to fit both the present experimental data and literature data. The following equation has been obtained:
E = 0.9700 p ( CaO ) + 1.369 p ( Al 2 O 3 ) + 0.7639 p ( SiO 2 )   ( in   GPa )  
The Young’s modulus of the samples both in the present work and in the literature have been estimated by the Equation (17) and compared with the experimental data. The comparison results are shown in Figure 4 and also in Table 3. The calculated mean deviation is 2.13%, which is much lower than those given by the previous equations. It should be mentioned that the normal relative error for experimental data of Young’s modulus can be larger than 1%. Therefore, Equation (17) can be a very good estimating equation for Young’s modulus of CaO-Al2O3-SiO2 glasses.

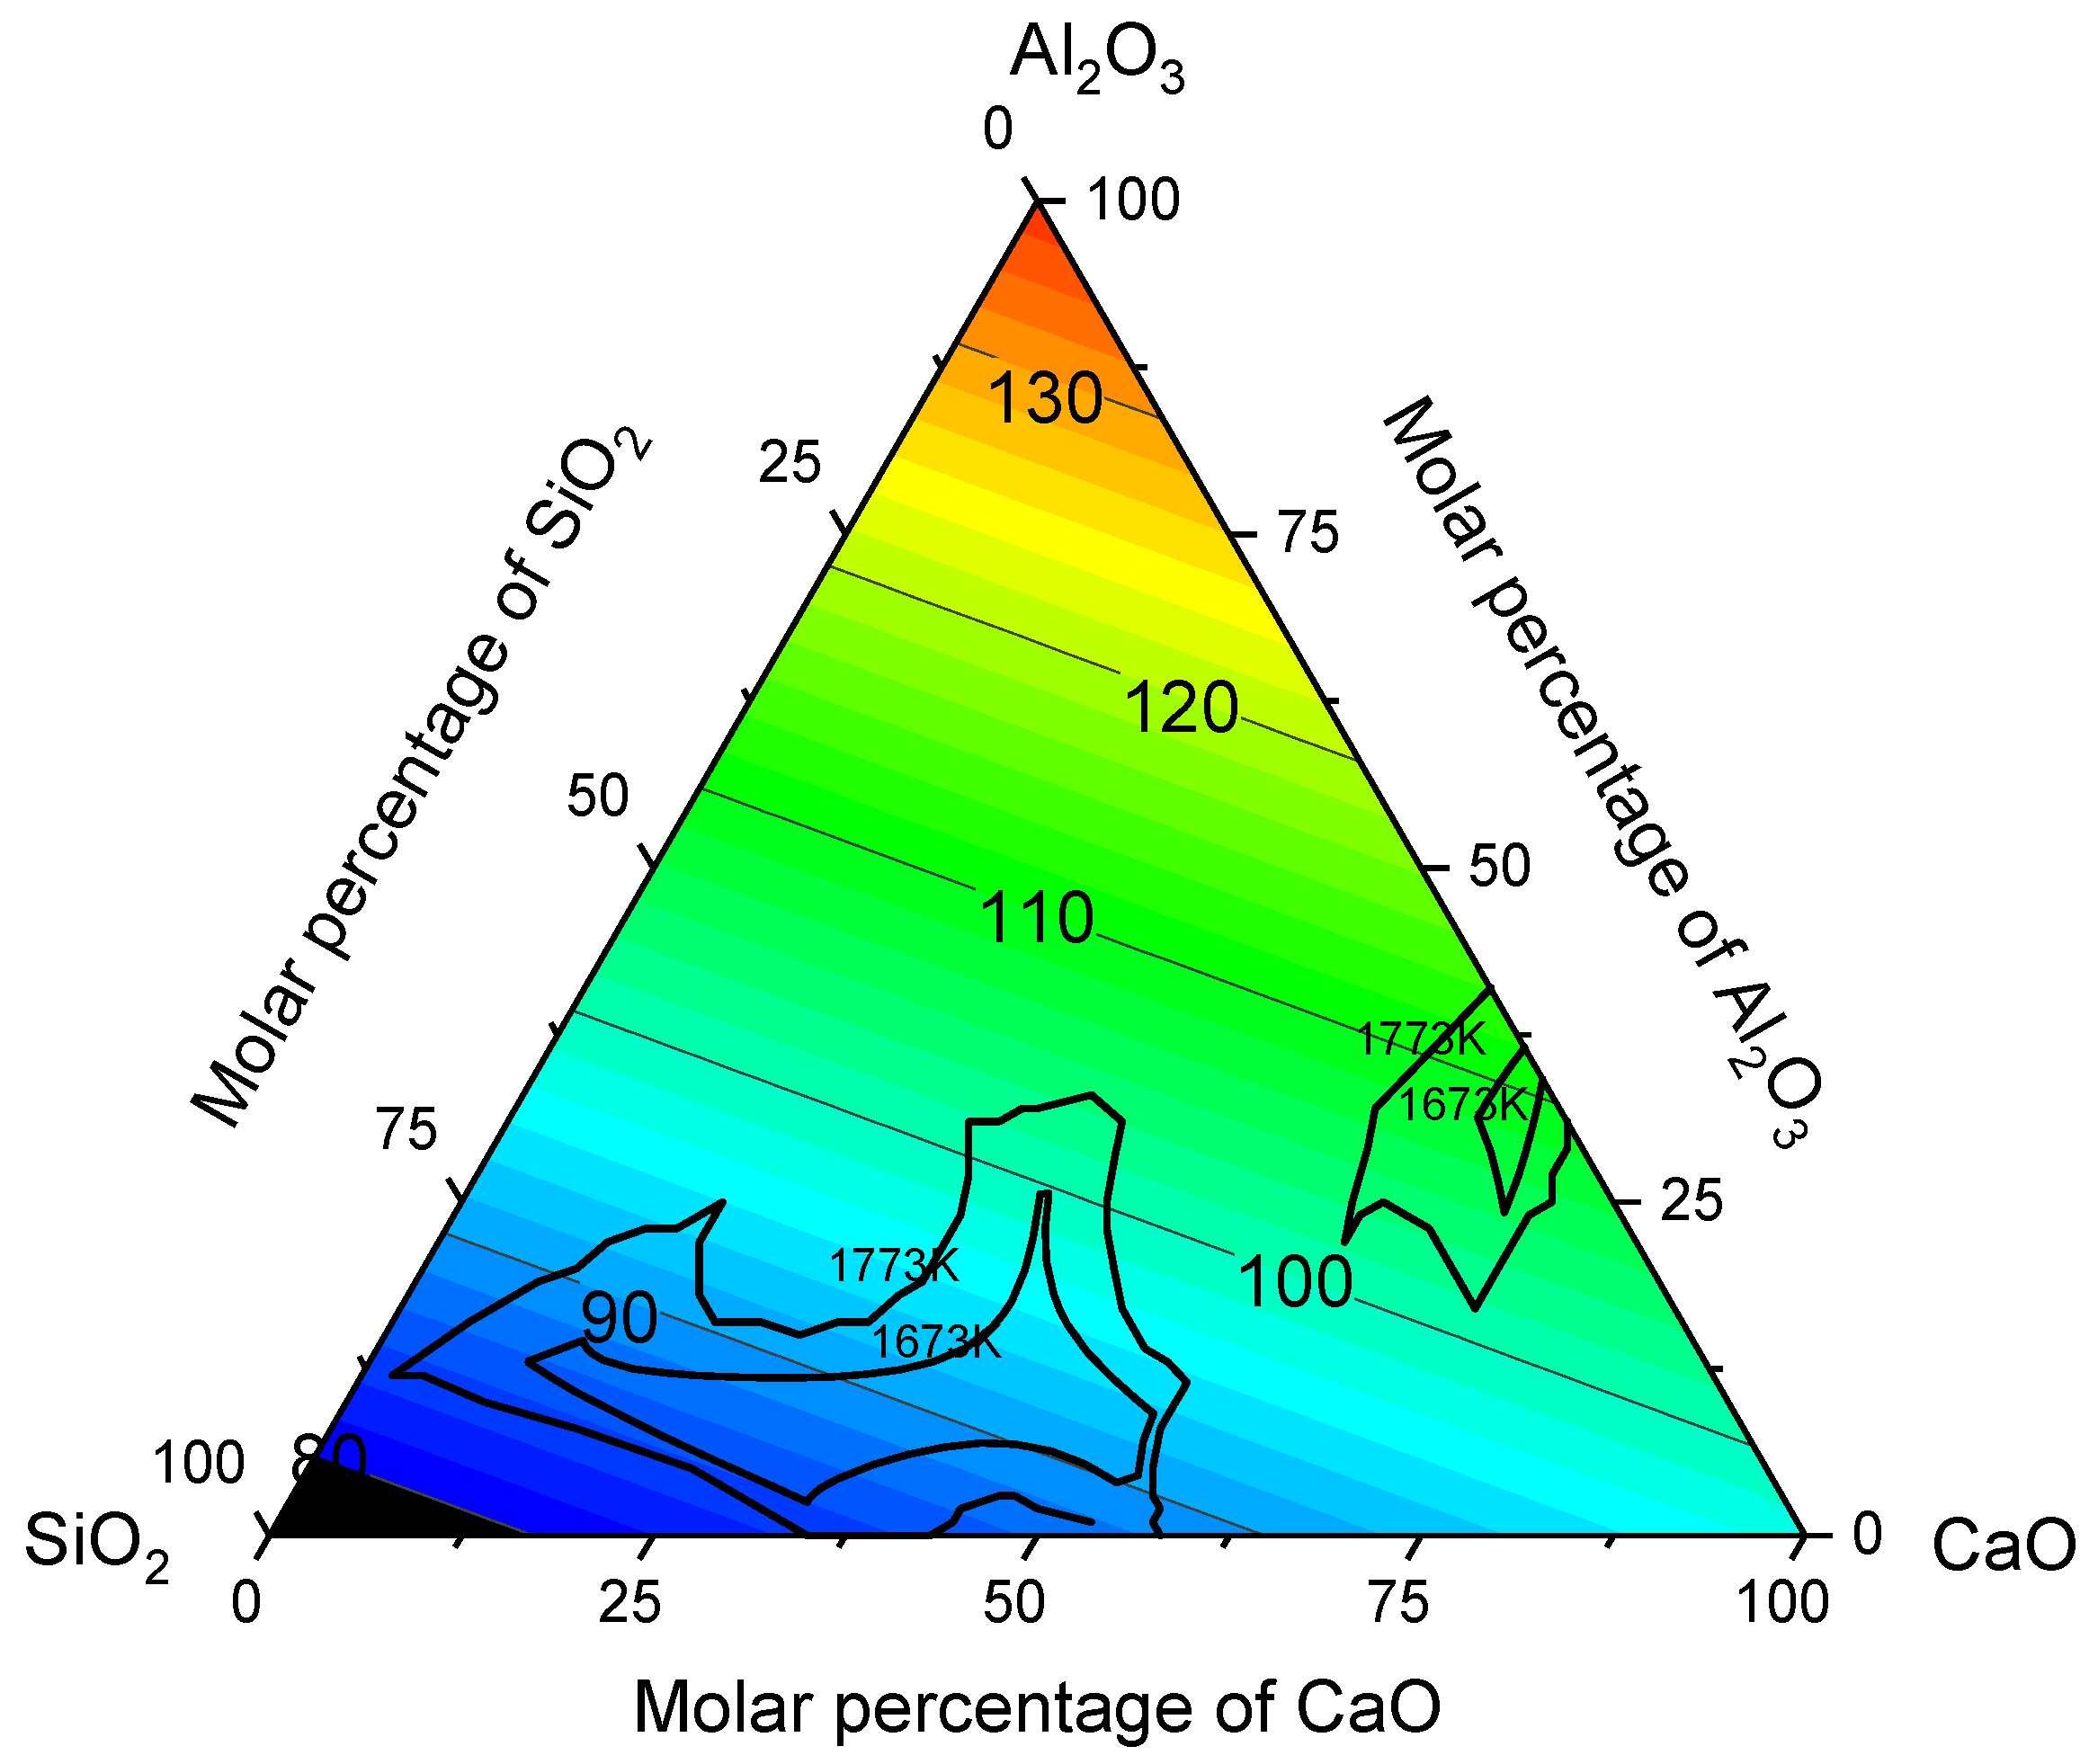
3.3. Iso-Young’s Modulus Diagrams

The various iso-Young’s modulus diagrams were constructed using the various equations and shown in Figure 5a–d.
As can be seen in Figure 5a–d, different equations predict quite different composition dependences of Young’s modulus. The Winkelmann–Schott equation produces iso-Young’s modulus lines, which are nearly parallel to the CaO-SiO2 side, indicating that the calculated Young’s moduli are nearly independent of basicity (w(CaO)/w(SiO2)). This is due to the same Ei factors for CaO and SiO2 they adopted. As shown in Figure 5c, the equation by Ashizuka–Zhang predicted a complex composition dependence of Young’s modulus. As can be seen in Figure 5, Appen’s equation, Zhang’s equation and modified Appen’s equation predict an increase of Young’s modulus with enhanced basicity. According to our experimental data, the Young’s modulus increases with increasing basicity at a constant Al2O3 concentration. Therefore, these equations could predict the correct basicity dependence of Young’s modulus. The iso-Young’s modulus diagram produced by Winkelmann–Schott equation, modified Appen’s equation and Ashizuka–Zhang’s equation showed clearly that the Young’s modulus values increase as the content of Al2O3 increases. However, as can be seen in Figure 4, the Ashizuka–Zhang’s and Winkelmann–Schott equation gave larger Young’s modulus values than experimental values. Accordingly, only Figure 5d plotted by the modified Appen’s equation can be employed for estimating the Young’s modulus values of CaO-Al2O3-SiO2 glasses.

3.4. Implications for Inclusion Control

It was proposed that the deformability of oxide inclusions is inversely proportional to the Young’s modulus during cold drawing [21]. Therefore, the diagram of iso-Young’s modulus can be employed to control the inclusion composition of tire-cord steel for achieving good performance during cold drawing. According to Figure 5d, the inclusion with low basicity would have a smaller Young’s modulus than inclusions with higher basicity. Therefore, it is proposed that the inclusion composition should be controlled in the low basicity area in CaO-Al2O3-SiO2 system for production of tire cord steel. Meanwhile, it could be found in Figure 5d that Young’s modulus increases with increasing Al2O3 content at a constant basicity. Therefore, the Al2O3 contents in inclusions should be strictly restricted to maintain low Young’s moduli and good deformability of inclusions.
Before cold drawing, the tire cord steels undergo hot rolling process. The deformability of inclusion at high temperature is also important for manufacturing tire cord steel. It is well accepted that complex inclusions with melting points lower than 1400 °C would have good deformability during hot rolling [6]. Even though the rolling temperature (between 900 and 1200 °C) is lower than melting point of these inclusions, these inclusions have good glass-forming ability, and they can easily reach an undercooling state, in which there is still viscous flow above glass transition temperature (800–900 °C). Therefore, these inclusions with low melting points would still exhibit plasticity at rolling temperature. Since liquid inclusions at high temperature generally have good plasticity at rolling temperature, it is important to maintain the liquid state of inclusions at high temperature by adjusting their composition in liquidus area of phase diagram. By considering the performance of steel in both cold drawing (Young’s modulus applied) and hot rolling (liquid area applied), the iso-Young’s modulus diagram could be combined with the liquid area in CaO-Al2O3-SiO2 phase diagram to provide a better control of inclusion for tire cord steel.
Apart from the iso-Young’s modulus lines calculated by modified Appen’s equation, the liquid area at 1673 K and 1773 K in the CaO-Al2O3-SiO2 system is plotted in Figure 6. It could be seen that there are two separate liquid areas in the CaO-Al2O3-SiO2 system, which can meet the demand for deformability of hot rolling. However, in Zone II with lower SiO2 content, the Young’s modulus values are much higher than those in Zone I. To achieve better deformability of cold drawing, the composition of inclusions could be better located in Zone I where the SiO2 content is high. Accordingly, it is proposed that the CaO-Al2O3-SiO2 inclusions should be controlled at the composition saturated with SiO2 to meet the demands from hot rolling and cold draw at the same time. Figure 6 could be a good tool for controlling CaO-Al2O3-SiO2 inclusions to achieve better deformability at both high and low temperature.
The present work only dealt with the glassy inclusions in CaO-(MnO-)Al2O3-SiO2. During the reheating prior to hot rolling, the crystallization of glassy inclusions might take place, and the deformability at both high and low temperature will be affected. Based on the rule of mixtures (Voigt model [36]), the Young’s modulus of partly crystallized glass can be calculated from Young’s modulus of the residual glass and precipitated crystals [37]:
E = ( 1 f ) E g l a s s + f E c r y
where E g l a s s and E c r y are Young’s modulus of residual glass and crystals; f is the crystallized fraction of partly crystallization glass.
The crystallization of glassy inclusions can be described by Johnson–Mehl–Avrami equations: [38]
f = 1 exp ( ( k ( t τ ) ) n )
where k, τ , t and n are the rate constant, the incubation time, the time and the Avrami parameter.
The crystallization kinetics of glass 41.3% SiO2-33.7% CaO-24.5% Al2O3 (in mass%) at 1154 °C was investigated by Rocabois et al. [38] and the parameters in Equation (19) were obtained as k = 0.071 min−1, n = 1.99, τ = 1 min42. The Young’s modulus of precipitated anorthite crystals are 107 GPa according to reference [39]. The composition of residual glass can be calculated and the Young’s modulus can be obtained through Equation (18). The calculated Young modulus of crystallized glasses (crystallized fraction of 0.3) heated at 1154 °C for 30 min is 97.18 GPa, which is slightly higher than calculated value (94.07 GPa) of the glass. The experimental investigation on the effect of crystallization on Young’s modulus will be required for further validation.

4. Conclusions

Young’s moduli of some compositions of glass in CaO-(MnO-)Al2O3-SiO2 system was measured by using resonant ultrasound spectroscopy. Various equations in the literature were employed to estimate the Young’s modulus values of glasses and the calculated values were compared with the measured ones. The iso-Young’s moduli diagrams were also constructed based on various equations. The following conclusions could be drawn:
(1)
Higher basicity of glass will lead to the increase of the Young’s modulus, which could be attributed to the high field strength of calcium ions.
(2)
The Poisson’s ratios of glasses also show an increase tendency with increasing basicity, which could be due to the loss of rigidity of glass with introduction of calcium ions.
(3)
The equation by Appen was modified to provide the best estimation of Young’s modulus values of glasses. The basicity dependence of Young’s modulus of glasses can be also reproduced by the modified Appen equation.

Author Contributions

Conceptualization, Q.S.; methodology, Q.S. and C.Y.; software, Q.S. and C.Y.; validation, Q.S., C.Y., T.A. and T.M.J.F.; formal analysis, Q.S. and C.Y.; investigation, C.Y. and Q.S.; resources, Q.S. and T.M.J.F.; data curation, Q.S., T.A. and T.M.J.F.; writing—original draft preparation, Q.S.; writing—review and editing, Q.S., T.A. and T.M.J.F.; visualization, Q.S., T.A. and T.M.J.F.; supervision, Q.S. and T.M.J.F.; project administration, Q.S. and T.M.J.F.; funding acquisition, Q.S. and T.M.J.F. All authors have read and agreed to the published version of the manuscript.

Funding

This work was funded by the Academy of Finland for Genome of Steel Grant (No. 311934) and Natural Science Foundation of China (NSFC contract no. 51774026).

Data Availability Statement

Not applicable.

Conflicts of Interest

The authors declare no conflict of interest.

References

  1. Godon, J.; Antoine, P.; Vogt, J.B.; Bouquerel, J. Influence of steel cleanliness on drawability of fine filaments with high tensile strength, Metall. Res. Technol. 2019, 116, 513. [Google Scholar]
  2. Yilmaz, M. Failures during the production and usage of steel wires. J. Mater. Processing Technol. 2006, 171, 232–239. [Google Scholar] [CrossRef]
  3. Sakamoto, K.; Sugimura, T.; Yoshida, A.; Fukuzaki, Y.; Suda, S. Method for Producing High Cleanness Steel Excellent in Fatigue Strength or Cold. Workability.U.S. Patent 7,615,099, 10 November 2009. [Google Scholar]
  4. Thapliyal, V.; Kumar, A.; Robertson, D.; Smith, J. Inclusion Modification in Si–Mn Killed Steels using Titanium Addition. ISIJ Int. 2015, 55, 190–199. [Google Scholar] [CrossRef] [Green Version]
  5. He, X.F.; Wang, X.H.; Chen, S.H.; Jiang, M.; Huang, F.X.; Wang, W.J. Inclusion composition control in tyre cord steel by top slag refining. Ironmak. Steelmak. 2014, 41, 676–684. [Google Scholar] [CrossRef]
  6. Wang, H.; Wang, F.; Xu, Z.; Jin, L. Composition Control of CaO-MgO-Al2O3-SiO2 Inclusions in Tire Cord Steel-a Thermodynamic Analysis. Steel Res. Int. 2008, 79, 25–30. [Google Scholar] [CrossRef]
  7. Kang, Y.B.; Lee, H.G. Inclusions chemistry for Mn/Si deoxidized steels: Thermodynamic predictions and experimental confirmations. ISIJ Int. 2004, 44, 1006–1015. [Google Scholar] [CrossRef] [Green Version]
  8. Park, J.S.; Park, J.H. Effect of slag composition on the concentration of Al2O3 in the inclusions in Si-Mn-killed steel. Metall. Mater. Trans. B 2014, 45, 953–960. [Google Scholar] [CrossRef]
  9. Li, Y.; Chen, C.; Jiang, Z.; Sun, M.; Hu, H.; Li, H. Application of alkali oxides in LF refining slag for enhancing inclusion removal in C96V saw wire steel. ISIJ Int. 2018, 58, 1232–1241. [Google Scholar] [CrossRef] [Green Version]
  10. Cui, H.Z.; Chen, W.Q. Effect of boron on morphology of inclusions in tire cord steel. J. Iron Steel Res. Int. 2012, 19, 22–27. [Google Scholar] [CrossRef]
  11. Yang, W.; Guo, C.; Zhang, L.; Ling, H.; Li, C. Evolution of oxide inclusions in Si-Mn killed steels during hot-rolling process. Metall. Mater. Trans. B 2017, 48, 2717–2730. [Google Scholar] [CrossRef]
  12. Chen, C.; Jiang, Z.; Li, Y.; Zheng, L.; Huang, X.; Yang, G.; Sun, M.; Chen, K.; Yang, H.; Hu, H. State of the art in the control of inclusions in tire cord steels and saw wire steels—A review. Steel Res. Int. 2019, 90, 1800547. [Google Scholar] [CrossRef]
  13. Niu, K.; Conejo, A.N. Effect of Al2O3 on Evolution of Oxide Inclusions in Tire Cord Steel during Hot Rolling. ISIJ Int. 2021, 61, 2605–2612. [Google Scholar] [CrossRef]
  14. Wang, Y.; Zhang, L.; Ren, Y.; Li, Z.; Slater, C.; Peng, K.; Liu, F.; Zhao, Y. Effect of compression temperature on deformation of CaO–CaS–Al2O3–MgO inclusions in pipeline steel. J. Mater. Res. Technol. 2021, 11, 1220–1231. [Google Scholar] [CrossRef]
  15. Gatellier, C.; Gaye, H.; Lehmann, J.; Pontoire, J.N.; Riboud, P.V. Physico-chemical aspects of the behaviour of inclusions in steels. Steel Res. 1993, 64, 87–92. [Google Scholar] [CrossRef]
  16. Gaye, H.; Riboud, P.V.; Welfringer, J. Use of a slag model to describe slag-metal reactions and precipitation of inclusions. Ironmak. Steelmak. 1988, 15, 319–322. [Google Scholar]
  17. Bernard, G.; Riboud, P.V.; Urbain, G. Étude de la plasticité d’inclusions d’oxydes. Rev. Métallurgie 1981, 78, 421–434. [Google Scholar] [CrossRef]
  18. Gatellier, C.; Gaye, H.; Lehmann, J.; Bellot, J.; Moncel, M. Contrôle inclusionnaire d’aciers à basse teneur en aluminium. Rev. De Métallurgie 1992, 89, 361–370. [Google Scholar] [CrossRef]
  19. Kiessling, R. Non-Metallic Inclusions in Steel; CRC Press: Boca Raton, FL, USA, 1989; pp. 194–195. [Google Scholar]
  20. Kimura, S.; Hoshikawa, I.; Ibaraki, N.; Hattori, S.; Choda, T. Fracture behavior of oxide inclusions during rolling and drawing. Tetsu-Hagané 2002, 88, 755–762. [Google Scholar] [CrossRef] [Green Version]
  21. Zhang, L.; Guo, C.; Yang, W.; Ren, Y.; Ling, H. Deformability of oxide inclusions in tire cord steels. Metallurgical and Materials Trans. B 2018, 49, 803–811. [Google Scholar] [CrossRef]
  22. Yang, W.; Peng, K.; Zhang, L.; Ren, Q. Deformation and fracture of non-metallic inclusions in steel at different temperatures. J. Mater. Res. Technol. 2020, 9, 15016–15022. [Google Scholar] [CrossRef]
  23. Scholze, H. Glass: Nature, Structure, and Properties. Springer Science & Business Media: New York, NY, USA, 2012. [Google Scholar]
  24. Kozlovskaya, E.I. Effect of composition in the elastic properties of glass. Struct. Glass 1960, 2, 299–301. [Google Scholar]
  25. DeGuire, M.R.; Brown, S.D. Dependence of Young’s modulus on volume and structure in alkali silicate and alkali aluminosilicate glasses. J. Am. Ceram. Soc. 1984, 67, 270–273. [Google Scholar] [CrossRef]
  26. Mysen, B.O.; Virgo, D.; Seifert, F.A. The structure of silicate melts: Implications for chemical and physical properties of natural magma. Rev. Geophys. 1982, 20, 353–383. [Google Scholar] [CrossRef]
  27. Winkelmann, A.; Schott, O. Ober die Elastizitat und tiber die Zug- und Druckfestigkeit verschiedener neuer Glaser in ihrer Abhangigkeit von der chemischen Zusammensetzung. Ann. Phys. 1894, 51, 697. [Google Scholar] [CrossRef] [Green Version]
  28. Appen, A.A.; Kozlovskaya, E.I.; Fu-Si, H. Study of the elastic and acoustic properties of silicates glasses. J. Appl. Chem. USSR 1961, 34, 975–981. [Google Scholar]
  29. Phillips, C.J. Calculation of Young’s modulus of elasticity from composition of simple and complex silicate glasses. Glass Technol. 1964, 5, 216. [Google Scholar]
  30. Makishima, A.; Mackenzie, J.D. Direct calculation of Young’s modulus of glass. J. Non-Cryst. Solids 1973, 12, 35–45. [Google Scholar] [CrossRef]
  31. Ashizuka, M.; Aimoto, Y.; Okuno, T. Mechanical Properties of Sintered Silicate Crystals (Part 1). J. Ceram. Soc. Jpn. 1989, 97, 544–548. [Google Scholar] [CrossRef] [Green Version]
  32. Fluegel, A. Global model for calculating room-temperature glass density from the composition. J. Am. Ceram. Soc. 2007, 90, 2622–2625. [Google Scholar] [CrossRef] [Green Version]
  33. Hwa, L.G.; Hsieh, K.J.; Liu, L.C. Elastic moduli of low-silica calcium alumino-silicate glasses. Mater. Chem. Phys. 2003, 78, 105–110. [Google Scholar] [CrossRef]
  34. Hwa, L.G.; Lu, C.L.; Liu, L.C. Elastic moduli of calcium alumino-silicate glasses studied by Brillouin scattering. Mater. Res. Bull. 2000, 35, 1285–1292. [Google Scholar] [CrossRef]
  35. Pönitzsch, A.; Nofz, M.; Wondraczek, L.; Deubener, J. Bulk elastic properties, hardness and fatigue of calcium aluminosilicate glasses in the intermediate-silica range. J. Non-Cryst. Solids 2016, 434, 1–12. [Google Scholar] [CrossRef] [Green Version]
  36. Voigt, W. Ueber die Beziehung zwischen den beiden Elasticitätsconstanten isotroper Körper. Ann. Der Phys. 1889, 274, 573–587. [Google Scholar] [CrossRef] [Green Version]
  37. Sant’Ana Gallo, L.; Célarié, F.; Audebrand, N.; Martins Rodrigues, A.C.; Dutra Zanotto, E.; Rouxel, T. In situ crystallization and elastic properties of transparent MgO–Al2O3–SiO2 glass-ceramic. J. Am. Ceram. Soc. 2017, 100, 2166–2175. [Google Scholar] [CrossRef]
  38. Rocabois, P.; Pontoire, J.N.; Lehmann, J.; Gaye, H. Crystallization kinetics of Al2O3–CaO–SiO2 based oxide inclusions. J. Non-Cryst. Solids 2001, 282, 98–109. [Google Scholar] [CrossRef]
  39. Pabst, W.; Gregorova, E.; Rambaldi, E.; Bignozzi, M.C. Effective elastic constants of plagioclase feldspar aggregates in dependence of the anorthite content: A concise review. Ceram.-Silik. 2015, 59, 326–330. [Google Scholar]
Figure 1. The XRD pattern for samples showing the glassy state of samples.
Metals 12 00522 g001
Figure 2. The measured Young’s modulus values as a function of basicity (w(CaO)/w(SiO2)).
Metals 12 00522 g002
Figure 3. The measured Poisson’s ratios values as a function of basicity (w(CaO)/w(SiO2)).
Metals 12 00522 g003
Figure 4. Comparison between measured and calculated Young’s modulus data.
Metals 12 00522 g004
Figure 5. Iso-Young’s modulus diagrams of CaO-Al2O3-SiO2 system constructed by various equations. (a) Winkmann–Schott. (b) Appen. (c) Ashizuka–Zhang. (d) Modified Appen.
Metals 12 00522 g005
Figure 6. The liquid area at 1673–1773 K and iso-Young’s modulus (in GPa) diagram calculated from modified Appen’s equation for CaO-Al2O3-SiO2 system.
Metals 12 00522 g006
Table 1. The chemical compositions of the samples investigated in the present work.
No.CaOMnOAl2O3SiO2Basicity
Mass%Mol%Mass%Mol%Mass%Mol%Mass%Mol%
12022.99----2012.646064.370.33
23034.22----2012.555053.230.6
34045.28----2012.454042.271
45061.47----4027.051011.485
5----2019.092013.296067.62
Table 2. The measured values of Young’s modulus, shear modulus, bulk modulus and Poisson’s ratios.
NoYoung’s Modulus (E)
GPa
Shear
Modulus (G)
GPa
Bulk
Modulus (K)
GPa
Poisson’s Ratio (ν)
188.835.361.30.258
294.737.071.40.279
396.437.476.30.289
4101.139.576.40.279
585.837.041.90.158
Table 3. The comparison between experimental (E) and calculated Young’s modulus values by various models (M-M: Makishima and Mackenzie, W-S: Winkelmann and Scott, A-Z: Ashizuka and Zhang, Present: the present modified Appen’s equation). Experimental data based on measurements using Resonant ultrasound spectroscopy (Ultrasonic) or by Brillouin scattering method (B-S).
CaOAl2O3SiO2Ref.MethodsEAppenPhilipsM-MW-SA-ZPresent
53.3026.7020.00[33]Ultrasonic98.02102.87114.07109.59115.21150.26103.60
51.0034.0015.00[33]Ultrasonic107.10105.38116.35117.72124.59159.50107.50
56.7028.3015.00[33]Ultrasonic110.18105.23116.64112.46117.06156.74105.28
58.4026.6015.00[33]Ultrasonic106.12105.19116.72110.87114.70155.75104.61
60.0030.0010.00[33]Ultrasonic112.99107.60119.20115.43118.97163.34106.99
63.3031.705.00[33]Ultrasonic99.81109.97121.77118.40120.78170.01108.70
22.9912.6464.37thisUltrasonic88.8081.8891.2584.3995.1096.3288.80
34.2212.5553.23thisUltrasonic94.7087.0697.1687.9894.31108.7291.11
45.2812.4542.27thisUltrasonic96.4092.16102.9791.0793.62120.2893.37
61.4727.0511.48thisUltrasonic101.10106.84118.56112.20115.09159.81105.53
58.5039.002.50[34]B-S116.40111.31122.73126.23129.43177.56112.08
57.0038.005.00[34]B-S111.90110.13121.45124.51128.52173.89111.16
55.5037.007.50[34]B-S111.00108.94120.18122.81127.57170.25110.25
54.0036.0010.00[34]B-S109.00107.75118.90121.11126.61166.63109.33
52.5035.0012.50[34]B-S106.00106.56117.63119.41125.61163.05108.42
51.0034.0015.00[34]B-S116.00105.38116.35117.72124.59159.50107.50
49.5033.0017.50[34]B-S104.20104.19115.08116.03123.54155.99106.59
48.0032.0020.00[35]Ultrasonic105.10103.00113.80114.35122.46152.50105.67
17.3016.7066.00[35]Ultrasonic88.5081.2390.1986.53102.6694.2490.04
18.9018.4062.70[35]Ultrasonic90.2082.8091.8588.90105.4098.0591.40
20.4020.1059.50[35]Ultrasonic91.9084.3493.4691.26108.05101.8292.73
21.9021.7056.40[35]Ultrasonic93.2085.8295.0293.54110.45105.5594.01
23.5022.5053.90[35]Ultrasonic94.9086.8996.1894.92111.54108.4794.83
24.7024.5050.80[35]Ultrasonic96.2088.4997.8597.63114.44112.4696.28
26.4025.7047.90[35]Ultrasonic97.5089.8799.3399.59116.03116.1397.35
27.6027.1045.30[35]Ultrasonic98.9091.11100.64101.60117.90119.4898.45
28.9028.4042.70[35]Ultrasonic100.1092.35101.95103.54119.57122.8799.50
29.9029.6040.50[35]Ultrasonic101.3093.41103.06105.28121.09125.78100.43
31.2031.1037.70[35]Ultrasonic102.4094.75104.46107.48122.93129.55101.60
32.5032.3035.20[35]Ultrasonic103.4095.94105.73109.35124.33132.95102.60
Publisher’s Note: MDPI stays neutral with regard to jurisdictional claims in published maps and institutional affiliations.

