Article

Numerical Study on the Influence of Distributing Chamber Volume on Metallurgical Effects in Two-Strand Induction Heating Tundish

1
Key Laboratory of Electromagnetic Processing of Materials, Ministry of Education, Northeastern University, No. 3-11, Wen Hua Road, Shenyang 110004, China
2
School of Metallurgy, Northeastern University, No. 3-11, Wen Hua Road, Shenyang 110004, China
*
Author to whom correspondence should be addressed.
Metals 2022, 12(3), 509; https://doi.org/10.3390/met12030509
Submission received: 17 February 2022 / Revised: 11 March 2022 / Accepted: 14 March 2022 / Published: 16 March 2022
(This article belongs to the Section Computation and Simulation on Metals)

Abstract

:
Reducing the volume of distributing chamber by shortening its width is one of the ways to obtain good metallurgical effects for a large two-strand induction heating tundish. A multi-field coupling numerical model was established to figure out the effect of distributing chamber volume on the flow field, temperature field of molten steel, and removal of inclusions. Three tundishes with distributing chamber widths of 1.216 m (tundish A), 0.838 m (tundish B), and 0.606 m (tundish C) were modeled. The results indicated that reducing the width of the distributing chamber from 1.216 m to 0.838 and 0.606 m could improve the fastest heating rate from 0.4 K/min to 0.6 and 0.8 K/min and reduce the energy consumption from 476 kWh to 444 and 434 kWh. The temperature fluctuation of molten steel in the distributing chamber rose with the decrease in distributing chamber volume during the continuous casting process. Besides, tundish B performs the best temperature uniformity. The flow field in the distributing chamber was no longer symmetrical, and a short-circuit flow appeared when the width was reduced to 0.606 m. As a result, the floating ratio and removal ratio of inclusions decreased and the ratio of inclusions flowing into the mold sharply increased in tundish C. When the width was reduced from 1.216 to 0.838 m, the floating ratio of inclusions had little change and the removal ratio increased slightly. The floating efficiency increased with the decrease in the volume of distributing chamber, and the removal efficiency is the highest in tundish B. Taken together, tundish B should be adopted.

1. Introduction

The tundish plays an essential role in promoting steel quality in the continuous casting process [1]. The induction heating tundish was developed to eliminate the negative impact of pouring temperature fluctuations on production [2,3]. Moreover, when the induction heating tundish was adopted, the tapping temperature was reduced, thereby saving energy and reducing carbon emissions. Meanwhile, constant temperature casting with low superheat was achieved, and the removal of inclusions was promoted [4].
Some studies on induction heating tundish have been conducted using numerical simulation due to its reliability and convenience. Wang [5,6] established a numerical model to simulate the electromagnetic field, fluid flow, temperature field and the motion of inclusions in a single-strand induction heating tundish. The results reveal that the electromagnetic force is asymmetrical in the channels and points to the center of the channels. Besides, the joule heat mainly located at the channels can effectively compensate for the heat loss of molten steel, and the removal ratio of inclusions with a small diameter is significantly promoted. Xing [7,8] concluded that the induction heating tundish with bent channels performs better metallurgical effects than that with straight channels. Taking a 16 tons single-strand channel type induction heating tundish as the research object, Yang [9,10,11] obtained the effective active zone of the magnetic field, it contains the channels and the zones nearby the walls connected with the channels. Moreover, they found that the electromagnetic force located at the upper area of the channel throats is larger and inhibits the ascent of the mainstream of molten steel in distributing chamber. The fastest heating rate is 1.65 K/min with a heating power of 600 kW. Suffering from the power limitation of the induction heater, the capacity of the induction heating tundish is usually less than 20 tons to replenish the heat loss of molten steel quickly. Several large-scale induction heating tundishes were researched. Yang [12,13,14] studied a two-strand induction heating tundish of about 50 tons and paid more attention to the inclusions behavior. The results indicate that the Archimedes collision is one of the important collision mechanisms for inclusion coalescence. Yue [15] and Wang [16,17] studied a T-type multi-strand induction heating tundish of about 34 tons, the basic characteristics of electromagnetic field, flow field, and temperature field were revealed. The results show that the temperature uniformity of molten steel in the distribution chamber is poor. However, the challenges encountered in large-scale induction heating tundish, such as heating efficiency, have not been investigated.
The two-strand induction heating tundish for slab casting belongs to large-scale induction heating tundish, and it needs higher heating efficiency, more energy-saving, and faster and more removal of inclusions to accommodate continuous casting. A two-strand slab continuous casting induction heating tundish in a plant faced with these problems, and it needs to be optimized. Reducing the volume of distributing chamber may be an approach to improve the metallurgical effects for large-scale two-strand induction heating tundish. When optimizing the structure of traditional two-strand slab continuous casting tundish, the width of the tundish is usually modified, and the width is generally between 0.6–1.5 m [18,19,20]. Therefore, we changed the tundish volume by modifying the width of the distributing chamber to verify whether this method can produce desirable metallurgical effects in a large-scale two-strand slab continuous casting induction heating tundish. Naturally, several questions are opened:
  • Will this method promote the heating efficiency and temperature uniformity of molten steel in the distributing chamber?
  • How does decreasing the width of the distributing chamber affect the flow pattern, temperature field, removal of inclusions, and energy consumption?
In order to figure out these questions, the authors were motivated to develop a comprehensive numerical model containing electromagnetic field, flow, heat transfer, and the movement of inclusions. Based on the production of a factory, three structures of the two-strand induction heating tundish were studied in the present work, and the energy consumption of different tundishes was estimated. One way coupled Lagrange way was employed to track the movement of inclusions. Critical velocity of inclusion was adopted to judge the removal of inclusions at the slag-steel interface, instead of the complete adsorption used in previous research.

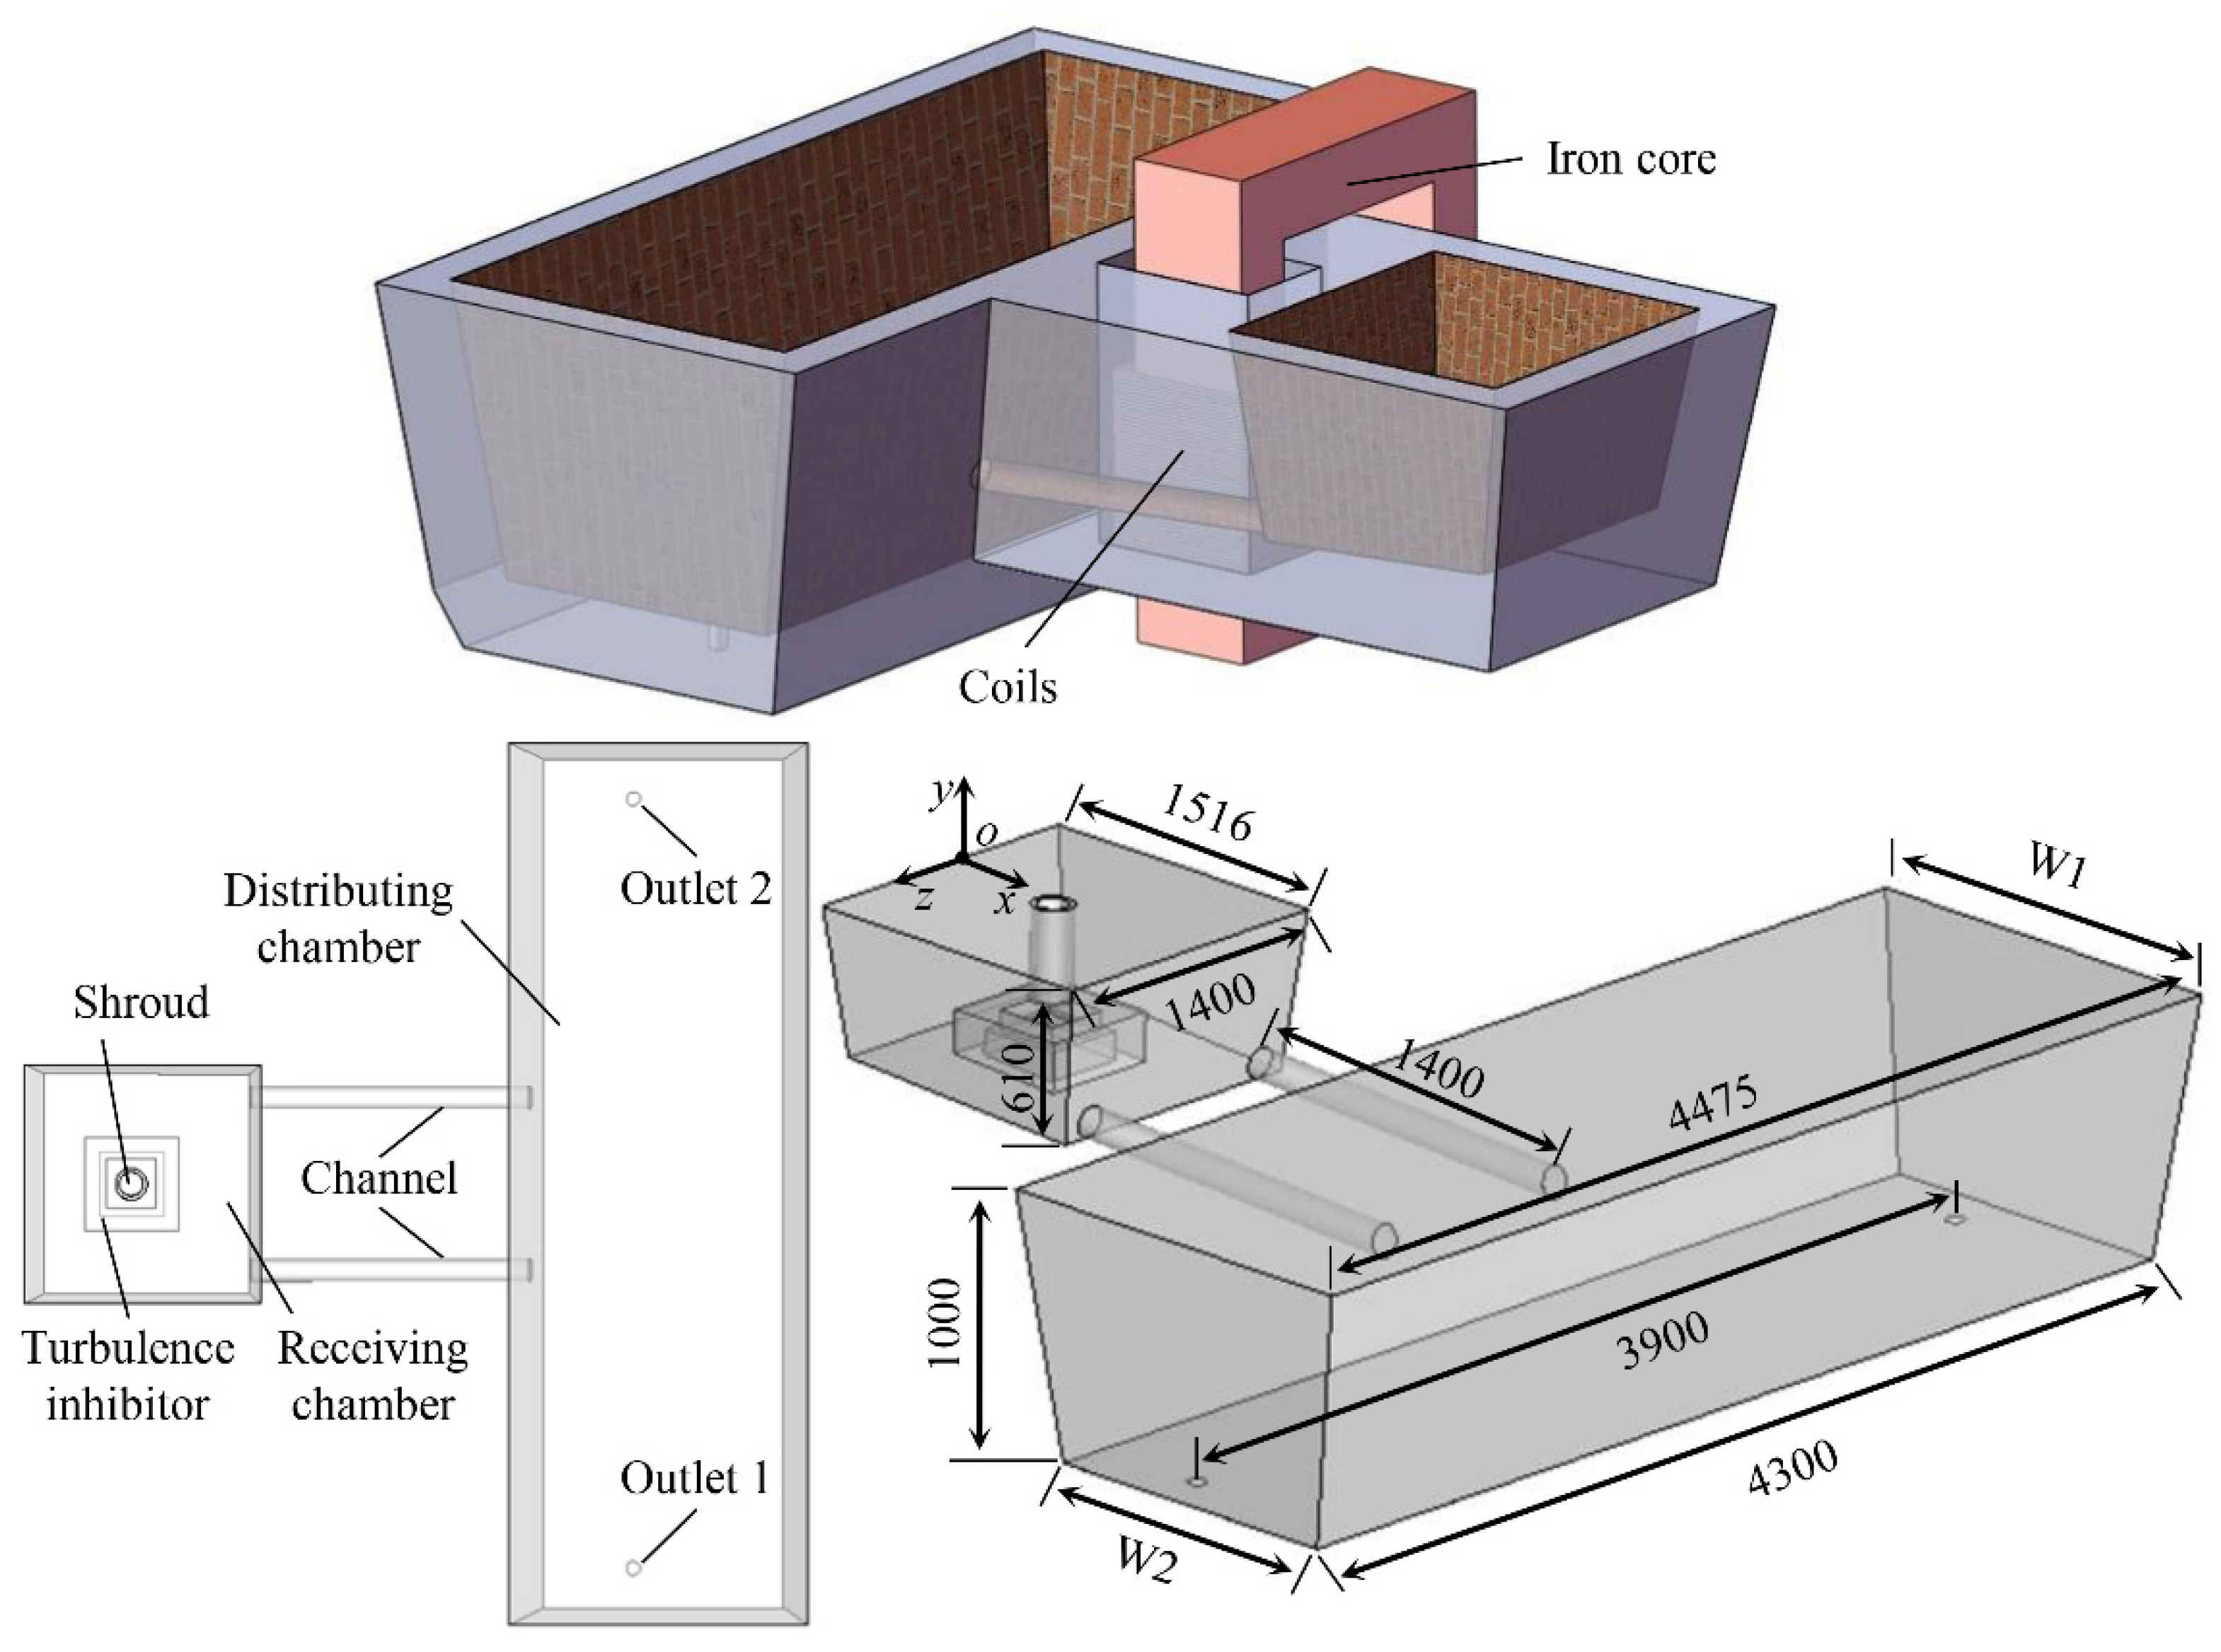
2. Configuration and Numerical Set-Up

2.1. Model Configuration and Material Properties

Figure 1 shows the configuration and coordinate system adopted in the numerical simulation. Besides, the schematic diagram of the entire induction heating tundish system is also depicted. This system mainly consists of tundish and induction heating apparatus that includes iron core and coils. The tundish consists of shroud (inlet), receiving chamber, turbulence inhibitor, channels, distributing chamber, and submerged nozzles (outlet 1 and outlet 2). Some detailed parameters and the material properties are listed in Table 1 [10,11]. The origin (o) is located at the leftmost center of the free surface. The x-axis, y-axis, and z-axis are perpendicular to the cross section, longitudinal section and free surface of the tundish, respectively.

2.2. Numerical Set-Up

2.2.1. Assumptions

The following assumptions were made:
(1)
The molten steel was considered to be homogeneous, viscous, and incompressible fluid. Besides, the physical properties of molten steel (such as density, viscosity, specific heat, and thermal conductivity) were constant with temperature.
(2)
The slag layer was not modeled, so, the free surface was smooth and the effect of slag on the molten steel was neglected
(3)
The inclusions were rigid spheres, and they did not affect the flow of molten steel. Besides, the collision and aggregation of the inclusions were neglected.
(4)
The influence of fluid flow on the electromagnetic field was ignored for the Magnetic Reynolds number in this system, which was much smaller than 1 [21].

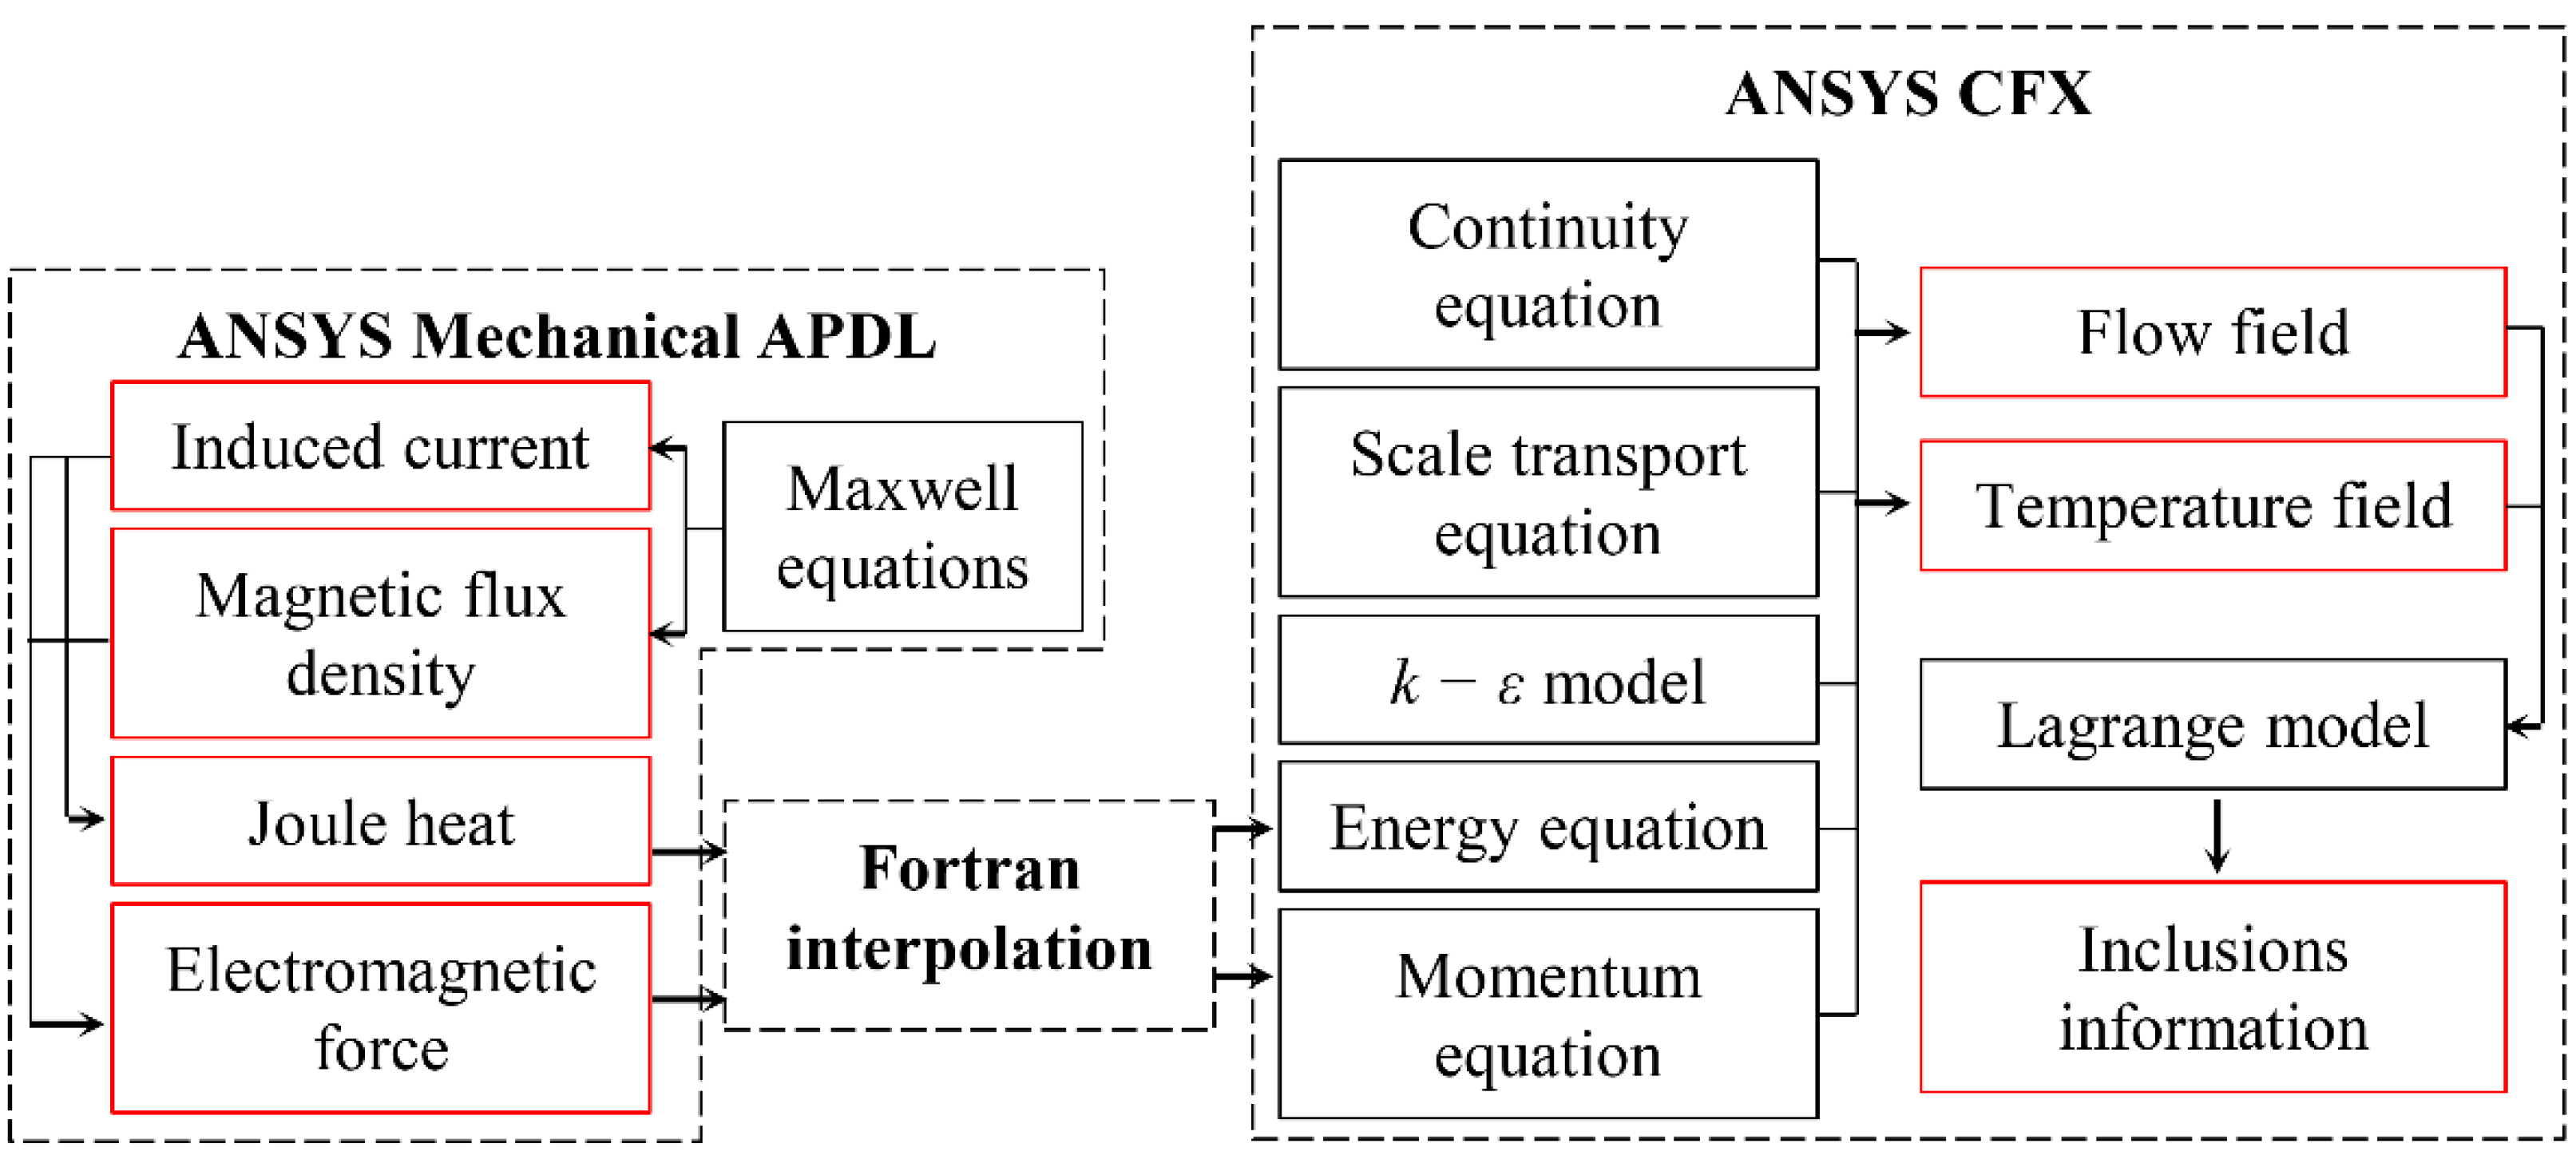
2.2.2. Governing Equations

The Maxwell equations were solved to obtain the electromagnetic field, it can be found in our previous work [22,23,24]. The time-average electromagnetic force Fmag and the Joule heat Qv were calculated as:
F mag = 1 2 ( J r B r + J i B i )
Q v = 1 2 σ ( J r J r + J i J i )
where Jr and Ji are the real and imaginary components of the induced current, and Br and Bi denote the real and imaginary components of the magnetic flux density, respectively. σ is the electric conductivity. In addition to the electromagnetic force, thermal buoyancy was also taken into account when simulating the transport behavior of molten steel. Besides, Qv was set as the source term of the energy equation to examine the effect of thermal effects of induction heating on the transport behavior of molten steel. Therefore, the transport equations can be written as:
u = 0
( ρ u ) t + ( ρ u u ) = P + ( μ l + μ t ) 2 u + [ ρ β ( T T ref ) g ] + F mag
c P [ ( ρ T ) t + ( ρ u T ) ] = ( λ T ) + Q v
where u, P, ρ, β, T, Tref, λ, and cP represent the velocity, pressure, reference density, thermal expansivity, temperature, reference temperature, thermal conductivity, and specific heat capacity of molten steel, respectively; t is time; g is the gravitational acceleration. The third term on the right-hand of Equation (4) represents the thermal buoyancy. μl and μt are the viscosity and the turbulent viscosity, respectively. Moreover, μt can be expressed as:
μ t = ρ C μ k 2 ε
where Cμ is a constant to 0.09; k and ε are the turbulent kinetic energy and turbulent dissipation rate, respectively, and they come from the standard kε model [25,26,27]:
( ρ k ) t + ( ρ u k ) = [ ( μ l + μ t + μ t σ k ) k ] + G k ρ ε
( ρ ε ) t + ( ρ u ε ) = [ ( μ l + μ t + μ t σ ε ) ε ] + ε k ( C 1 G k C 2 ρ ε )
where C1, C2, σk, and σε have constant values 1.44, 1.92, 1.0, and 1.3, respectively. Gk is the turbulence production due to viscous forces, and it can be expressed by:
G k = μ t ( u i x j + u j x i ) u i x j
To simulate the dispersion of the tracer, a scalar transport equation was introduced, written as follows [28,29,30]:
( ρ φ ) t + ( ρ u φ ) = [ ( ρ D Φ + μ t S c t ) φ ]
where Φ is the concentration of the tracer, and φ = Φ/ρ; DΦ, equaling to 5.51 × 10⁻⁸ m2/s, is the kinematic diffusivity of the tracer; Sct, equaling to 1, is the turbulence Schmidt number.
A Lagrange way was employed to track the movement of inclusions. The equations can be expressed as:
ρ p π d p 3 6 d u p d t = π 8 C D ρ d p 2 | u u p | ( u u p ) + π 6 d p 3 ( ρ ρ p ) g + π 12 ρ d p 3 ( d u d t d u p d t ) + ρ p π d p 3 6 ρ ρ p u p u 3 4 π d p 3 6 F mag
C D = { 24 R e p R e p 0.1 max [ 24 R e p ( 1 + 0.15 R e p 0.687 ) , 0.44 ] 0.1 < R e p < 1000 0.44 R e p 1000
R e p = ρ d p | u u p | μ l
where dp, ρp, and up denote the diameter, density, and velocity of the particle, respectively; CD is the drag coefficient; Rep is the particle Reynolds number. When tracking the inclusions, the influence of turbulence on the movement of inclusions was taken into account by dividing the velocity of molten steel into mean and fluctuating velocities. The mean ( u ¯ ) and fluctuating (u) velocities can be expressed as:
u = u ¯ + u
u = Γ ( 2 k 3 ) 0.5
where Γ is a normal distribution function between −1 and 1.

2.2.3. Numerical Procedures and Boundary Conditions

The numerical simulation of the electromagnetic field was conducted by using ANSYS Mechanical APDL (ANSYS, Inc., Canonsburg, PA, USA). The Edge-Based method was used; the element type was SOLID236; the analysis type was harmonic; the sparse solver was used and the convergence tolerance was set as 10−8. Besides, a large enough air box, surrounding the tundish, was drawn as the outer boundary where the magnetic flux density was considered as 0 T; the excitation current was a single-phase alternating current of 50 Hz. The simulation of transfer phenomena was conducted by ANSYS CFX (ANSYS, Inc., Canonsburg, PA, USA). The convergence criteria was 1 × 10⁻⁵; the time step was small enough (Δt = 1 × 10⁻⁴ s) at the beginning, and gradually increased to 0.2 s when the calculation was stable. In each time step, the information on inclusions was computed after the computational convergence of the flow and temperature fields. A uniform velocity of 0.4 m/s was applied at the inlet. Constant area-averaged static pressures were fixed at the outlets. The free surface and the walls were set as free slip wall and no-slip walls, respectively. The heat flux at the free surface, bottom, longitudinal walls, transversal walls, and channel walls were 15, 1.8, 4.6, 4.0, and 0.2 kW/m2, respectively [10]. The inlet temperature and initial temperature were both 1748 K. The collisions between the inclusions and the walls were completely elastic. The inclusions were considered to be trapped at the free surface when their velocity exceeds a threshold value [31,32,33,34,35]. When the inclusions reached the outlets, they were considered to have escaped from the tundish into the mold, naturally they were no longer tracked. The coupling of electromagnetic field, fluid flow, and heat transfer were performed by a self-written program. The time-averaged electromagnetic force and Joule heat obtained from ANSYS Mechanical APDL (ANSYS, Inc., Canonsburg, PA, USA) were interpolated into ANSYS CFX (ANSYS, Inc., Canonsburg, PA, USA), and they were set as the source terms of the momentum and energy equations, respectively. The calculation diagram is shown in Figure 2.

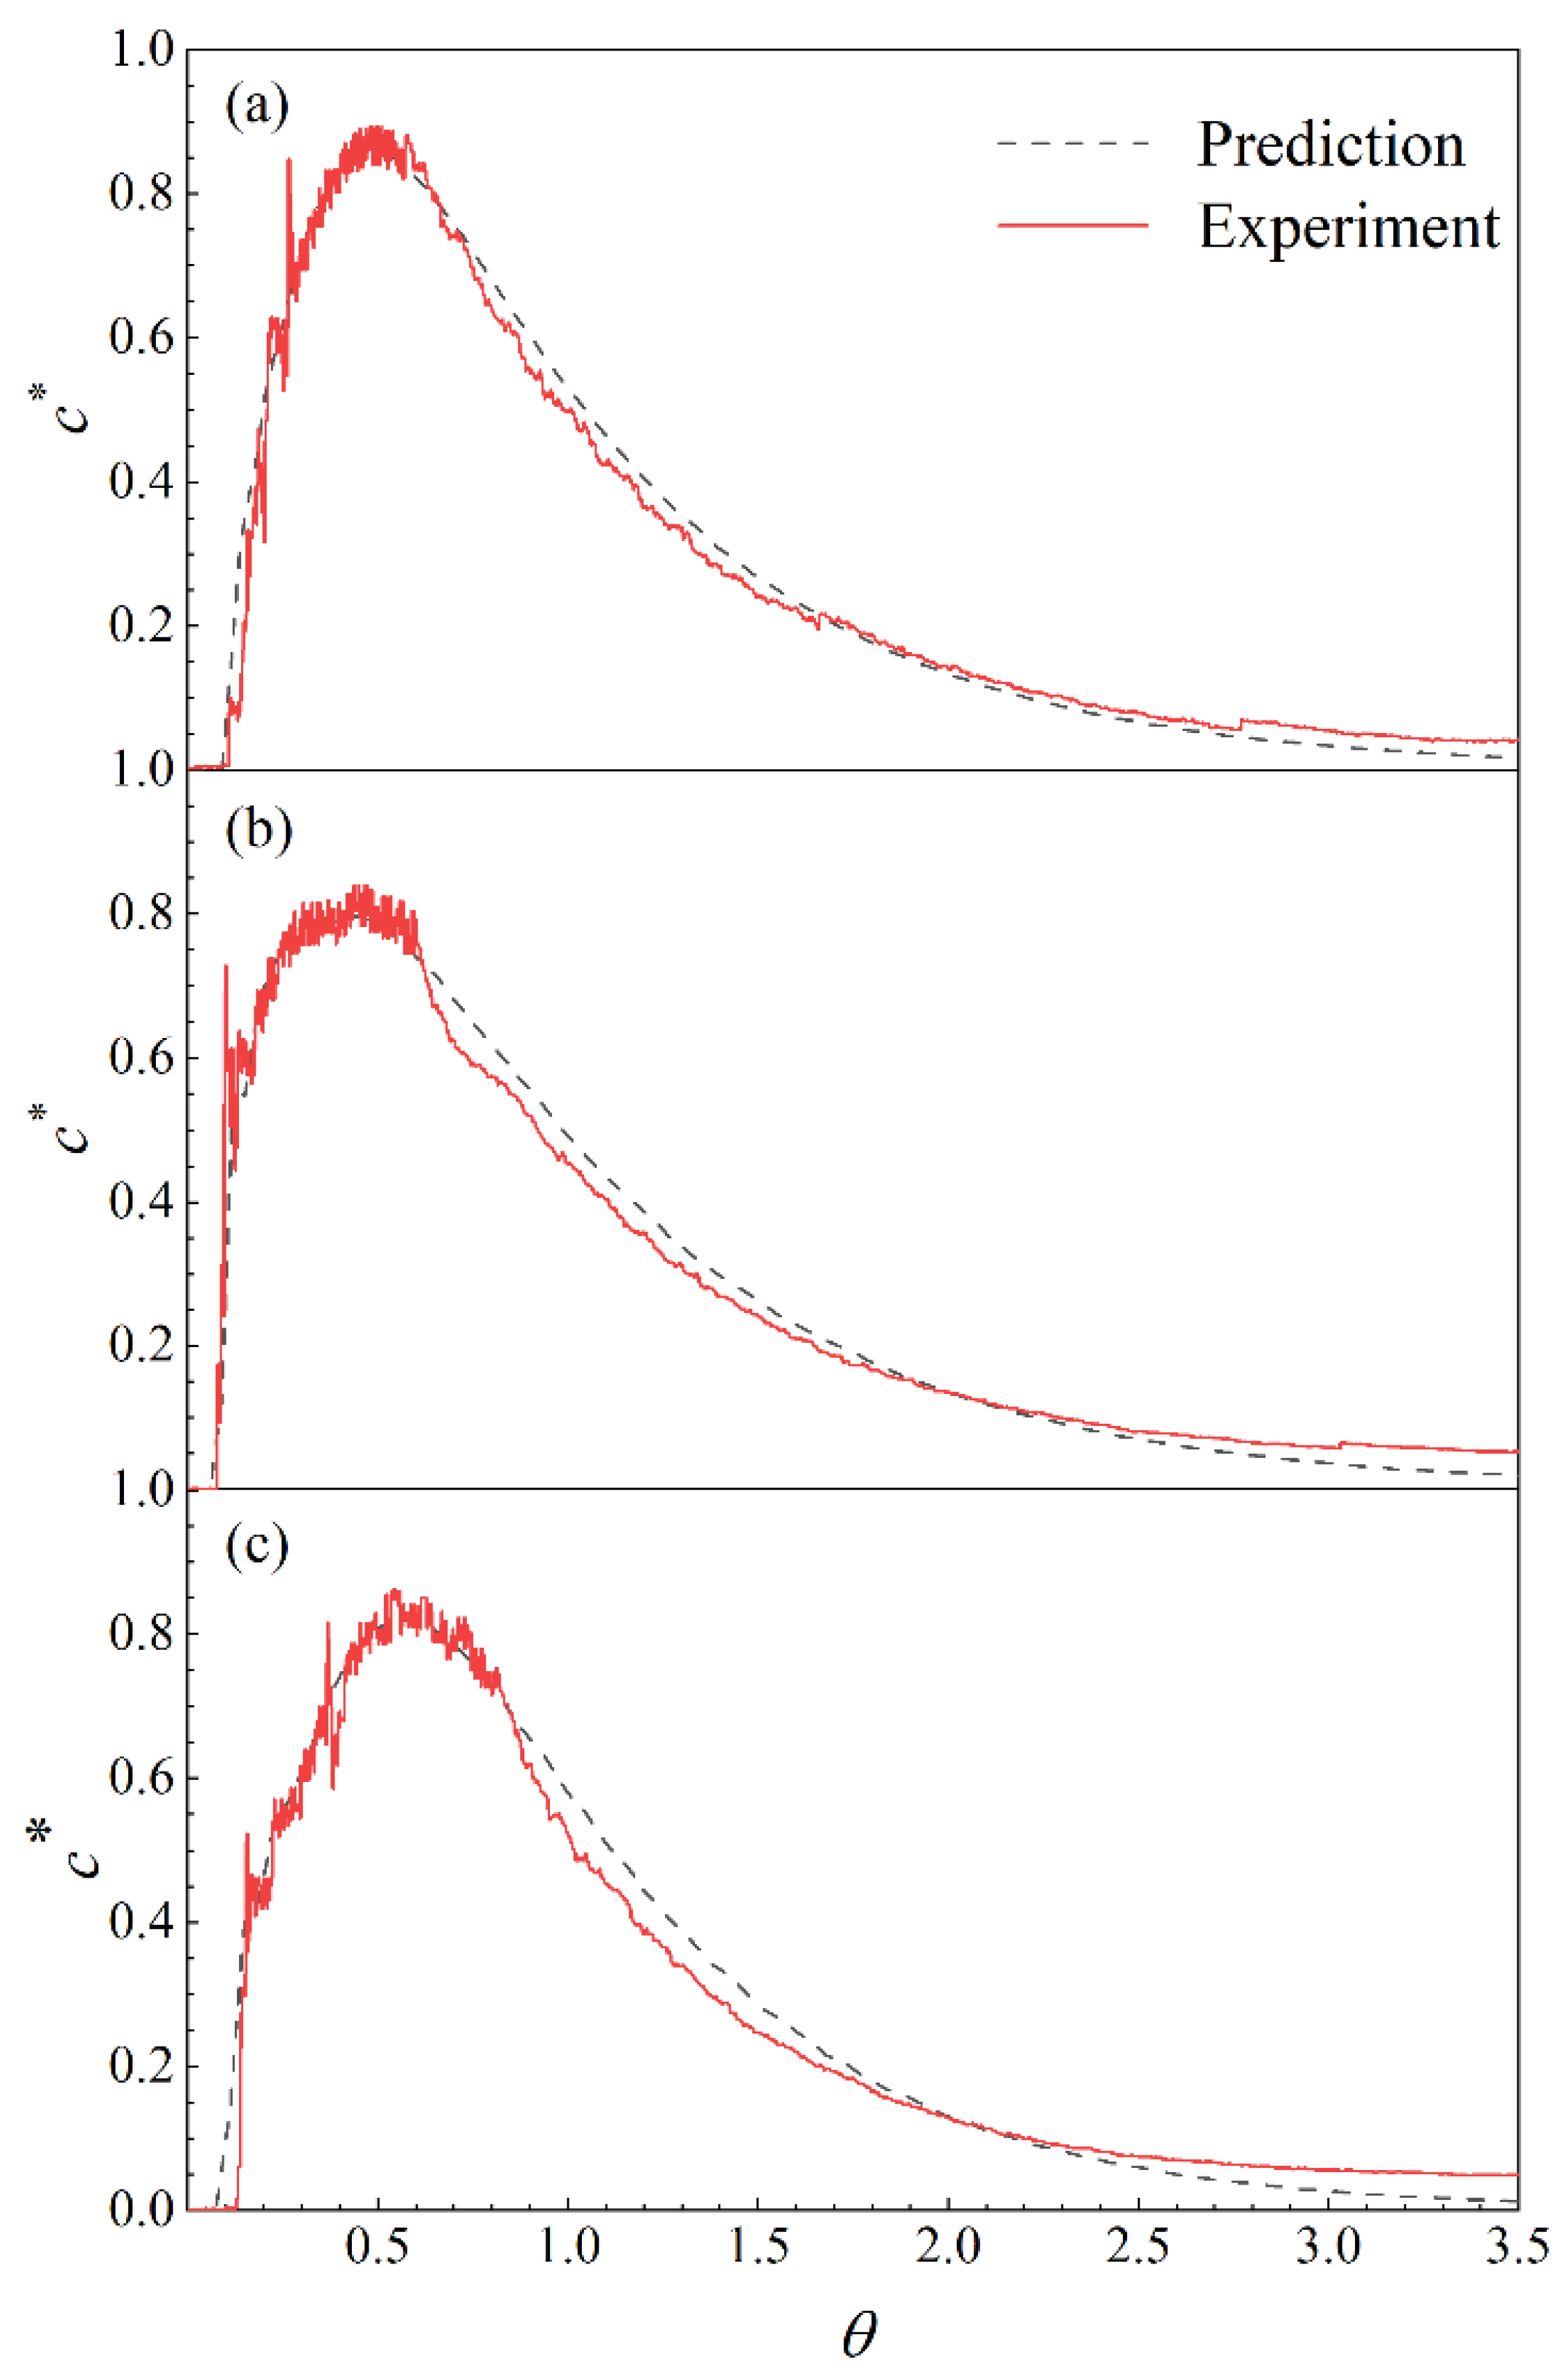
2.3. Mesh Sensitivity Test and Model Validation

A mesh sensitivity test was carried out to determine the required number of elements in the simulation. The structures of the three tundishes A, B, and C are similar, and the difference is the size of the distributing chamber. Therefore, the tundish A is used as the test object, and four sets of calculations with element numbers of 532,430 (Mesh 1), 692,166 (Mesh 2), 899,818 (Mesh 3), and 1,124,762 (Mesh 4) were compared. Table 2 shows the errors of different variables at the extension lines of the channels center relative to the case with Mesh 4 that has the finest mesh. The results show that the errors decrease with the increase in element numbers, and the errors of the cases with Mesh 2 and 3 are less than 5%. Therefore, all the simulations about tundish A were based on mesh Mesh 2, which ensures good precision at a reasonable computational cost. The elements’ size of tundishes B and C are the same as that of tundish A, and their element numbers are 552,486 and 505,926, respectively.
According to similar principles and laboratory conditions, a 1/5 scaled-down model was established for isothermal water simulation experiments. The schematic diagram of the experimental setup is shown in Figure 3. When the flow kept stable, 30 mL of saturated NaCl solution was injected as a tracer from the inlet of the tundish, while the tracer concentration was measured at the outlets using DDSJ-308A conductivity meters (INESA Scientific Instrument Co., Ltd, Suzhou, China). In addition, the x component of the water velocity (ux) along the extension line of the exit center of the channel was measured by DOP2000 ultrasonic Doppler velocimetry (signal processing S.A., Savigny, Switzerland). Figure 4 shows the calculated and experimental RTD (residence time distribution) of tundishes A, B, and C. The variables θ and c* on the x-axes and y-axes denote dimensionless time and dimensionless concentration, respectively, and they can be expressed as:
θ = t q V t
c * = c ρ w V t ρ s V s c s
where q, Vt, c, ρw, ρs, Vs, and cs denote the volume flow rate of water, volume of tundish, concentration of the tracer, density of water, density of saturated NaCl solution, volume, and concentration of saturated NaCl solution, respectively. The calculated RTD are in good agreement with the measured values. Moreover, Figure 5 depicts the calculated and measured x component of the water velocity along the extension line at the center of the channel outlet of the water model for tundish A. The calculated values also match well with the measured values.

3. Results and Discussion

3.1. Flow Field in Distributing Chambers of Different Tundishes

Our previous studies [9,11] about single-strand dual channel type induction heating tundish indicated that the effective active area of the magnetic field consists of the channels and the area near the walls connected with the channels; the electromagnetic force and Joule heat mainly distribute in the channels. That is to say, the volume of distributing chamber has little influence on the electromagnetic characteristics. These three two-strand induction heating tundishes are similar in structure to the single-strand induction heating tundish, with the main difference being the size of the distributing chamber. Consequently, the distribution of electromagnetic field is similar between them, and it is no longer analyzed in this paper. However, emphasis is laid on the effect of distributing chamber volume on flow field, temperature field, and removal of inclusions when the induction heating is applied (the heating power is 600 kW).
Figure 6 depicts the three-dimensional streamline in the distributing chambers of the tundishes. Figure 7 illustrates the transport and diffusion process of the tracer in the distributing chambers. In tundish A, the molten steel exiting the channels first descends and hits the bottom, and then flows to the front wall (see Figure 7a). This is consistent with our previous studies about single-strand dual channel type induction heating tundish. When the two mainstreams strike the front wall, a larger stream forms and rises along the front wall to the free surface (see Figure 7b). Then, the mainstream splits into two parts and flows to the back and side walls, forming a large vortex (see Figure 6a and Figure 7c–e).
In tundish B, the width of distributing chamber is shorter than that of tundish A. As a result, the molten steel exiting the channels descends and strikes the front wall directly (see Figure 7f). Subsequently, a part of the steel flows directly at the bottom of the tundish to both sides. Then, it hits the side walls and moves backward and upward, forming two vortices on both sides of the distributing chamber. More molten steel rises to the free surface along the front wall and flows backwards, forming a large vortex (see Figure 6b and Figure 7g–j).
In fact, the two mainstreams formed by the molten steel flowing out of the channels are not completely symmetrical; the stream on the outlet 1 side is slightly higher (see Figure 7a,f,k and Figure 8), this stems from the asymmetry of the flow field at the outlet of the channels (see Figure 9), which may be related to the installation position of the induction heater. This asymmetry phenomenon has little effect on the overall flow field in the distributing chambers of tundishes A and B. However, due to the reduced width of the distributing chamber, this asymmetric phenomenon has a greater impact on the overall flow pattern in the distributing chamber of the tundish C. The flow field in the distributing chamber of tundish C is more asymmetrical than that in the distributing chambers of tundishes A and B. Compared with the lower mainstream, the higher mainstream has a higher impact point on the front wall. Then, the molten steel impinging on the front wall flows upwards, downwards, and to the side of the outlet 1, forming a vortex. When the lower mainstream strikes the front wall, more molten steel flows to both sides at the bottom of the distributing chamber, and then rises to the free surface after hitting the side wall. In addition, because the outlets are closer to the front wall, a short-circuit flow is more likely to occur in the distributing chamber of the tundish C. It may not be conducive to the removal of inclusions.

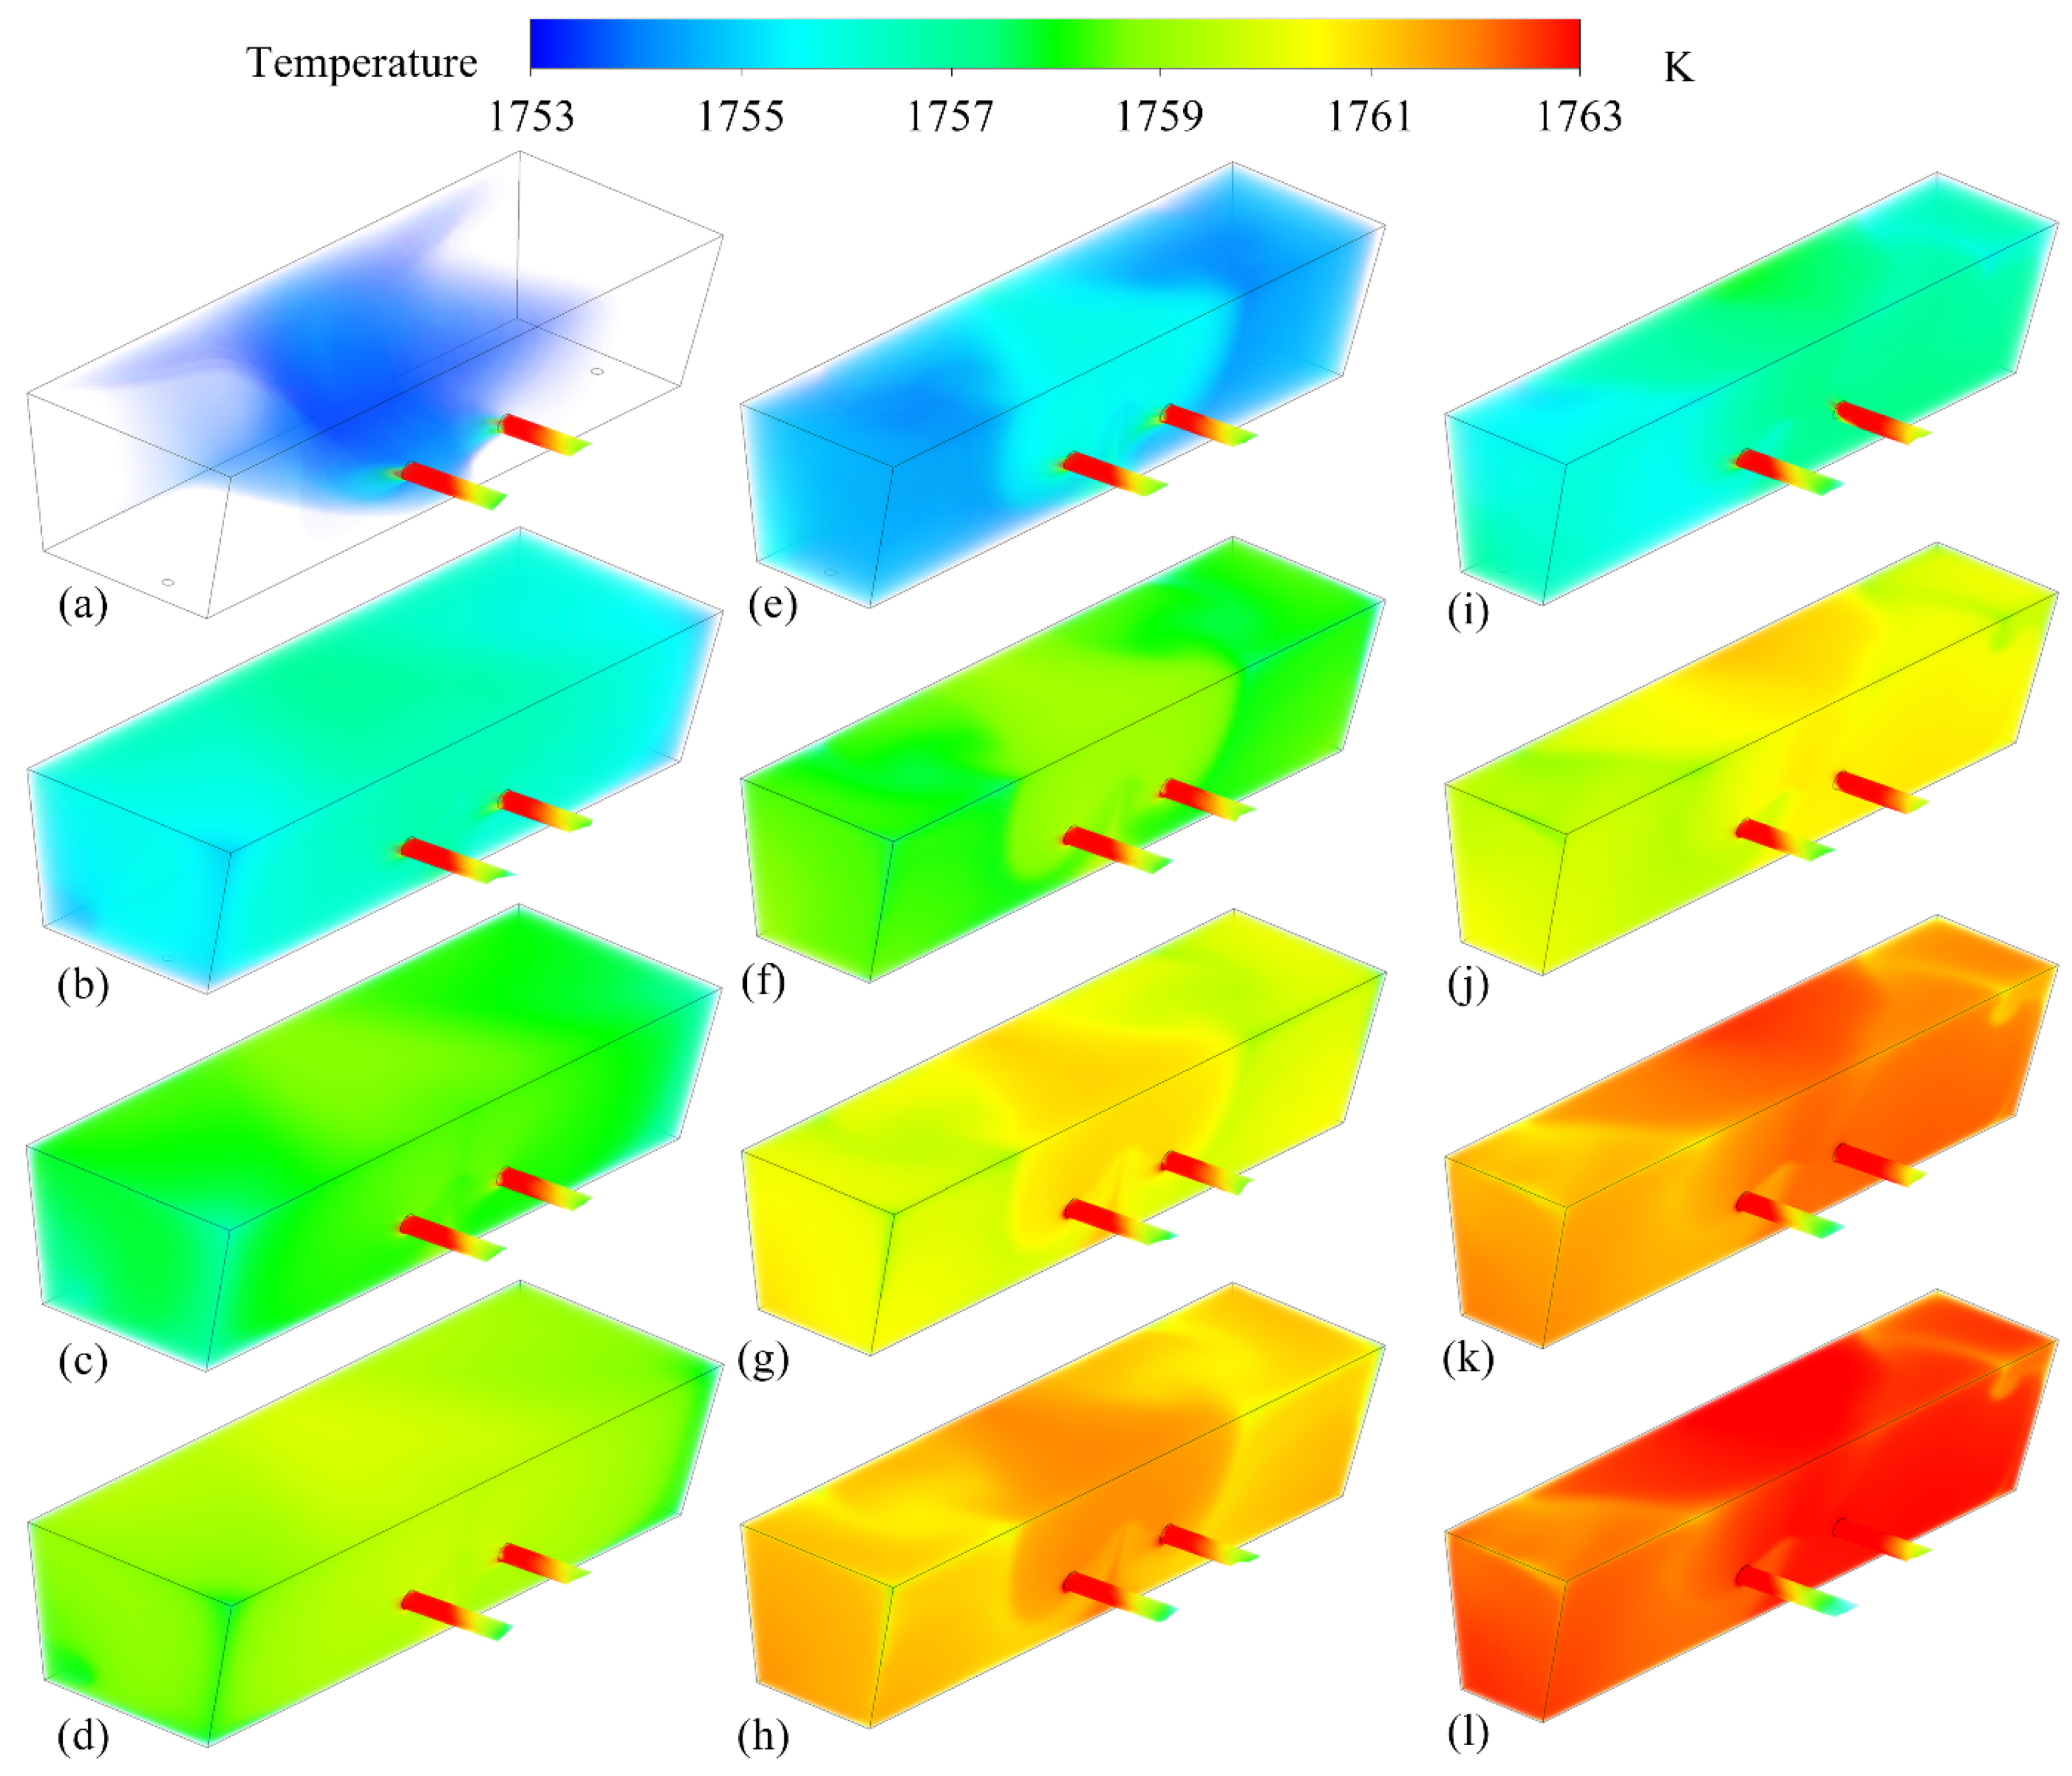
3.2. Effect of Distributing Chamber Volume on Temperature Field

3.2.1. Temperature Field at Constant Inlet Temperature and Single Power

Figure 10 describes the variation of the molten steel bulk temperature in the distributing chambers. Studies on channel induction heating tundish indicate that the Joule heat mainly distributes in the channels, and the molten steel is heated as it flows through the channels [5,11]. As a result, the temperature of the molten steel is the highest at the outlets of the channels. The molten steel with higher temperature flows into the distributing chamber can increase the bulk temperature of the molten steel in the distributing chamber. Therefore, the smaller the distributing chamber is, the higher the bulk temperature of the molten steel in the distributing chamber is for the same heating power and time, and the faster the molten steel will heat up. Affected by the flow field, the temperature field of molten steel in the middle area of the distributing chamber of tundish A is the highest. Moreover, the closer to the sides, the lower the temperature is. In tundishes B and C, the temperature of molten steel in the middle area of the distributing chamber is the highest, followed by the areas nearby side walls, and it is the lowest at rest areas. Besides, the temperature of the molten steel in the distributing chamber of tundish C is higher on the side close to outlet 1.
Figure 11 illustrates the statistics on temperature of the molten steel in the distributing chamber. The maximum temperature of the molten steel in the distributing chamber changes little; the minimum and average temperatures gradually increase with time and the rising speed decreases, while the temperature difference of molten steel declines gradually. The volume of the distributing chamber has little effect on the maximum temperature of the molten steel. However, the smaller the distributing chamber is, the higher the minimum and average temperature of the molten steel is, and the smaller the temperature difference is.
Figure 10 and Figure 11 describe the bulk temperature variation of molten steel in the distributing chamber with different volume. Temperature uniformity reflects the mixing effect of molten steel in the distribution chamber. Besides, the more uniform the temperature is, the easier it is to maintain the consistency of the outlet temperature. This is crucial for a two-strand tundish to produce high quality slab. Figure 12 depicts the standard deviation of the temperature distribution of the molten steel in the distributing chamber at different time to illustrate the influence of the distributing chamber volume on the temperature uniformity of molten steel. It can be seen that the temperature distribution of molten steel in the distributing chamber becomes more and more uniform with the extension of heating time. Furthermore, the smaller the distributing chamber is, the better the temperature uniformity of the molten steel is.
The climbing speed of the molten steel temperature at the tundish outlets is usually used to evaluate the heating efficiency of the induction heating tundish. Figure 13 shows the temperature variation of the molten steel at the tundish outlets. It is consistent with the change trend of bulk temperature of the molten steel in the distributing chamber. The heating rate is from fast to slow with time, and the fastest heating rates of tundishes A, B, and C are about 0.4, 0.6, and 0.8 K/min, respectively.
This section clearly shows that reducing the volume of the distribution chamber can significantly improve the heating efficiency. Moreover, in the ideal cases (the tapping temperature and heating power do not change with time), the temperature uniformity of the molten steel in the distribution chamber increases as the volume of the distribution chamber decreases.

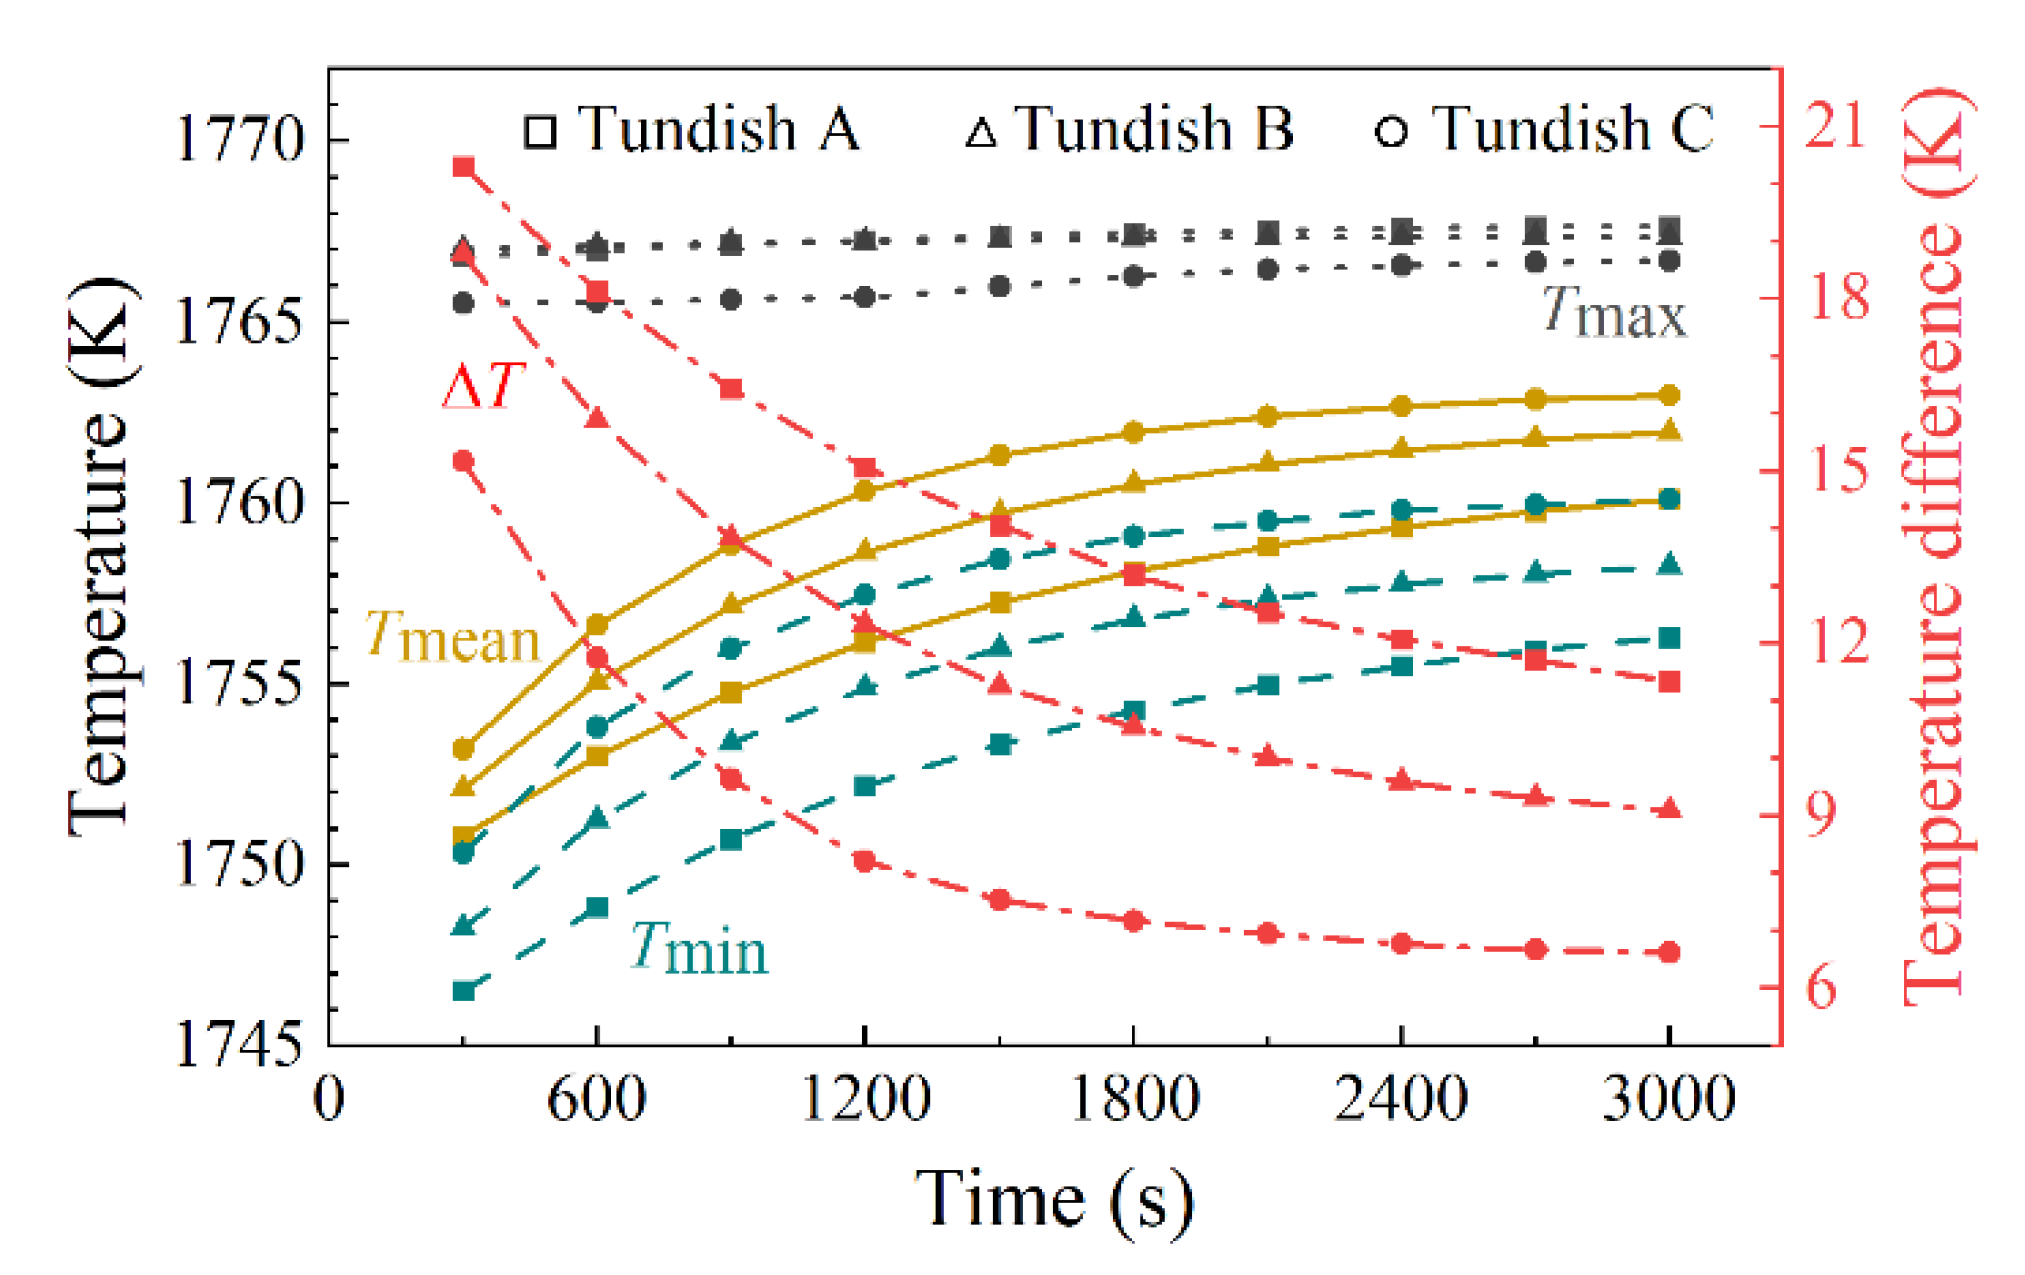
3.2.2. Temperature Field with Descending Ladle Tapping Temperature and Dynamic Power

The previous section explored the temperature distribution of the molten steel in the distributing chamber under ideal conditions (with constant tapping temperature and heating power). While engineers are more concerned about the temperature change of molten steel in the distributing chamber under actual conditions (with descending tapping temperature and dynamic power). When using an induction heating tundish during continuous casting process, it is generally desirable to maintain the casting temperature within ±3 K of the target temperature. There are many power curves to achieve this goal. In the application of single strand induction heating tundish, better metallurgical effect and energy-saving effect can be obtained by using the continuous and step-up heating power [10]. Therefore, we assumed that the initial ladle tapping temperature was 1748 K; the drop rate of the tapping temperature was 0.5 K/min [10]; the casting temperature was maintained at 1748 ± 3 K. Under these conditions, the effect of the distributing chamber volume on the temperature field of the molten steel in the distributing chamber was evaluated. Figure 14 shows the power curves applied for different tundishes and its corresponding casting temperature. The heating power applied in tundishes A, B, and C at different time is listed in Table 3. It takes about 3000 s to pour a ladle of molten steel, and the total energy consumption is 476, 444, and 434 kWh when using tundishes A, B, and C, respectively. In tundish A and B, the temperature of molten steel at the two outlets is the same during the pouring. Although the temperature difference of the molten steel between the two outlets of the tundish C reaches about 0.5 K, this value is within the allowable range. Therefore, reducing the volume of the distributing chamber is beneficial for energy-saving. Moreover, the consistency of the outlet temperature of the tundishes A, B, and C are all desirable.
Figure 15 describes the statistics on temperature of the molten steel in distributing chamber when the tapping temperature gradually drops. The maximum temperature of the molten steel appears similar in different distributing chambers. It should be noted that the difference between them at 1500 and 2700 s is due to the different heating power applied to the tundishes at these moments. The minimum and average temperatures fluctuate less, compared with the maximum temperature. During the pouring, the temperature fluctuation of the molten steel in the distributing chambers of tundishes A, B, and C gradually increases, and the standard deviations of the temperature distribution are 0.76, 0.91, and 0.99 K, respectively.
Figure 16 illustrates the standard deviation of the temperature distribution of the molten steel in the distributing chamber at different time when the tapping temperature gradually drops. It is clear that the temperature of the molten steel in the distributing chamber becomes more and more uniform with time when the heating power is constant; changing the heating power makes the temperature uniformity of the molten steel worse. In general terms, the temperature uniformity of the molten steel in the distributing chamber of tundish A is the worst, followed by tundish C, and tundish B is the best during the continuous casting process.
This section indicates that the total energy consumption declines as the volume of distributing chamber decreases. Certainly, the marginal benefit of energy-saving by reducing the volume of the distributing chamber is low. The fluctuation of bulk temperature in the distributing chamber rises with the decrease in distributing chamber volume. Tundish B performs the best temperature uniformity of the molten steel in the distributing chamber during the continuous casting process. In conclusion, from the perspective of temperature field, tundish C performs the best metallurgical effects. Because reducing the volume of the distribution chamber is beneficial to improve the heating efficiency and reduce energy consumption. Besides, in terms of the current research subject, the temperature fluctuation and temperature uniformity of the molten steel in the distribution chamber are acceptable when the width of the distributing chamber is reduced to 0.606 m.

3.3. Removal of Inclusions in Different Distributing Chambers

The tundish plays a vital role in affecting the cleanliness of the molten steel. Therefore, the removal of inclusions must be facilitated as much as possible when optimizing the tundish structure. The removal of inclusions in the tundish mainly relies on the absorption of tundish covering flux, hence the inclusions need to float to the free surface first and reach the critical velocity. Consequently, identifying how much inclusions can rise to the free surface becomes an important issue for evaluating the tundish structure. The difference between the tundishes A, B, and C is the volume of the distributing chamber, so it is only necessary to compare the behavior of the inclusions in the distributing chamber.
Figure 17 describes the floating ratios of inclusions in different distributing chambers. Because the Stokes numbers of the inclusions in this calculation are much less than 1, the inclusions are mainly dragged by the molten steel. Consequently, the diameter of inclusions has little effect on the floating ratio. The floating ratios of inclusions in the distributing chambers of tundishes A and B are basically the same, reaching more than 96%. Since the molten steel is more likely to form a short-circuit flow in the distributing chamber of tundish C, the floating ratios of the inclusions is only about 80%.
The inclusions need to float up to the steel–slag interface not only as much as possible, but also as quickly as possible. The floating efficiency that reflects how fast the inclusions float up is also important to evaluate the tundish. In order to reveal the floating efficiency of inclusions in different tundishes, the ratio of floating inclusions in 20 s to all inclusions was counted every 20 s. Figure 18 shows the results. As can be seen, the diameter of inclusions also has little effect on the floating efficiency because the floating speed of inclusions depends almost entirely on the flow field of the molten steel. In tundish C with the smallest distributing chamber, the floating distance of the inclusions is the smallest. Therefore, inclusions float the fastest in the distributing chamber of tundish C (as shown in Figure 18c). Although the distributing chamber of the tundish B is smaller than that of tundish A, part of the molten steel flows to both sides first, and then rises after hitting the side walls when the mainstream of molten steel strikes the front wall. Consequently, in the first 20 s, inclusions float more in the distributing chamber of tundish A than in the distributing chamber of tundish B. While the inclusions float up more in the distributing chamber of tundish B within 40–240 s (see Figure 18b), which benefits from the smaller distribution chamber of tundish B. Moreover, there are about 2% of inclusions that need more than 600 s to float up in the distributing chamber of tundish A (see Figure 18a). In conclusion, reducing the width of the distributing chamber is beneficial to improve the floating efficiency of inclusions.
As mentioned in Section 2.2.3, inclusions can only be removed if they rise to the free surface and reach the critical velocity, and this critical velocity decreases with the increase in inclusion size. Figure 19 represents the removal ratios of inclusions in different chambers. It is clear that the removal ratios of inclusions increase with the increase in particle size. Similar to the law of floating ratio, the removal ratios of inclusions in the distributing chambers of tundishes A and B are significantly higher than that in the distributing chamber of tundish C. In addition, the removal ratios of inclusions in the distributing chamber of tundish B are slightly higher than that in the distributing chamber of tundish A. This may be because the front wall of the distributing chamber of tundish B is closer to the channel outlet. Thus, the upward flow velocity of the molten steel is higher, and the velocity of inclusions is higher, thereby the removal ratio of inclusions is higher.
As with floating efficiency, the removal efficiency was also revealed. It directly reflects the influence of distributing chamber volume on the removal of inclusions. Figure 20 displays the removal efficiency of inclusions. The ratio of the inclusions adsorbed by the tundish covering flux in 60 s to all inclusions was counted every 60 s. Only when the speed of inclusions exceeds the critical value can they be removed. Therefore, the removal efficiency of inclusions is lower than the floating efficiency. About 55% of the inclusions can reach the free surface within 60 s, while only about 35% of the inclusions with a diameter of 80 μm and the highest removal efficiency can be removed within 60 s. Besides, the removal efficiency rises as the diameter of inclusions increases. Although the removal ratios of inclusions in the three distributing chambers are basically the same in the first 60 s, the inclusions are removed significantly faster and more in the distributing chamber of tundish B after 60 s (see Figure 20b). Overall, tundish B performs the highest removal efficiency of inclusions, followed by tundish A (as shown in Figure 20a), and tundish C (as shown in Figure 20c) performs the lowest.
The ratio of inclusions flowing into the mold directly exposes the defects of the tundish. Contrary to the rule of removal ratios, the ratio of inclusions flowing into the mold shown in Figure 21 indicates that the inclusions in tundish C flow into the mold the most, followed by tundishes A and B. In summary, from the perspective of inclusions removal, tundish B performs the best metallurgical effects. It is desirable to reduce the width of the distributing chamber to 0.838 m, but not to 0.606 m.

4. Conclusions

The current work mainly aimed to investigate the influence of distributing chamber volume on the metallurgical effects of the large-scale two-strand slab continuous casting induction heating tundish. The main findings are summarized as follows:
(1)
Changing the width of the distributing chamber will significantly modify the flow field inside it. If the width is too short (e.g., it reaches 0.606 m), it will exacerbate the asymmetry of the flow field in the distributing chamber and facilitate the generation of short-circuit flow.
(2)
Reducing the volume of distributing chamber can improve the heating efficiency of the induction heating tundish and reduce energy consumption, though the marginal benefit of energy-saving by reducing the volume of the distributing chamber is low. The fastest heating rates of tundishes A, B, and C are about 0.4, 0.6, and 0.8 K/min, respectively, when the heating power is 600 kW. The total energy consumption of tundishes A, B, and C are 476, 444, and 434 kWh when pouring a ladle of molten steel.
(3)
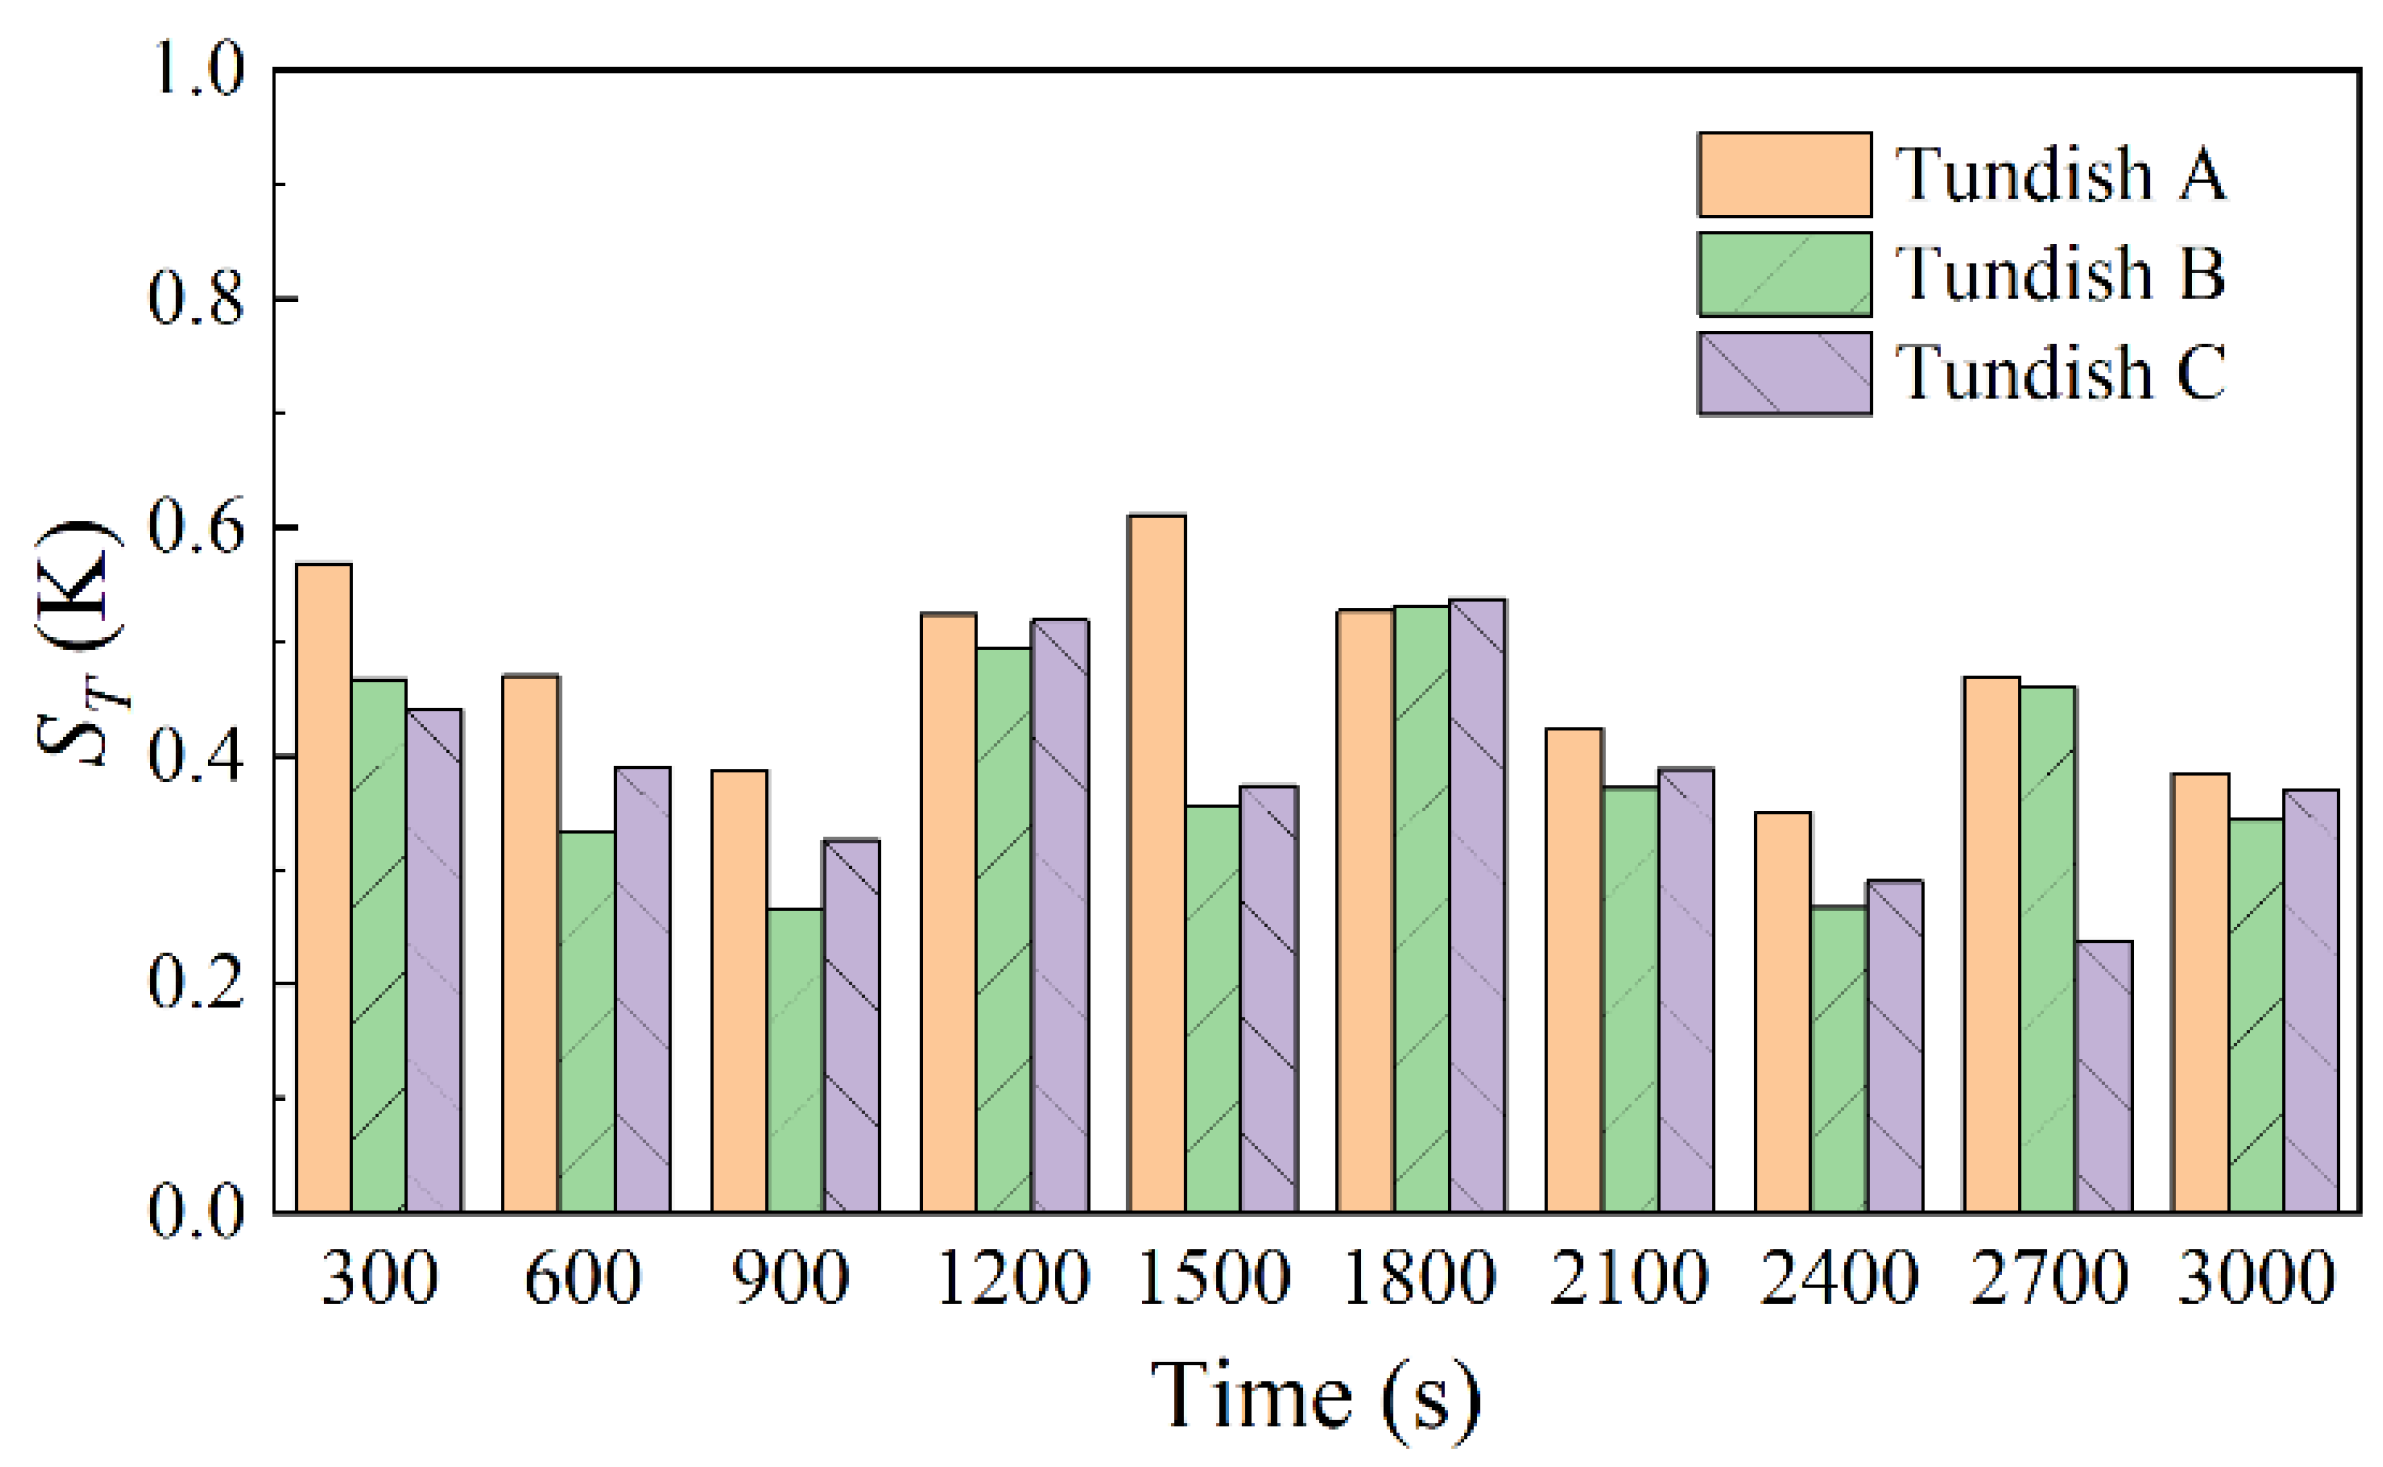
Reducing the volume of the distributing chamber will increase the temperature fluctuation of molten steel during the pouring process. When using tundishes A, B, and C in continuous casting, the standard deviations of the temperature distribution in distributing chambers are 0.76, 0.91, and 0.99 K, respectively. The temperature uniformity of molten steel is closely related to the flow field. Reducing the width of the distributing chamber from 1.216 to 0.838 m, the temperature uniformity of molten steel can be improved. However, reducing it to 0.606 m will destroy the symmetry of the flow field and deteriorate the temperature uniformity.
(4)
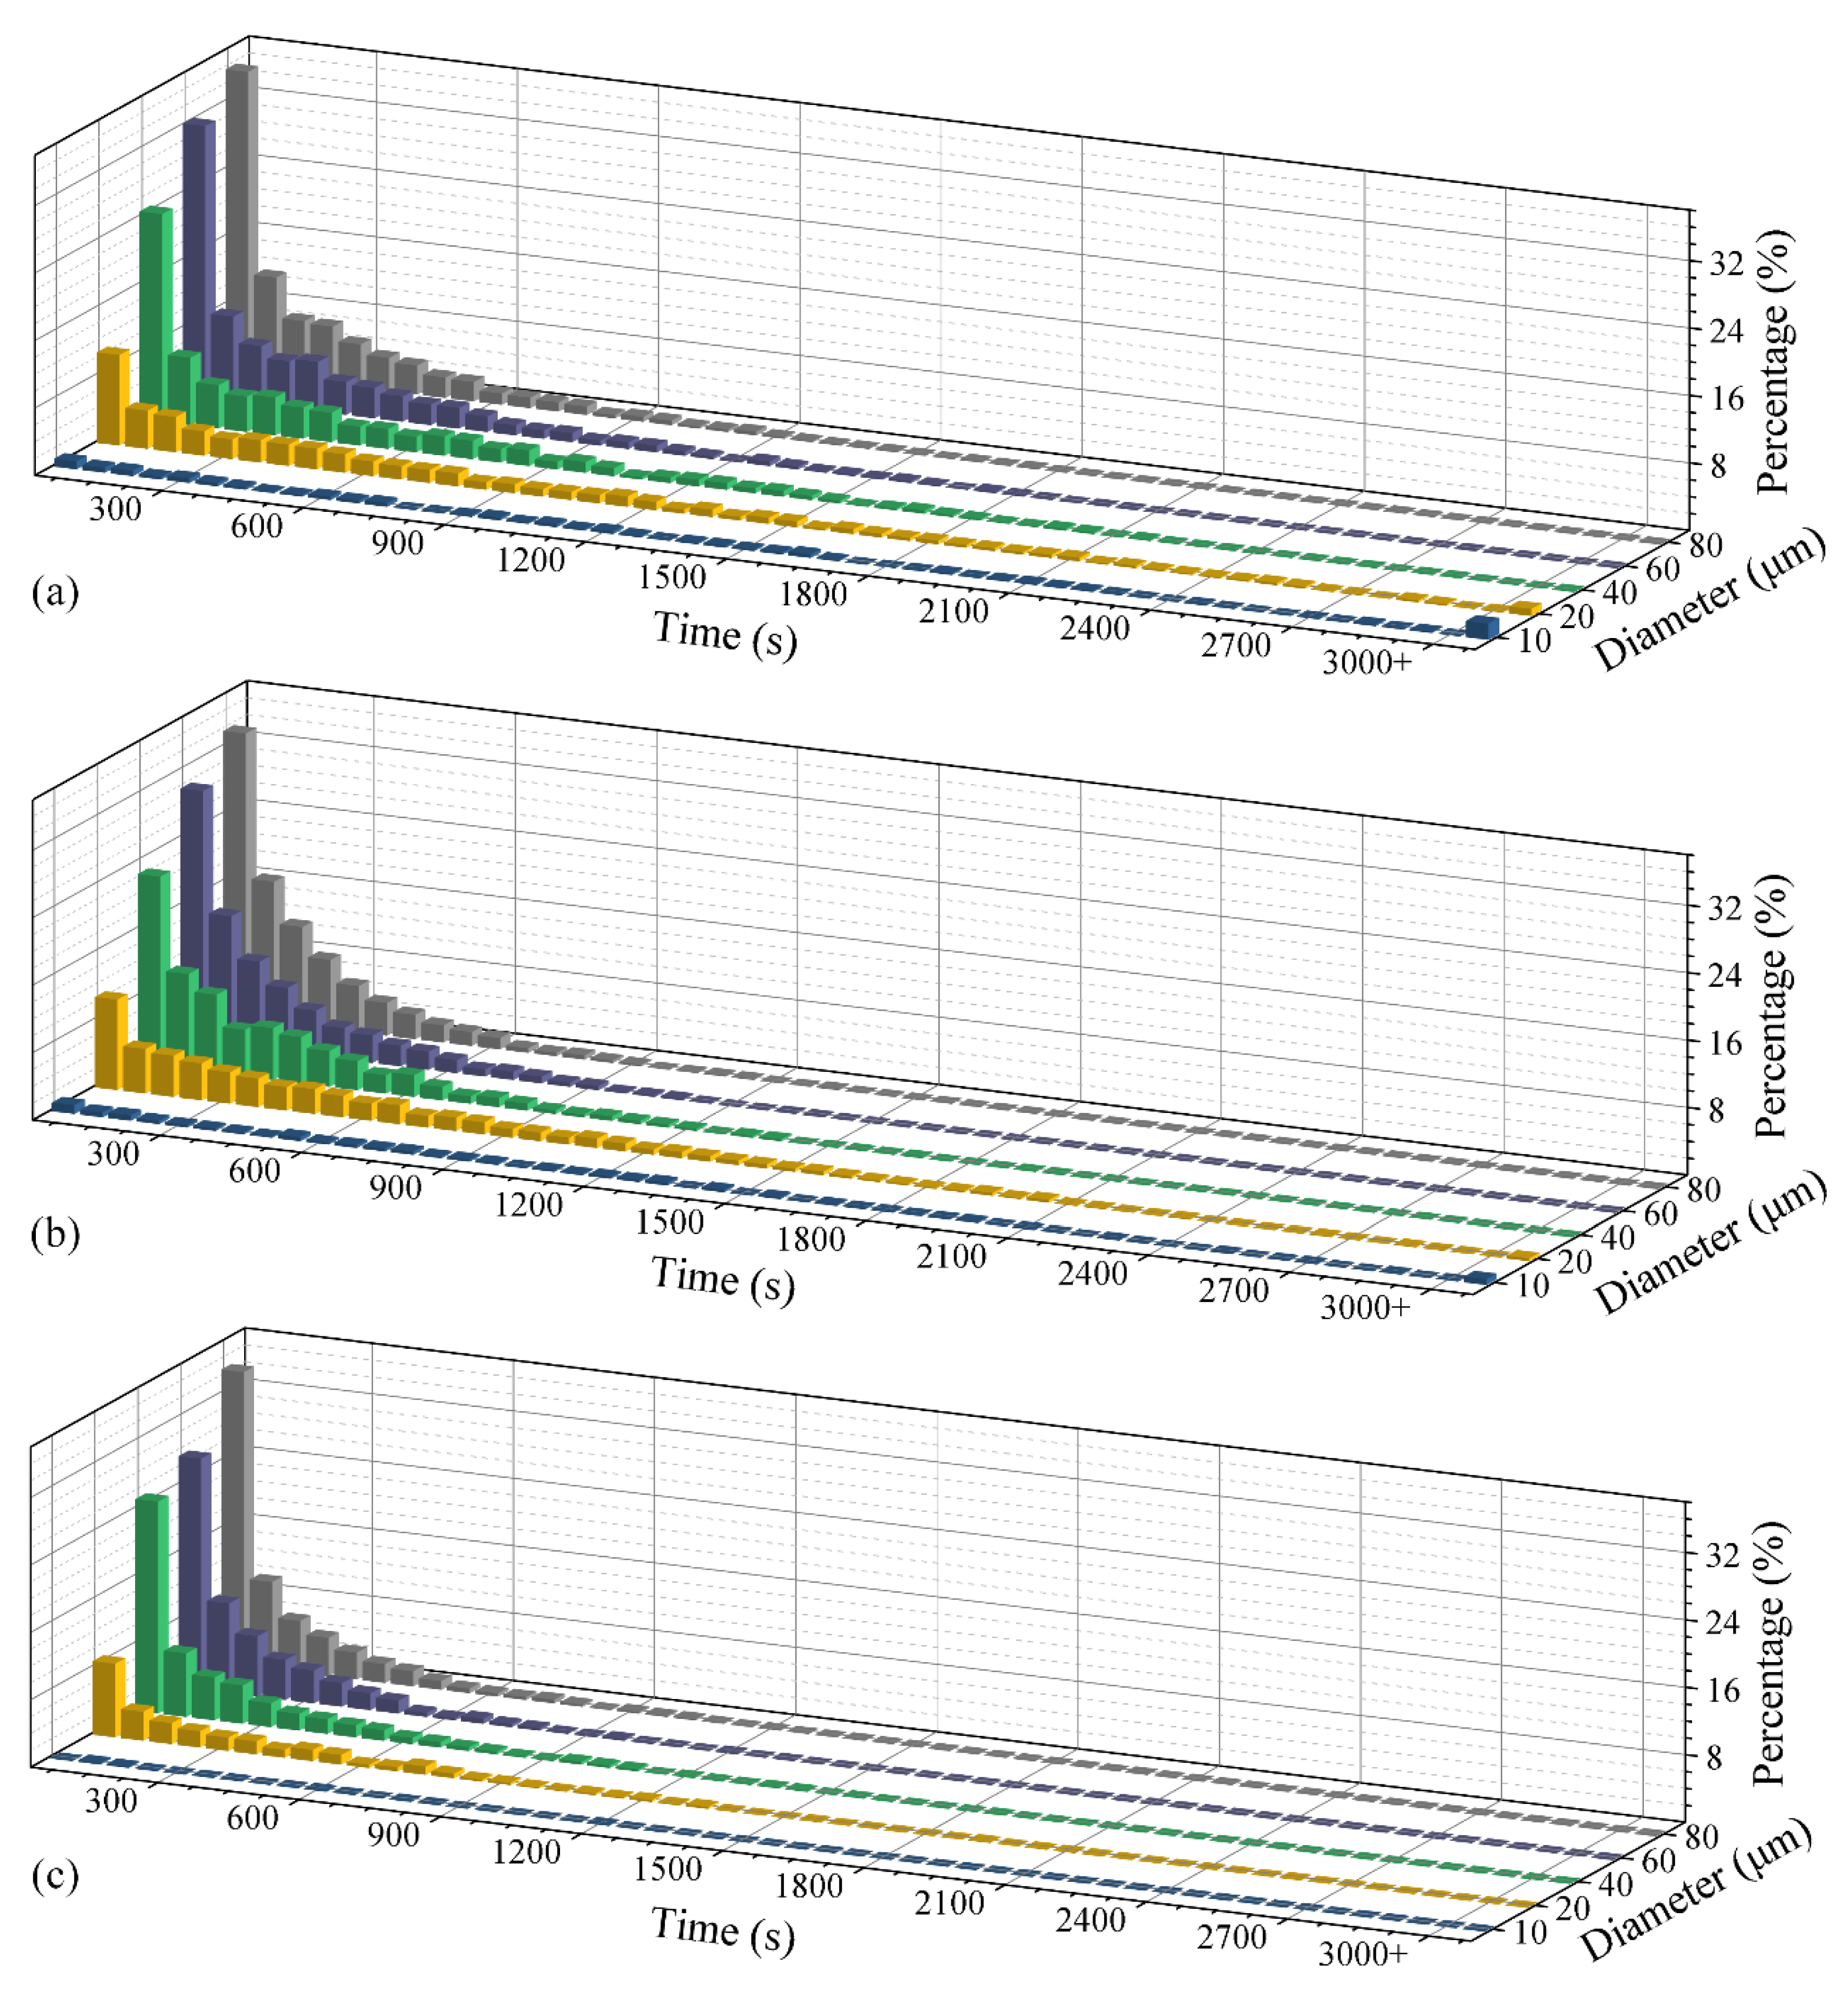
The diameter of inclusions has little effect on floating ratio and floating efficiency. However, the larger the inclusions are, the higher the removal ratio and removal efficiency are. The floating efficiency increases with the decrease in volume of distributing chamber. When reducing the width of the distributing chamber, the removal efficiency will first rise, and then decline. When the width of the distributing chamber is reduced from 1.216 to 0.838 m, the floating ratio of inclusions almost remains at about 96% and the removal ratio of inclusions is slightly increased. However, when the width is reduced to 0.606 m, the floating ratio and removal ratio of inclusions tend to depress and the ratio of inclusions flowing into the mold increases significantly.
(5)
To sum up, the large-scale two-strand slab continuous casting induction heating tundish performs the best metallurgical effects when the width of distributing chamber is appropriate. Tundish B should be selected in this plant.

Author Contributions

Conceptualization, B.Y. and A.D.; Methodology, B.Y.; Software, B.Y., X.K. and P.D.; Validation, B.Y., X.K. and P.D.; Formal analysis, B.Y.; Investigation, B.Y.; Resources, E.W.; Data curation, B.Y.; Writing—original draft preparation, B.Y.; Writing—review and editing, A.D.; Visualization, B.Y.; Supervision, A.D.; Project administration, A.D. and E.W.; Funding acquisition, A.D. and E.W. All authors have read and agreed to the published version of the manuscript.

Funding

This research was funded by National Natural Science Foundation of China (Grant No. 51474065 and 51574083) and the 111 Project (2.0) of China (Grant No. BP0719037).

Institutional Review Board Statement

Not applicable.

Informed Consent Statement

Not applicable.

Data Availability Statement

Not applicable.

Conflicts of Interest

The authors declare no conflict of interest.

References

  1. Zhang, L.F.; Taniguchi, S.; Cai, K.K. Fluid flow and inclusion removal in continuous casting tundish. Metall. Mater. Trans. B 2000, 31, 253–266. [Google Scholar] [CrossRef]
  2. Fredrikson, B.; Hellsing, S.; Folgero, K. Channel-Type Induction Furnace. U.S. Patent 3618917, 9 November 1971. [Google Scholar]
  3. Marty, P.; Alemany, A. Theoretical and experimental aspects of electromagnetic separation. In Metallurgical Applications of Magnetohydrodynamics: Proceedings of the International Union of Theoretical and Applied Mechanics, Delft, The Netherlands, 31 August–3 September 1982; A. A. Balkema: Cambridge, London, UK, 1982; pp. 245–259. [Google Scholar]
  4. Yoshii, Y.; Habu, Y.; Yamanaka, H.; Ueda, T. Method of Heating a Molten Steel in a Tundish for a Continuous Casting Apparatus. U.S. Patent 4582531, 15 April 1986. [Google Scholar]
  5. Wang, Q.; Li, B.K.; Tsukihashi, F. Modeling of a thermo-electromagneto-hydrodynamic problem in continuous casting tundish with channel type induction heating. ISIJ Int. 2014, 54, 311–320. [Google Scholar] [CrossRef] [Green Version]
  6. Wang, Q.; Qi, F.S.; Li, B.K.; Tsukihashi, F. Behavior of non-metallic inclusions in a continuous casting tundish with channel type induction heating. ISIJ Int. 2014, 54, 2796–2805. [Google Scholar] [CrossRef] [Green Version]
  7. Xing, F.; Zheng, S.G.; Zhu, M.Y. Motion and removal of inclusions in new induction heating tundish. Steel Res. Int. 2018, 89, 1700542. [Google Scholar] [CrossRef]
  8. Xing, F.; Zheng, S.G.; Liu, Z.H.; Zhu, M.Y. Flow field, temperature field, and inclusion removal in a new induction heating tundish with bent channels. Metals 2019, 9, 561. [Google Scholar] [CrossRef] [Green Version]
  9. Yang, B.; Deng, A.Y.; Wang, E.G. Simulating the magnetic field/transfer phenomenon of the tundish with channel type inducting heating. IOP Conf. Ser. Mater. Sci. Eng. 2018, 424, 012060. [Google Scholar] [CrossRef] [Green Version]
  10. Yang, B.; Deng, A.Y.; Duan, P.F.; Kang, X.L.; Wang, E.G. “Power curve” key factor affecting metallurgical effects of an induction heating tundish. J. Iron Steel Res. Int. 2022, 29, 151–164. [Google Scholar] [CrossRef]
  11. Yang, B.; Deng, A.Y.; Li, Y.; Wang, E.G. Exploration of the relationship between the electromagnetic field and the hydrodynamic phenomenon in a channel type induction heating tundish using a validated model. ISIJ Int. 2022, 62, 677–688. [Google Scholar]
  12. Yang, B.; Lei, H.; Bi, Q.; Jiang, J.M.; Zhang, H.W.; Zhao, Y.; Zhou, J.A. Electromagnetic conditions in a tundish with channel type induction heating. Steel Res. Int. 2018, 89, 1800145. [Google Scholar] [CrossRef]
  13. Yang, B.; Lei, H.; Bi, Q.; Xiao, Y.Y.; Zhao, Y. Numerical simulation of collision-coalescence and removal of inclusions in a tundish. JOM 2018, 70, 2950–2957. [Google Scholar] [CrossRef]
  14. Lei, H.; Yang, B.; Bi, Q.; Xiao, Y.Y.; Chen, S.F.; Ding, C.Y. Numerical simulation of collision-coalescence and removal of inclusion in tundish with channel type induction heating. ISIJ Int. 2019, 59, 1811–1819. [Google Scholar] [CrossRef] [Green Version]
  15. Yue, Q.; Zhang, C.B.; Pei, X.H. Magnetohydrodynamic flows and heat transfer in a twin-channel induction heating tundish. Ironmak. Steelmak. 2017, 44, 227–236. [Google Scholar] [CrossRef]
  16. Wang, P.; Chen, X.Q.; Xiao, H.; Li, X.S.; Ma, Z.M.; Tang, H.Y.; Zhang, J.Q. Effect of flow control devices on the distribution of magnetic-flow-heat in the channel induction heating tundish. Ironmak. Steelmak. 2021, 48, 1200–1210. [Google Scholar] [CrossRef]
  17. Wang, P.; Xiao, H.; Chen, X.Q.; Li, X.S.; He, H.; Tang, H.Y.; Zhang, J.Q. Influence of dual-channel induction heating coil parameters on the magnetic field and macroscopic transport behavior in t-type tundish. Metall. Mater. Trans. B 2021, 52, 3447–3467. [Google Scholar] [CrossRef]
  18. Braun, A.; Warzecha, M.; Pfeifer, H. Numerical and physical modeling of steel flow in a two-strand tundish for different casting conditions. Metall. Mater. Trans. B 2010, 41, 549–559. [Google Scholar] [CrossRef]
  19. Ling, H.T.; Zhang, L.F.; Li, H. Mathematical modeling on the growth and removal of non-metallic inclusions in the molten steel in a two-strand continuous casting tundish. Metall. Mater. Trans. B 2016, 47, 2991–3012. [Google Scholar] [CrossRef]
  20. Chatterjee, S.; Li, D.H.; Chattopadhyay, K. Modeling of liquid steel/slag/argon gas multiphase flow during tundish open eye formation in a two-strand tundish. Metall. Mater. Trans. B 2018, 49, 756–766. [Google Scholar] [CrossRef]
  21. Li, Y.; Deng, A.Y.; Li, H.; Yang, B.; Wang, E.G. Numerical study on flow, temperature, and concentration distribution features of combined gas and bottom-electromagnetic stirring in a ladle. Metals 2018, 8, 76. [Google Scholar] [CrossRef] [Green Version]
  22. Li, Y.; Deng, A.Y.; Yin, C.Q.; Zhang, S.J.; Wang, E.G. Effects of magnetic pressure constraint on dynamic deformation and oscillation behavior of metal free surface. J. Iron Steel Res. Int. 2016, 23, 1134–1141. [Google Scholar] [CrossRef]
  23. Yang, B.; Deng, A.Y.; Li, Y.; Xu, X.J.; Wang, E.G. Numerical simulation of flow and solidification in continuous casting process with mold electromagnetic stirring. J. Iron Steel Res. Int. 2019, 26, 219–229. [Google Scholar] [CrossRef] [Green Version]
  24. Li, Y.; Deng, A.Y.; Zhang, L.T.; Yang, B.; Wang, E.G. A new type of magnetic field arrangement to suppress meniscus fluctuation in slab casting: Numerical simulation and experiment. J. Mater. Process. Technol. 2021, 298, 117278. [Google Scholar] [CrossRef]
  25. Menter, F.R. Eddy viscosity transport equations and their relation to the k-ε model. J. Fluids Eng. 1997, 119, 876–884. [Google Scholar] [CrossRef]
  26. Chen, Q. Comparison of different k-ε models for indoor air flow computations. Numer. Heat Transf. Part B 1995, 28, 353–369. [Google Scholar] [CrossRef]
  27. Lam, C.; Bremhorst, K. A modified form of the k-ε model for predicting wall turbulence. J. Fluids Eng. 1981, 103, 456–460. [Google Scholar] [CrossRef]
  28. Chang, S.; Zhong, L.C.; Zou, Z.S. Simulation of flow and heat fields in a seven-strand tundish with gas curtain for molten steel continuous-casting. ISIJ Int. 2015, 55, 837–844. [Google Scholar] [CrossRef] [Green Version]
  29. Zhong, L.C.; Li, B.K.; Zhu, Y.X.; Wang, R.G.; Wang, W.Z.; Zhang, X.J. Fluid flow in a four-strand bloom continuous casting tundish with different flow modifiers. ISIJ Int. 2007, 47, 88–94. [Google Scholar] [CrossRef] [Green Version]
  30. Ramos-Banderas, A.; Morales, R.D.; Garcia-Demedices, L.; Diaz-Cruz, M. Mathematical simulation and modeling of steel flow with gas bubbling in trough type tundishes. ISIJ Int. 2003, 43, 653–662. [Google Scholar] [CrossRef] [Green Version]
  31. Wang, Q.; Liu, Y.; Huang, A.; Yan, W.; Gu, H.Z.; Li, G.Q. CFD investigation of effect of multi-hole ceramic filter on inclusion removal in a two-strand tundish. Metall. Mater. Trans. B 2020, 51, 276–292. [Google Scholar] [CrossRef]
  32. Bouris, D.; Bergeles, G. Investigation of inclusion re-entrainment from the steel-slag interface. Metall. Mater. Trans. B 1998, 29, 641–649. [Google Scholar] [CrossRef]
  33. Liu, C.; Yang, S.F.; Li, J.S.; Zhu, L.B.; Li, X.G. Motion behavior of nonmetallic inclusions at the interface of steel and slag. Part I: Model development, validation, and preliminary analysis. Metall. Mater. Trans. B 2016, 47, 1882–1892. [Google Scholar] [CrossRef] [Green Version]
  34. Yang, S.F.; Li, J.S.; Liu, C.; Sun, L.Y.; Yang, H.B. Motion behavior of nonmetal inclusions at the interface of steel and slag. Part II: Model application and discussion. Metall. Mater. Trans. B 2014, 45, 2453–2463. [Google Scholar] [CrossRef]
  35. Wen, T.J.; Zhang, L.F. Inclusion transfer behavior across slag/droplet interface duiring electroslag remelting process. China Metall. 2018, 28, 34–40. [Google Scholar]
Figure 1. Configuration and coordinate system. Unit is in millimeter.
Metals 12 00509 g001
Figure 2. Calculation diagram.
Metals 12 00509 g002
Figure 3. Schematic diagram of experimental setup. PC is the computer for recording data. DDSJ-308A is the conductivity meter.
Metals 12 00509 g003
Figure 4. Comparison of calculated and experimental RTD: (a) water model of tundish A, (b) water model of tundish B, (c) water model of tundish C.
Metals 12 00509 g004
Figure 5. Comparison of calculated and measured x component of water velocity (ux) along extension line at the center of the channel outlet of the water model of tundish A.
Metals 12 00509 g005
Figure 6. Streamline in distributing chambers: (a) tundish A, (b) tundish B, (c) tundish C.
Metals 12 00509 g006
Figure 7. Transport and diffusion process of tracer in distributing chambers. (ae) are distribution of tracer in distributing chamber of tundish A at 30, 45, 90, and 120 s in sequence; (fj) and (ko) are distribution of tracer in distributing chambers of the tundishes B and C at 30, 45, 75, and 90 s in sequence.
Metals 12 00509 g007
Figure 8. Mainstreams in the distributing chambers.
Metals 12 00509 g008
Figure 9. Flow field at the outlet of the channels.
Metals 12 00509 g009
Figure 10. Variation of bulk temperature in distributing chambers. (ad) are temperature distribution of molten steel in distributing chamber of tundish A at 600, 1200, 1800, and 2400 s in sequence; (eh) and (il) are temperature distributions of the molten steel in distributing chambers of the tundishes B and C at corresponding moment, respectively.
Metals 12 00509 g010
Figure 11. Statistics on temperature of molten steel in distributing chamber. Square represents tundish A, triangle represents tundish B, and circle represents tundish C. Gray dot line represents maximum temperature; yellow solid line represents average temperature; cyan dash line represents the minimum temperature; red dot dash line represents temperature difference between maximum and minimum temperature.
Metals 12 00509 g011
Figure 12. Standard deviation of molten steel temperature distribution in distributing chamber.
Metals 12 00509 g012
Figure 13. Temperature variation of molten steel at tundish outlets.
Metals 12 00509 g013
Figure 14. Power curve and variation of casting temperature in tundishes. From top to bottom, tundishes A, B, and C are depicted in sequence. Red solid line and red dash line represent molten steel temperature at outlet 1 and outlet 2, respectively. Green solid line represent power curve.
Metals 12 00509 g014
Figure 15. Statistics on temperature of molten steel in distributing chamber when tapping temperature gradually drops. Square represents tundish A, triangle represents tundish B, and circle represents tundish C. Gray dot line represents maximum temperature; yellow solid line represents average temperature; cyan dash line represents the minimum temperature; red dot dash line represents temperature difference between maximum and minimum temperature.
Metals 12 00509 g015
Figure 16. Standard deviation of molten steel temperature distribution in distributing chamber when tapping temperature of molten steel gradually drops.
Metals 12 00509 g016
Figure 17. Floating ratios of inclusions in distributing chamber.
Metals 12 00509 g017
Figure 18. Floating efficiency of inclusions in distributing chamber. (a), (b) and (c) are the results of tundishes A, B and C, respectively.
Metals 12 00509 g018
Figure 19. Removal ratios of inclusions in distributing chamber.
Metals 12 00509 g019
Figure 20. Removal efficiency of inclusions in distributing chamber. (a), (b) and (c) are the results of tundishes A, B and C, respectively.
Metals 12 00509 g020
Figure 21. Ratio of inclusions flowing into the mold (FIM ratio).
Metals 12 00509 g021
Table 1. Dimensions and other parameters.
ParametersValue
Conductivity of molten steel (S m−1)7.14 × 10⁵
Relative permeability of molten steel1
Density of molten steel (kg m−3)7200
Specific heat of molten steel (J kg−1 K−1)680
Thermal conductivity (W m−1 K−1)30
Thermal expansivity (K−1)1 × 10⁻⁴
Viscosity of molten steel (Pa s)6.2 × 10⁻³
Spacing of channels (m)0.874
Diameter of channels (m)0.12
Outlet diameter (m)0.07
Inner diameter of inlet (m)0.12
W1 of tundish A (m)1.516
W2 of tundish A (m)1.216
W1 of tundish B (m)1.138
W2 of tundish B (m)0.838
W1 of tundish C (m)0.906
W2 of tundish C (m)0.606
Capacity of tundish A (t)48.75
Capacity of tundish B (t)36.79
Capacity of tundish C (t)29.45
Table 2. Error statistics of flow field for different meshes.
Mesh 1Mesh 2Mesh 3Mesh 4
Total Element Number532,430692,166899,8181,124,762
E u = | u i u 4 | / | u 4 | 0.06480.04660.0394-
E k = | k i k 4 | / | k 4 | 0.07160.04190.0354-
E ε = | ε i ε 4 | / | ε 4 | 0.04680.03980.0311-
Table 3. Heating power applied in tundishes A, B, and C at different time.
PowerTundish ATundish BTundish C
2000–960 s0–1080 s0–1110 s
400960–1440 s1080–1620 s1110–1680 s
6001440–2460 s1620–2640 s1680–2700 s
8002460–3000 s2640–3000 s2700–3000 s
Publisher’s Note: MDPI stays neutral with regard to jurisdictional claims in published maps and institutional affiliations.

