Article

Evolution of Interface Microstructure and Tensile Properties of AgPd30/CuNi18Zn26 Bilayer Laminated Composite Manufactured by Rolling and Annealing

1
College of Materials Science & Engineering, Chongqing University, Chongqing 400045, China
2
National Engineering Research Center for Magnesium Alloys, Chongqing University, Chongqing 400045, China
3
Chongqing Chuanyi Metallic Functional Materials Co., Ltd., Chongqing 400702, China
*
Author to whom correspondence should be addressed.
Metals 2022, 12(2), 367; https://doi.org/10.3390/met12020367
Submission received: 14 January 2022 / Revised: 10 February 2022 / Accepted: 17 February 2022 / Published: 21 February 2022

Abstract

:
An AgPd30/CuNi18Zn26 bilayer laminated composite (BLC) was manufactured by hot-roll bonding followed by two passes of cold-rolling and three passes of annealing. The evolution of the interface microstructure during the manufacturing process was investigated using a scanning electron microscope, an electron probe microanalyzer, an X-ray diffractometer and a transmission electron microscope. It was found that a net atomic flow of Zn and Cu immigrated from the CuNi18Zn26 layer into the AgPd30 layer, leading to the formation of a Cu3Au-type superstructure of Cu2NiZn in the former and a diffusion layer in the later. The clusters enriched in Zn and Pd were formed in the diffusion layer and their number varied during the rolling and annealing process. The thickness of the diffusion layer was increased by annealing and decreased by cold rolling. Several intermetallic compounds were identified, which are Pd2Zn, PdZn, Pd2Zn3, PdZn2, Pd3Zn10 and Cu3Pd. Some orientation relationships between the compounds and the AgPd30 alloy were determined to be (310)PdZn2//(111)AgPd and (114)Cu3Pd//(311)PdZn2//(321)Pd3Zn10. Delamination occurred in all 6 samples during tensile testing, including an as-bonded one, two as-rolled ones and three as-annealed ones, but its degree decreased successively with the progress of rolling and annealing. Two turning points appear on the tensile curves of as-annealed samples, which are ascribed to the initiation of delamination and the yield of the metal matrix. However, the tensile curves of the as-bonded and as-rolled samples are smooth.

1. Introduction

As an electric conversion device in instruments and electrical equipment, electrical contactors are mainly used for normal connection, load and breaking current [1]. Precious metals, such as Au, Ag, Pd and Pt, have good electrical and thermal conductivity and chemical stability, and thus they are quite suitable for electrical contactors. Silver is the most electrically conductive element in the periodic table and the cheapest precious metal, and thereby an ideal electrical contact material. However, silver is soft, has poor resistance to arc (due to the low melting point) and is apt to corrode in a sulfide atmosphere, thus, some other elements and compounds are added to improve its contact performance [2,3,4,5,6,7]. The properties of Ag-Pd alloys are well known to be suitable for sliding contact components, such as brushes [8]. In order to save on material costs, laminated metal composites have been developed, with Ag-Pd alloys as the contact layer and copper alloys as the base layer. The AgPd30/CuZn18Ni26 bilayer laminated composite (BLC) is typical and widely used as brushes in DC micromotors.
The roll-bonding process is the most commonly used technique to manufacture laminated metal composites, such as steel/Al [9,10], steel/steel [11], Ti/Mg [12], Ag/Cu [13], Ag/Fe and Ag/Ni [14], Al/Cu [15] and Al/Mg [16,17]. The bonding of different metals by rolling and annealing includes a number of interconnected chemical and physical processes, and the properties of the composites depend greatly on the microstructure of the interface. Du [18] pointed out that the strength of multilayered Ti/Al composites was affected by the interface layer composed of TiAl3 and the chemical diffusion near the interface, and the rule of mixture on the strength was modified accordingly. Several intermetallic compounds of Fe and Al, including Fe2Al5, FeAl3 and FeAl2, were found at the interface of a mild steel/Al composite by Poddar [9] and Taali [10]. Similar phenomena were found in the Cu/Al composite, i.e., the formation of Cu9Al4, Cu3Al2, CuAl (Cu3Al4) and CuAl2 in the interface [19]. Therefore, the reaction at the interface can be complicated even though the composition of each layer is simple, depending on the equilibrium phase diagrams of the related alloys.
The AgPd30 and CuNi18Zn26 alloys are both single phase solid solutions with an FCC crystal structure. However, five elements, Ag, Pd, Cu, Zn and Ni, are included in the BLC, which makes the diffusion and phase transition in the interface a complicated process. Until now, no investigation on the interface characteristics of this composite has been reported, although it is a commercial product widely used in micromotors. Typically, the final thickness of the AgPd30/CuZn18Ni26 BLC is around 0.1 mm, and the output of much thinner products, with thicknesses such as 0.03 mm to 0.05 mm, are increasing due to the increase in flat micromotors. The thickness of the AgPd30 layer is usually less than 10% of the total. Therefore, it is very important to reveal the interface microstructure and its evolution during the manufacturing procedure, so as to control the dilution of the AgPd30 alloy by CuNi18Zn26 alloy and assure the electrical contact properties of the composite.

2. Experimental

2.1. Sample Preparation

The AgPd30/CuNi18Zn26 BLC was produced by Chongqing Chuanyi Metallic Functional Materials Co., Ltd. The chemical compositions of the base alloys are shown in Table 1. The BLC was symmetrically hot-roll bonded followed by continuous annealing, and then cold-rolled for two passes to the final thickness of 0.11 mm, including a AgPd30 layer of 6.5 μm thickness. Also, the BLC was annealed continuously after each pass of cold rolling. All the annealing processes were carried out under the protection of decomposed ammonia. The reduction in rolling (including the bonding process), annealing temperature and time were 50~65%, 820~920 K and 5~10 min, respectively. The reduction rate decreased and annealing temperature increased with each pass. However, the exact process parameters are commercial secrets that cannot be provided here. The as-rolled samples are numbered as HRB, FCR and SCR for the hot-roll bonded, first cold-rolled and second cold-rolled BLC, respectively. The as-annealed samples are numbered as FA, SA and TA for the three passes of annealing, successively.

2.2. Characterization Methods

The microstructure of the CuNi18Zn26 layer is easy to reveal by chemical etching, but that of the AgPd30 layer cannot be revealed, even in an aqua regia solution. Therefore, the microstructure along the ND-TD plane of the composite was investigated by electron backscatter diffraction (EBSD) on a JSM-7800F scanning electron microscope (SEM, JEOL, Akishima, Tokyo, Japan). The samples were prepared with a Gatan 697 argon ion polisher (Gatan, Philadelphia, PA, USA). An energy dispersive X-ray spectrometer (EDS, Oxford Instruments, Oxford, UK) equipped on the SEM and a JXA-8530F Plus electron probe microanalyzer (EPMA, JEOL, Akishima, Tokyo, Japan) were used to show the elemental distribution across the interface.
In order to detect the new phases formed by the interface reaction, X-ray diffraction (XRD) analyses were performed on the samples using a Rigaku D/max 2500PC diffractometer (Rigaku Corporation, Akishima, Tokyo, Japan). The Cu Kα-radiation (λ = 1.5406 Å) was used with the voltage of 40 kV and current of 150 mA. Furthermore, a Tian G2 60-300 transmission electron microscope (TEM, FEI, Hillsboro, OR, USA) was applied on the interface structure analysis of sample TA. The TEM samples were cut from the ND-TD plane with a Helios NanoLab 600i DualBeam system (FIB, FEI, Hillsboro, OR, USA) and then ion thinned for observation.
Tensile measurement was carried out on a CMT-5105 material testing machine at room temperature, with the load direction parallel to the RD. The sample was prepared according to the standard GB/T 288.1-2010, and the loading speed was 2 mm/min. At least three parallel samples were tested for each group to ensure repeatability.

3. Results

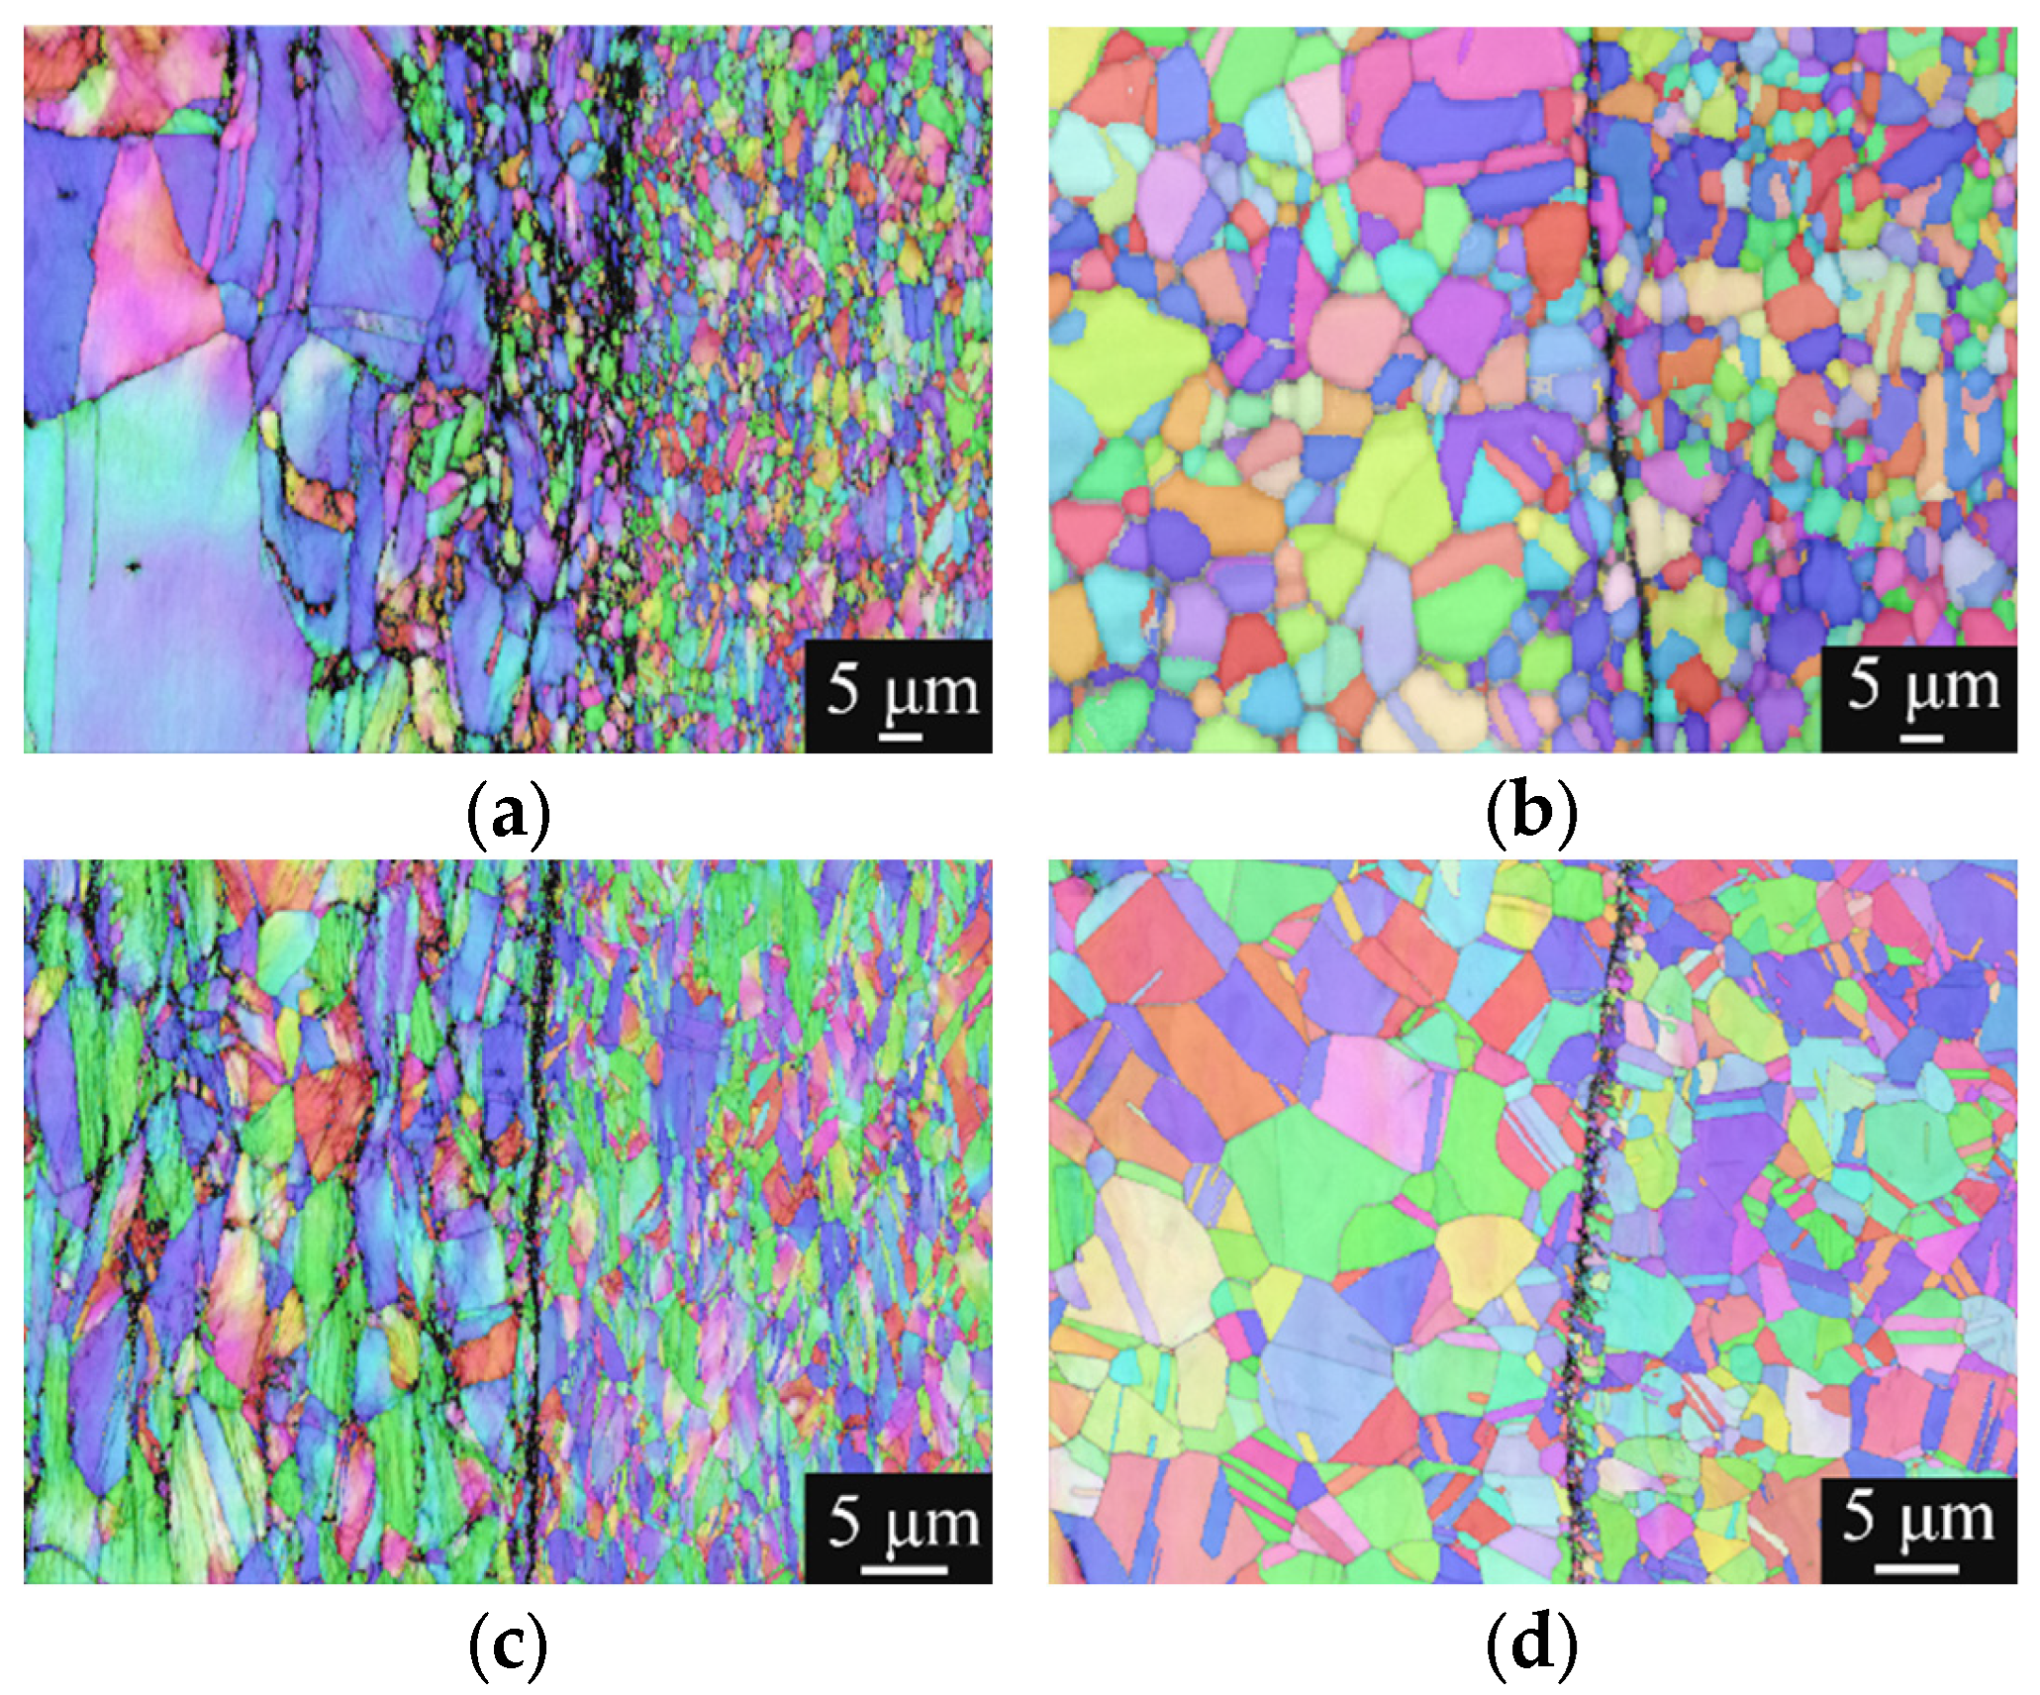
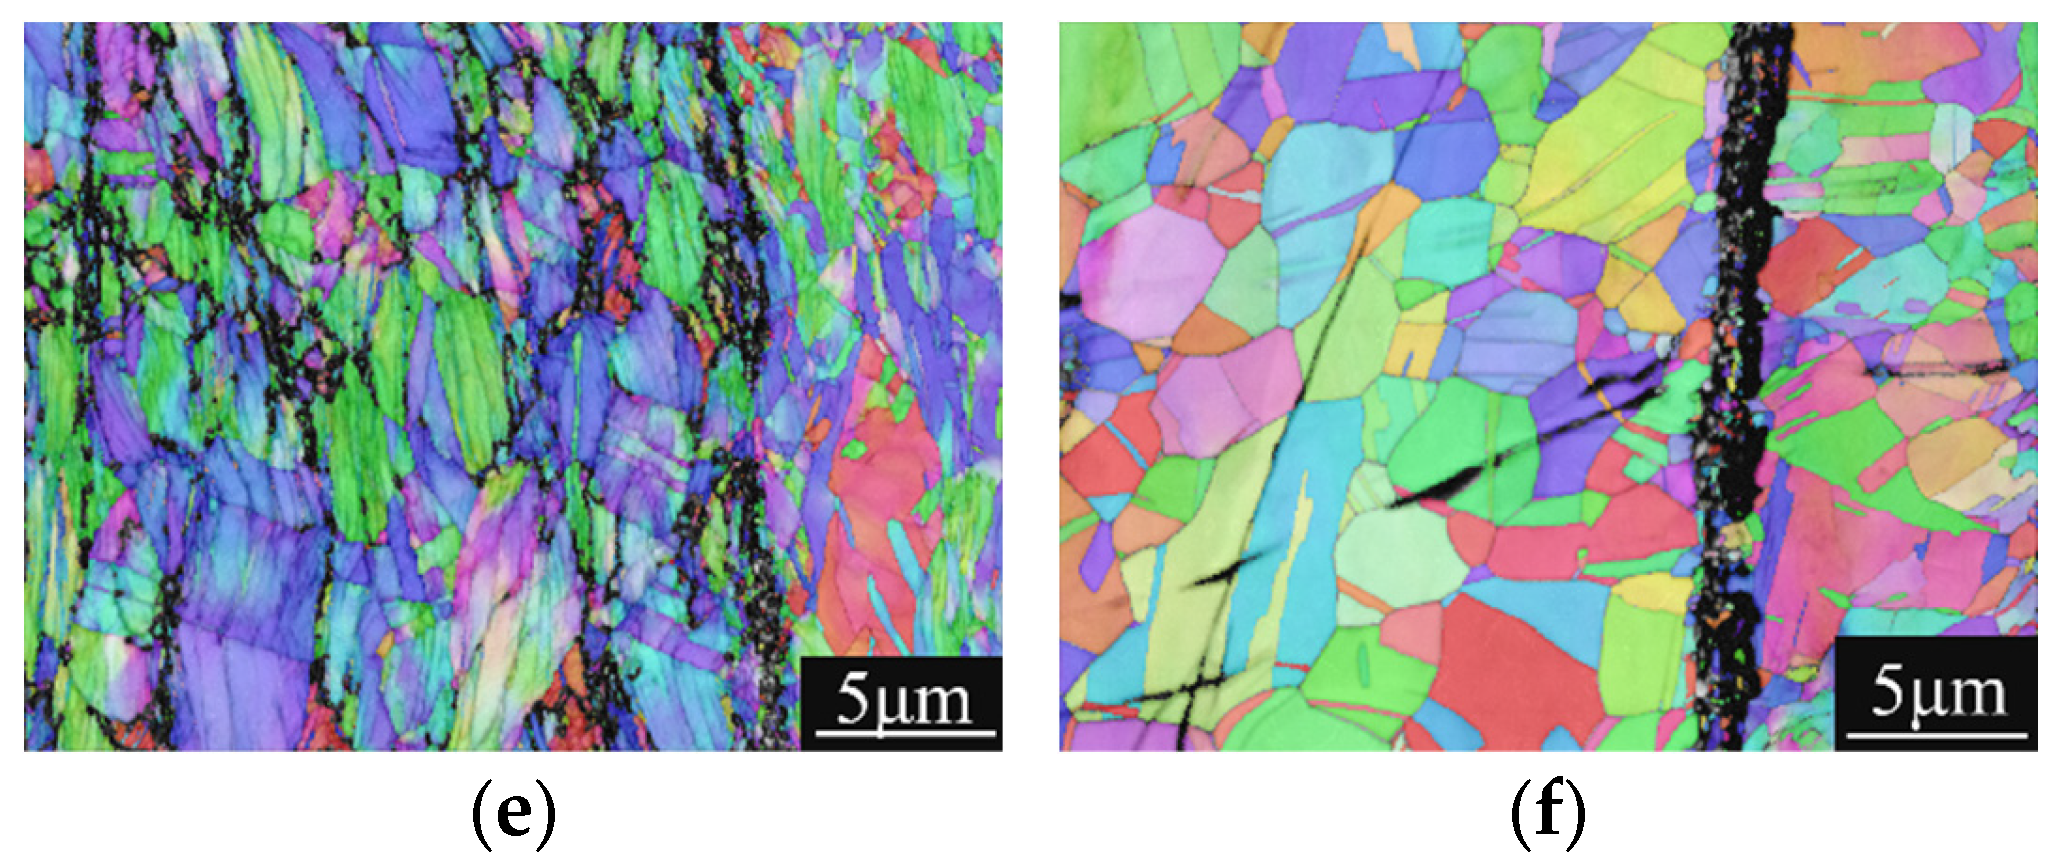
3.1. Microstructure across the Interface

The microstructures of both layers were observed simultaneously by EBSD as shown in Figure 1. Note that the scale bars are not the same in the images, to show both layer microstructures of the samples with different thickness. Due to the influence of residual strain, the indexing rates of the as-rolled samples were much smaller than those of the as-annealed samples. It is hard to evaluate the grain size of the as-rolled samples, but many twins can be found in both layers. Equiaxed grains with fewer twins were formed after annealing, indicating the fulfillment of recrystallization. It is interesting to note that the grains on both sides of the interface, which is a dark line due to the low indexing rate, are smaller than those in the matrix. A similar phenomenon was found in a Ni/Fe laminated composite [20]. No cracks or holes were found in any sample, meaning that the interface was well bonded after the roll-bonding and further improved in the following processes.

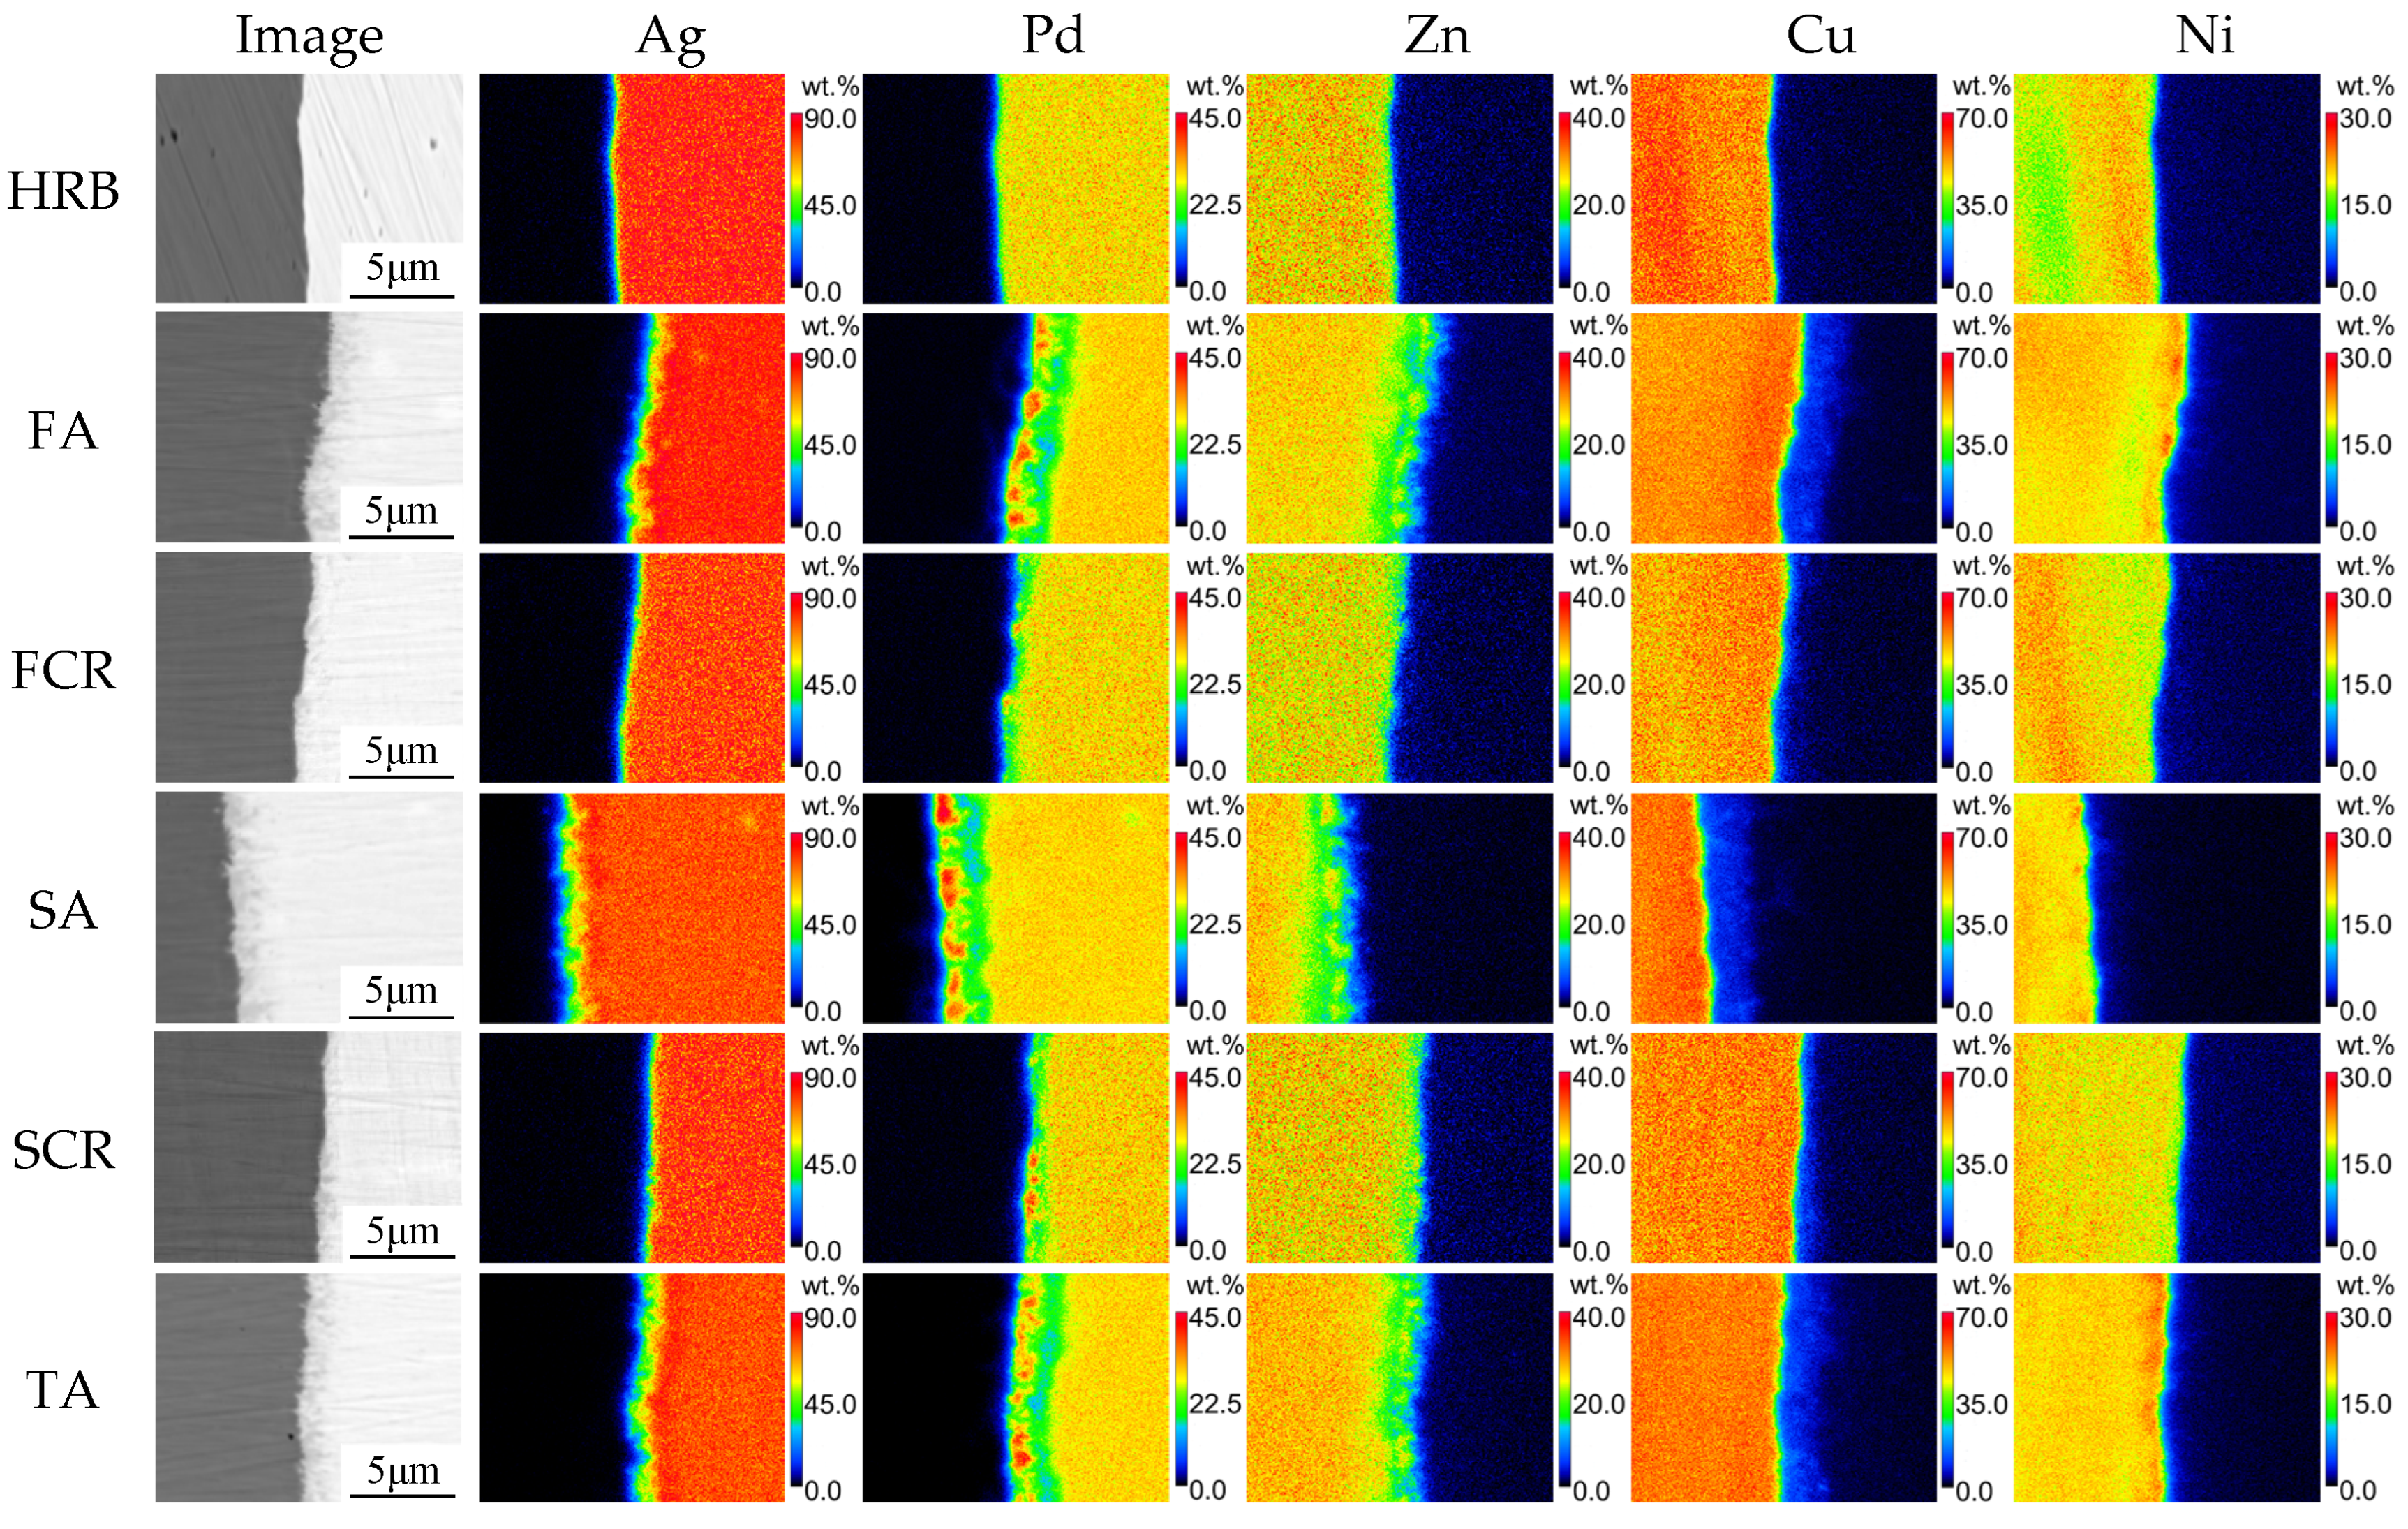
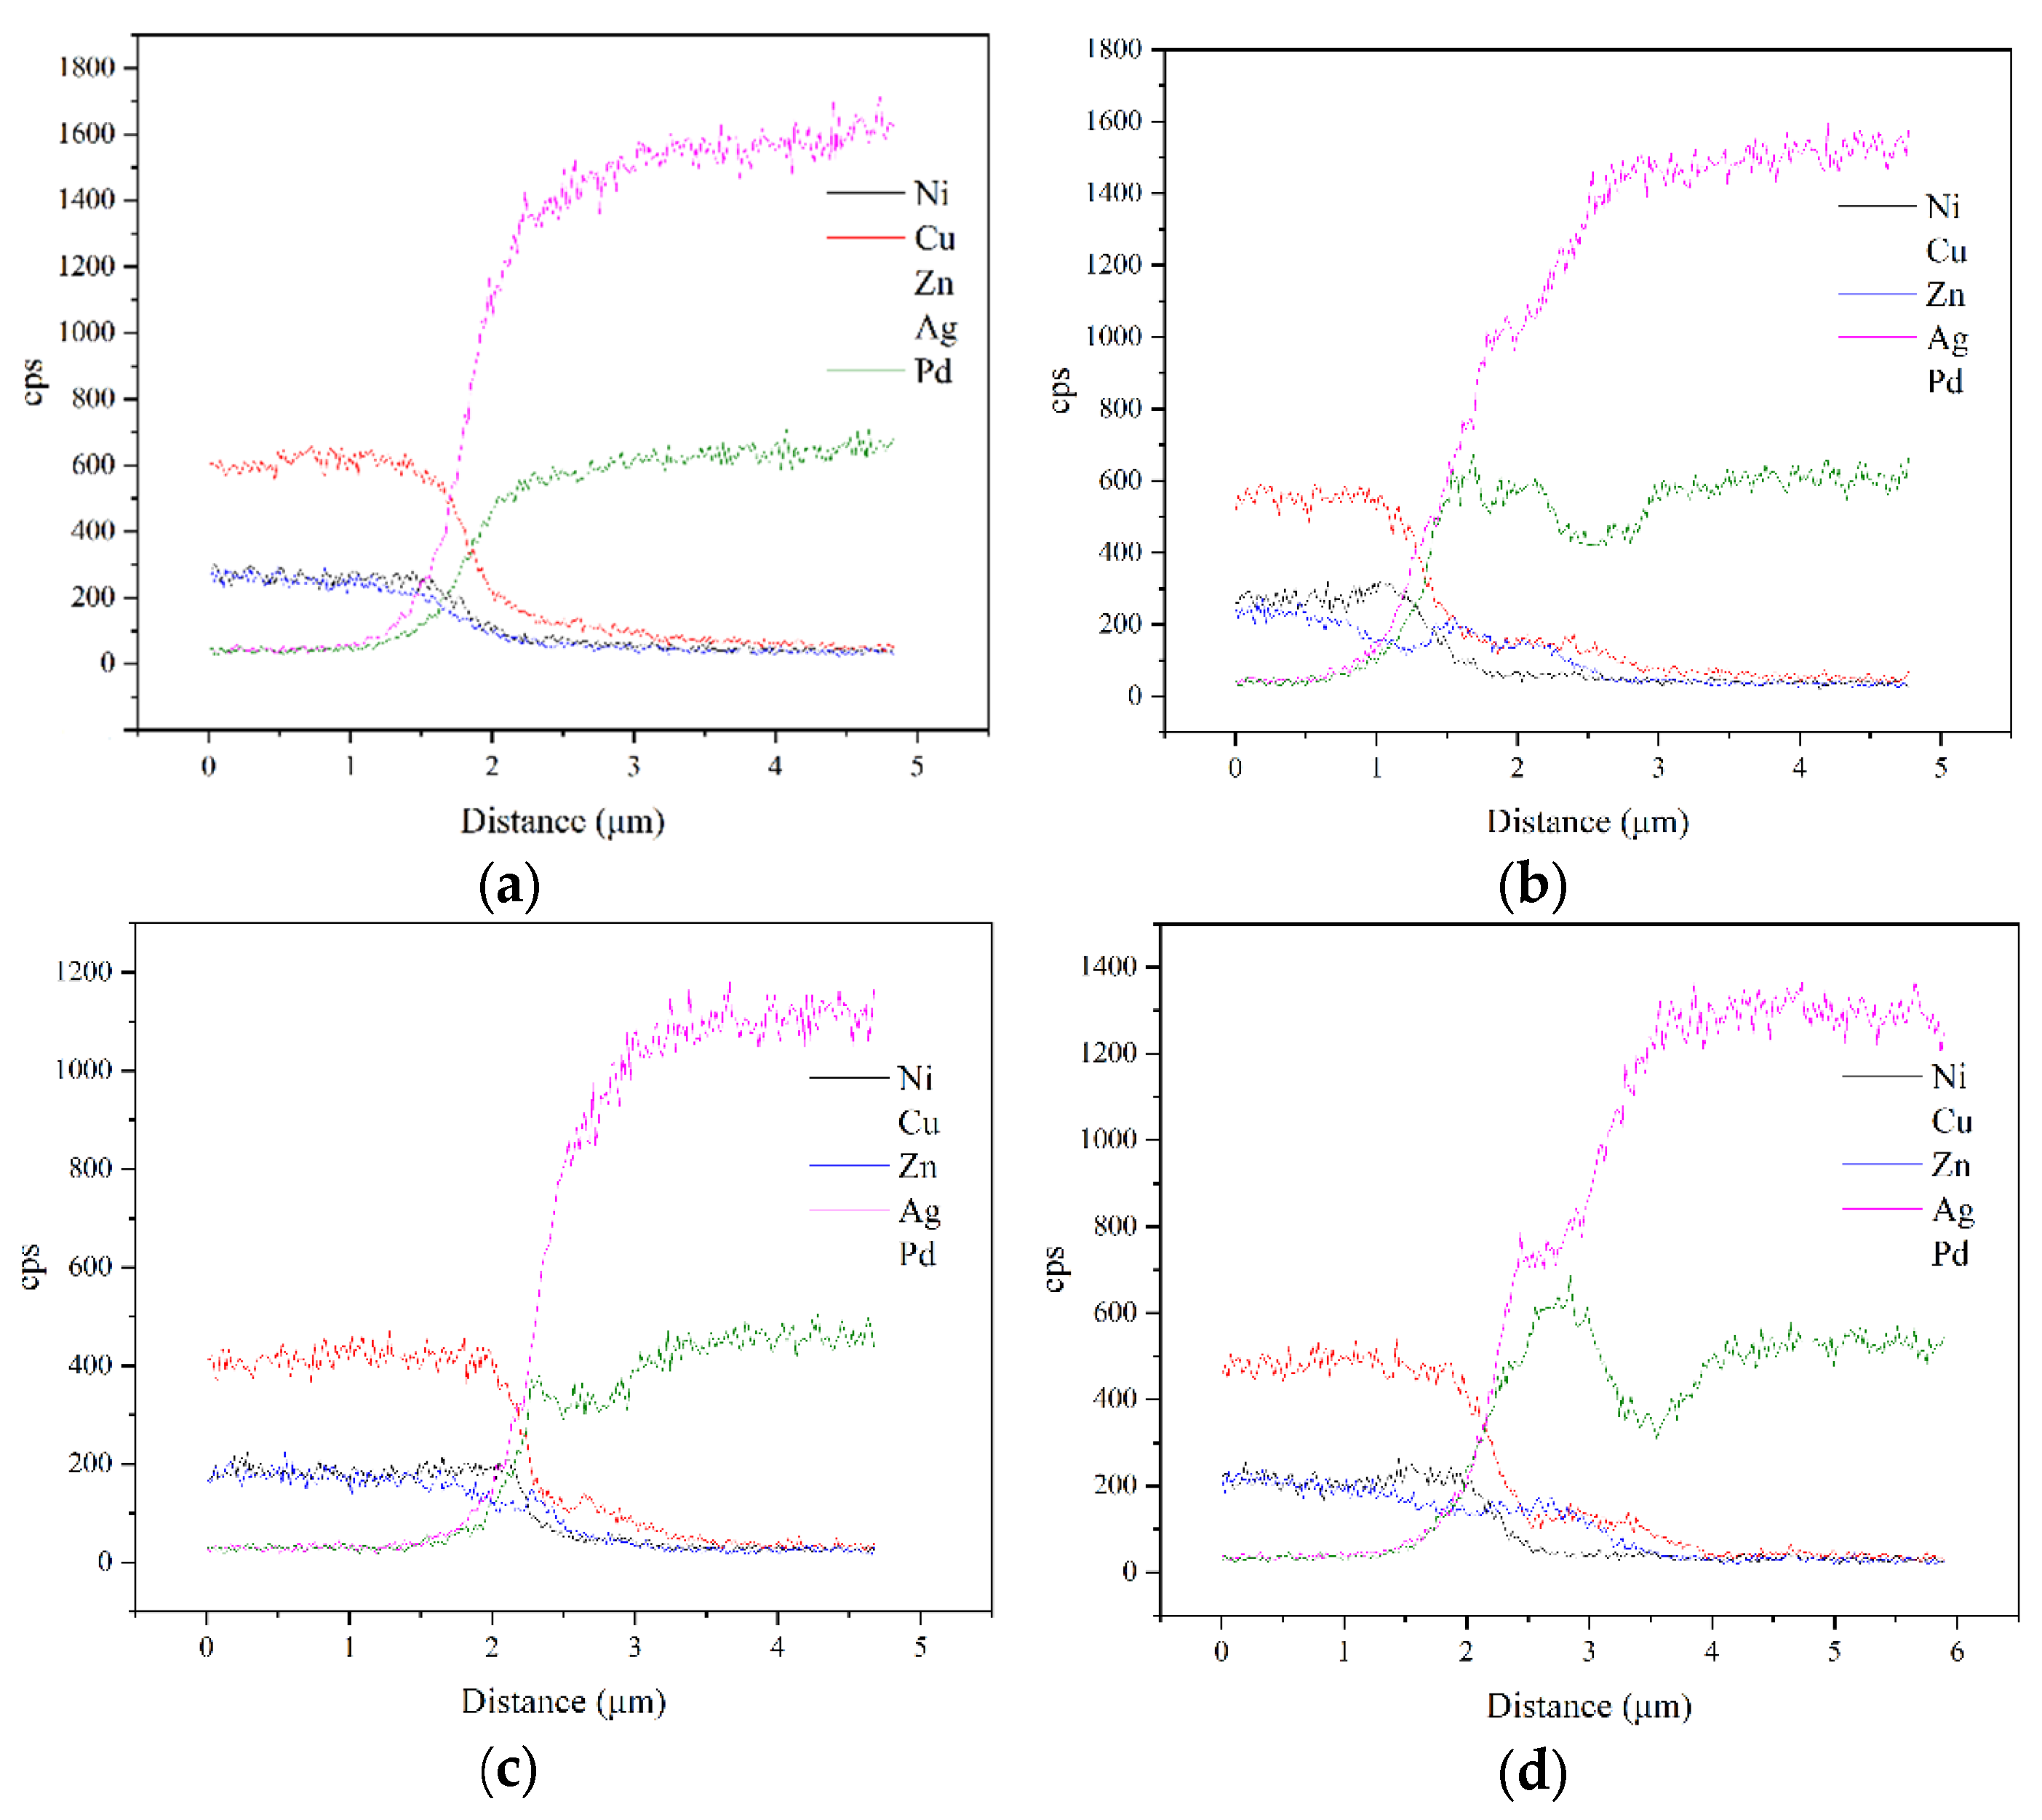
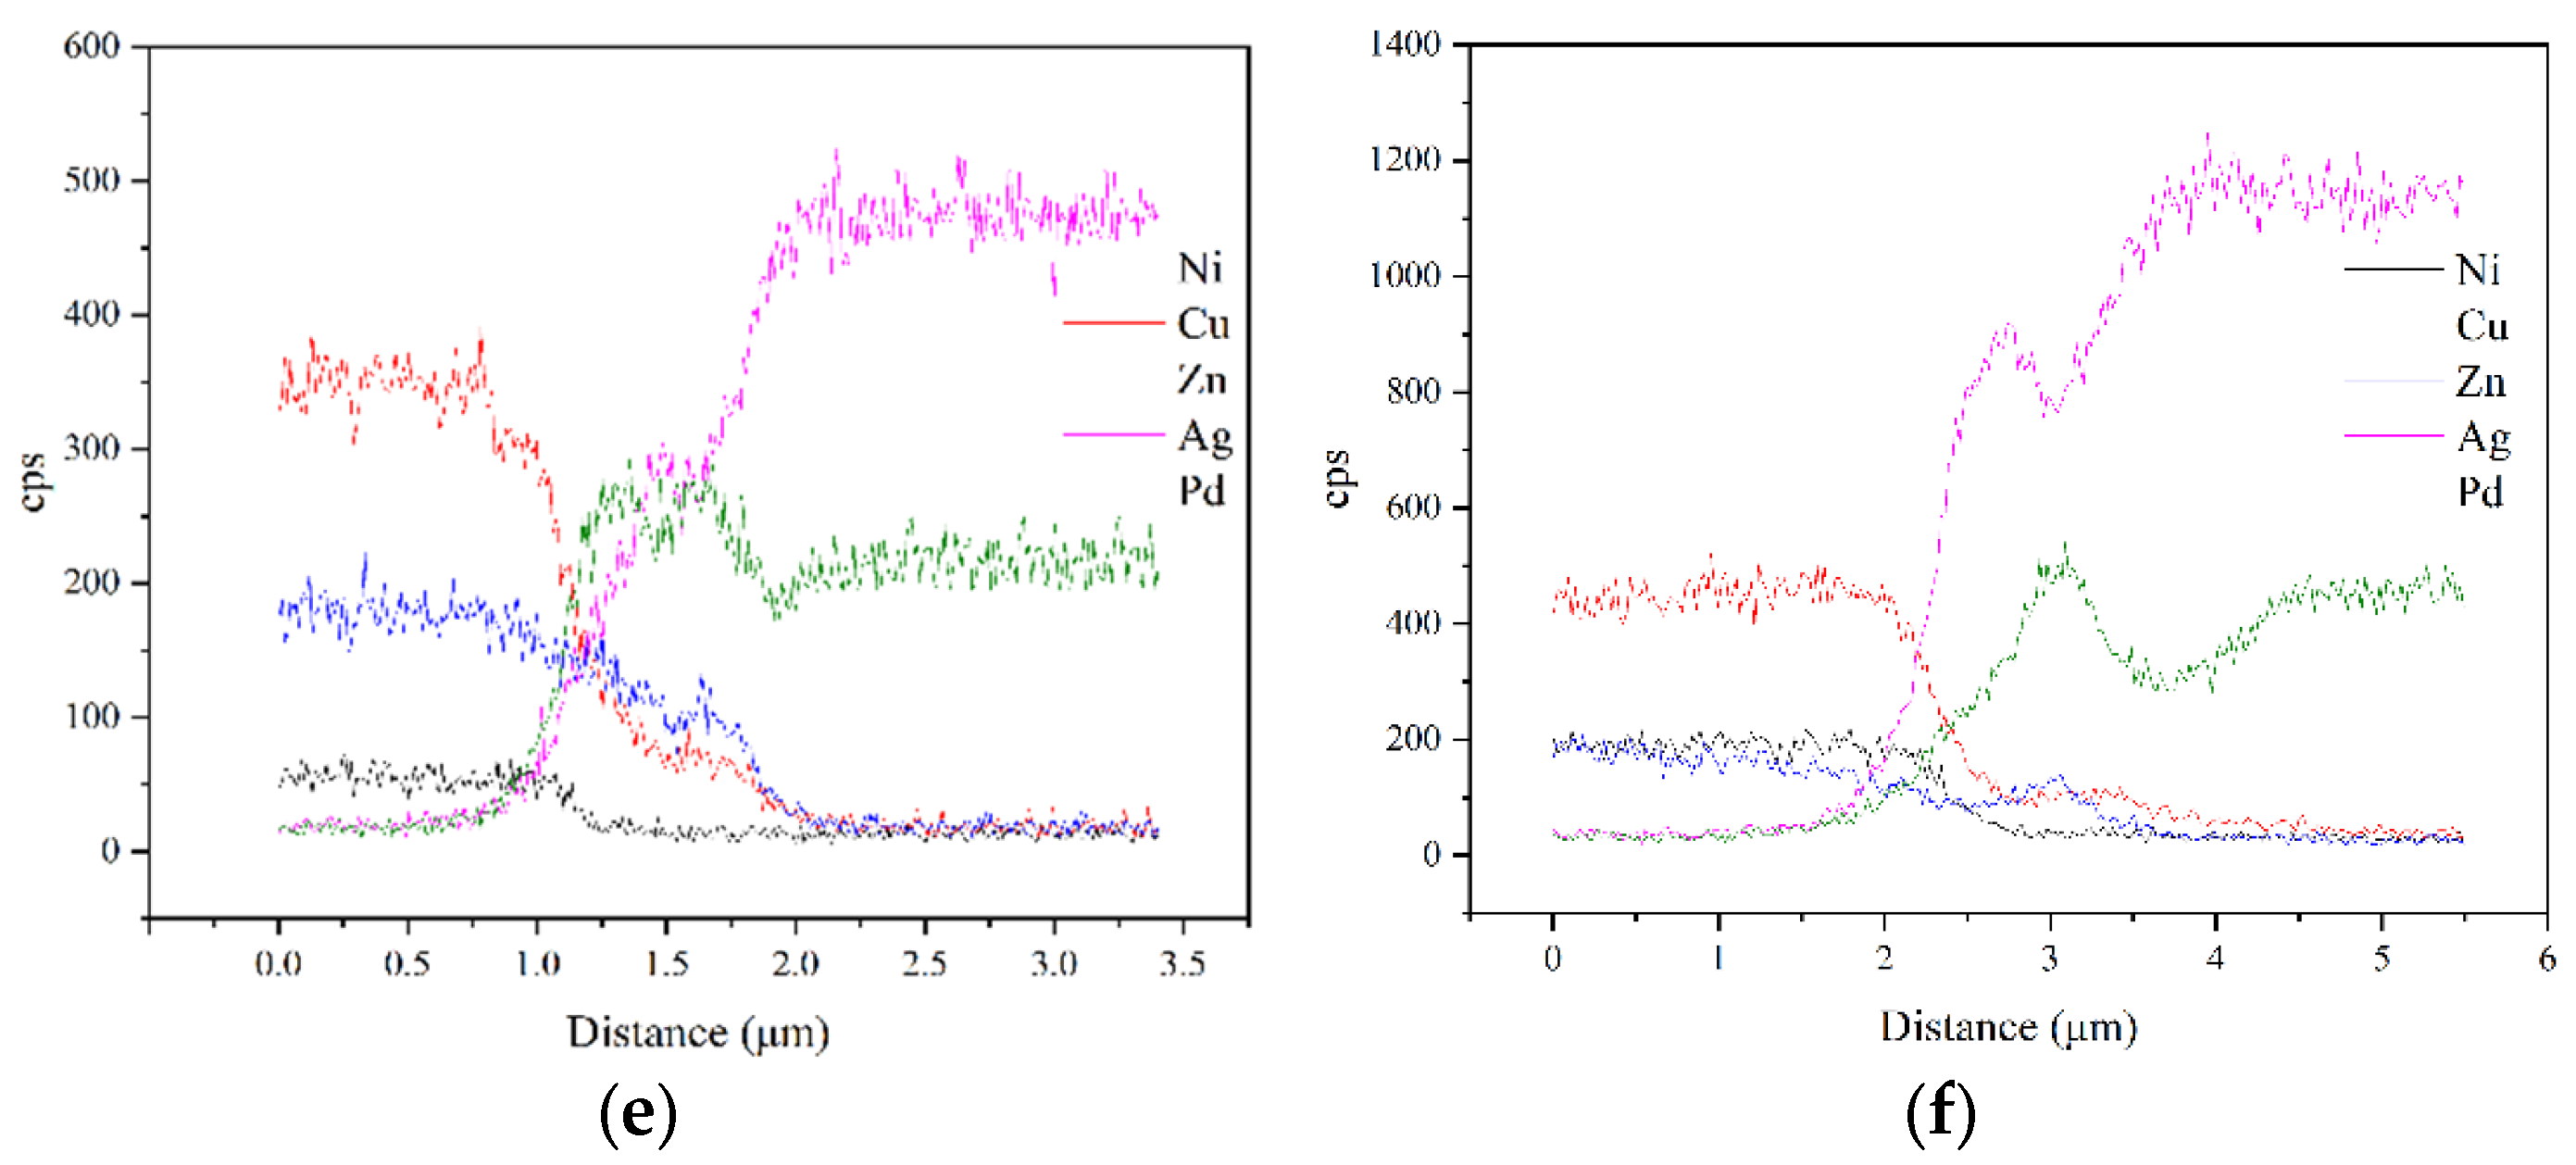
3.2. Elemental Distribution across the Interface

In order to follow the elemental diffusion process across the interface, EPMA mapping of each sample is provided in Figure 2. No observable diffusion occurred in the as-bonded sample HRB, although the interface is smooth without obvious defects. After annealing, a diffusion layer of about 2 μm thickness was formed (sample FA). Its thickness obviously decreased during the following cold rolling (sample FCR) and then increased after annealing (sample SA). This variation was repeated in the third pass of rolling and annealing. The diffusion layer was found in the AgPd30 layer as shown by the BSE images of the samples, indicating that a net atomic flow of the CuNi18Zn26 alloy immigrated to the AgPd30 alloy.
The composition distribution in the diffusion layer is noticeable. Apart from Ag and Pd, Zn and Cu appear in the layer, and the concentration of Zn is higher than that of Cu, whereas Ni is quite scarce here. Clusters enriched in Pd were formed in the diffusion layer after the first annealing. The number of clusters was decreased by the following cold rolling but increased again by annealing. The Pd-enriched clusters are located near the interface, leading to a slight enrichment of Ag in the area a little further from the interface. It is interesting to notice the segregation of Zn in the Pd-enriched clusters, especially in the as-annealed samples. However, the distribution of Cu is homogeneous in the diffusion layer, except for in the Zn and Pd-enriched clusters. Additionally, fluctuations of the Ni, Cu and Zn concentrations were found in the CuNi18Zn26 layer along the direction normal to the interface.
Figure 3 shows the EDS line scan patterns across the interface of the six samples. It can be found from Figure 3a that the concentration of the five elements across the interface changed monotonously in the as-bonded BLC. From the AgPd30 layer to the CuNi18Zn26 layer, the concentration of Ag and Pd decreased, but that of Cu, Zn and Ni increased continuously.
The width of the diffusion layer of the as-bonded and as-rolled samples was about 1 μm, which was increased to 2 μm or so after annealing. This is in agreement with the results of the EPMA analysis. After the first annealing, the fluctuation of the Pd and Zn concentrations with similar peak locations were formed, and a platform of Cu concentration was also found (Figure 3b). This tendency did not change obviously during the following rolling and annealing (Figure 3c–f). A depletion in Ag was detected at the Pd and Zn peak locations after the second annealing and following procedures (Figure 3d–f). Moreover, a slight increase in the Ni concentration was found near the boundary of the CuZn18Ni16 layer in the as-annealed samples (Figure 3b,d,f). The elemental distribution shown by the EDS line scan is in accordance with the results of EPMA analysis.

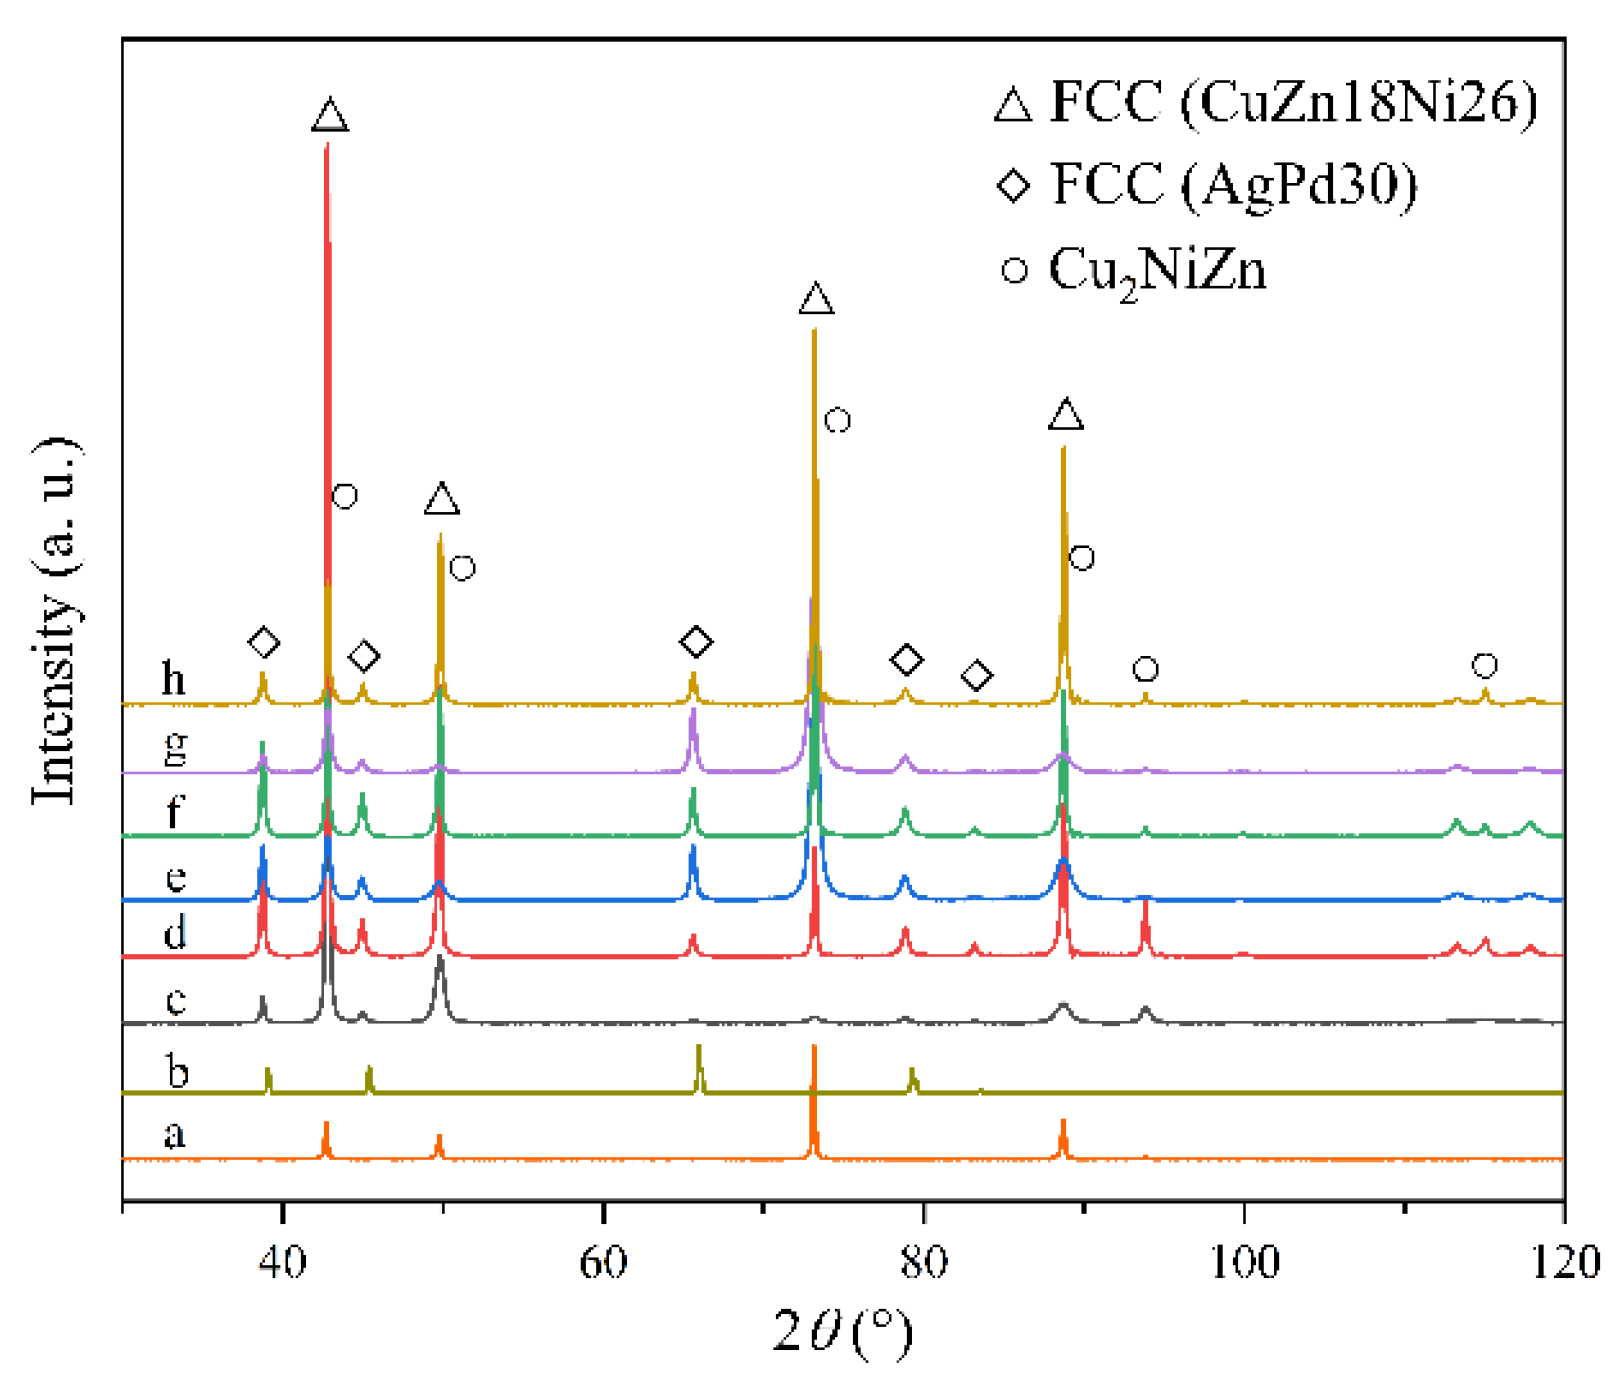
3.3. X-ray Diffraction Analysis

Figure 4 shows the X-ray diffraction patterns of AgPd30, CuZn18Ni16 and the BLC at different stages. For the BLC samples, the XRD patterns were obtained from an area of 2 mm in diameter across the interface. Both metal matrices are single-phase solid solutions with a face center cubic (FCC) lattice.
It is worth noting that a new phase Cu2NiZn (Cu3Au structure) was detected in the as-bonded sample. This phase was identified in the as-annealed samples, as well. However, the diffraction peaks from Cu2NiZn disappeared in the XRD patterns of the as-rolled samples.

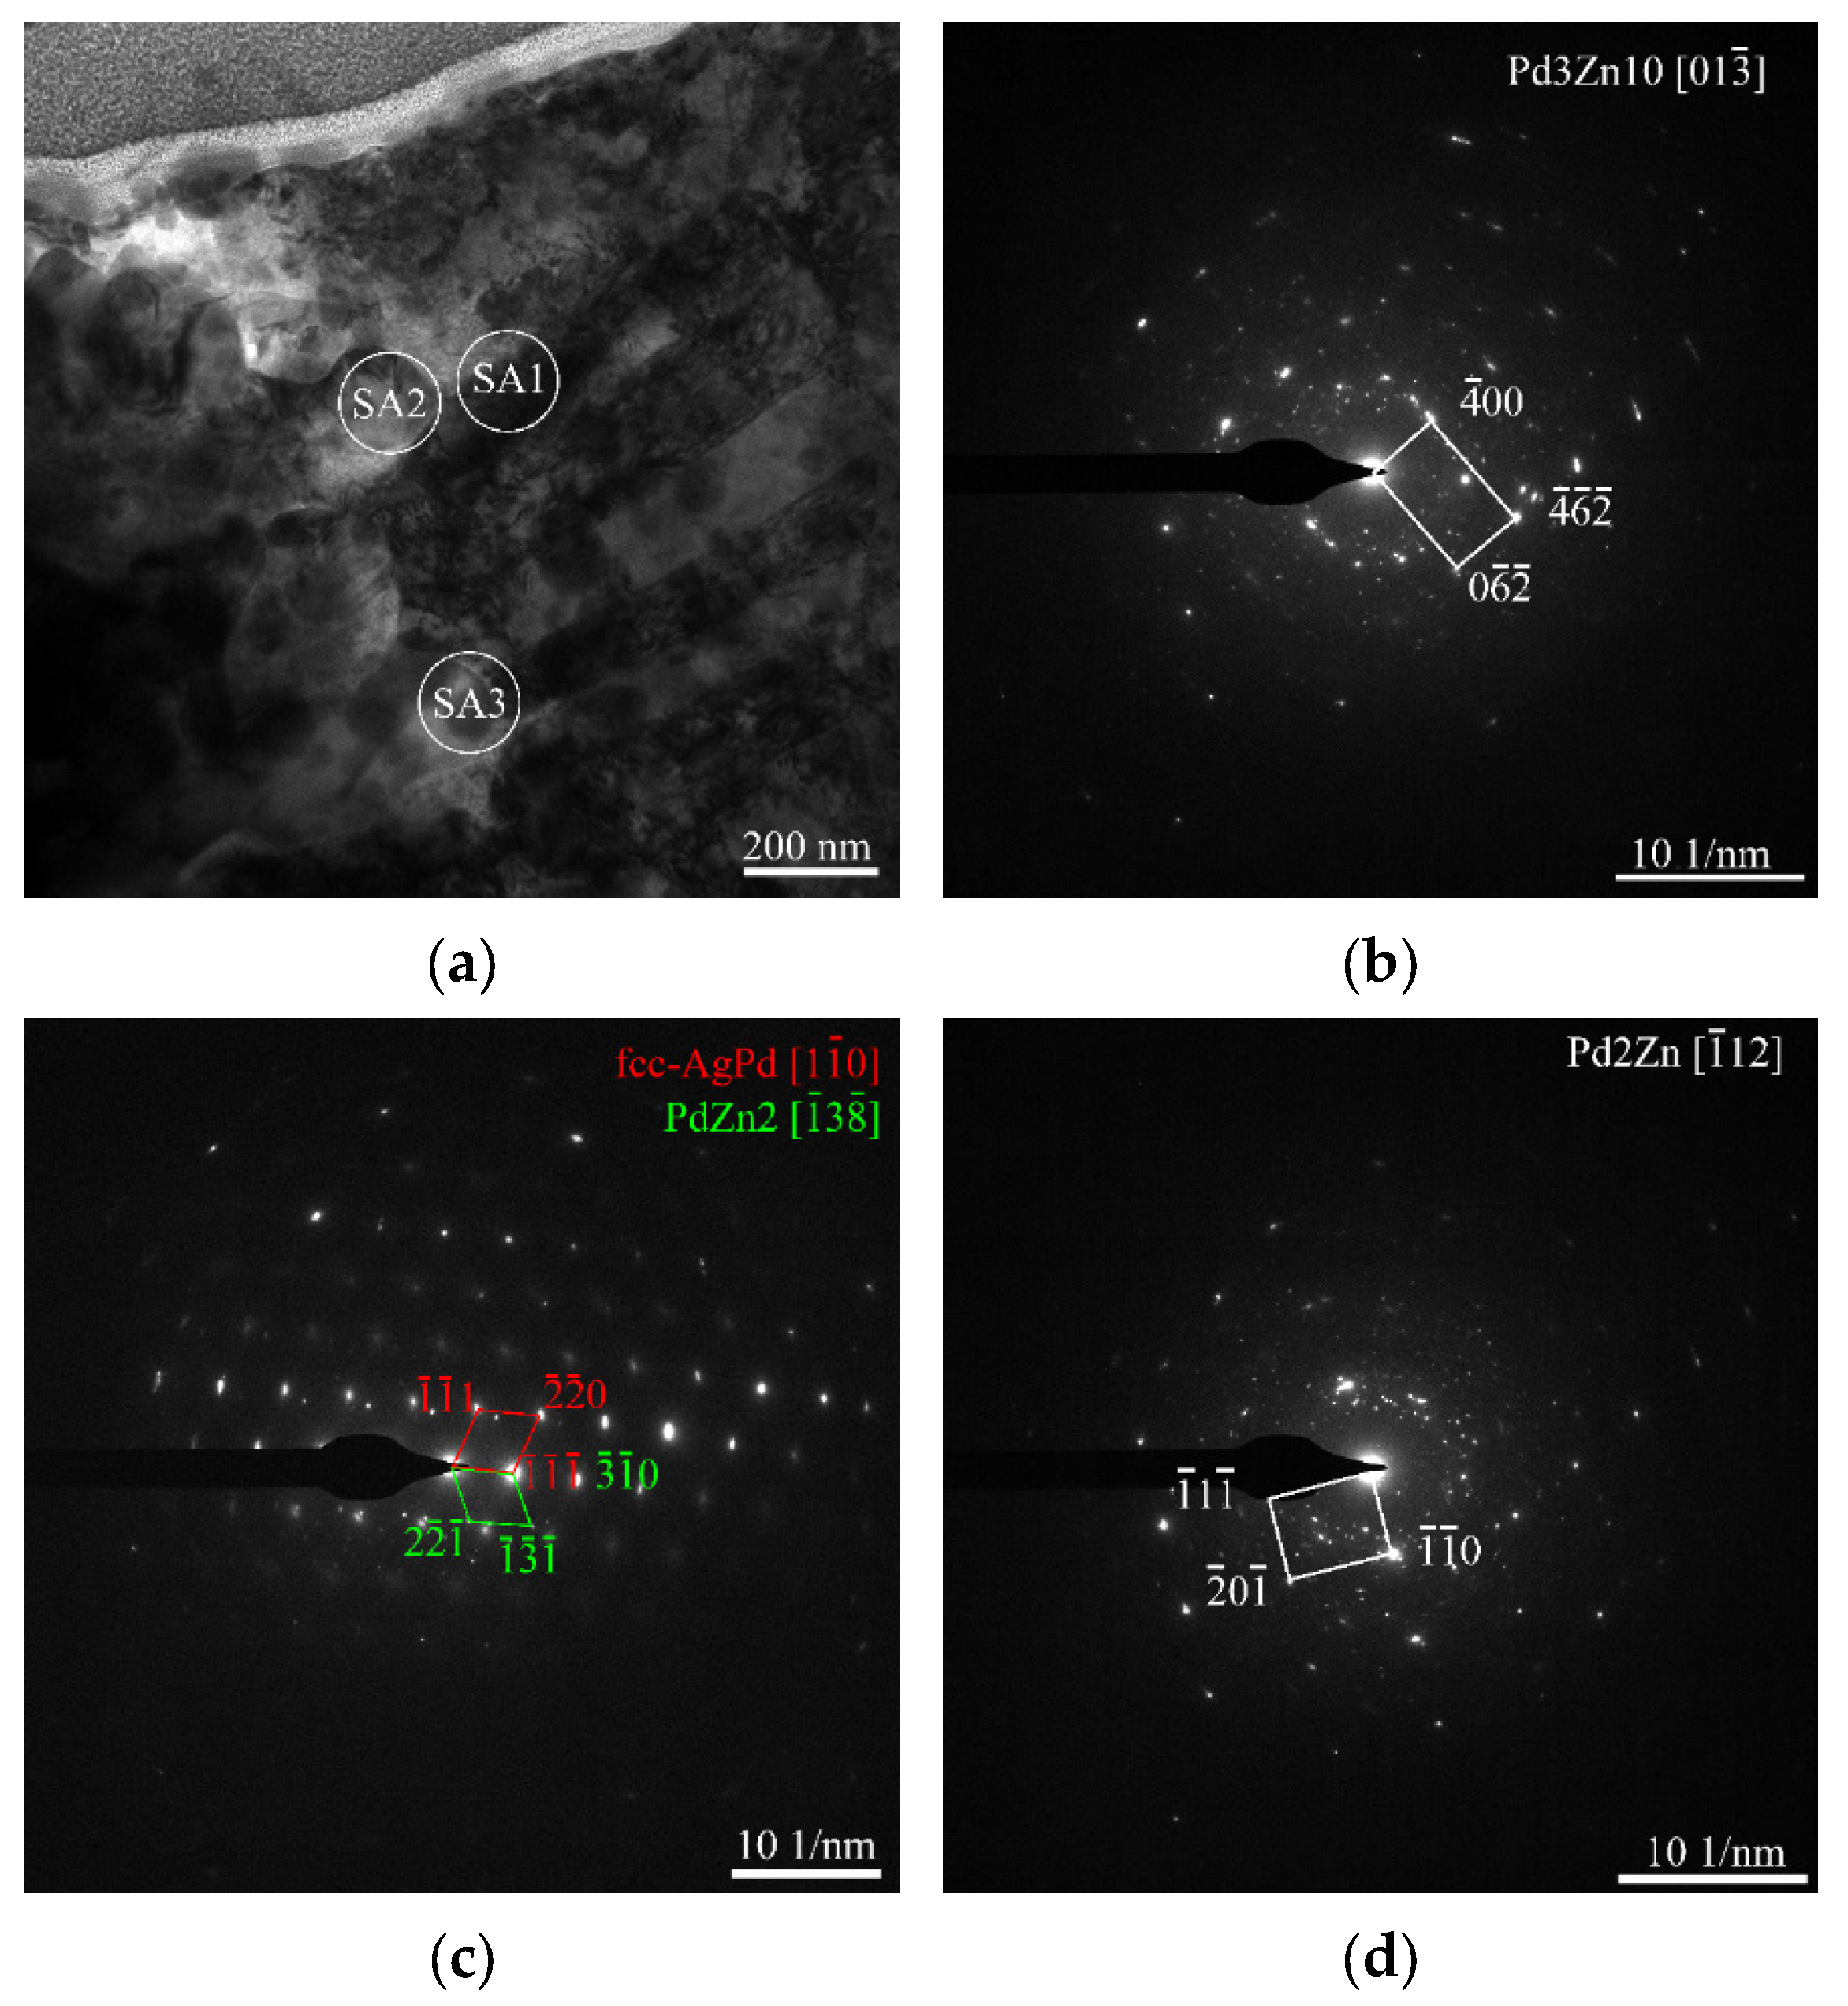
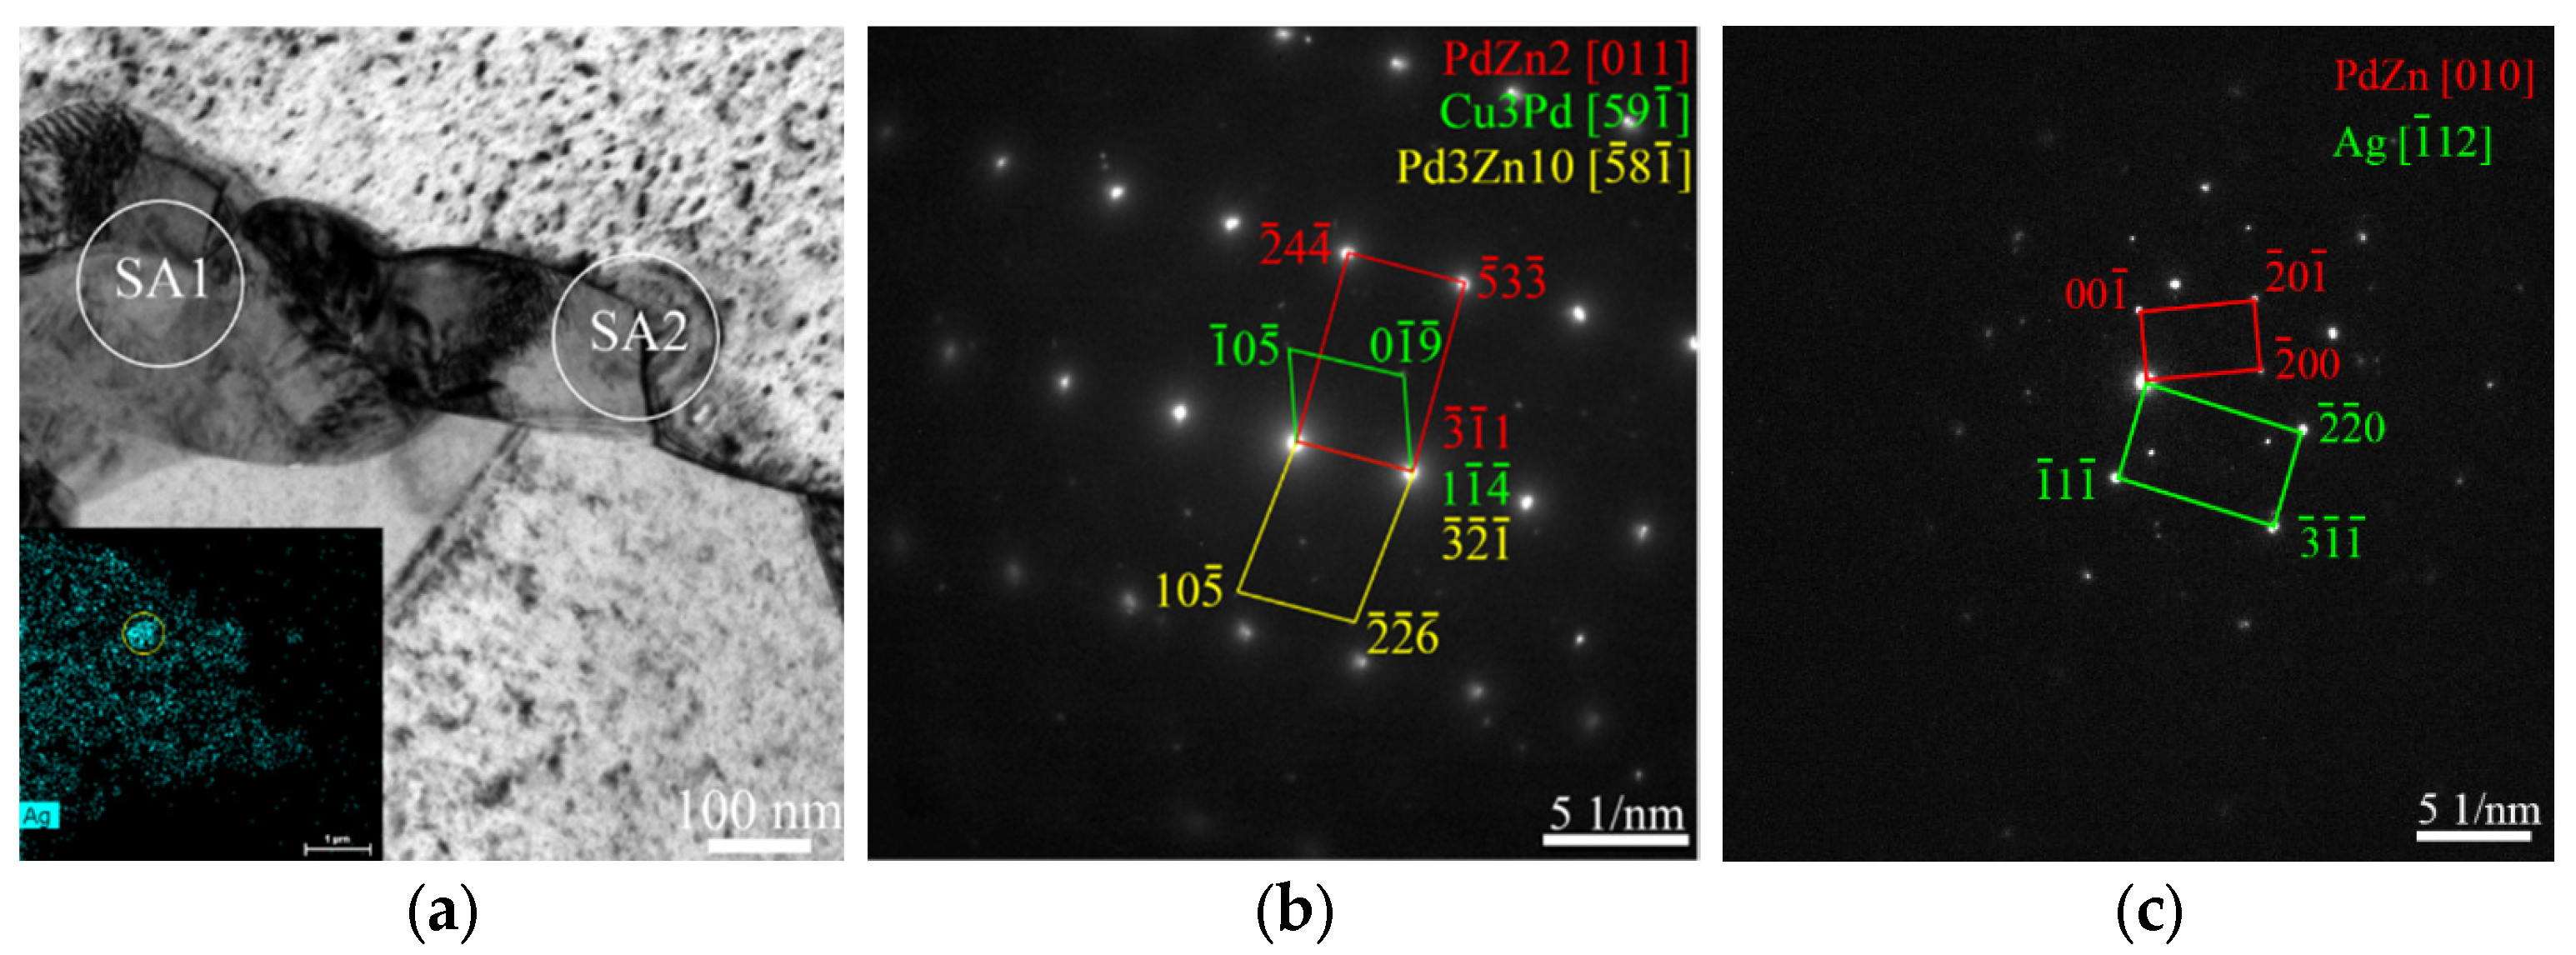
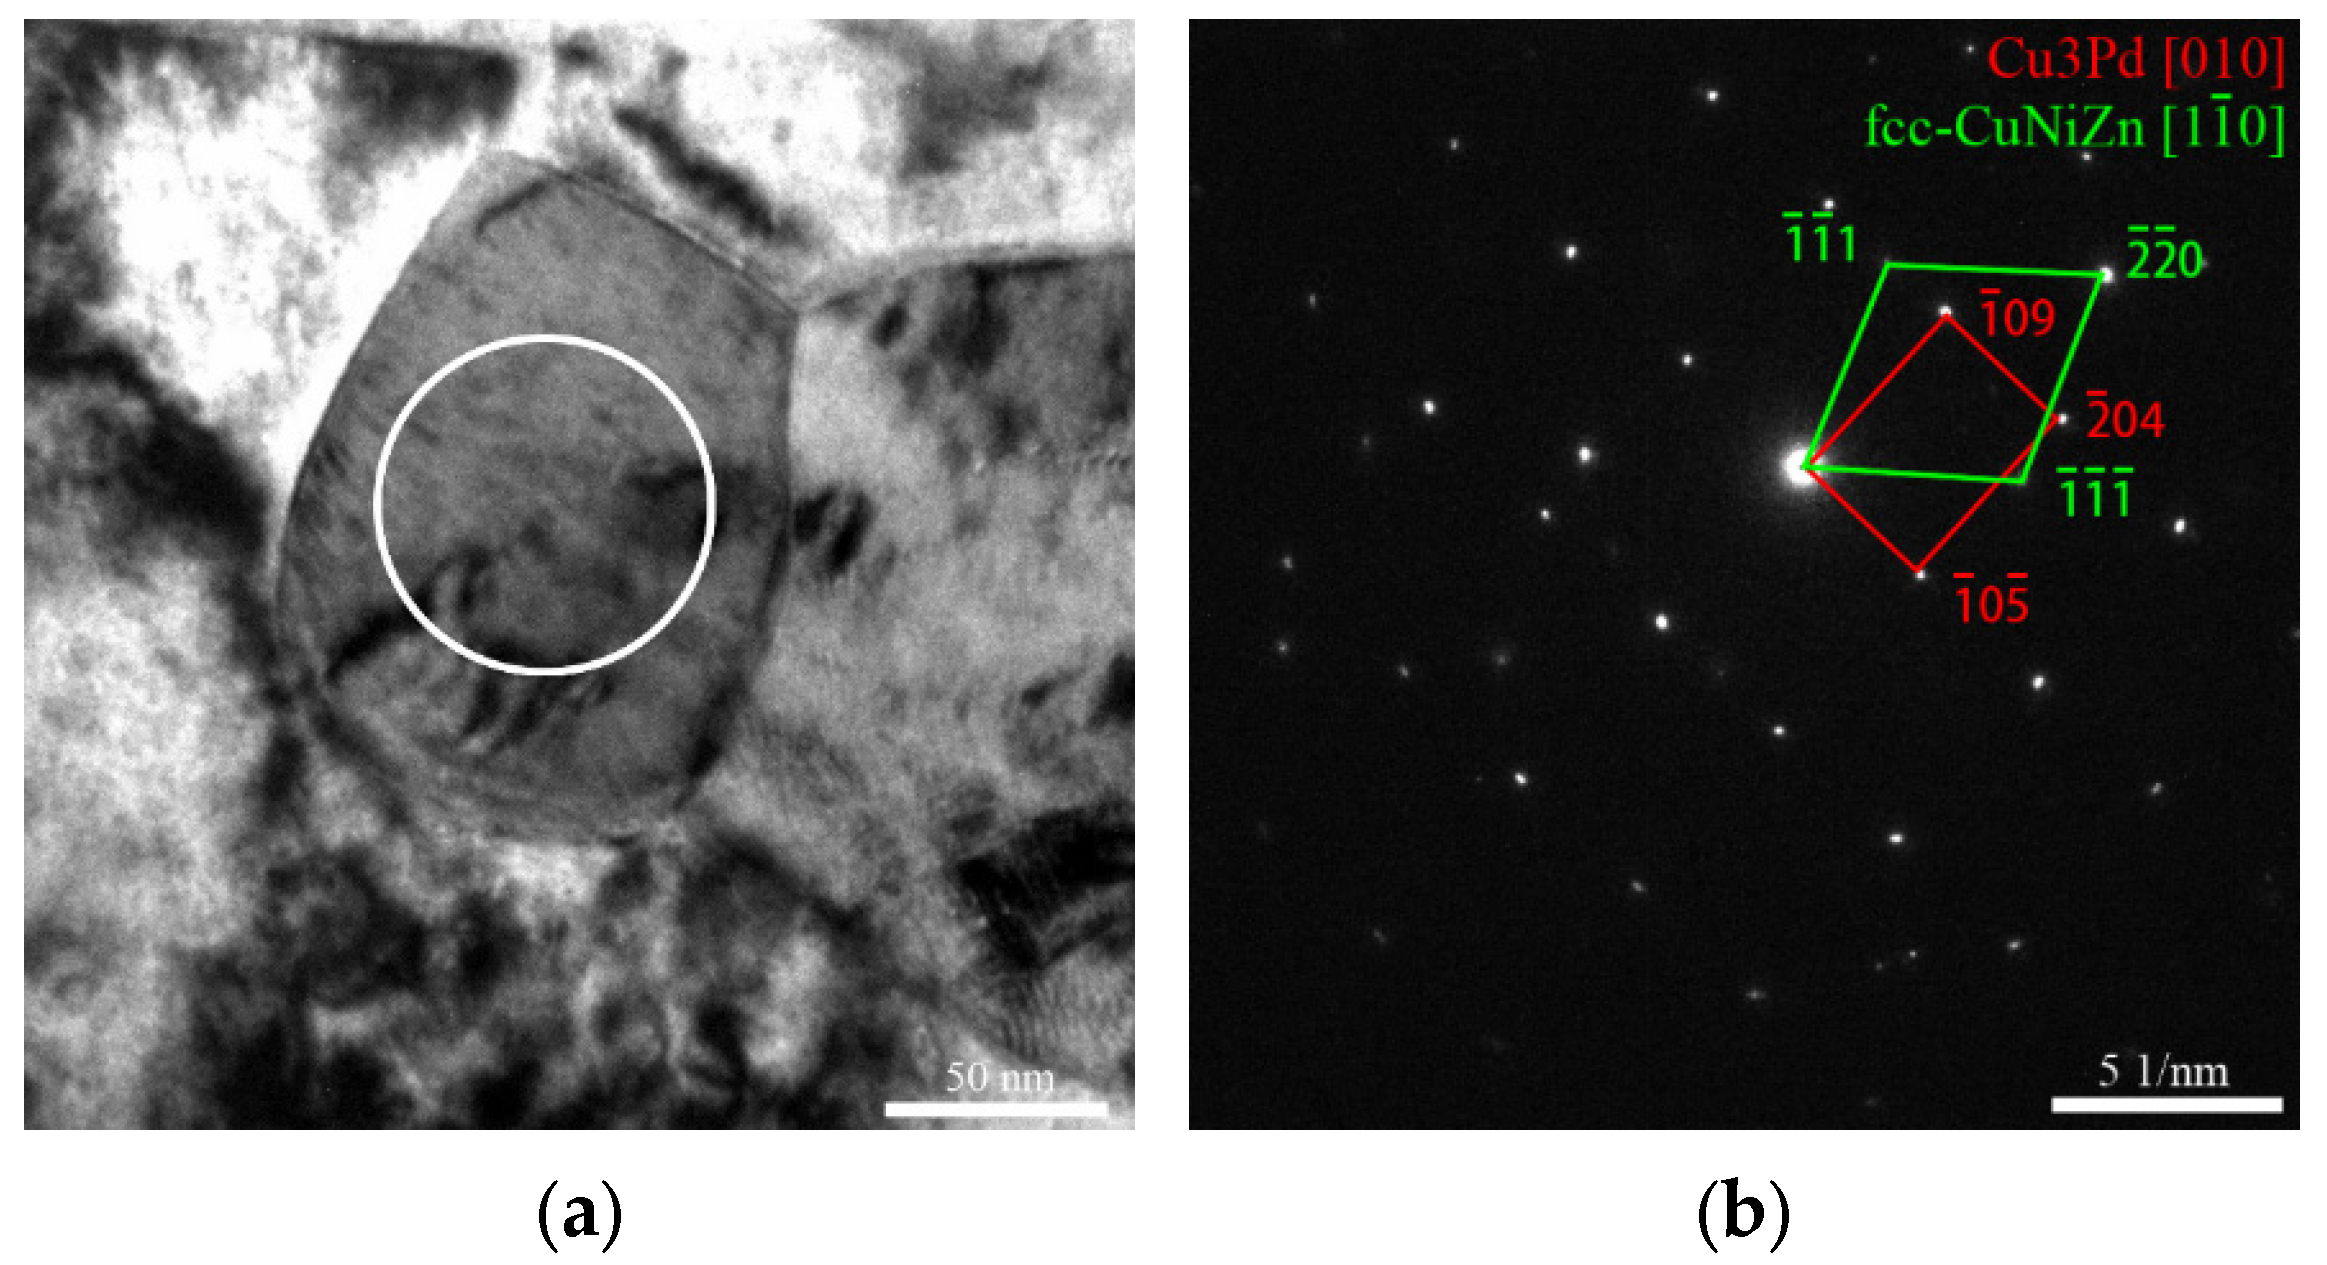
3.4. Transmission Electron Microscopy Analysis

As shown by the composition analysis, a diffusion layer of 1~2 μm thickness was formed in the BLM with some (Pd, Zn) enriched clusters. However, no new phase containing Pd and Zn was detected by XRD analysis. Considering the low resolution of XRD, it is reasonable to believe that the results of XRD analysis did not reveal all the new phases formed in the diffusion layer. Thus, TEM analysis was conducted on the diffusion layer of sample TA, the final product of this work.
The composition changes point by point in the diffusion layer (Figure 3), and thus, different types of new phases can be formed from the interaction of the elements [9,19]. The transmission electron microscopic observations are shown in Figure 5, Figure 6, Figure 7 and Figure 8. These images were taken from different locations of the diffusion layer so as to discern the products of the interface reactions to the highest extent.
A TEM image taken from a zone near the AgPd30 matrix is shown in Figure 5a. Many nanoparticles can be seen. Three intermetallic compounds were identified by SAED. Figure 5b–d show the SAED pattern of Pd3Zn10, PdZn2 and Pd2Zn, respectively. The varying Pd/Zn atomic ratio of the compounds suggests the heterogeneous distribution of Zn in the diffusion layer. In Figure 5c, the orientation relationship between PdZn2 and the FCC-AgPd solid solution (the composition is not necessarily the same as the original AgPd30 alloy due to the atomic diffusion) was determined as (310)PdZn2//(111)AgPd.
Figure 6 and Figure 7 were taken from the middle zone of the diffusion layer. Another intermetallic compound of Pd and Zn, Pd2Zn3, was identified in Figure 6b. Figure 7 provides some interesting results. Cu3Pd, along with PdZn2 and Pd3Zn10, was identified in Figure 7b. Furthermore, the orientation relationship among these three compounds was found to be (114)Cu3Pd//(311)PdZn2//(321)Pd3Zn10. In Figure 7c, an α-Ag particle was identified, implying the severe separation of Pd from the AgPd30 alloy due to its affinity with Zn. The segregation of Ag was confirmed at this zone by EDS mapping. As a result, an intermetallic compound PdZn was found to coexist with the α-Ag particle, but their orientation relationship is not clear (Figure 7c).
A typical TEM image near the CuNi18Zn26 layer is shown in Figure 8. Cu3Pd was found here again. The diffraction spots of the FCC-CuZnNi solid solution (the composition is not necessarily the same as the original CuZn18Ni26 alloy due to the diffusion) were indexed as well. Nevertheless, no orientation relationship can be determined at this stage.

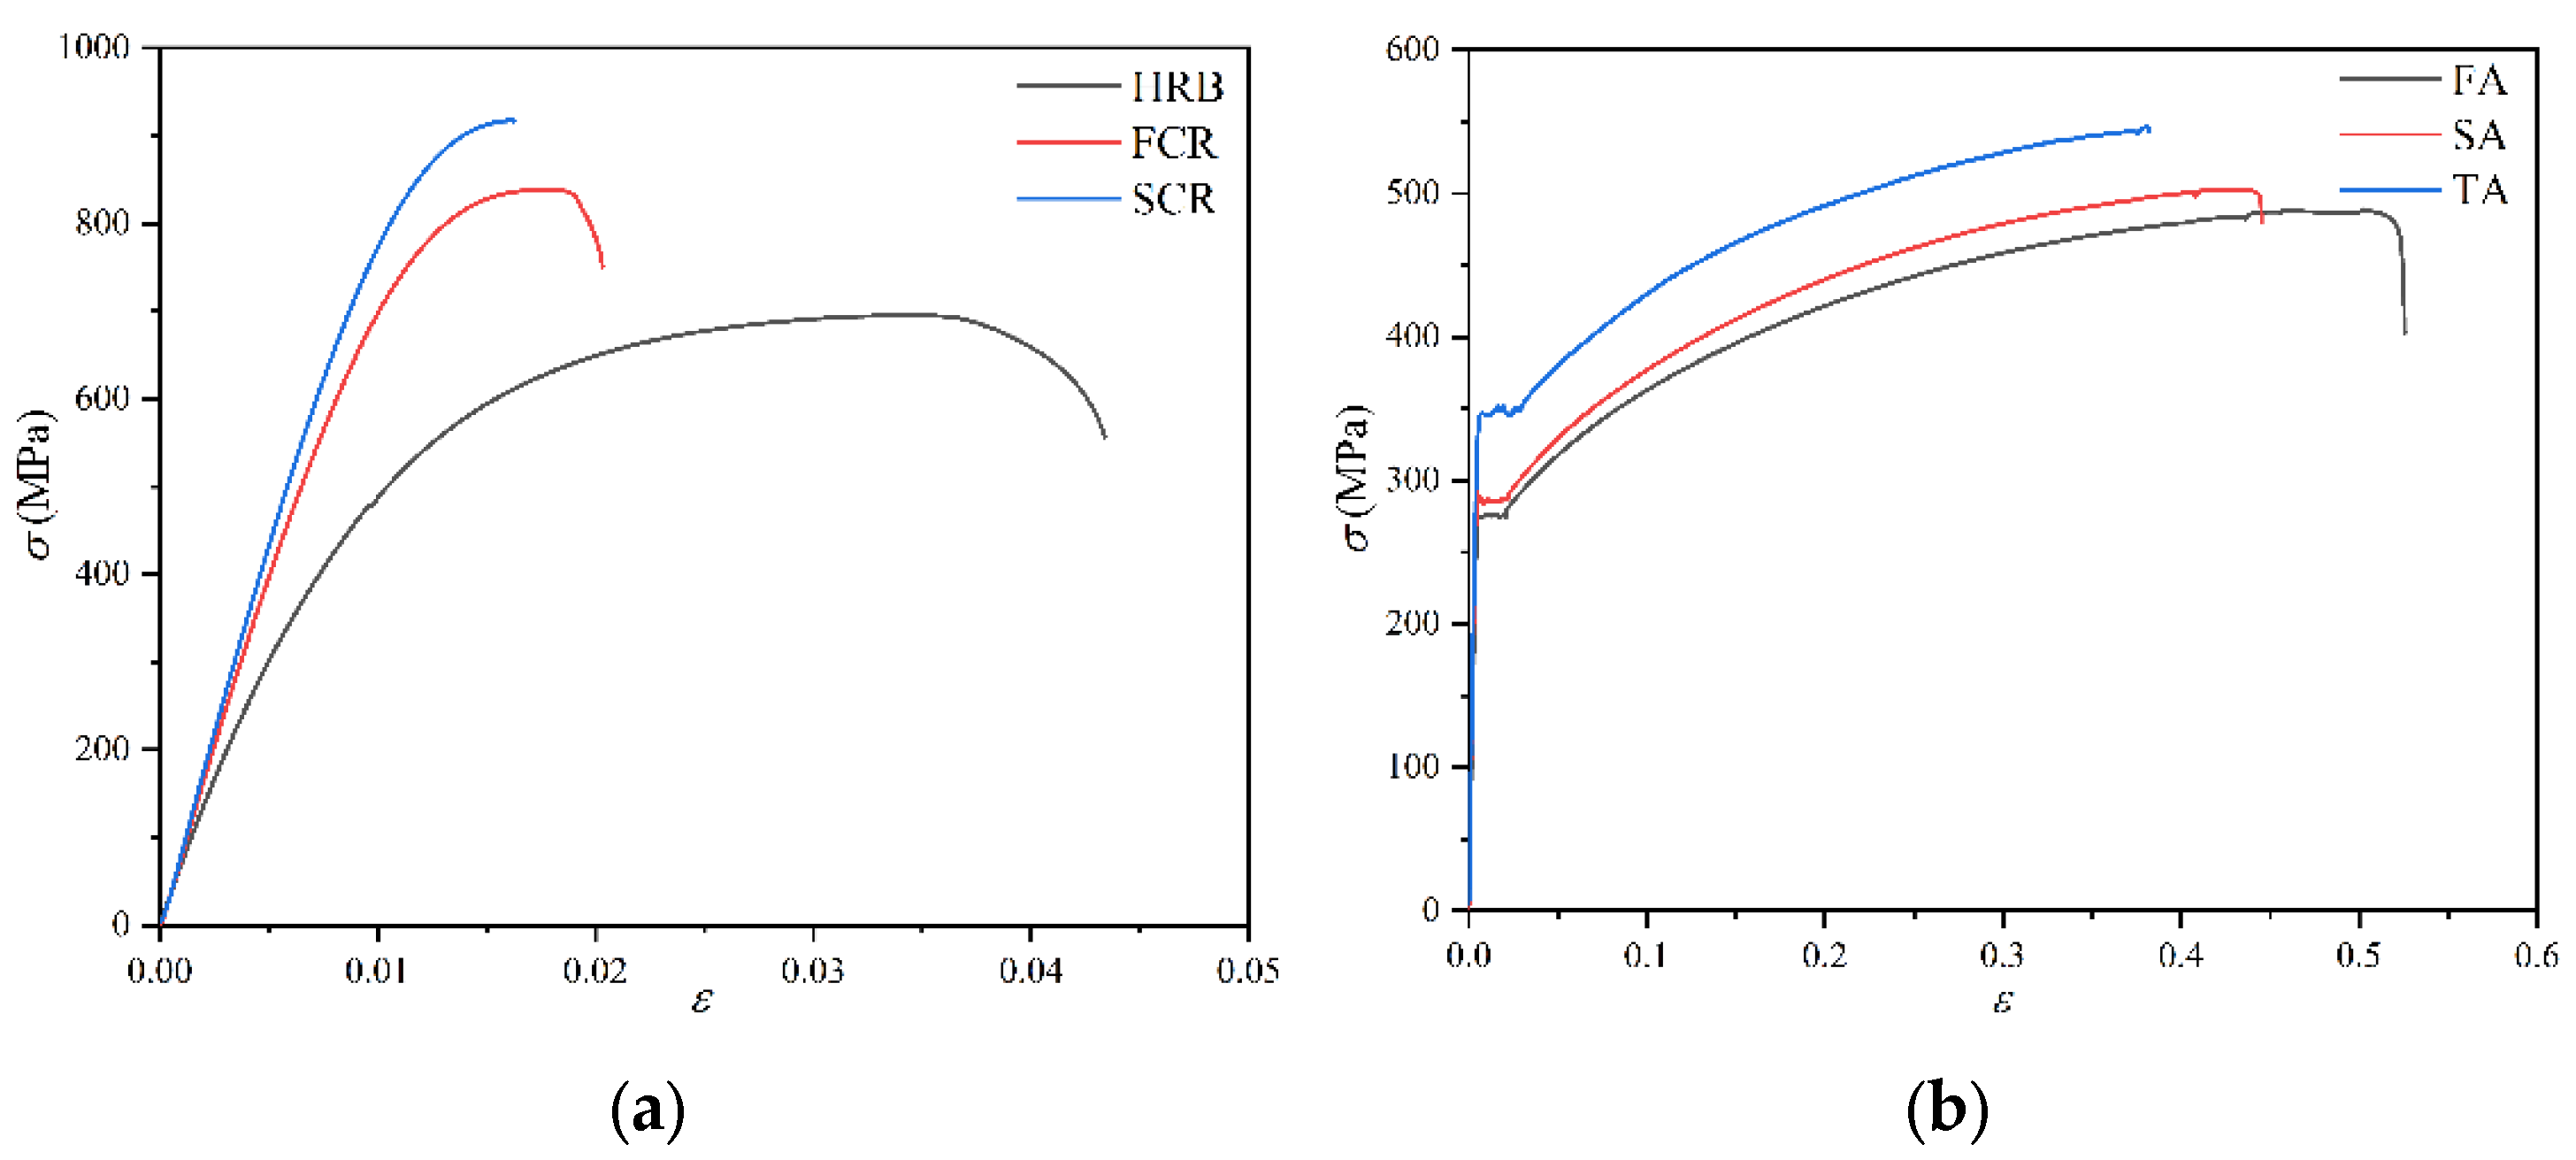
3.5. Tensile Properties Measurement

The mechanical properties of the AgPd30/CuNi18Zn26 BLC were investigated with the room temperature tensile tests. Figure 9 demonstrates the variation of tensile behavior with the processing procedure, i.e., each pass of rolling and annealing. It was found that both yield strength (YS) and ultimate tensile strength (UTS) increased with the successive cycles of rolling and annealing, while the elongation (EL) decreased gradually. It is noteworthy that two turning points appear at the initial stage of plastic deformation of the stress-strain curves of the as-annealed samples. Similar phenomena were observed in Al/Cu/Al laminated composites [21]. However, the tensile curves of as-rolled samples are smooth in the whole stage of plastic deformation. The YS, UTS and EL of the final laminated composite with 0.11 mm thickness are 345 MPa, 540 MPa and 37.2%, respectively.
The fracture morphology of the BLC was examined using SEM. Figure 10 shows the fracture surfaces of different samples, where the upper and lower layers are the AgPd30 and CuNi18Zn26 alloys, respectively. For all the samples, delamination is obvious with a crack at the boundary of the two layers, and the width of boundary cracks, indicated by the yellow dashed lines, decreased after each rolling and annealing. Dimples are the primary microstructure of the fractures of the CuZn18Ni16 layer, suggesting that ductile fractures occurred in all the samples despite the large difference of EL between the as-rolled and as-annealed samples. The fracture surfaces of the AgPd30 layer are flat, suggesting a brittle fracture mechanism. However, considering the small fraction of the AgPd30 layer, its effect on the mechanical performance of the composite can be neglected.

4. Discussion

4.1. Diffusion in the Interface

Diffusion is the most important process in the laminated composites because it is the basis for the metallurgical bonding. In some immiscible systems, special techniques are used to facilitate the diffusion in the interface [22]. Fortunately, the elements in the two metal matrices used in this work are miscible with each other, except for Ag and Ni. Hence, a diffusion layer was formed. Generally, the coefficient of diffusion is related to the atomic radii [23], which are shown in Table 2.
As shown in Table 2, all the radii of Cu, Zn and Ni are smaller than those of Ag and Pd; thus, a net atomic flow immigrated from the CuNi18Zn26 layer into the AgPd30 layer, resulting in a diffusion layer in the latter (Figure 2). However, the diffusion of Ni was hindered by Ag due to their immiscibility, leading to the absence of Ni in the diffusion layer (Figure 2 and Figure 3). The deformation behaviors of the two layers were different during cold rolling, and the deformation of the material near the interface was restricted by the metallurgically bonded interface. Hence, additional shear stress and strain resulted, leading to increasing nucleation rates of recrystallization and smaller grain sizes near the interface.
The AgPd30 layer is key to the performance of the laminated composite in sliding electrical contact, and the damage of this layer is the primary cause of the deterioration and failure of brushes [24]. It is very important to decrease the dilution of the AgPd30 alloy to the maintain its excellent electrical contact properties. Based on the composition distribution analyses at different stages (Figure 2 and Figure 3), diffusion occurred mainly in the annealing process, and the diffusion layer thickness can be decreased by cold rolling. Therefore, the rolling and annealing parameters were controlled carefully to keep the diffusion layer as thin as possible while obtaining sufficient bonding strength.

4.2. Reactions in the Interface

It is well known that a phase transformation can result from a change in composition. Several intermetallic compounds were found in this work, indicating the complication of the interface reaction. In the XRD patterns, the Cu3Au-type superstructure Cu2NiZn is identified in the as-bonded and as-annealed samples. This compound was not formed in the diffusion layer, because Ni almost did not diffuse from the CuZn18Ni16 layer (Figure 2). This is why Cu2NiZn was not found by the TEM characterization performed on the interface.
The atomic ratio of Cu/Ni/Zn in the CuZn18Ni16 alloy is 55/20/25. A random solid solution is the equilibrium phase, according to the phase diagram [25]. During the annealing process of the BLC, Cu and Zn diffused into the AgPd30 layer, leading to the decrease in Cu and Zn and the increase in Ni in the CuNi18Zn26 layer next to the interface. Hence, a Cu2NiZn superstructure was formed. During the subsequent cold rolling, the ordered structure was destroyed due to dislocation sliding [26] and composition homogenizing resulting from diffusion in the CuZn18Ni16 layer [27,28], and thereby the diffraction peaks of Cu2NiZn disappeared in the XRD patterns of as-rolled samples (Figure 4). On the other hand, the bonding pass was a hot-rolling process, and interface diffusion occurred to some extent (note the fluctuations of the Ni and Cu concentrations in the CuNi18Zn26 layer shown in Figure 2), resulting in the formation of Cu2NiZn (Figure 4c) in the as-bonded sample.
Usually, a layered distribution of intermetallic compounds with different atomic ratios is found in the diffusion layers of laminated composites composed of pure metals [18,21,29] or dilute alloys [30,31] after they are annealed for enough time. But such a distribution was not found in this work. First, the concentrations of the alloying element in the matrix alloys are so high that the immigration of the elements could interfere strongly with each other, leading to the nonmonotonic composition gradients in the diffusion layer (note the undulation of the EDS line scan curves in Figure 3). Secondly, the annealing time in this work is too short for the formation of a layered distribution of intermetallic compounds. Thirdly, the distribution of the compounds could be changed by cold rolling [31]. Therefore, the distribution of the Zn-Pd compounds with different atomic ratios is irregular in the diffusion layer.
According to the Cu-Pd phase diagram, two compounds, CuPd and Cu3Pd, can be formed, but only Cu3Pd was found in the diffusion layer. Similarly, Cu3Pd was also the only Cu-Pd binary precipitate formed in an AgPd30/CuSn6 laminated composite [32]. Considering the diffusion layer is primarily located in the AgPd30 layer, one possible reason for the absence of CuPd is that the formation of many Zn-Pd compounds decreases the number of Pd atoms to react with Cu. However, more investigations need to be conducted on this point.
Based on the XRD and TEM characterization, the lattice parameters of the phases identified in this work are summarized in Table 3. The theoretic data are also shown for comparison. For all compounds, the measured lattice parameters are different than the theoretic values, indicating that elemental substitutions occurred in the compounds. This phenomenon illustrates the complication of the interface diffusion and reactions to some extent.

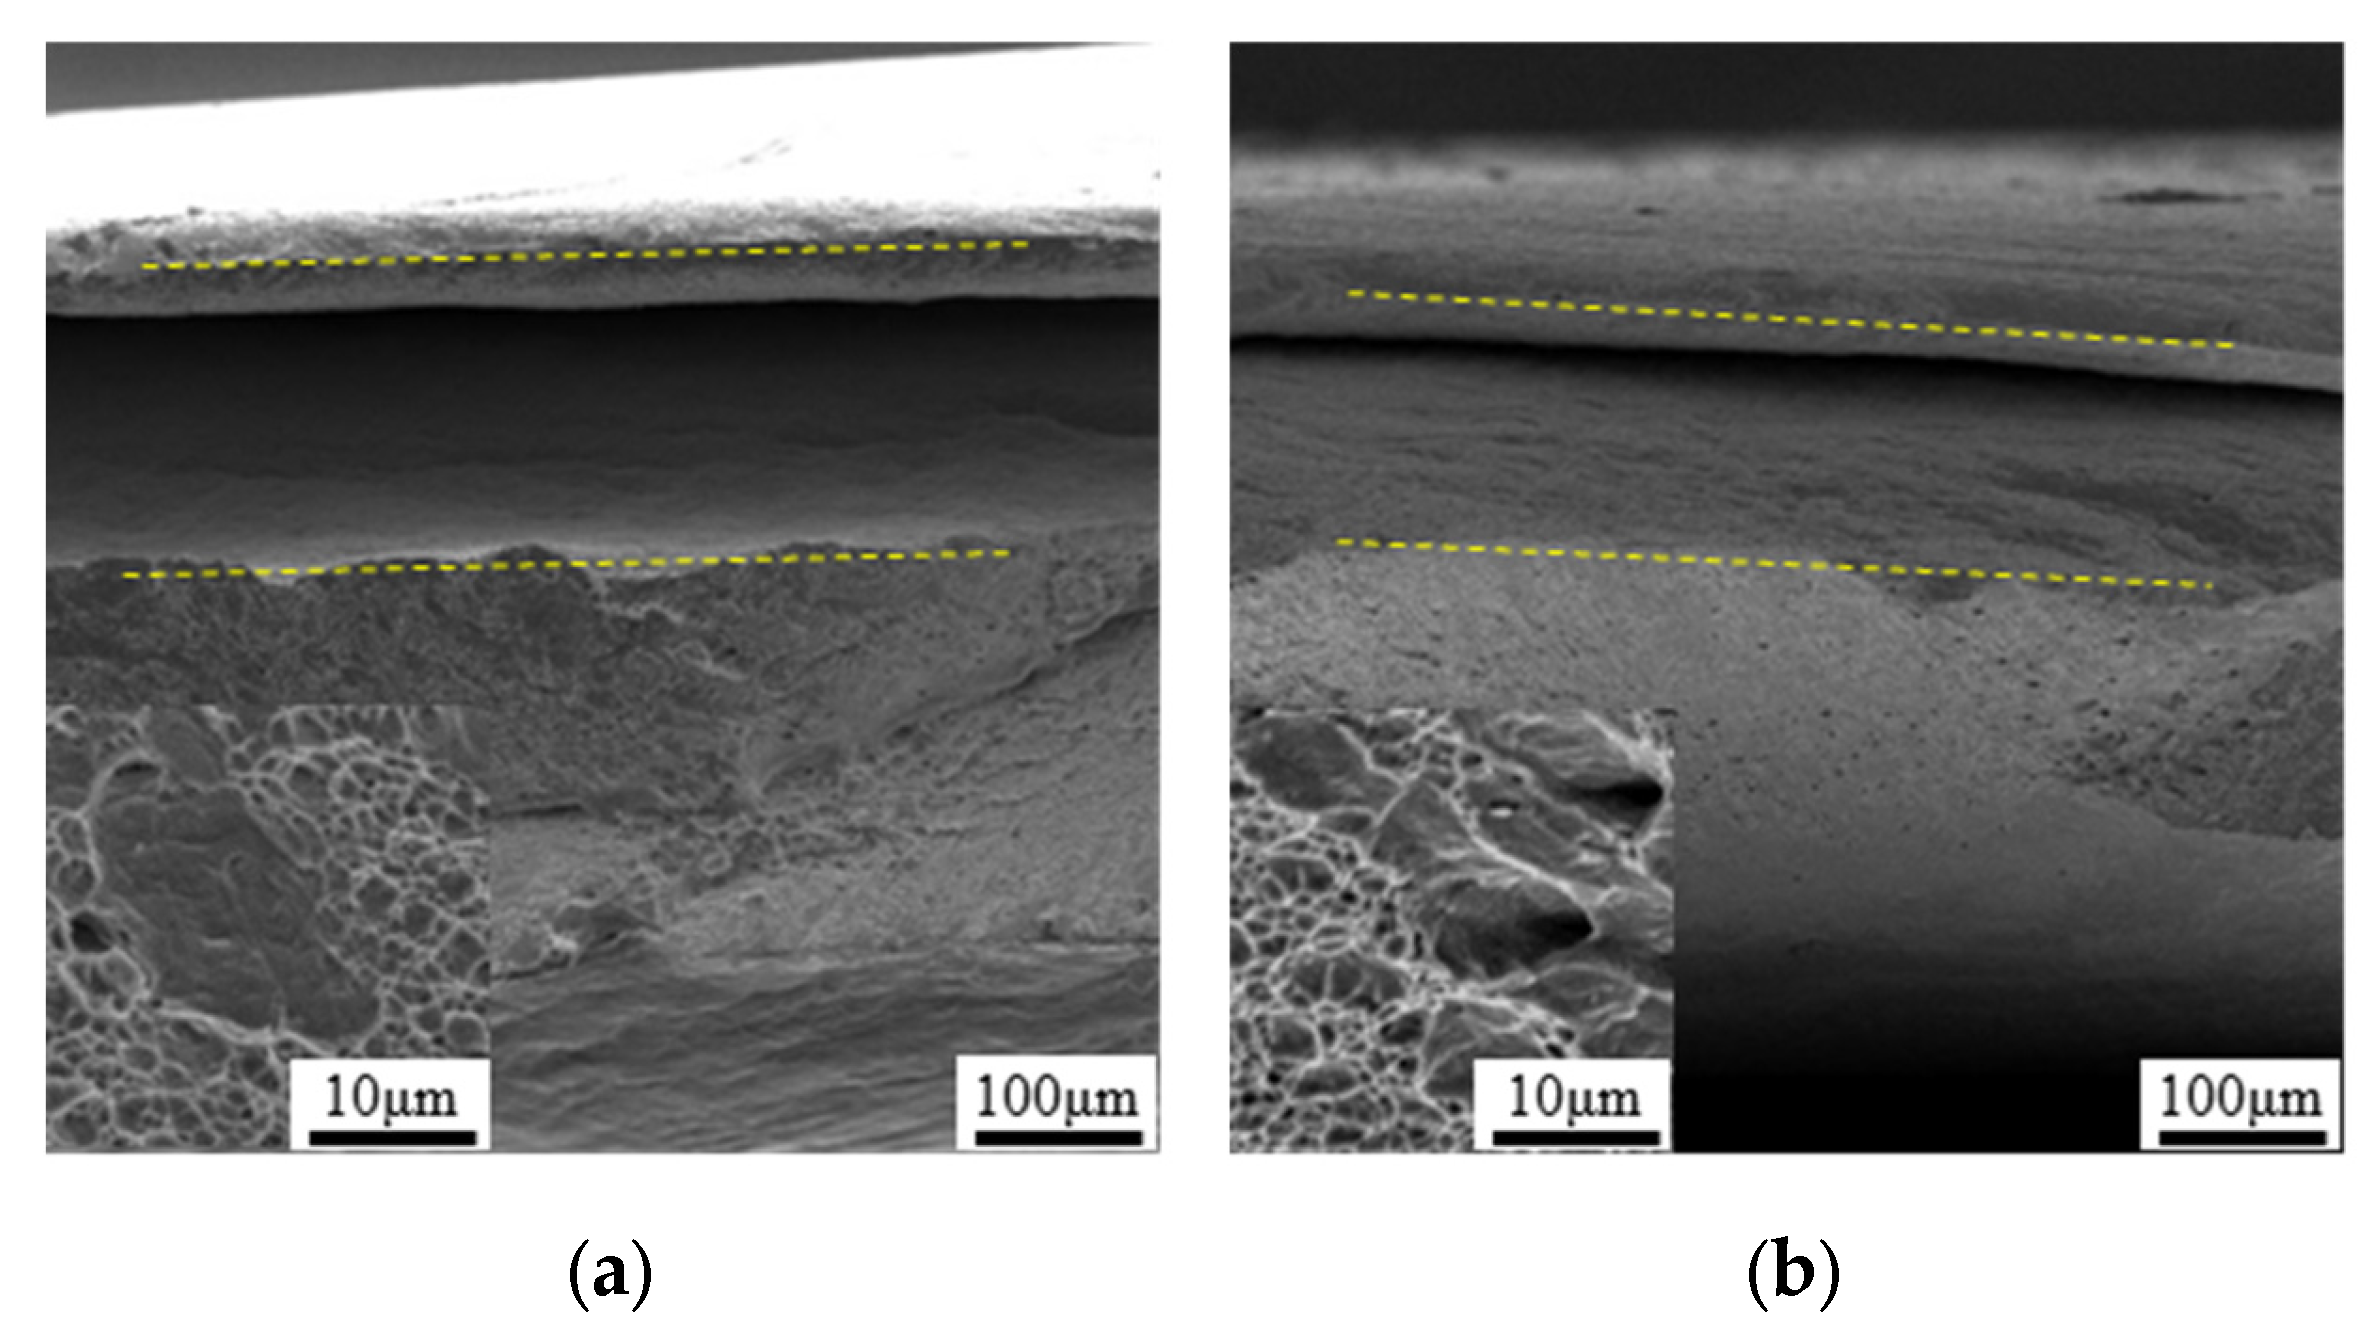
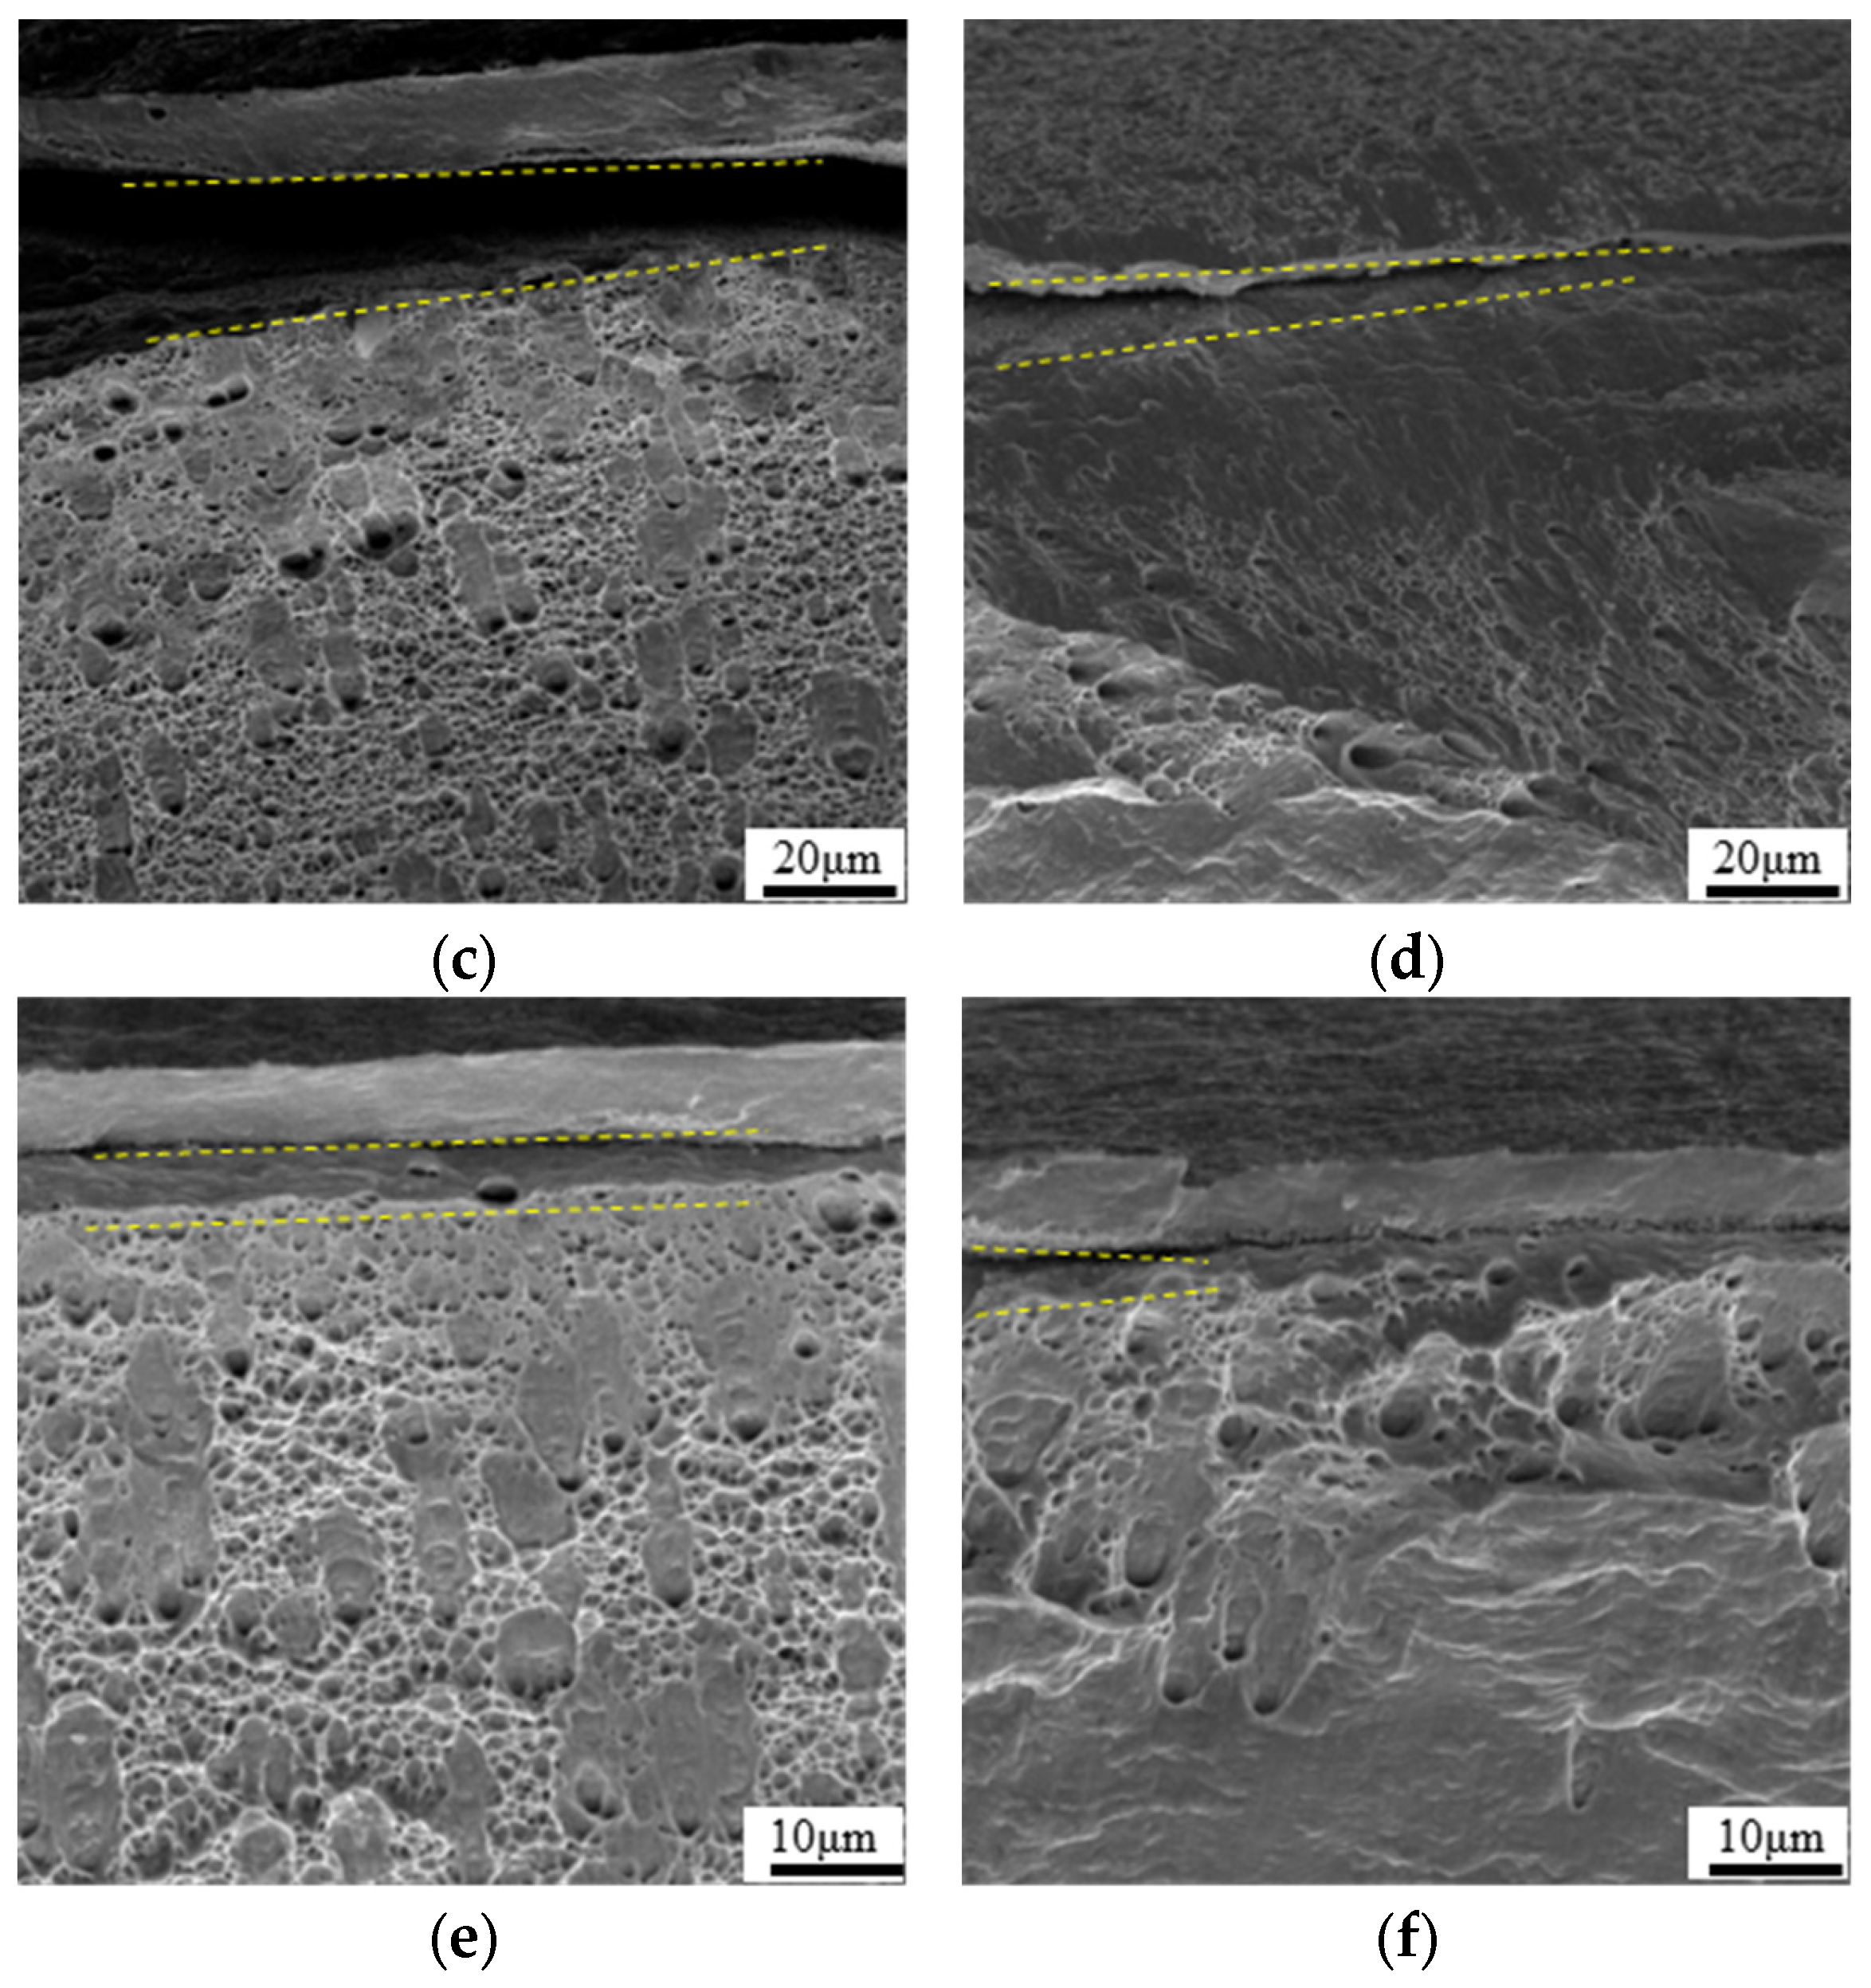
4.3. Interface Bonding and Its Effect on the Fracture of BLC

In this work, the two layers were bonded metallurgically due to the interface diffusion during the rolling and annealing process. However, the bonding strength might be undermined by the intermetallic compounds formed in the diffusion layer [21], and delamination was found in all the tensile samples. In fact, delamination is a common phenomenon in laminated composites [11,27,33]. Diffusion occurred primarily in the annealing processes, leading to an increase in bonding strength and a reduction in delamination. Furthermore, the bonding strength is generally increased with an increasing reduction rate [11,33]. Hence, the width of delamination is decreased after each rolling and annealing. After the final annealing, only a tiny fraction of the interface was delaminated during tensile testing. Fortunately, the AgPd30/CuNi18Zn26 laminated composite is mainly used for sliding electrical contactors that usually stand against wear with current during applications. The delamination under tensile load does not create a critical defect for this composite. However, the factors affecting the bonding strength, especially the intermetallic compounds, are worthwhile to be explored in the next step.
Apart from strength and elongation, another different feature is shown in the tensile curves of the as-rolled and as-annealed samples. There are two turning points with a platform in between on the curves of the as-annealed samples, which do not appear on the curves of the as-rolled samples. According to Li [21], the turning points can be ascribed to the deformation of the interface. In their work, two turning points on the tensile curves were correlated to the failure of two interfaces with different bonding strengths [21]. Only one interface was formed in our laminated composite. Hence, it is reasonable to postulate that the first turning point resulted from the cracking of the interface. The failure of the interface led to the decrease of the strength of BLC, which was just compensated by the strain hardening of the metal matrices in the as-annealed samples. Therefore, a platform was formed on the tensile curves. When the strain hardening surpassed the softening effect of the interface failure, the second turning point appeared. On the other hand, the mechanical properties of laminated composites are crucially determined by the matrix materials. For the as-rolled samples, the strength of the metal matrices was high enough to overcome the two-turning-point and platform phenomena. Additionally, the strain hardening rate of the as-rolled samples is higher than that of the as-annealed samples, as indicated by the slopes of the tensile curves. The strength loss resulting from the interface-cracking can be covered by the strain hardening. Therefore, the tensile curves of as-rolled samples present smooth features.

5. Conclusions

An AgPd30/CuNi18Zn26 laminated composite was manufactured by a rolling and annealing process. Interface diffusion occurred in the hot-roll bonding and the following annealing process, leading to the formation of a metallurgically bonded interface. The diffusion layer thickness was increased by annealing but decreased by cold rolling, suggesting an effective technique to control the diffusion layer’s thickness. A net atomic flow of Zn and Cu immigrated from the CuNi18Zn26 layer into the AgPd30 layer due to their smaller atomic radii. The diffusion of Ni is negligible, which can be attributed to its immiscibility with Ag.
Several intermetallic compounds were identified in the diffusion layer, including Pd2Zn, PdZn, Pd2Zn3, PdZn2, Pd3Zn10 and Cu3Pd. However, a layered distribution of the Pd-Zn compounds was not found, despite their different Pd/Zn atomic ratios. Some orientation relationships between the compounds and the AgPd alloy were determined, which are (310)PdZn2//(111)AgPd and (114)Cu3Pd//(311)PdZn2//(321)Pd3Zn10. Due to the diffusion of Cu and Zn into the AgPd30 layer, a new phase of Cu2NiZn was found in the CuNi18Zn26 layer near the interface.
According to the fracture morphology, delamination of the interface was found in all the samples, whereas the width of the interface crack was decreased by the successively conducted rolling and annealing. Two turning points with a platform in between appeared on the tensile curves of the as-annealed samples, which is attributed to the strength loss resulting from interface failure and the compensation of strain strengthening of the metal matrices.

Author Contributions

Conceptualization, Y.W.; Supervision, Y.W.; Project administration, Y.W.; Writing—review & editing Y.W.; Composite preparation, Y.X.; Resources, Y.X. and X.Y.; Formal analysis, P.Z. and Y.C.; Writing—original draft, P.Z.; Funding acquisition X.Y.; Investigation, Y.C.; Visualization, Y.C. All authors have read and agreed to the published version of the manuscript.

Funding

This research was funded by Chongqing Science and Technology Bureau [cstc2018jszx-cyzdX0090].

Data Availability Statement

The raw/processed data required to reproduce these findings cannot be shared at this time as the data also form part of an ongoing study.

Conflicts of Interest

The authors declare that they have no known competing financial interest or personal relationship that could have appeared to influence the work reported in this paper.

References

  1. Bizjak, M. Contact materials for low-voltage power switching devices. Inform. Midem. 2010, 40, 93–100. [Google Scholar]
  2. Lin, Z.J.; Fan, S.Y.; Liu, M.M.; Liu, S.H.; Li, J.G.; Li, J.P.; Xie, M.; Chen, J.L.; Sun, X.D. Excellent anti-arc erosion performance and corresponding mechanisms of a nickel-belt-reinforced silver-based electrical contact material. J. Alloys Compd. 2019, 788, 163–171. [Google Scholar] [CrossRef]
  3. Kumar, S.P.; Parameshwaran, R.; Ananthi, A.; Sam, J.J.J. Parameter characterization in processing of silver-aluminum based electrical contact materials. Arch. Metall. Mater. 2017, 62, 1895–1901. [Google Scholar] [CrossRef] [Green Version]
  4. Schoeppner, R.L.; Bahr, D.F.; Jin, H.; Goeke, R.S.; Moody, N.R.; Prasad, S.V. Wear behavior of Au-ZnO nanocomposite films for electrical contacts. J. Mater. Sci. 2014, 49, 6039–6047. [Google Scholar] [CrossRef]
  5. Wang, J.; Tie, S.N.; Kang, Y.Q.; Wang, Y.P. Contact resistance characteristics of Ag-SnO2 contact materials with high SnO2 content. J. Alloys Compd. 2015, 644, 438–443. [Google Scholar] [CrossRef]
  6. Wang, Z.; Wang, Y.P. Impact of convection-diffusion and flow-path interactions on the dynamic evolution of microstructure: Arc erosion behavior of Ag-SnO2 contact materials. J. Alloys Compd. 2019, 774, 1046–1058. [Google Scholar] [CrossRef]
  7. Wu, C.P.; Zhao, Q.; Li, N.N.; Wang, H.S.; Yi, D.Q.; Weng, W. Influence of fabrication technology on arc erosion of Ag/10SnO2 electrical contact materials. J. Alloys Compd. 2018, 766, 161–177. [Google Scholar] [CrossRef]
  8. Cohen, U.; Walton, K.R.; Sard, R. Development of Silver-Palladium alloy plating for electrical contact applications. J. Electrochem. Soc. 1984, 131, 2489–2495. [Google Scholar] [CrossRef]
  9. Poddar, V.S.; Rathod, M.J. Evaluation of mechanical properties of cold roll bonded mild steel and aluminum. Mater. Today Proc. 2021, 43, 3014–3022. [Google Scholar] [CrossRef]
  10. Taali, S.; Toroghinejad, M.R.; Saeidi, N. Architectured lightweight steel composite: Evaluation of the effect of geometrical parameters and annealing treatments on deformation behavior. J. Mater. Res. Technol. 2021, 15, 5414–5427. [Google Scholar] [CrossRef]
  11. Zhao, G.H.; Li, Y.G.; Li, J.; Huang, Q.X.; Ma, L.F. Experimental analysis of two-layered dissimilar metals by roll bonding. Mater. Res. Express 2018, 5, 026517. [Google Scholar] [CrossRef]
  12. Hu, X.S.; Sun, Z.M.; Zhang, C.L.; Wang, X.J.; Wu, K. Microstructure and mechanical properties of bio-inspired Cf/Ti/Mg laminated composites. J. Magnes. Alloy. 2018, 6, 164–170. [Google Scholar] [CrossRef]
  13. Zhang, L.; Meng, L.; Zhou, S.P.; Yang, F.T. Behaviors of the interface and matrix for the Ag/Cu bimetallic laminates prepared by roll bonding and diffusion annealing. Mater. Sci. Eng. A 2004, 371, 65–71. [Google Scholar] [CrossRef]
  14. Lee, J.M.; Lee, B.R.; Kang, S.B. Control of layer continuity in metallic multilayers produced by deformation synthesis method. Mater. Sci. Eng. A 2005, 406, 95–101. [Google Scholar] [CrossRef]
  15. Wang, T.; Li, S.; Ren, Z.K.; Han, J.C.; Huang, Q.X. A novel approach for preparing Cu/Al laminated composite based on corrugated roll. Mater. Lett. 2019, 234, 79–82. [Google Scholar] [CrossRef]
  16. Zhao, Z.L.; Gao, Q.; Hou, J.F.; Sun, Z.W.; Chen, F. Determining the microstructure and properties of magnesium aluminum composite panels by hot rolling and annealing. J. Magnes. Alloy. 2016, 4, 242–248. [Google Scholar] [CrossRef] [Green Version]
  17. Liu, H.S.; Zhang, B.; Zhang, G.P. Microstructures and mechanical properties of Al/Mg alloy multilayered composites produced by accumulative roll bonding. J. Mater. Sci. Technol. 2011, 27, 15–21. [Google Scholar] [CrossRef]
  18. Du, Y.; Fan, G.H.; Yu, T.B.; Hansen, N.; Geng, L.; Huang, X.X. Laminated Ti-Al composites: Processing, structure and strength. Mater. Sci. Eng. A 2016, 673, 572–580. [Google Scholar] [CrossRef] [Green Version]
  19. Kim, I.K.; Hong, S.I. Effect of heat treatment on the bending behavior of tri-layered Cu/Al/Cu composite plates. Mater. Des. 2013, 47, 590–598. [Google Scholar] [CrossRef]
  20. Ma, X.Y.; Zhang, Q.; Chen, X.; Wu, G.H. Geomagnetic shielding property and mechanism of Fe–Ni laminated composite. Acta Metall. Sin. 2014, 27, 918–923. [Google Scholar] [CrossRef]
  21. Li, X.B.; Yang, Y.; Xu, Y.S.; Zu, G.Y. Deformation behavior and crack propagation on interface of Al/Cu laminated composites in uniaxial tensile test. Rare Met. 2020, 39, 296–303. [Google Scholar] [CrossRef]
  22. Du, J.L.; Huang, Y.; Xiao, C.; Liu, Y.C. Building metallurgical bonding interfaces in an immiscible Mo/Cu system by irradiation damage alloying. J. Mater. Sci. Technol. 2018, 34, 689–694. [Google Scholar] [CrossRef]
  23. Sommer, J.; Muschik, T.; Herzig, C.; Gust, W. Silver tracer diffusion in oriented AgCu interphase boundaries and correlation to the boundary structure. Acta Mater. 1996, 44, 327–334. [Google Scholar] [CrossRef]
  24. Sawa, K.; Kakino, S.; Shigemori, T.; Kawakami, Y.; Endo, K.; Ou, G.; Hagino, H. Degradation process of a sliding system with Au-plated slip-ring and AgPd brush for power supply. In Proceedings of the Fifty-First IEEE Holm Conference on Electrical Contacts, Chicago, IL, USA, 26–28 September 2005; pp. 312–317. [Google Scholar] [CrossRef]
  25. Derooy, A.; Vanrooyen, E.W.; Bronsveld, P.M.; Dehosson, J.T.M. The coherent phase diagram of Cu-Ni-Zn. Acta Metall. 1980, 28, 1339–1347. [Google Scholar] [CrossRef]
  26. Shabashov, V.A.; Kozlov, K.A.; Sagaradze, V.V.; Nikolaev, A.L.; Lyashkov, K.A.; Semyonkin, V.A.; Voronin, V.I. Short-range order clustering in BCC Fe-Mn alloys induced by severe plastic deformation. Philos. Mag. 2018, 98, 560–576. [Google Scholar] [CrossRef]
  27. Wang, C.Y.; Jiang, Y.B.; Xie, J.X.; Zhou, D.J.; Zhang, X.J. Interface formation and bonding mechanism of embedded aluminum-steel composite sheet during cold roll bonding. Mater. Sci. Eng. A 2017, 708, 50–59. [Google Scholar] [CrossRef]
  28. Peter, N.J.; Gerlitzky, C.; Altin, A.; Wohletz, S.; Krieger, W.; Tran, T.H.; Liebscher, C.H.; Scheu, C.; Dehm, G.; Groche, P.; et al. Atomic level bonding mechanism in steel/aluminum joints produced by cold pressure welding. Materialia 2019, 7, 100396. [Google Scholar] [CrossRef]
  29. Battezzati, L.; Pappalepore, P.; Durbiano, F.; Gallino, I. Solid state reactions in Al/Ni alternate foils induced by cold rolling and annealing. Acta Mater. 1999, 47, 1901–1914. [Google Scholar] [CrossRef]
  30. Yang, Z.; Mi, X.J.; Feng, X.; Xie, H.F.; Peng, L.J.; Huang, G.J.; Li, Y.F.; Yin, X.Q. Interface evolution of Cu-Ni-Si/AI-Mg-Si clad composite wires after annealing. Rare Met. 2020, 39, 1419–1424. [Google Scholar] [CrossRef]
  31. Li, S.; Luo, C.; Bashir, M.U.; Jia, Y.; Han, J.C.; Wang, T. Interface structures and mechanical properties of corrugated + flat rolled and traditional rolled Mg/Al clad plates. Rare Met. 2021, 40, 2947–2955. [Google Scholar] [CrossRef]
  32. Lorenz, M.; Bergner, D. Investigations of precipitates in heat treated AgPd30/CuSn6 layers. Microchim. Acta 1997, 125, 31–135. [Google Scholar] [CrossRef]
  33. Chen, G.; Li, J.T.; Yu, H.L.; Su, L.H.; Xu, G.M.; Pan, J.S.; You, T.; Zhang, G.; Sun, K.M.; He, L.Z. Investigation on bonding strength of steel/aluminum clad sheet processed by horizontal twin-roll casting, annealing and cold rolling. Mater. Des. 2016, 112, 263–274. [Google Scholar] [CrossRef]
Figure 1. The microstructures of different samples revealed by EBSD analysis. (a) HRB (hot-roll bonded), (b) FA (first annealed), (c) FCR (first cold-rolled), (d) SA (second annealed), (e) SCR (second cold rolled) and (f) TA (third annealed).
Metals 12 00367 g001aMetals 12 00367 g001b
Figure 2. The element distributions in the interface areas of different samples. HRB = hot-roll bonded, FA = first annealed, FCR = first cold-rolled, SA = second annealed, SCR = second cold-rolled and TA = third annealed.
Metals 12 00367 g002
Figure 3. The EDS line scan patterns across the interface by of different samples. (a) HRB (hot-roll bonded), (b) FA (first annealed), (c) FCR (first cold-rolled), (d) SA (second annealed), (e) SCR (second cold-rolled) and (f) TA (third annealed).
Metals 12 00367 g003aMetals 12 00367 g003b
Figure 4. The XRD patterns of different samples. (a) CuNi18Zn26, (b) AgPd30, (c) HRB (hot-roll bonded), (d) FA (first annealed), (e) FCR (first cold-rolled), (f) SA (second annealed), (g) SCR (second cold-rolled) and (h) TA (third annealed).
Metals 12 00367 g004
Figure 5. (a) A TEM image of the diffusion layer near the AgPd30 layer and the SAED patterns of (b) SA1, (c) SA2 and (d) SA3 in (a).
Metals 12 00367 g005
Figure 6. (a) A TEM image of the diffusion layer near AgPd30 layer, and (b) the SAED pattern taken from the circled area in (a).
Metals 12 00367 g006
Figure 7. (a) A TEM image of the zone with a Ag-enriched cluster, and the SAED pattern of (b) SA1 and (c) SA2 in (a). The insertion in (a) is an EDS mapping of the Ag obtained from the surrounding SA2.
Metals 12 00367 g007
Figure 8. (a) A TEM image of diffusion layer near the CuNi18Zn26 layer, and (b) the SAED pattern taken from the circled area in (a).
Metals 12 00367 g008
Figure 9. The tensile curves of (a) as-bonded and as-rolled samples and (b) as-annealed samples. HRB = hot-roll bonded, FA = first annealed, FCR = first cold-rolled, SA = second annealed, SCR = second cold-rolled and TA = third annealed.
Metals 12 00367 g009
Figure 10. The fracture topology of (a) HRB (hot-roll bonded), (b) FA (first annealed), (c) FCR (first cold-rolled), (d) SA (second annealed), (e) SCR (second cold-rolled) and (f) TA (third annealed).
Metals 12 00367 g010aMetals 12 00367 g010b
Table 1. The composition of the base alloys (atomic fraction).
ElementAgPdCuNiZn
AgPd300.700.30---
CuZn18Ni16--0.550.200.25
Table 2. The atomic radii of the elements in the used alloys.
ElementAgPdCuNiZn
CuZn18Ni161.341.281.171.251.15
Table 3. A comparison of the theoretic and measured lattice parameters (a, b and c) of the phases found in the diffusion layer (Å).
PhasePd2ZnPdZnPd2Zn3PdZn2Pd3Zn10Cu3PdCu2NiZn
Theoretica = 3.055a = 4.100a = 3.043a = 7.525a = 9.102a = 3.710a = 3.635
b = 3.055b = 4.100b = 3.043b = 7.363b = 9.102b = 3.710b = 3.635
c = 3.055c = 3.346c = 3.043c = 12.307c = 9.102c = 25.655c = 3.635
Measureda = 3.182a = 4.848a = 3.500a = 7.884a = 9.602a = 3.800a = 3.657
b = 3.182b = 4.848b = 3.500b = 6.648b = 9.602b = 3.800b = 3.657
c = 3.182c = 3.030c = 3.500c = 11.310c = 9.602c = 27.203c = 3.657
The measured data were calculated based on SAED patterns, except for those of Cu2NiZn (XRD).
Publisher’s Note: MDPI stays neutral with regard to jurisdictional claims in published maps and institutional affiliations.

