Article

Study of the Fracture Behavior of TiN and TiC Inclusions in NM550 Wear-Resistant Steel during the Tensile Process

1
Key Laboratory of Material Physics, Ministry of Education, School of Physics and Microelectronics, Zhengzhou University, Zhengzhou 450001, China
2
School of Electrical Engineering, Zhengzhou University, Zhengzhou 450001, China
3
School of Life Sciences, Zhengzhou University, Zhengzhou 450001, China
*
Authors to whom correspondence should be addressed.
Metals 2022, 12(2), 363; https://doi.org/10.3390/met12020363
Submission received: 20 January 2022 / Revised: 15 February 2022 / Accepted: 16 February 2022 / Published: 21 February 2022
(This article belongs to the Special Issue Advanced Technology in Microalloyed Steels)

Abstract

:
NM550 wear-resistant steel is widely used in large-scale engineering and mining machinery under extremely harsh working conditions. In NM550 steel, the addition of Ti can cause the formation of micron-scale TiN and TiC inclusions, easily triggering cleavage fractures. The fracture behavior and precipitation rule of micron-scale TiN and TiC inclusions on the tensile process in NM550 steel was investigated by scanning electron microscopy, transmission electron microscopy, and energy spectrum analysis combined with thermodynamic theory. The TiN precipitated in the solid–liquid two-phase region at a precipitation temperature of 1710 K, whereas that of TiC was 1158 K along the austenite grain boundary. The sizes of the TiN precipitated in the liquid phase and the TiC precipitated in austenite were both at the micron scale, which is prone to cleavage fracture during the stretching process. Under tensile stress, microcracks were first initiated at the TiN inclusion, which were further separated forming a hole, whereas the TiC inclusion was divided into two sections with a long and narrow gap formed between the substrates. The sizes of the TiN and TiC were related to the cooling rate, Ti, and N contents. The larger the cooling rate and the lesser the Ti and N content, the smaller the TiN and TiC sizes.

1. Introduction

NM550 wear-resistant steel has high strength and toughness and excellent wear resistance, and is widely used in large-scale engineering and mining machinery under extremely harsh working conditions [1]. Many studies have reported that trace elements such as Ti, Nb, V, and B can improve the performance of steel by microalloying [1,2,3]. For solid solution in austenite, B segregates at the austenite grain boundary during the cooling process and inhibits the nucleation of grain boundary ferrite, improving the hardenability of steel, which in turn, substantially improves the uniformity of the properties and microstructure of the steel plate [3,4]. However, B can easily combine with N to generate BN, which largely reduces the solid solution of B and weakens the hardenability [3,5]. Previous studies have found that Ti plays an effective role in fixing the interstitial element N by forming high-temperature stable TiN, which can retain most of the free B. A comparison of the N-fixing abilities of the three different trace elements (V, Al, and Ti) revealed that the precipitation temperature of V (0.10%) was 800 °C, which is not effective for N-fixing at high temperatures. Although Al has the ability to fix the N, high content levels (0.07%) are needed to achieve the same result as that obtained by the trace Ti (0.015%) [5].
The nanometer-scale TiN produced by the combination of Ti and N in steel can pin austenite grain boundaries at high temperatures, which inhibits grain growth and refines the grain [6,7,8,9]. Precipitation strengthening can be achieved by precipitating the nano-scale TiC in ferrite. However, the formation of TiN and TiC at the micron scale can easily result in cleavage fracture, which reduces the low-temperature impact toughness and the fatigue life of microalloy steel [10,11,12,13,14]. In addition, the improper addition of Ti forming micron-scale TiN and TiC also deteriorates the resistance to hydrogen embrittlement [4,15], and causes delayed cracking after flame cutting [16].
In the authors’ previous studies, the broken process of micron-scale TiN in NM500 wear-resistant steel was investigated [7], and the correlation between the microstructure and the fracture behavior of TiN inclusions was also been studied [17]. However, the TiC breakage mechanism and the size control of the TiN and TiC inclusions have not been reported thus far. Therefore, the influence of TiN and TiC inclusions on the mechanical properties, as well as their fracture behavior and size control of NM550 steel, were investigated in the present study by conducting tensile tests, facture surface observation, and thermodynamic simulation analysis to further improve the material properties.

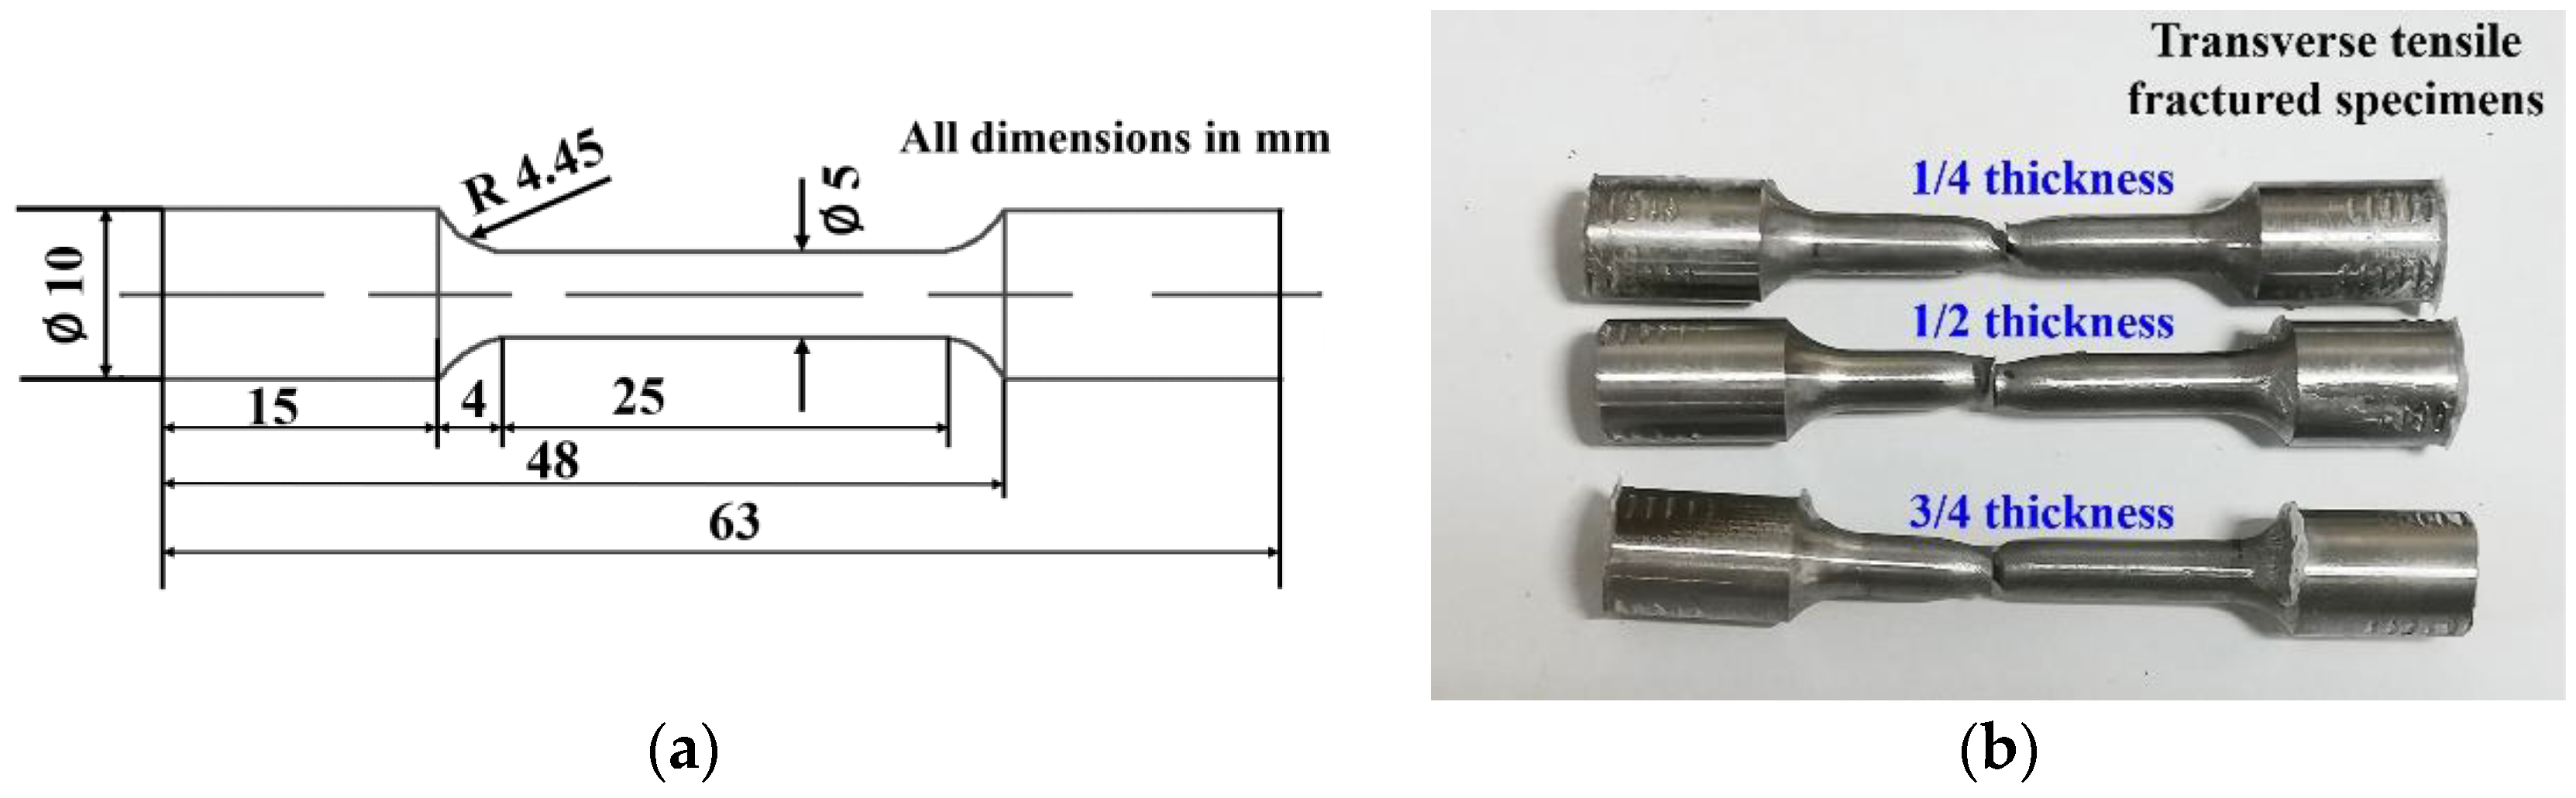
2. Materials and Methods

An NM550 steel plate with a thickness of 40 mm was quenched at 880 °C and tempered at 180 °C. The chemical compositions (mass fraction, %) of the steel plate are given in Table 1. The specimens were cut at 1/4, 1/2, and 3/4 the thickness of the steel plate along the transverse and longitudinal directions (rolling direction), and three identical specimens were tested at each position. According to the GB/T 228.1–2010 standard (China National Standard, China), a standard cylindrical specimen with a gauge length of 25 mm and a diameter of 5 mm was prepared with the schematic of a tensile specimen as shown in Figure 1a. A quasi-static tensile test was conducted at room temperature by using a CMT-5105 type testing machine (Skyan, Shenzhen, China); the strain rate was 10⁻3 s⁻1. Tensile fracture specimens are shown in Figure 1b. To compare the tensile properties of the steel plate at various thicknesses, scanning electron microscopy (SEM; Quanta 250 FEG; FEI, Salt Lake, UT, USA) was used to observe the fracture surface morphology. The steel matrix microstructure was observed by SEM and transmission electron microscopy (TEM; JEM-2100, JEOL, Tokyo, Japan). The specimens used for the SEM test were etched with 4 mL of nitric acid and 96 mL of ethanol after standard rough and fine polishing, and the corrosion time was 60 s. The thin foils for the TEM tests were prepared using a double jet electro-polisher (Struers, Copenhagen, Denmark) in a mixed solution of 10 mL perchloric acid and 90 mL of ethanol at –20 °C under a voltage of 20 V. The size and quantity of the TiN inclusions at 1/4 and 1/2 thickness were analyzed by optical microscopy (OM; BX51M; OLYMPUS, Tokyo, Japan); the number of TiN inclusions at 1/4 and 1/2 thickness was 479 and 462, respectively, and both the statistical areas were 75 mm2. The inclusions at the fracture surface were analyzed by energy dispersive spectroscopy (EDS; INCA-ENERGY, Oxford, UK). A tensile specimen of a longitudinal 1/2 the thickness was cut along the central axis of the specimen following the tensile test. After the specimen was ground and polished, the inclusions on the fracture section were analyzed by SEM and EDS.

3. Results

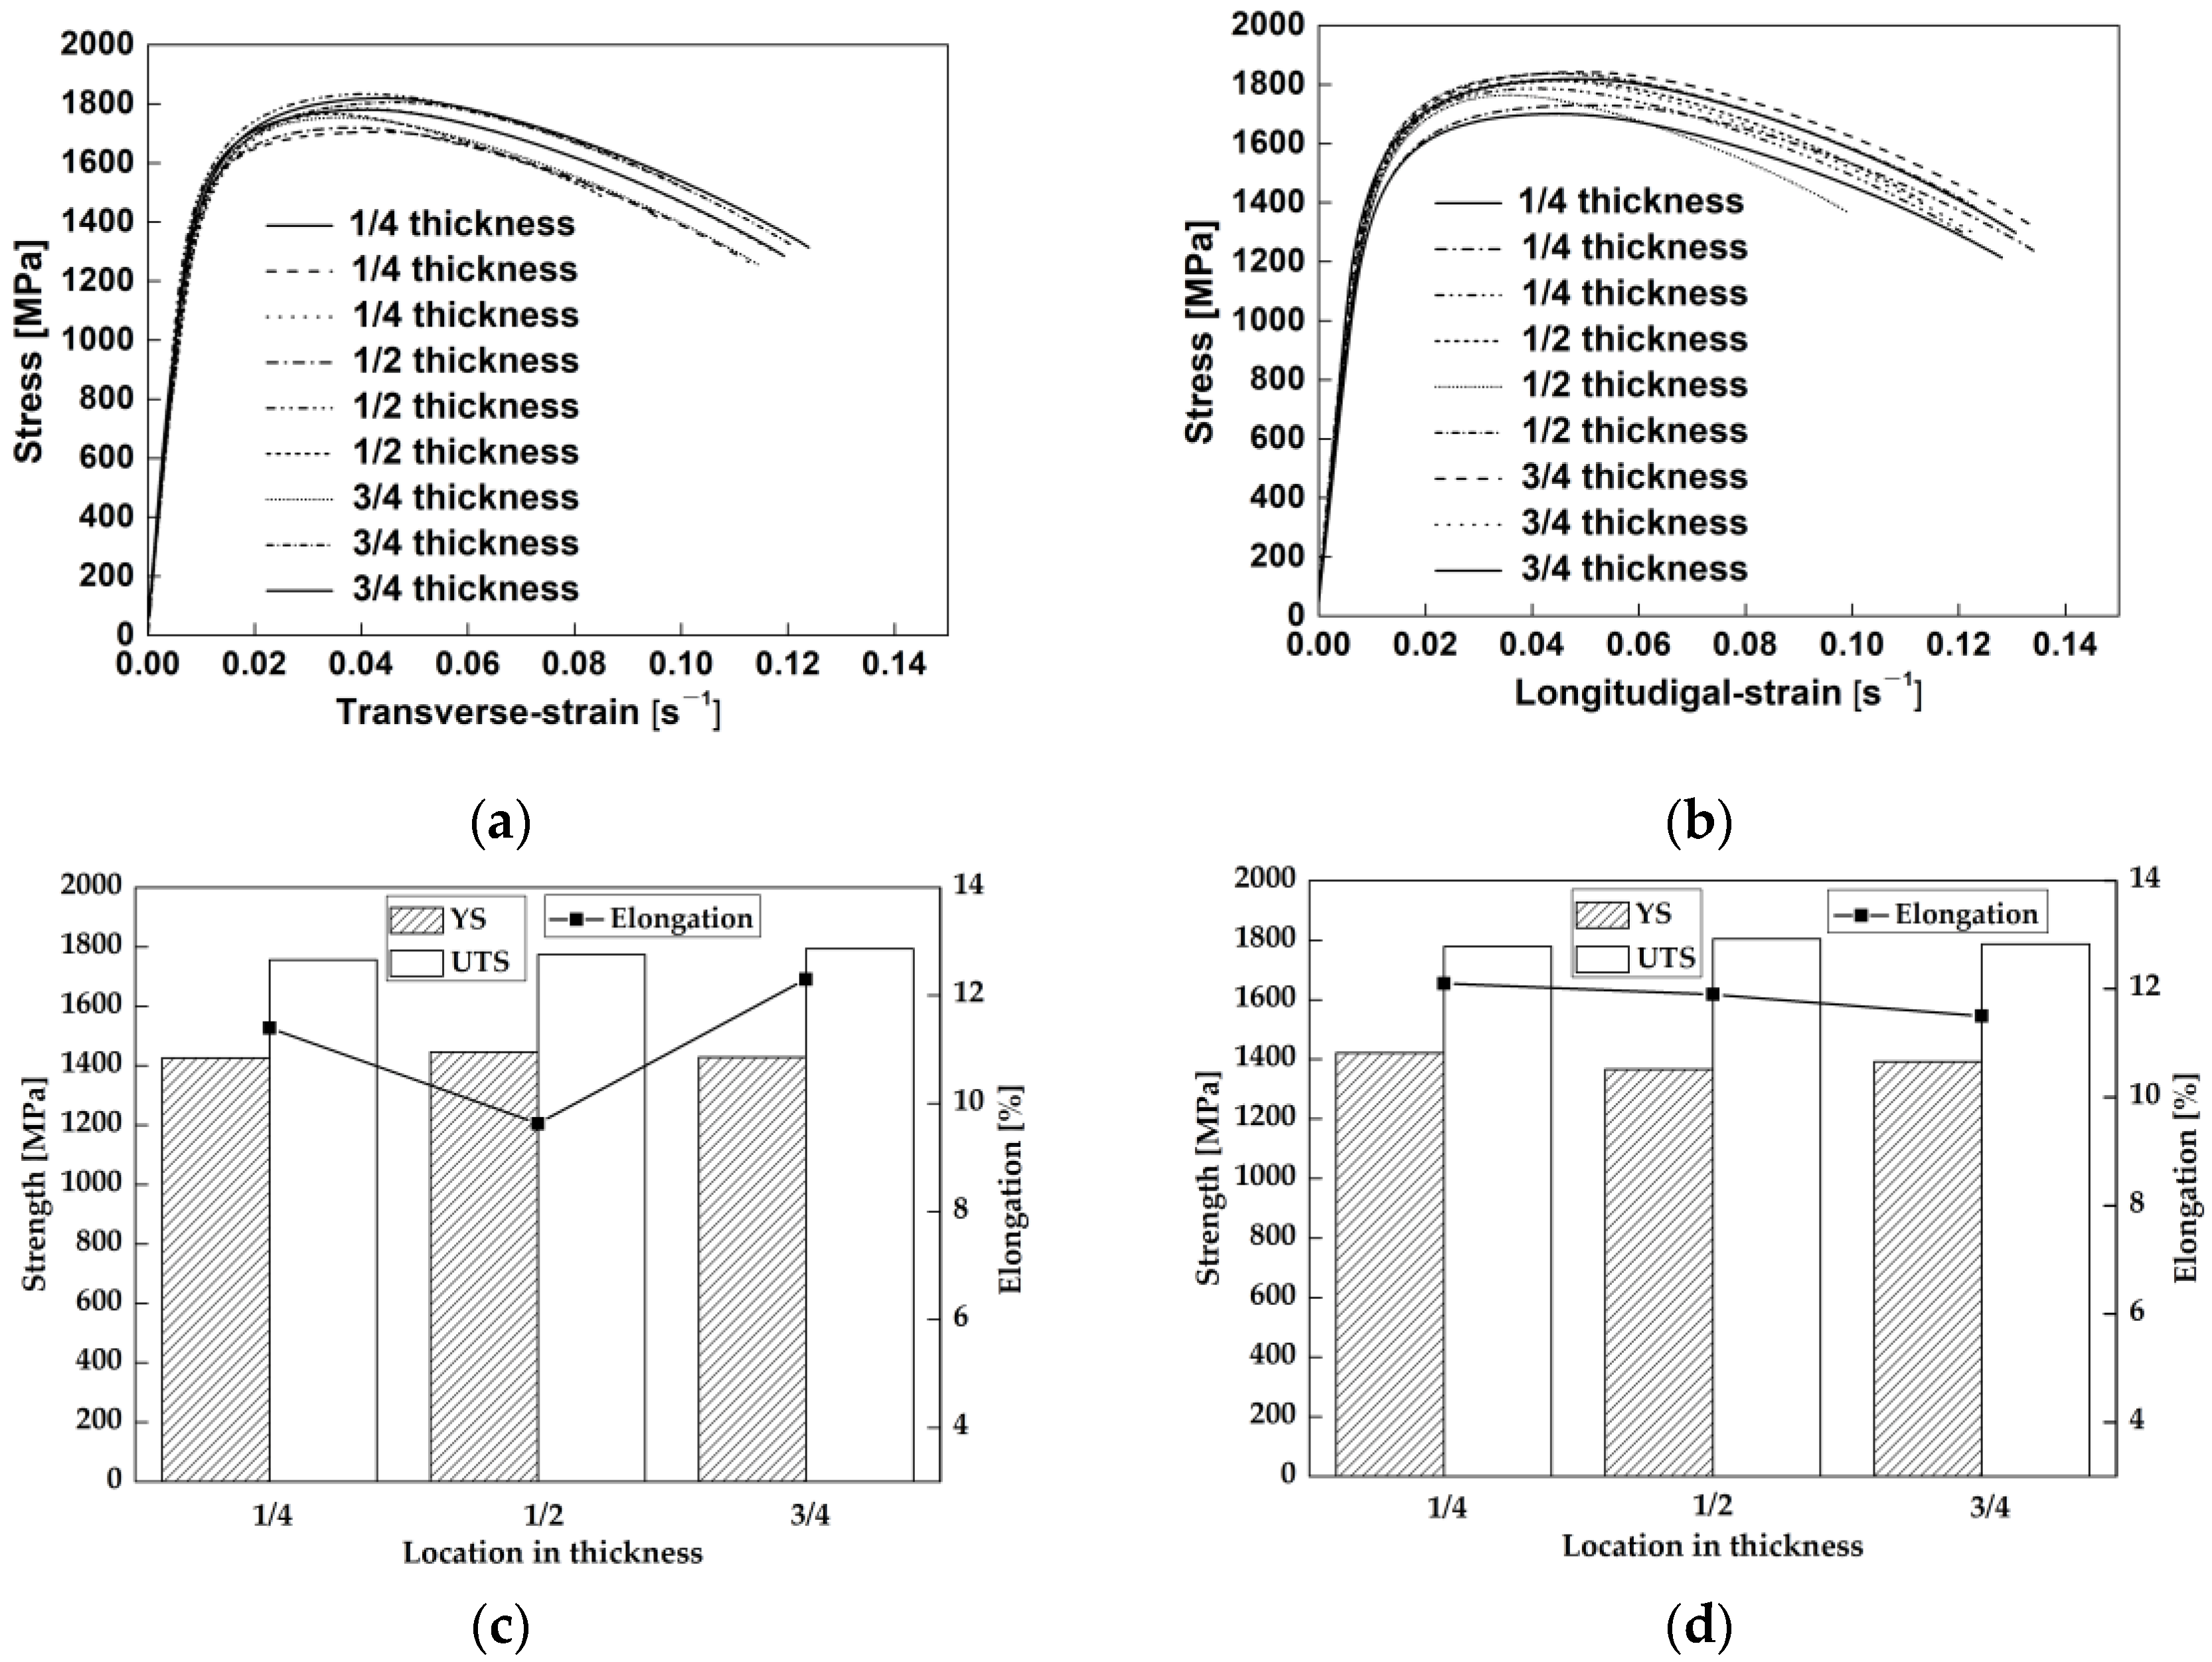
3.1. Tensile Properties

The tensile properties of the NM550 steel plate are presented in Figure 2. All specimens exhibited similar flow behaviors and stress–strain levels for each condition, indicating good uniformity. The yield strength (YS) of the steel plate was 1340–1519 MPa, and the ultimate tensile strength (UTS) was 1700–1842 MPa; thus, the strength reached the standard requirements of NM550 steel. The strength of the steel plate in the longitudinal and transverse direction at different thickness was essentially the same, indicating good uniformity. The elongations at 1/4, 1/2, and 3/4 the thickness of the plate in the longitudinal and transverse directions were 12.1%, 11.9%, and 11.5% and 11.4%, and 9.6%, and 12.3%, respectively. Table 2 shows the yield strength, ultimate tensile strength, reductions of area, and elongations in the transverse and longitudinal tensile samples. The elongations and reductions of area in the longitudinal direction were slightly higher than those in the transverse direction. The area reductions at 1/4 and 3/4 thicknesses were greater than that at 1/2 thickness.

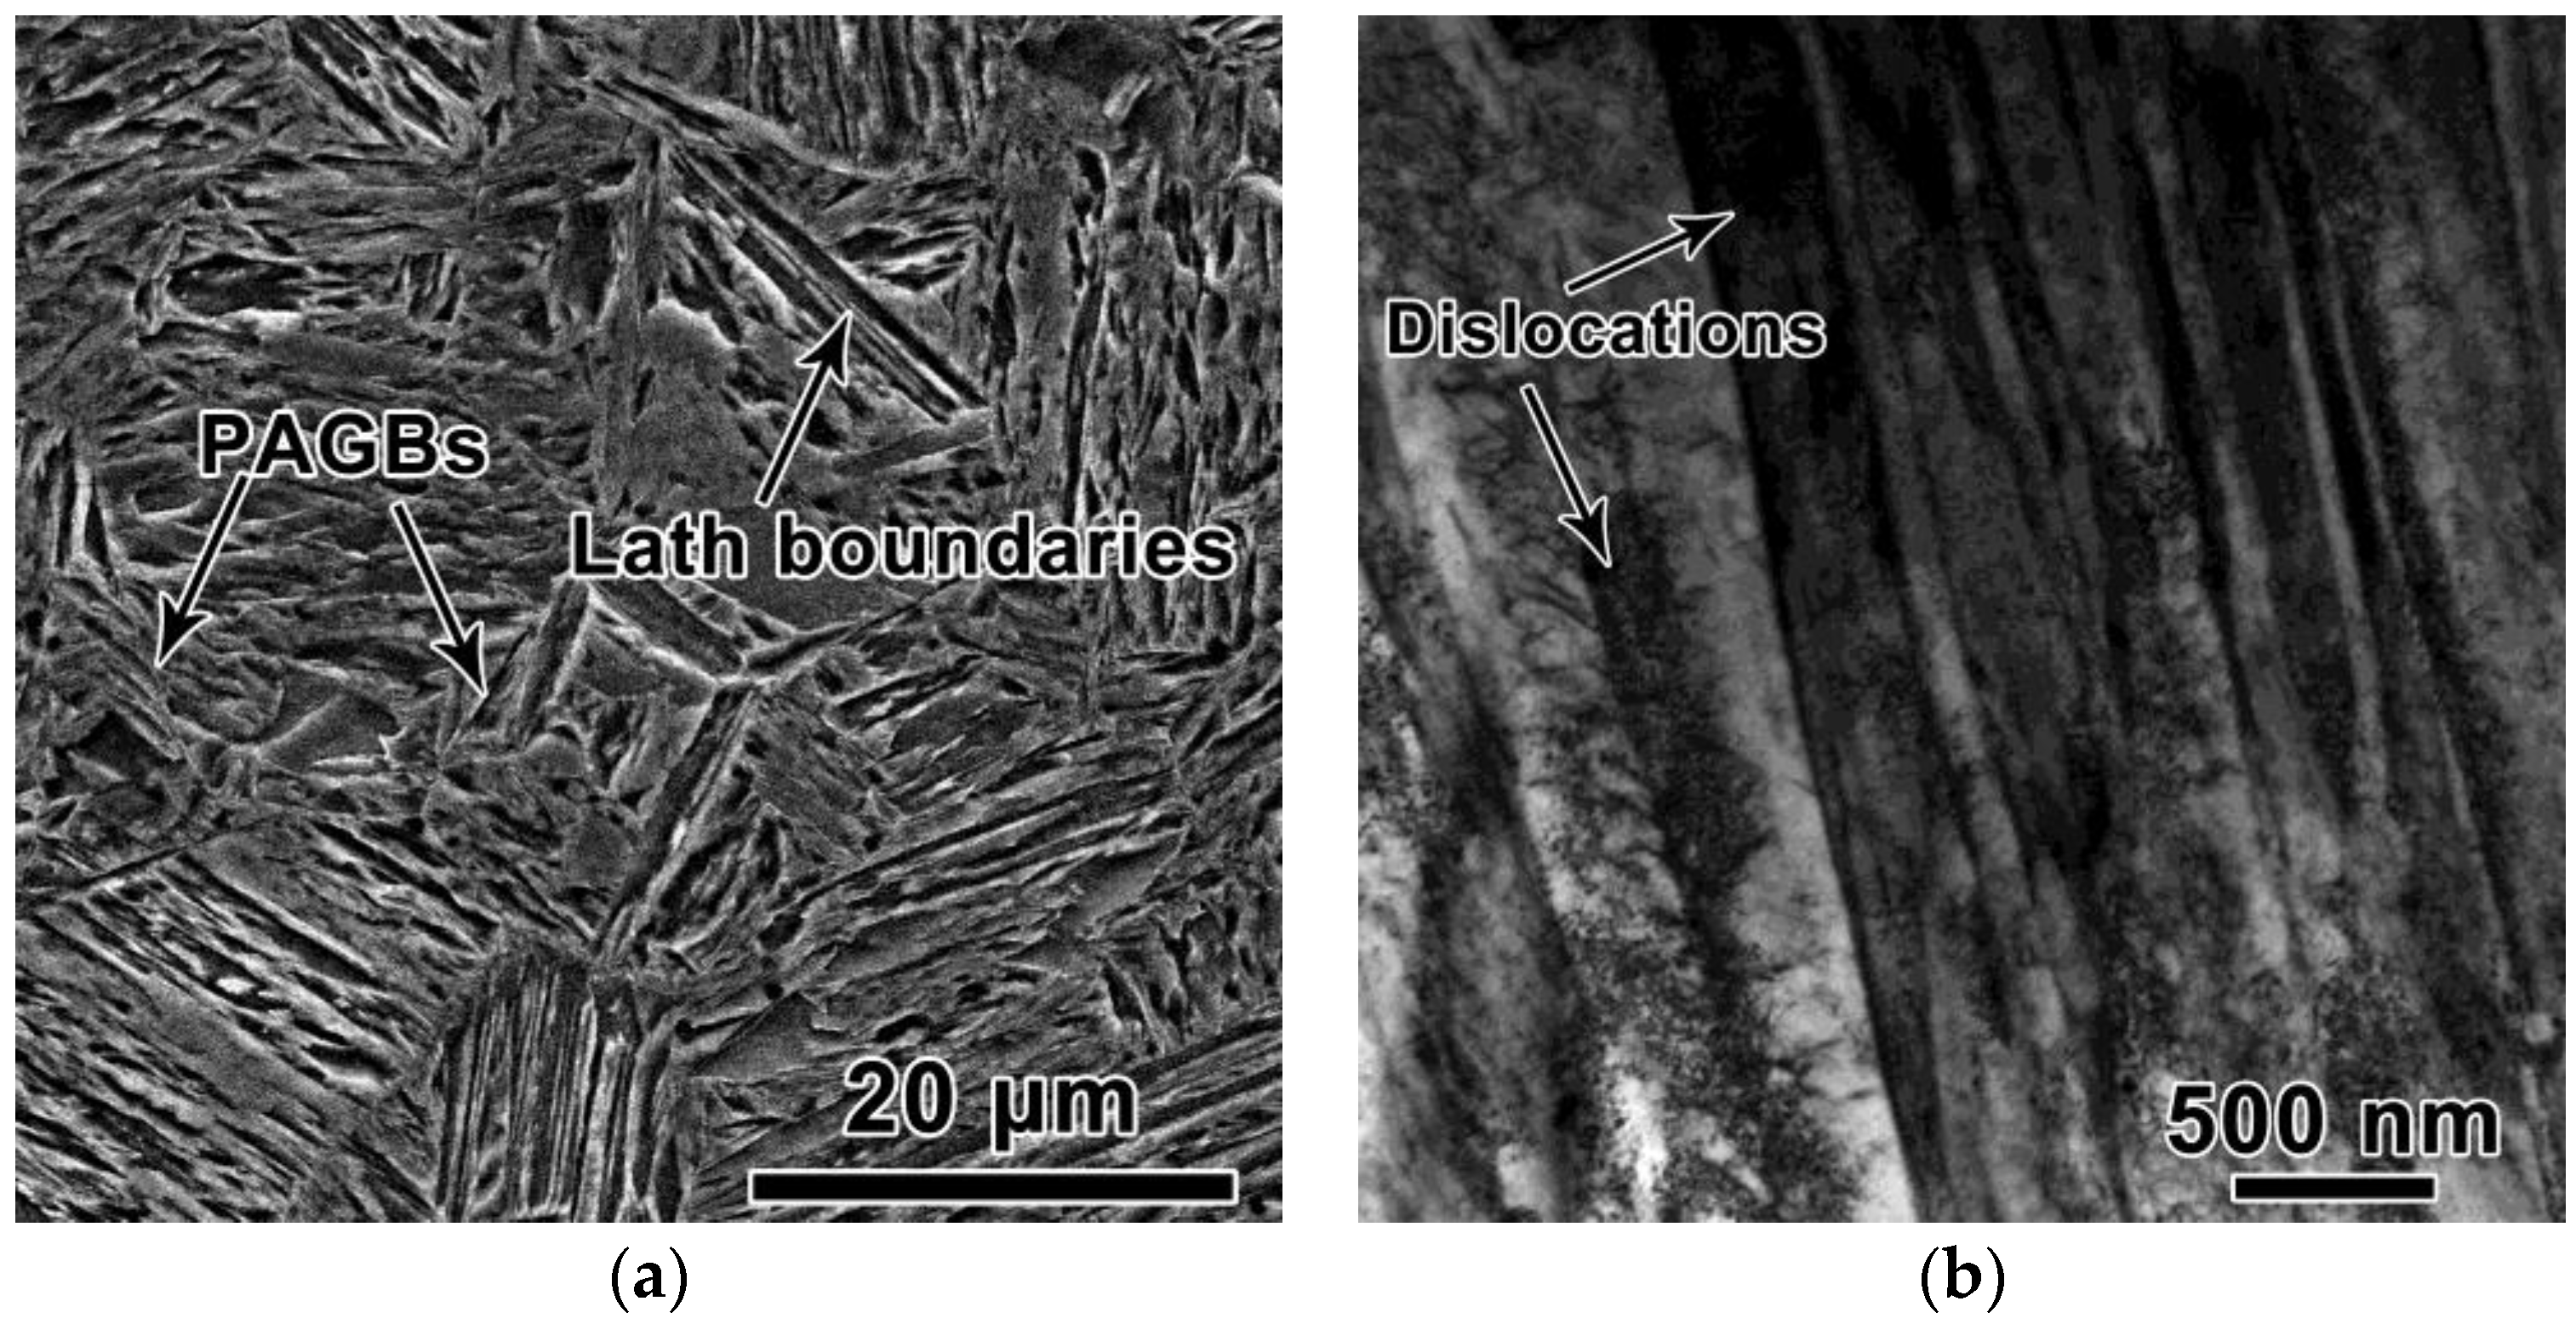
3.2. Microstructural Features
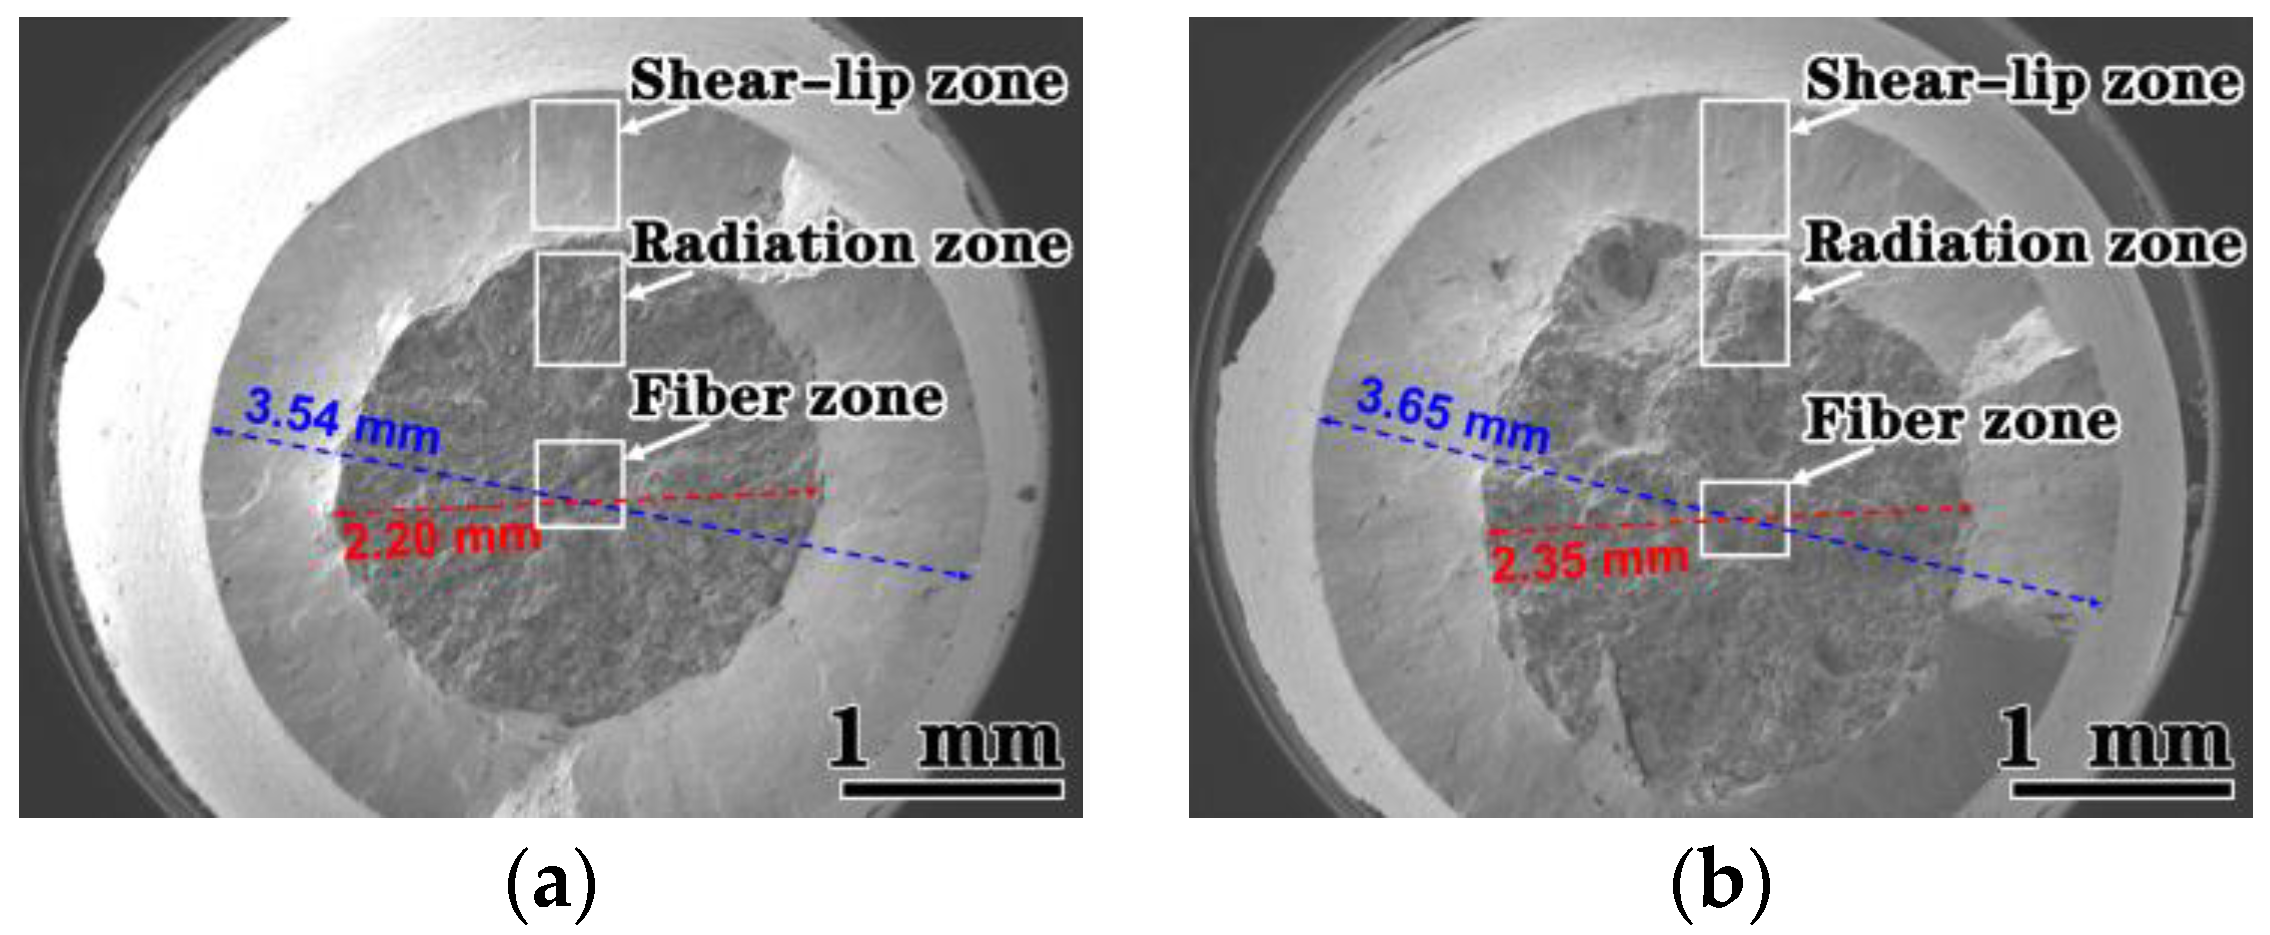
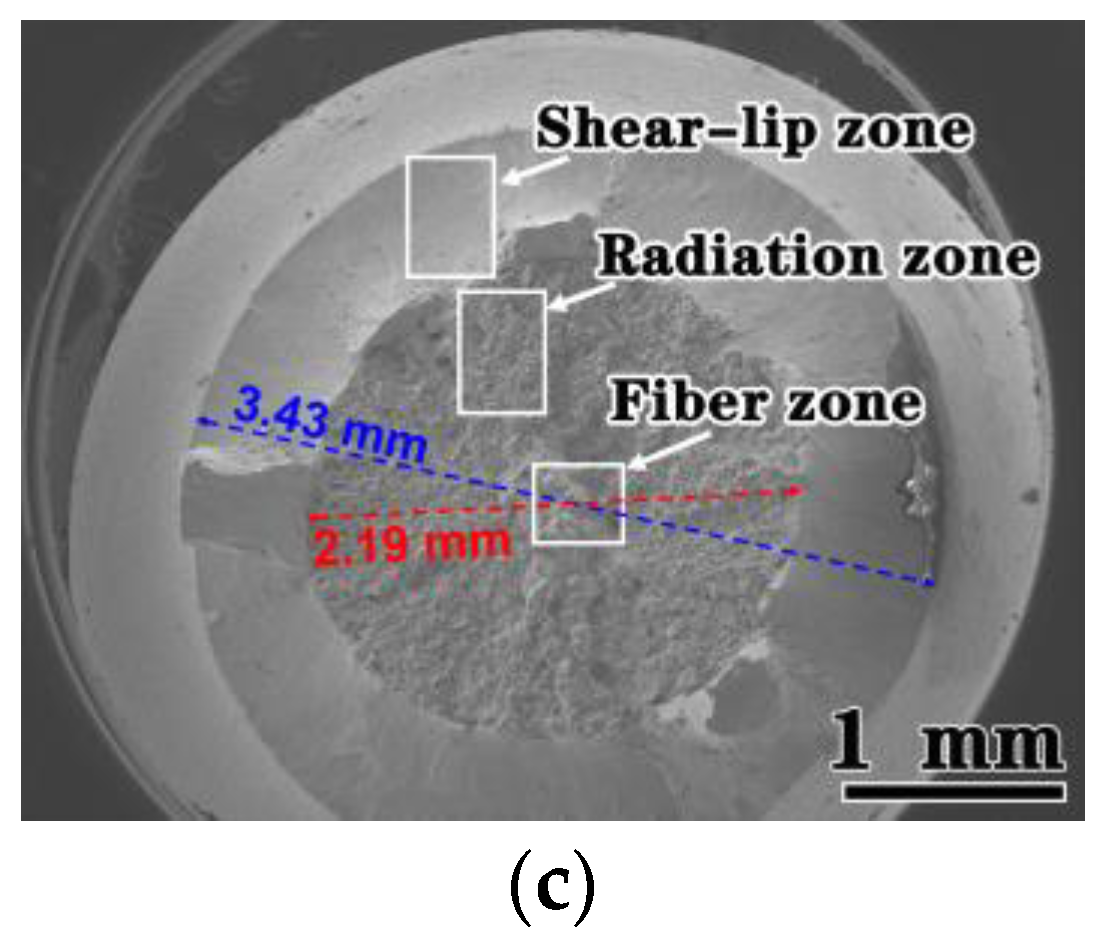
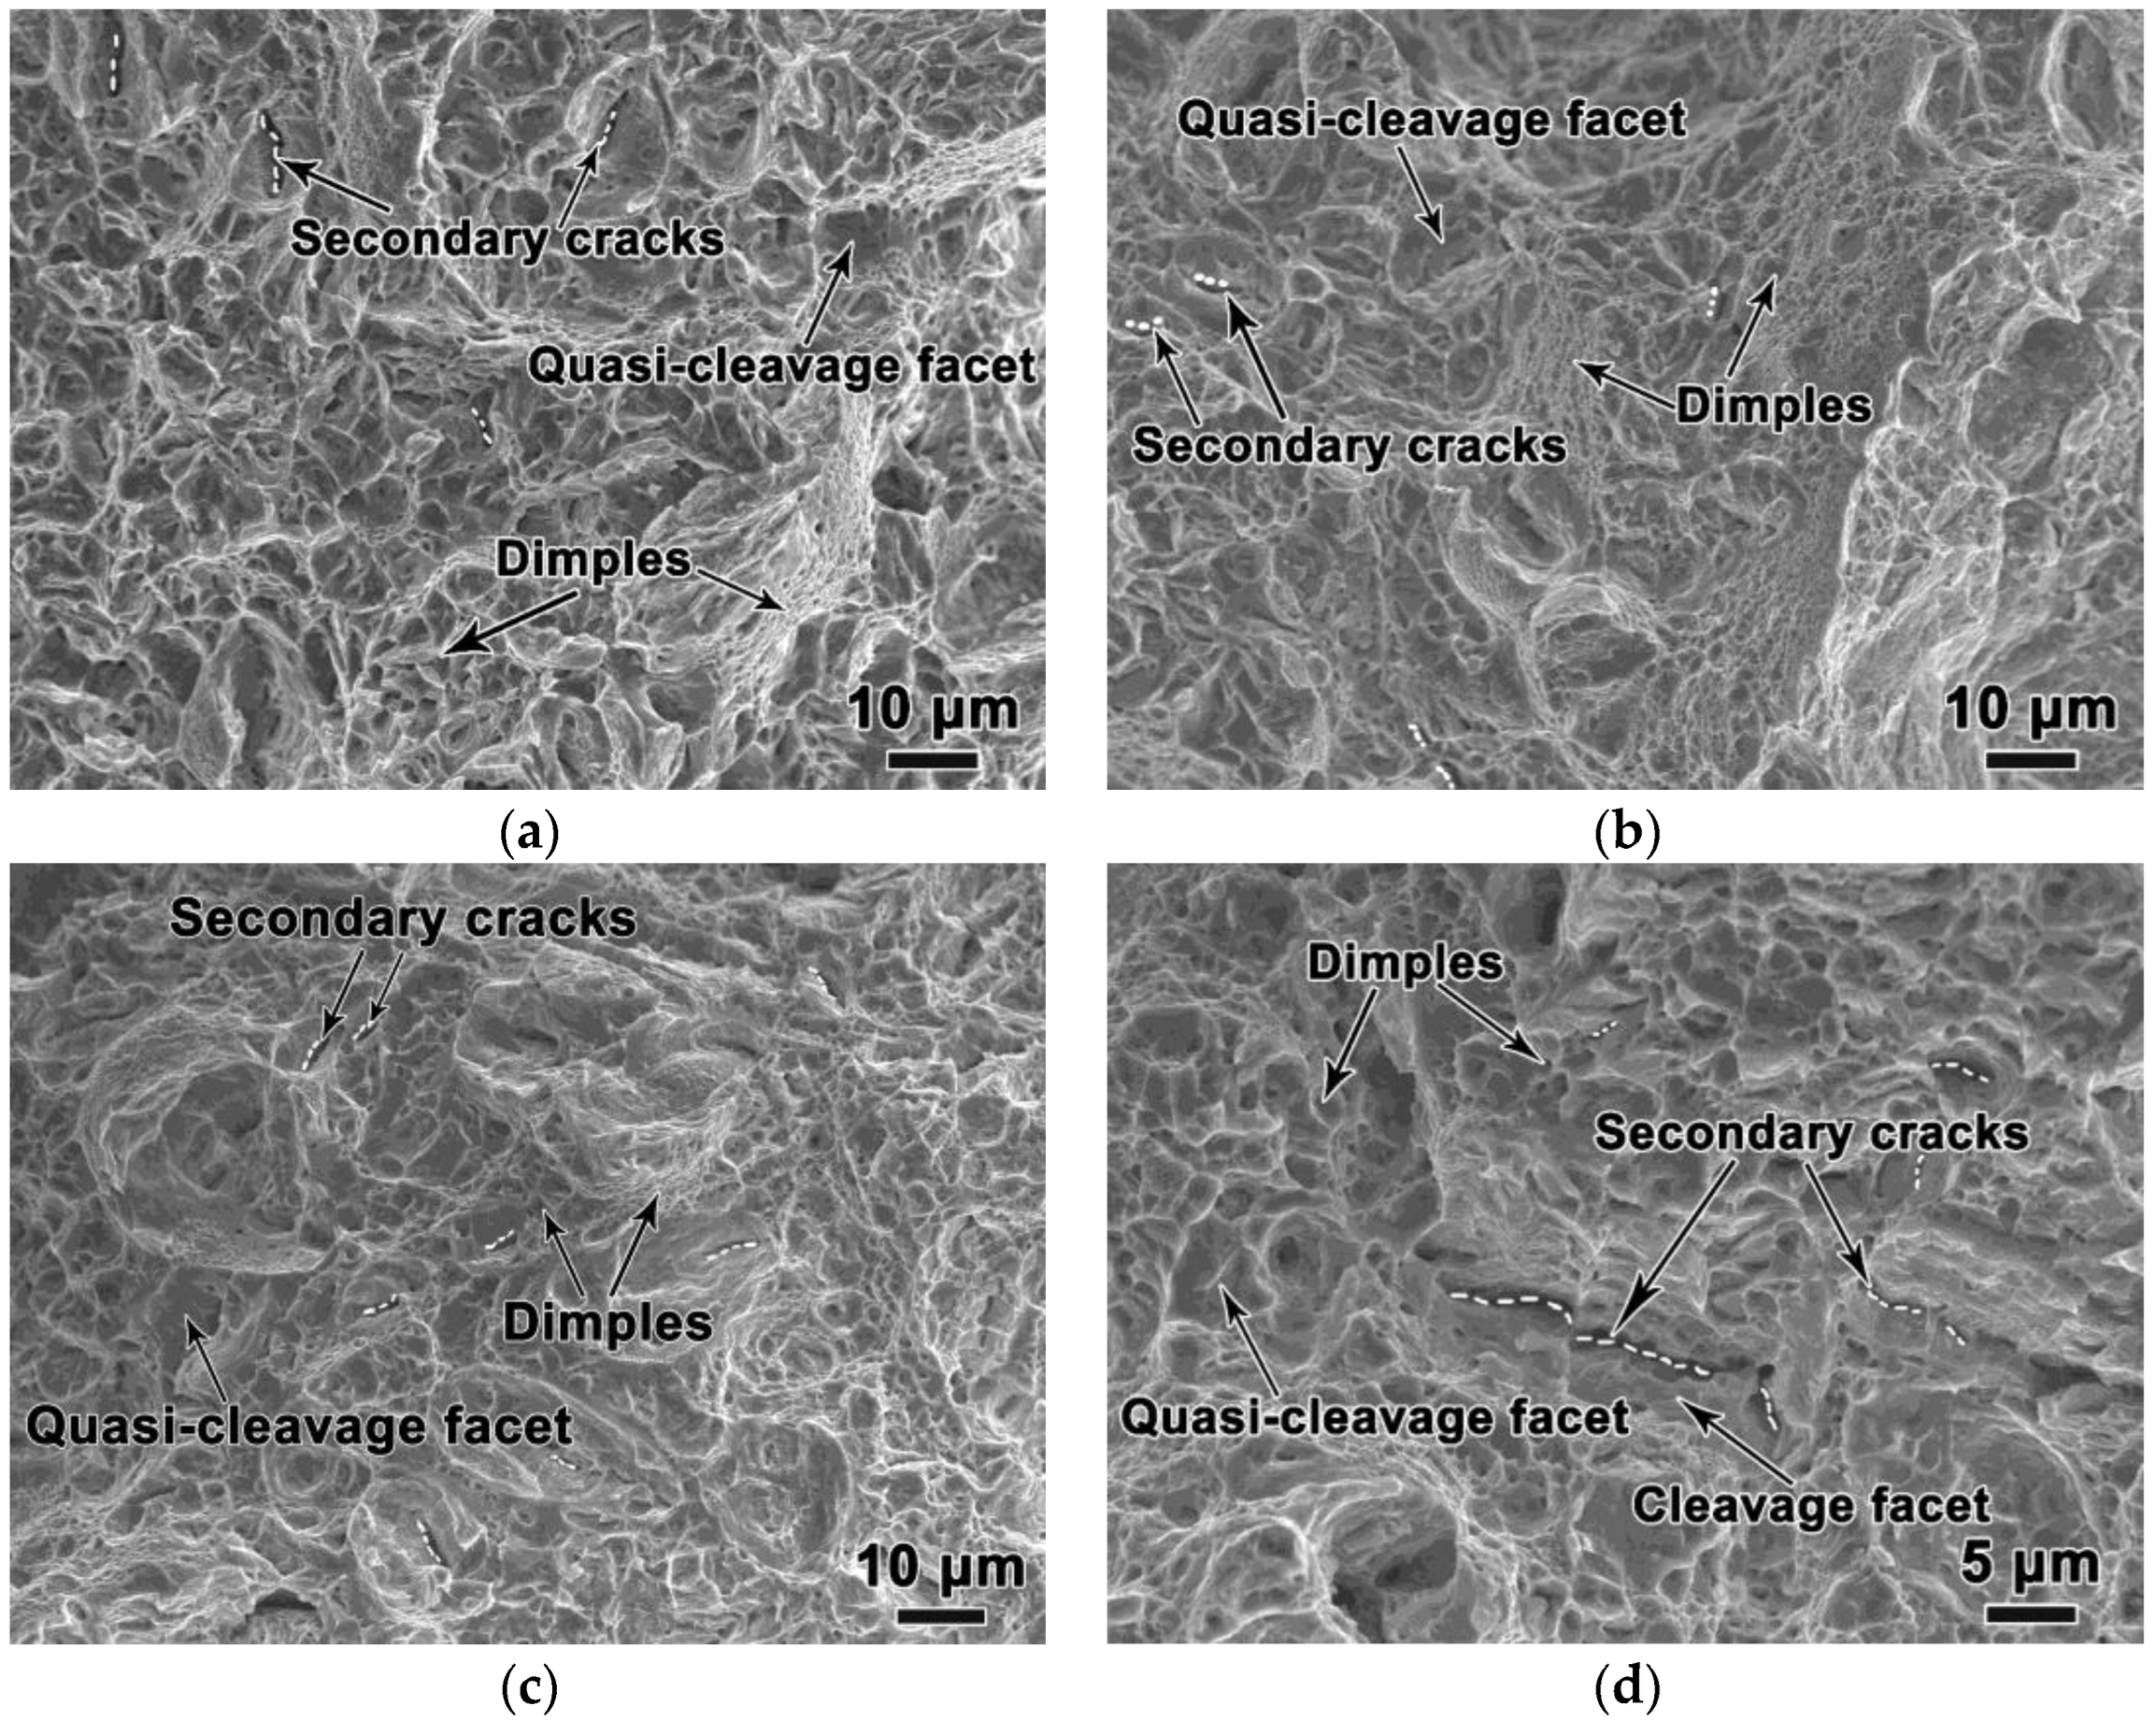
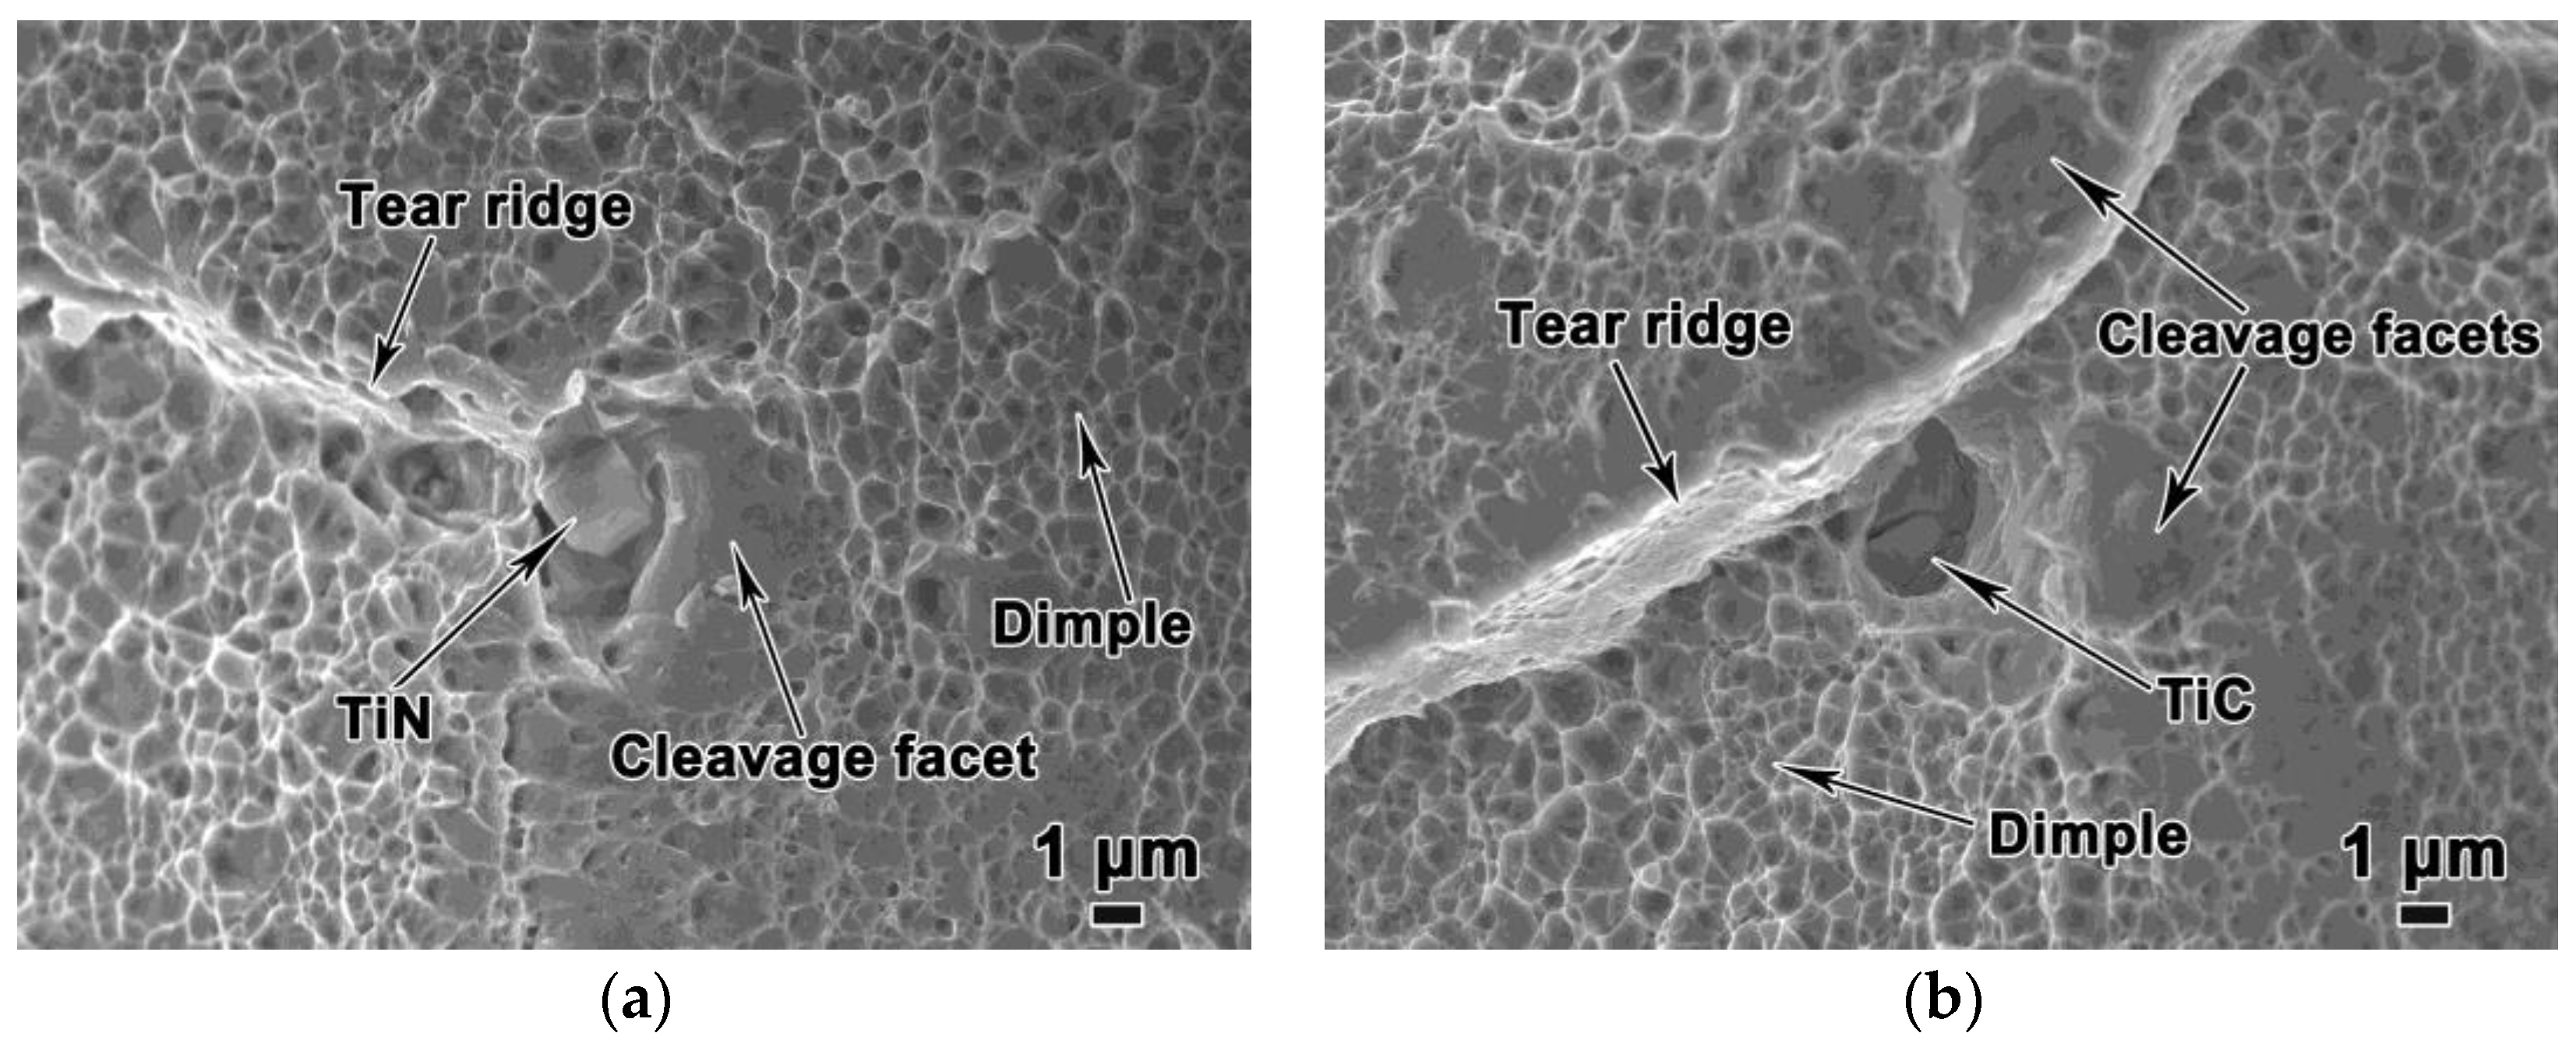
Figure 3a shows that the SEM microstructure of the as-received NM550 steel plate quenched at 880 °C and tempered at 180 °C, indicating a fully martensitic microstructure with the prior austenite grain boundaries (PAGBs) and lath boundaries clearly shown in Figure 3a. Some carbides can be observed in the martensitic lath with a relatively high density of dislocations, as shown in Figure 3b. The high strength of the investigated steel plate was attributed to the solid solution strengthening, precipitation strengthening, grain boundary strengthening, and dislocation strengthening of the fine martensitic matrix [2,18].
Figure 4 shows the size distribution of the TiN inclusions at 1/4 and 1/2 thickness of the plate. The average sizes of the TiN inclusions at 1/2 thickness and 1/4 thickness were 5.21 and 3.26 μm, respectively. The maximum sizes of the TiN inclusions at 1/2 thickness and 1/4 thickness were 21.2 and 13.2 μm, respectively. TiN inclusions with a size larger than 5 μm at 1/2 thickness and 1/4 thickness were 105.5 and 34 number/cm2, respectively. According to previous studies [9,11,19], TiN inclusions with a size larger than 5 μm may induce cleavage fracture, leading to poor mechanical properties of steel plates. This was also related to the lower plasticity observed at 1/2 thickness compared with 1/4 thickness.

3.3. Fractography

SEM was used to observe the tensile fracture surfaces at different thickness positions in the longitudinal direction, specifically 1/4, 1/2, and 3/4 of the plate thickness. Figure 5 shows the top view of the fracture surface of the tensile specimen, exhibiting the ductile cup. The fracture surface comprised fiber zone at the central region, radiation zone, and the shear-lip zone at the outer periphery, and the fracture sources were located in the center of the fracture fiber zones. The fracture surface sizes of 1/4 thickness and 3/4 thickness samples were essentially the same, which is smaller than that of 1/2 thickness sample, indicating more significant necking than that of 1/2 thickness sample.
Figure 6 shows SEM images of the fiber zone in the longitudinal tensile samples, which included both fine and large dimples, cleavage and quasi-cleavage surfaces, and numerous secondary cracks at the fracture surface [20]. The amount of transgranular cleavage facets was higher in the 1/2 thickness samples than that of 1/4 and 3/4 thickness samples at the fracture surface, due to the higher density of TiN inclusions in 1/2 thickness samples. The secondary cracks, about 20 μm in length, were distributed on the adjacent cleavage surfaces, which turns in the junction of the cleavage surfaces. The secondary cracks can release part of the stress during the fracture process. As shown in Figure 6e, a regular-shaped TiN inclusion appeared on the cleavage plane, revealed by EDS analysis (Figure 6f). Two obvious deep cracks were present on the TiN inclusion, which indicates that the micron-scale TiN inclusions were broken and then separated from the matrix, leading to cleavage fracture. As previously reported [8,9], micron-sized (Ti, Nb)N/TiN particles can cause cleavage fracture, resulting in toughness decrease.
Figure 7 presents the morphology of the shear lip zone in the fracture surface of the tensile specimen. This zone comprises numerous shallow shear dimples as well as cleavage and quasi-cleavage surfaces. Figure 7a,b show a tear ridge perpendicular to the direction of tearing with more cleavage surfaces around it. Figure 7a shows a regular-shaped TiN inclusion near the tear ridge, as revealed by EDS analysis (Figure 7c), which initiated the cleavage planes. In Figure 7b, a broken inclusion is present near the tear ridge, which is TiC inclusion by EDS analysis (Figure 7d). Cracks penetrated the surfaces of the TiC inclusions, which initiated the cleavage planes nearby. Owing to their brittleness, TiC and TiN inclusions are more likely to break and lead to cleavage fracture.
Tear ridges are formed during the cleavage fracture process in the shear lip zone, which enable part of the energy to be released [21]. In the fiber zone, more secondary cracks are generated during the cleavage fracture process, which is the main energy release mechanism. Therefore, although both the TiN and TiC micron-scale inclusions in the fiber and shear lip zones can induce destructive cleavage fracturing, the energy release mechanism is different.

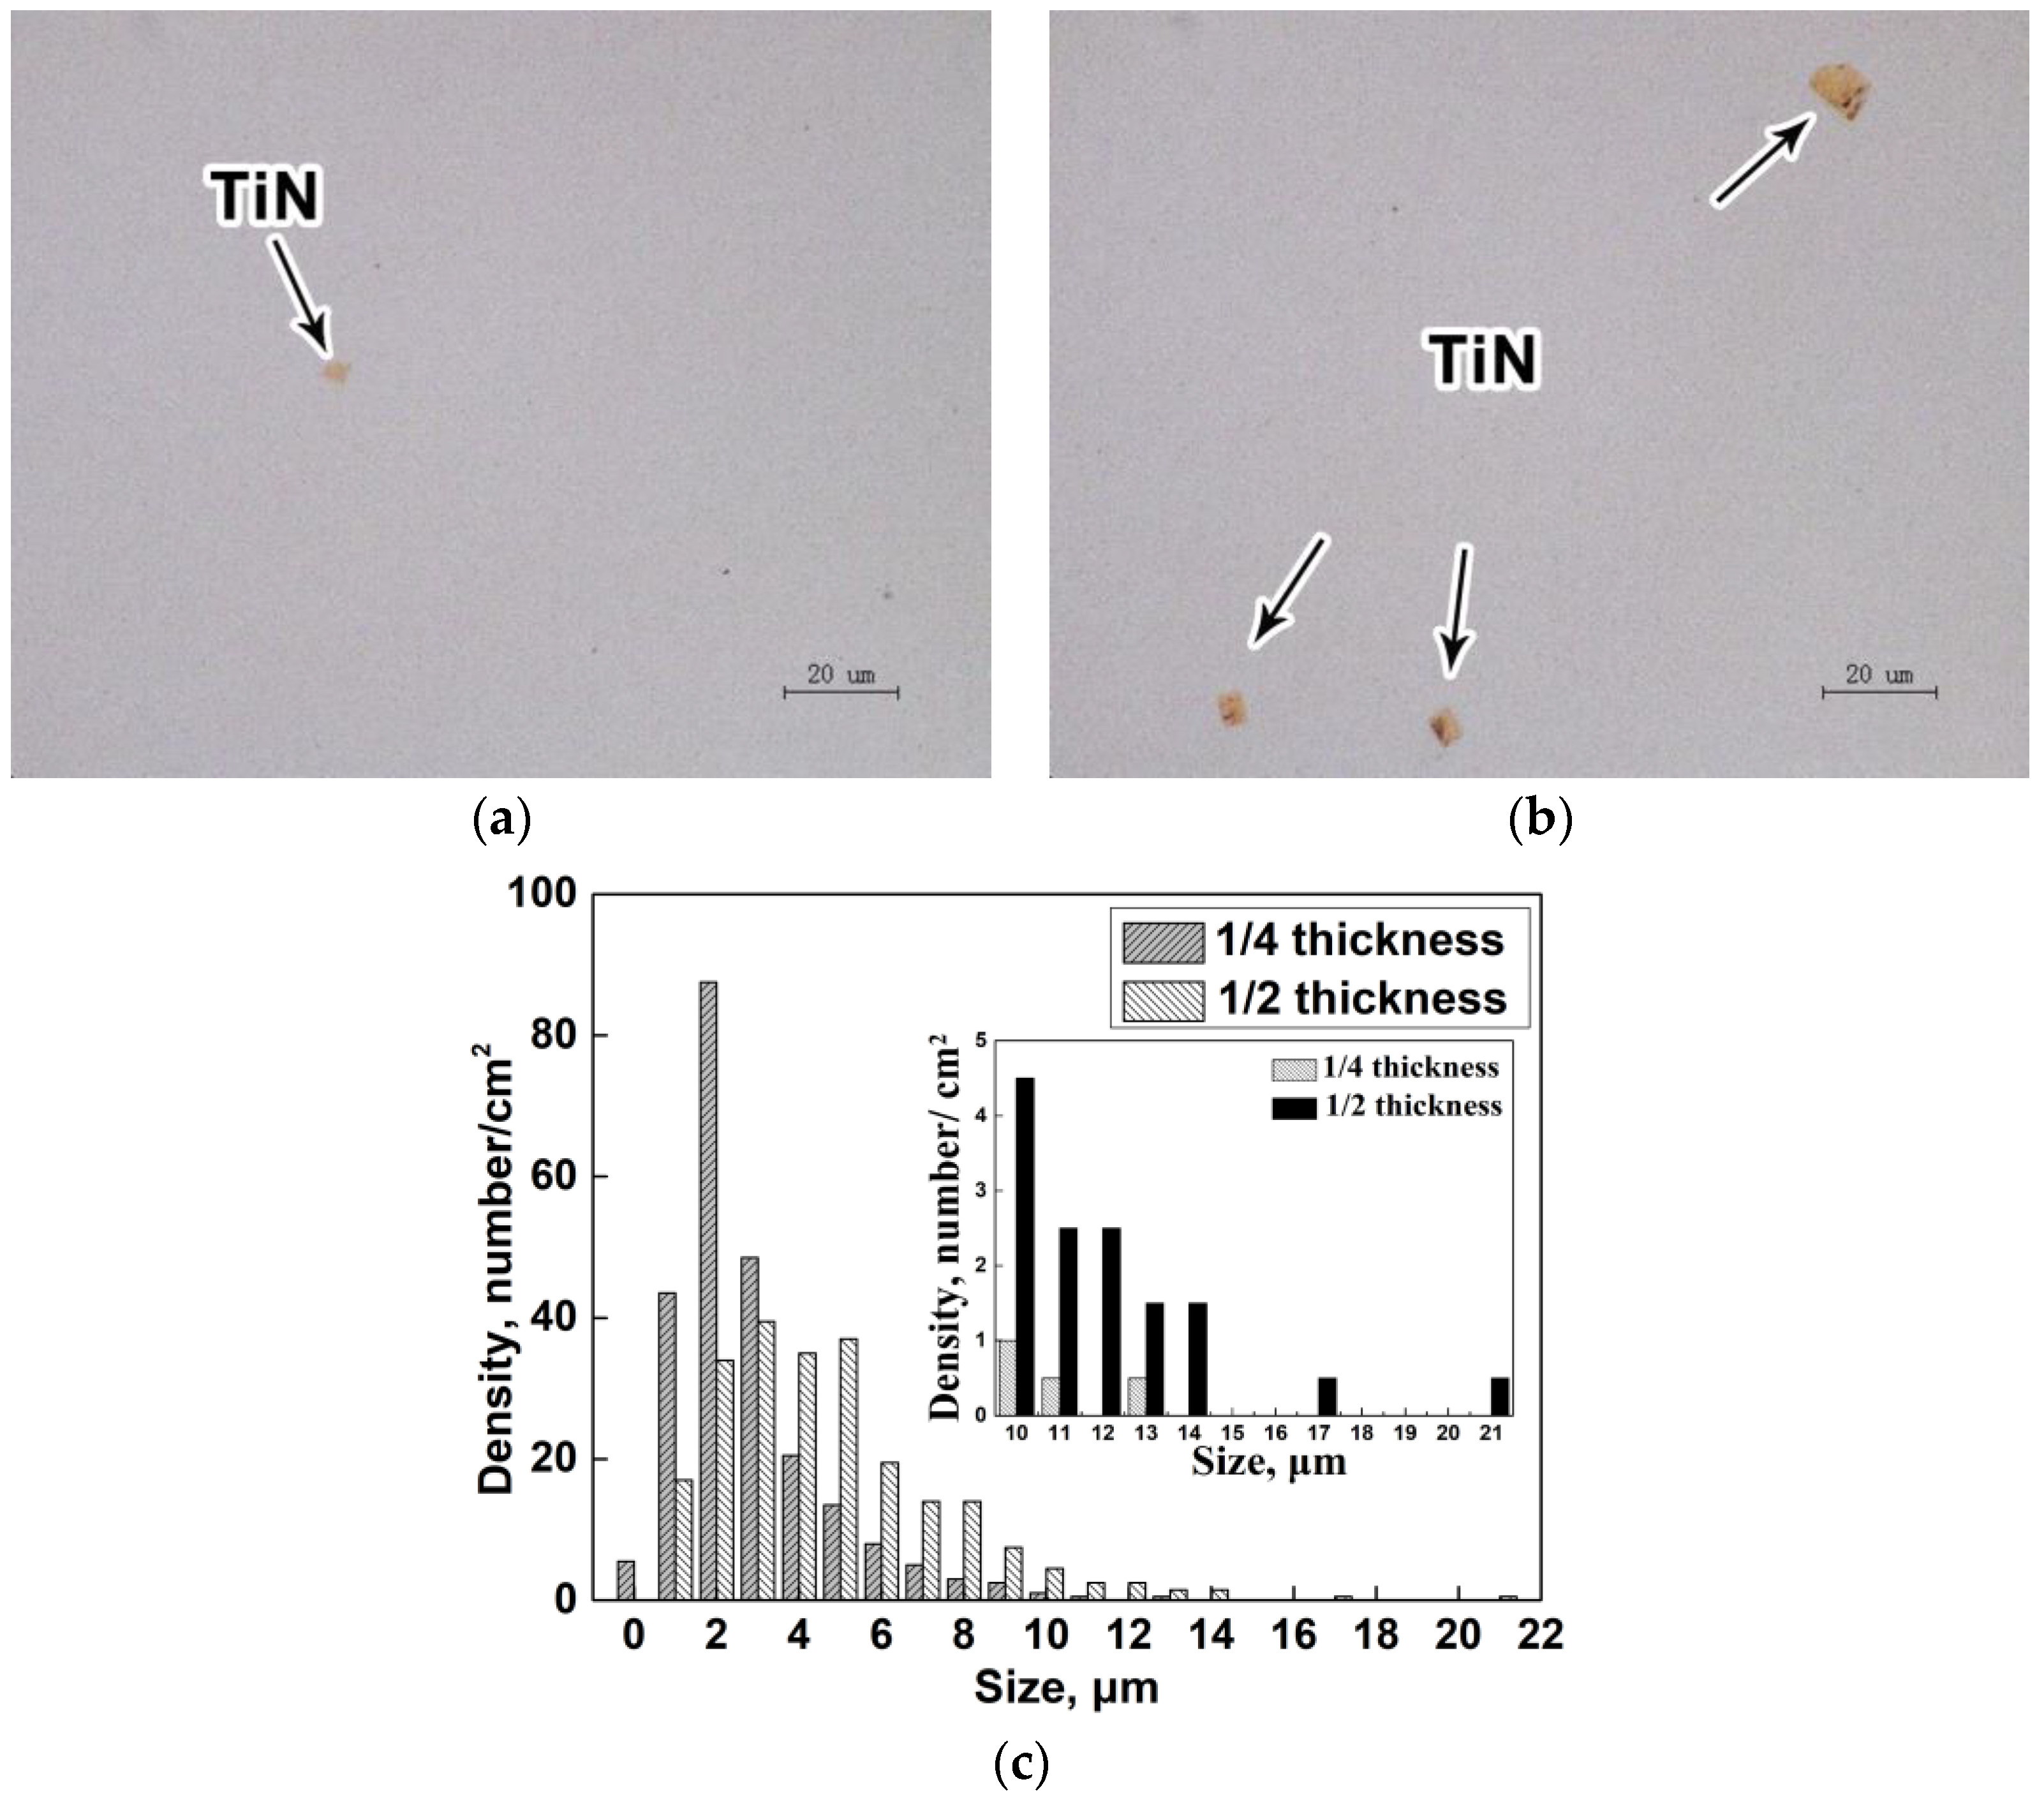
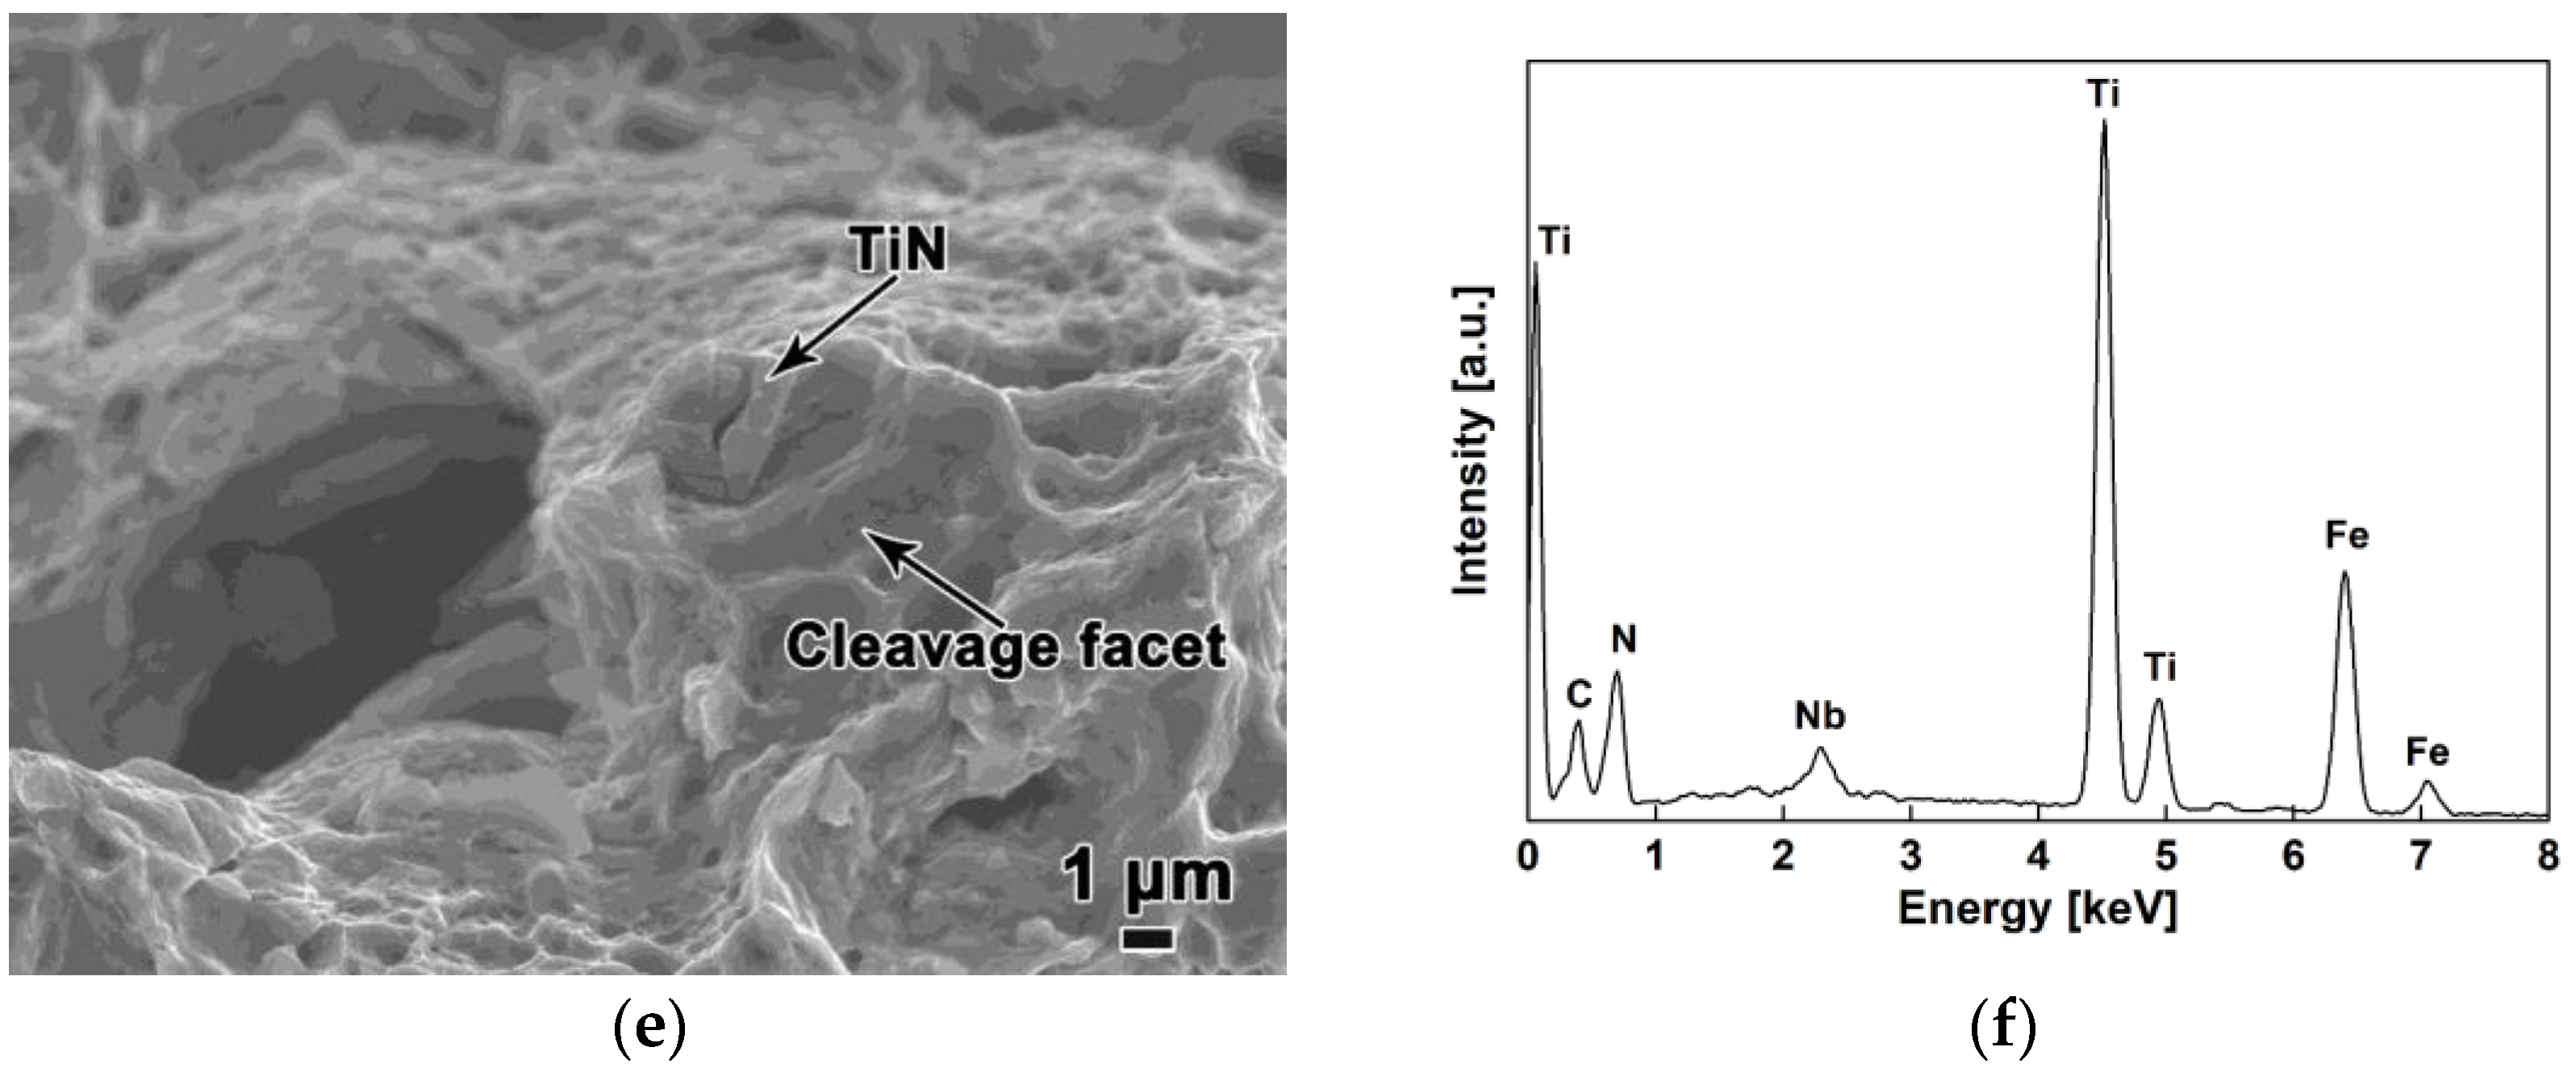
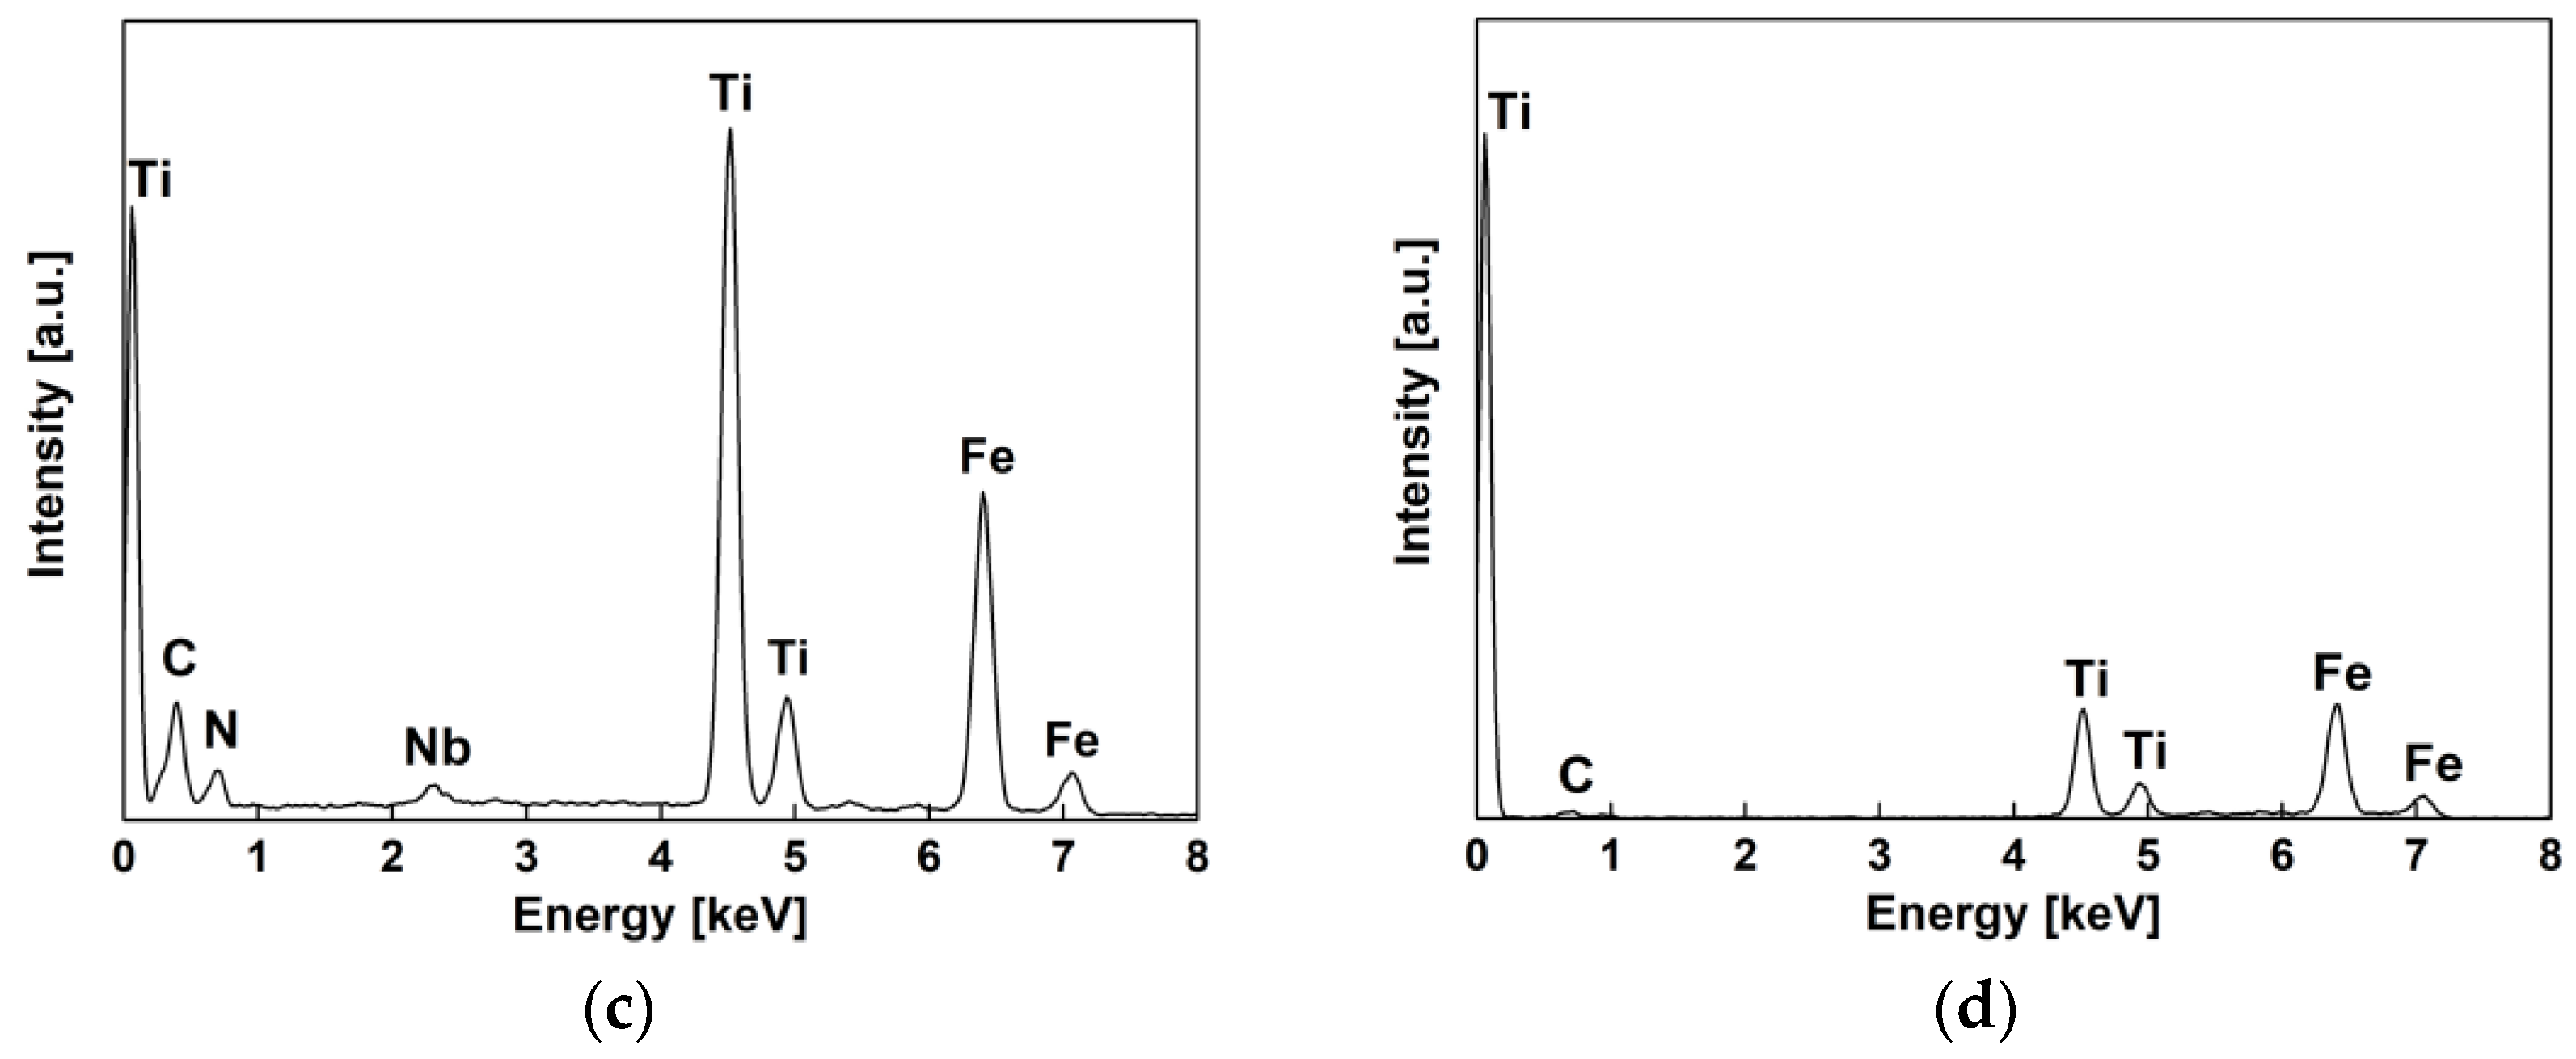
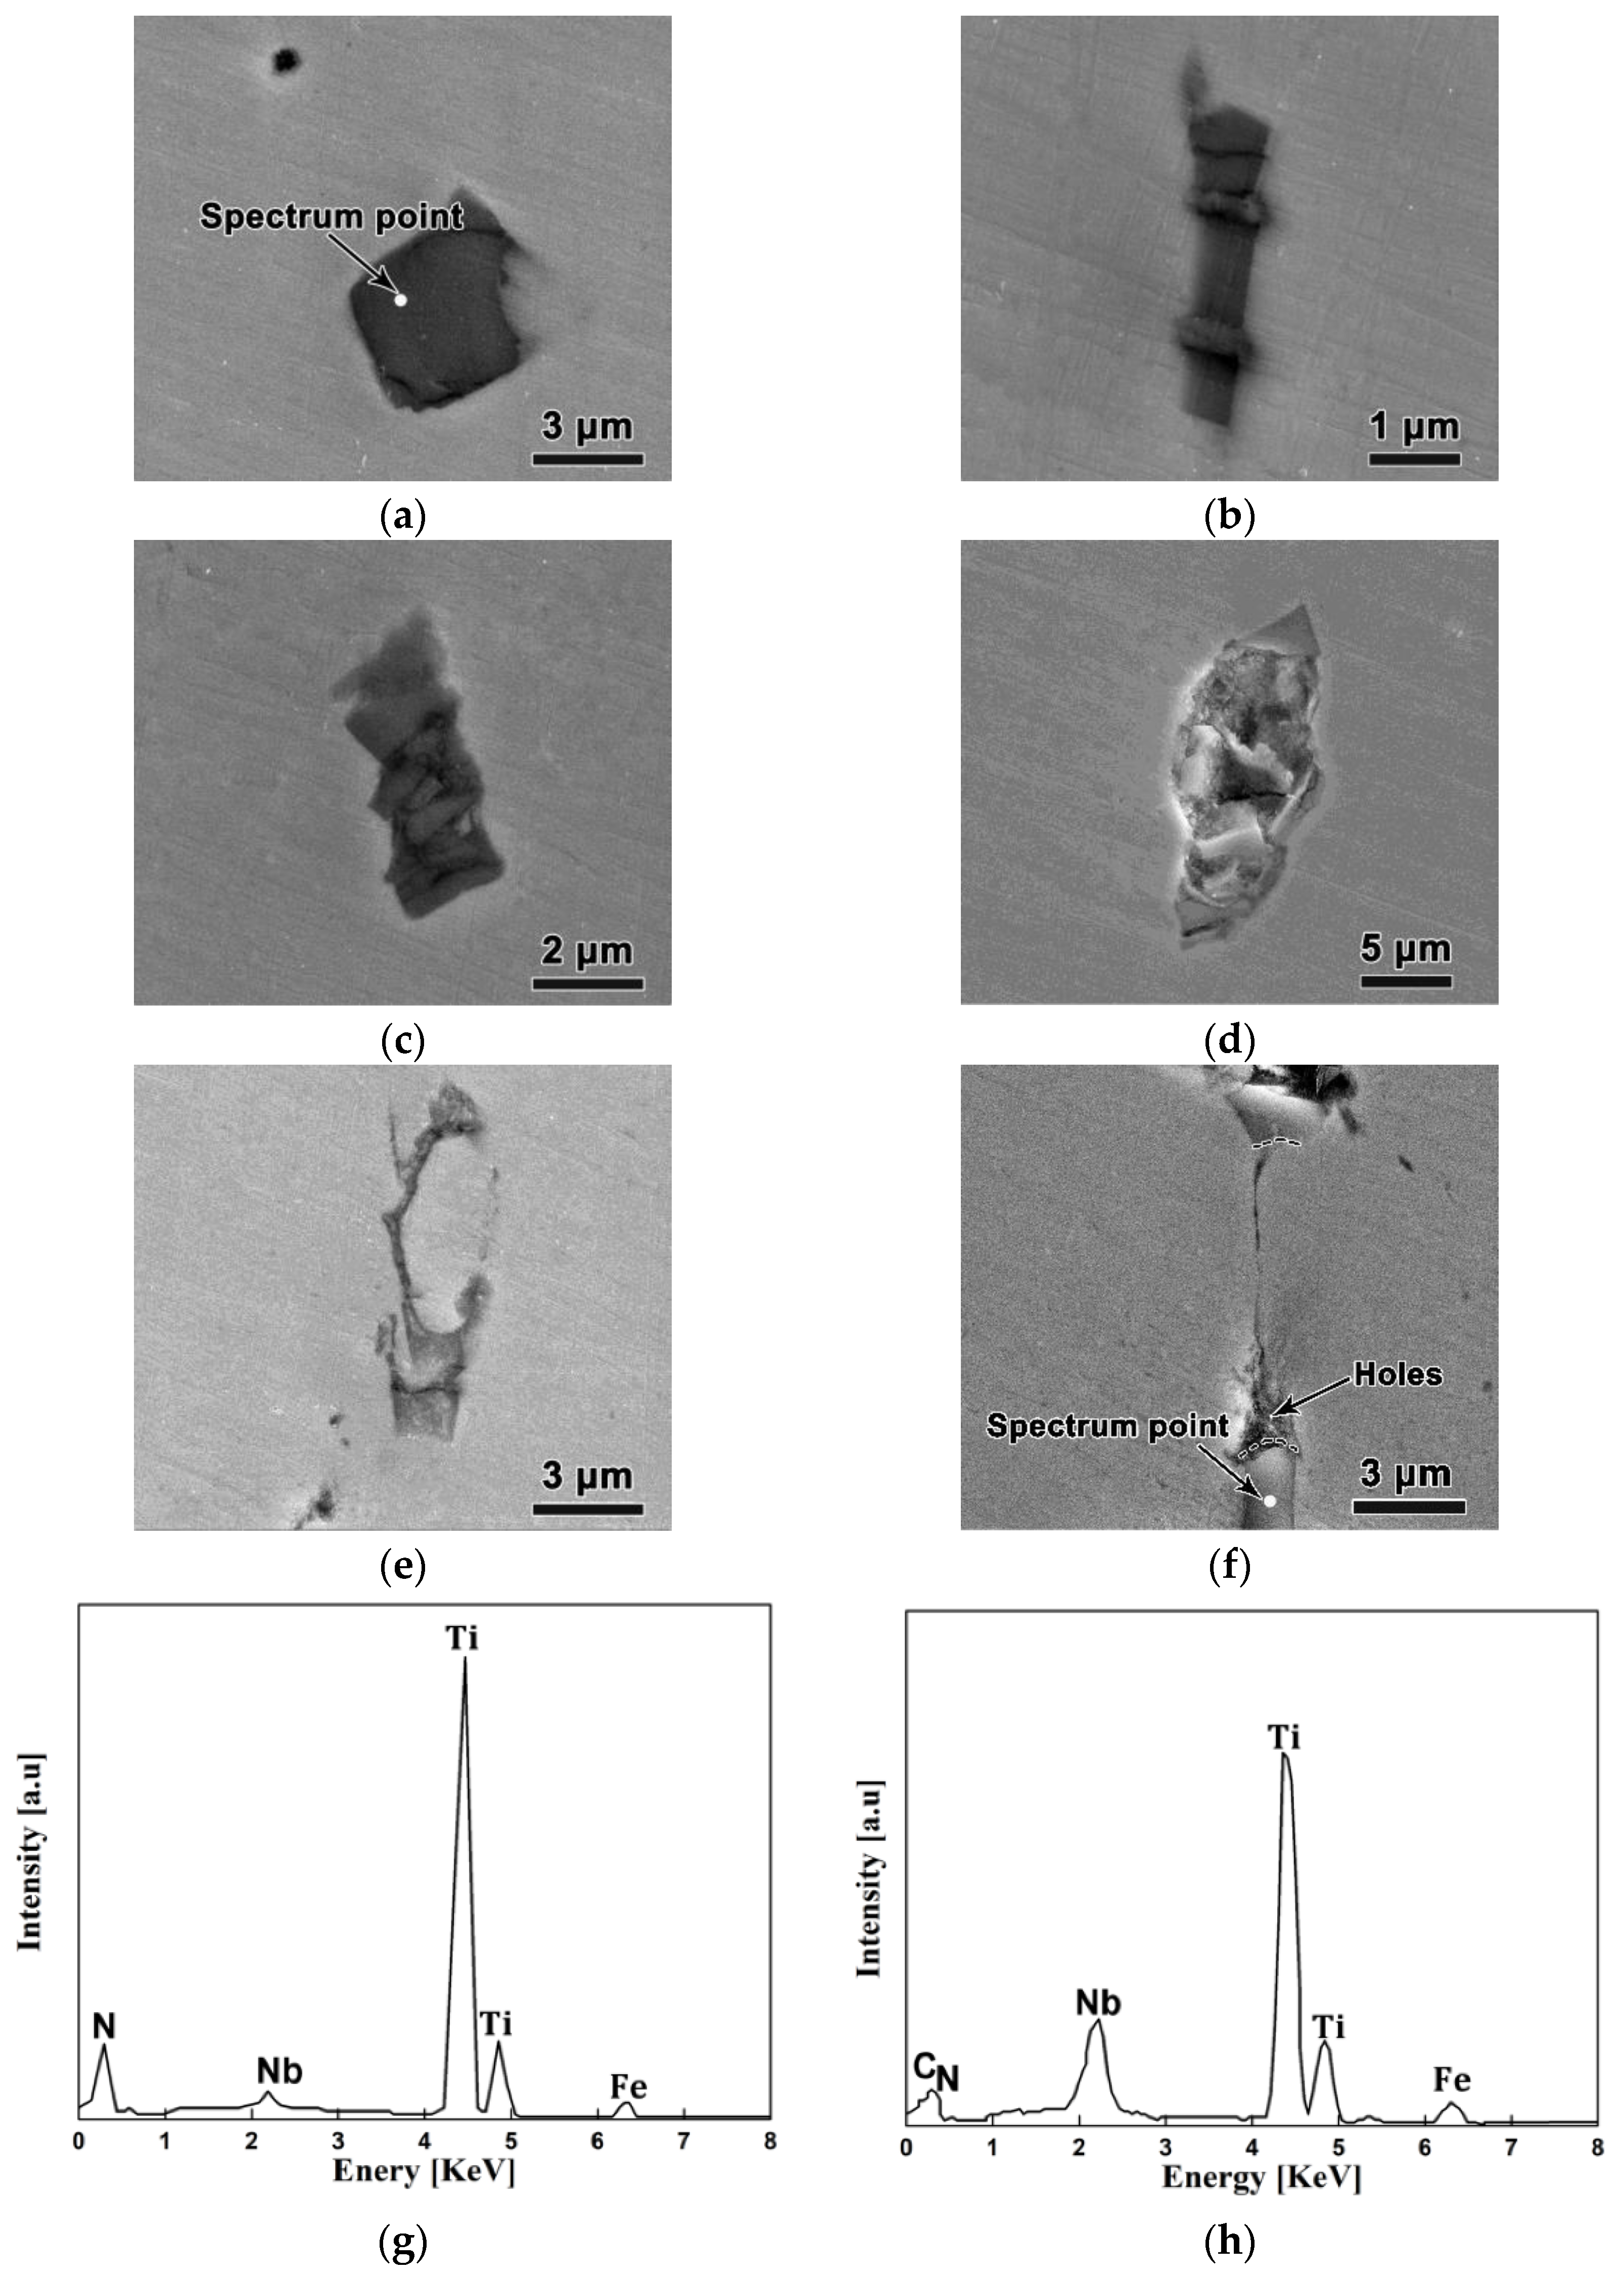
3.4. Fracture Behavior of Micron-Scale TiN and TiC Inclusions

The fractured specimen was cut along the axial direction, and the broken morphology of inclusions at different distances from the fracture surface was observed by SEM. Figure 8 shows the SEM images of the inclusions at these different distances, which represent the fracture morphology of TiN inclusions under different load states. The closer to the fracture surface, the greater the load, and the more serious the TiN brittle fracture. Figure 8a shows the TiN inclusion far away from the tensile fracture, according to the EDS spectra shown in Figure 8g, on which prominent microcracks are present, and Figure 8b presents the TiN inclusion slightly away from the tensile fracture, on which multiple widened cracks are present. Figure 8c,d show TiN inclusions near the fracture surface. In Figure 8c, the TiN inclusion has been completely broken; in Figure 8d, the broken TiN fragments are rotated with the load direction, and large holes have formed in the middle of the TiN. This indicates that the TiN inclusions closer to the fracture surface were broken more severely. The breakage process of TiN inclusions under loading occurs in the three following successive steps, as depicted in Figure 9a: (1) Microcracks are initiated at the TiN inclusion and immediately reach the TiN/matrix interface but do not propagate into the matrix; (2) multiple cracks are generated, some of which are widened inside the TiN; and (3) TiN inclusions are further separated at the fracture location and eventually form holes.
Figure 8e shows the TiC inclusions with intergranular morphology far away from the tensile fracture surface under tension loading. Figure 8f shows the TiC inclusions near the fracture surface, according to the EDS spectra shown in Figure 8h. The fracture position and morphology of the upper and lower TiC segments indicated that the two parts belong to an identical inclusion, as seen by the black dash in Figure 8f. The TiC inclusions were pulled apart and divided into two sections, and a hole was formed between them. With increased loading, the matrix deformed further, which caused the hole to become a narrow gap. The Vickers hardness of the TiN and TiC inclusions was 2450 HV and 3200 HV, respectively. A higher Vickers hardness value more easily enables brittle fracturing under high stress conditions. At the same time, the local stress concentration of the elongated inclusions was greater than that of the spherical inclusions [22], so the elongated TiC is vulnerable brittle fracturing under stress. With the deformation of the matrix, the hole between the fractured TiC segments became a narrow gap. The fracture process of TiC during the stretching process can be divided into three steps (Figure 9b): (1) Under tensile stress, the TiC inclusion is divided into two sections; (2) a hole forms between the substrates; and (3) with the deformation of the matrix, the hole between the substrates becomes a long and narrow gap under the tensile stress.

4. Discussion

4.1. Thermodynamic Analysis of TiN Formation

To elucidate the precipitation mechanism of the micron-scale TiN and TiC inclusions, the formation process of TiN and TiC inclusions was preceded by thermodynamic analysis. Ti preferentially combined with N to generate TiN [23]. The reaction formula and theoretical concentration product (KTiN) of the TiN are shown in Equations (1) and (2) [24,25,26].
Ti   +   N   =   TiN inclusion  
log   K TiN = log ( [ Ti ] × [ N ] ) = 15,218 / T + 5.64  
As the molten steel solidified, Ti and N accumulated at the solidification front, and with an increase in the solid fraction (fs), the concentrations of the Ti and N at the solidification front increased, as expressed by Equations (3) and (4) respectively.
[ Ti ] l = [ Ti ] 0 × ( 1 f s ) k Ti 1  
[ N ] l = [ N ] 0 / ( 1 ( 1 k N ) × f s )  
In the formula, [Ti]l, [N]l, [Ti]0, and [N]0 represent the concentrations of Ti and N at the solidification front and their initial concentrations, respectively; kTi and kN represent the equilibrium distribution coefficients of Ti and N, at 0.33 and 0.48, respectively. The temperature of the solidification front can be expressed by Equation (5).
T = T Fe ( T Fe T l ) / ( 1 f s × ( T l T s ) / ( T Fe T s ) )  
In the formula, T is the temperature of the solidification front of molten steel; TFe is the melting point temperature of molten steel at 1809 K; Tl is the liquidus temperature at 1763 K; and Ts is the solidus temperature at 1694 K. JMatPro software (Public Release Version 7.0.0, Sente Software Ltd., Guildford, UK) was used to obtain Tl and Ts.
The actual concentration of the product (QTiN) of Ti and N in molten steel is expressed by Equation (6).
Q TiN = [ Ti ] 0 × [ N ] 0 × ( 1 f s ) k Ti 1 / ( 1 ( 1 k N ) × f s )  
To control the size of the TiN precipitated in steel, the precipitation conditions were simulated. The thermodynamic curves according to Equations (2) and (6) are presented in Figure 10a. From the intersection of the curves, TiN began to precipitate at 0.89 of fs. Substituting fs into Equation (5) revealed that the TiN began to precipitate at 1710 K between the solid and liquid phase zones, resulting in microsized TiN in the steel. This result is consistent with those presented in Figure 4, Figure 6, Figure 7 and Figure 8.

4.2. Thermodynamic Analysis of TiC Formation

The reaction equation of TiC and its theoretical concentration product (KTiC) are expressed by Equations (7) and (8) [27,28].
Ti   +   C   =   TiC inclusion  
log   K TiC = log ( [ Ti ] × [ C ] ) = 8200 / T + 4.61  
According to the stoichiometric ratio of Ti to N in TiN, at 3.42, after the formation of TiN, the remaining Ti is 0.0016%, then Ti4C2S2 is formed first. Owing to the low S content in the steel, the remaining Ti reacted only with C. Therefore, the remaining Ti and C in the molten steel continued to gather at the solidification front, which can be expressed as follows:
[ C ] = [ C ] 0 / ( 1 ( 1 k C ) × f s )  
[ Ti ] TiC = [ Ti ] c × ( 1 f s ) k Ti 1  
where [C] and [C]0 are the C concentration at the solidification front and its initial concentration in the steel, respectively; [Ti]C is the residual of the Ti content, where the subtracted Ti is consumed by N in the solid–liquid phase region; and the equilibrium distribution coefficient of C (kC) is 0.17. Therefore, the actual concentration product of Ti and C (QTiC) in molten steel is as follows:
Q TiC = [ Ti ] C × [ C ] 0 × ( 1 f s ) k Ti 1 / ( 1 ( 1 k C ) × f s )  
Equations (8) and (11) are used to present the curves of KTiC and QTiC. As shown in Figure 10b, the two curves did not intersect. Thus, TiC precipitated at the solid phase region. However, TiC can precipitate in the austenite or ferrite region. The solubility product formulas of TiC in austenite and ferrite are expressed by Equations (12) and (13), respectively [9].
log K TiC γ = log ( [ Ti ] TiC × [ C ] ) = 7000 / T + 2.75  
log K TiC α = log ( [ Ti ] TiC × [ C ] ) = 9575 / T + 4.40  
After the TiN formed, the remaining Ti and C were substituted into Equation (12) and Equation (13), respectively. The calculation indicated that the precipitation temperature of TiC in austenite is 1158 K (885 °C), which is consistent with the calculation formula for the austenite concentration product in Equation (12). In ferrite, the temperature was 1240 K (967 °C), which is higher than the ferrite transformation temperature. This contradicted the use of the calculation formula for the ferrite concentration product in Equation (13). Thus, TiC can be precipitated only in austenite. TiC is precipitated along the grain boundary and quickly increases in size to the micron scale, which is consistent with the experimental results given in Section 3.3 and Section 3.4. The relationship between the precipitation temperature of TiC and the content of Ti was determined according to Equation (12). As shown in Figure 10c, the precipitation temperature of TiC decreased with a decrease in the Ti content in the steel, resulting in the growth rate of TiC decreasing, which is conducive to the refinement of TiC [29]. Therefore, satisfying the required content of Ti for N-fixing, reducing the Ti content, and allowing the TiC to precipitate at a low temperature can effectively slow the growth rate of the TiC and refine its size.

4.3. Dynamic Analysis of TiN Formation

To reduce the size of the TiN, its dynamic behavior in experimental steel was investigated. When the actual concentration product of Ti and N in the molten steel is greater than the equilibrium concentration product, the TiN begins to nucleate and grow. The theoretical precipitation size of TiN inclusions at the solidification front can be calculated by the following formula [25,26,30]:
r = 10 4 × M s / 50 M m × ρ m / ρ s × D N × ( [ N ] L [ N ] e ) × t  
In the formula, r is the particle radius, μm; Ms is the molar mass of TiN, 62 g/mol; Mm is the molar mass of molten steel, 56 g/mol; ρs is the density of TiN, 5.43 g/cm3; ρm is the density of molten steel, 7.07 g/cm3; DN is the diffusion coefficient of N in the molten steel, DN = 0.91exp(−168,490/RT), cm2/s; [N]L is the mass fraction of N at the solidification front of the molten steel; [N]e represents the mass fraction of N when the concentrations of N and TiN in the molten steel are in equilibrium, which can be calculated by Equation (2); and t is the local cooling time, s, which can be calculated by Equation (15).
t = ( T l T S ) / R c
In the formula, RC is the local cooling rate, K/s, which is set at 0.5, 1, 5, and 10 K/s, respectively.
Figure 10d shows the relationship between the size of the TiN inclusions and the cooling rate. At the same precipitation temperature, the precipitation size of TiN inclusions increased with a decrease in the cooling rate. When the local cooling rate was 0.5 K/s and fs was close to 1, the size of the TiN inclusions was the largest, and the radius was about 4.5 μm. When the local cooling rate was 10 K/s, the size of the TiN inclusions was the smallest, with a radius of about 1 μm. The local cooling rate increased from 0.5 K/s to 10 K/s and the radius of the TiN inclusions decreased from 4.5 μm to 1 μm. This result is consistent with the sizes of the TiN inclusions observed by SEM. Therefore, the size of the TiN inclusions can be reduced by increasing the cooling rate of the molten steel.
Figure 10e,f present the relationship between the size of the TiN and the content of Ti and N. The fs value at which TiN begins to precipitate varied with the content of N and Ti. Greater Ti and N contents resulted in smaller initial fs and larger TiN inclusion size, owing to the preferential TiN precipitation in the liquid phase, which can continue to grow in the solidification process. Moreover, the influence of the N content was much greater than that of the Ti content on the size of the TiN inclusion.

5. Conclusions

  • NM550 steel has superior mechanical properties. The yield strength (YS) of the steel plate was 1340–1519 MPa, and the ultimate tensile strength (UTS) was 1700–1842 MPa. The fracture fiber zone is composed of dimples, cleavage planes, quasi-cleavage planes, and secondary cracks, whereas the shear lip zone is composed of numerous shear dimples and cleavage and quasi-cleavage planes.
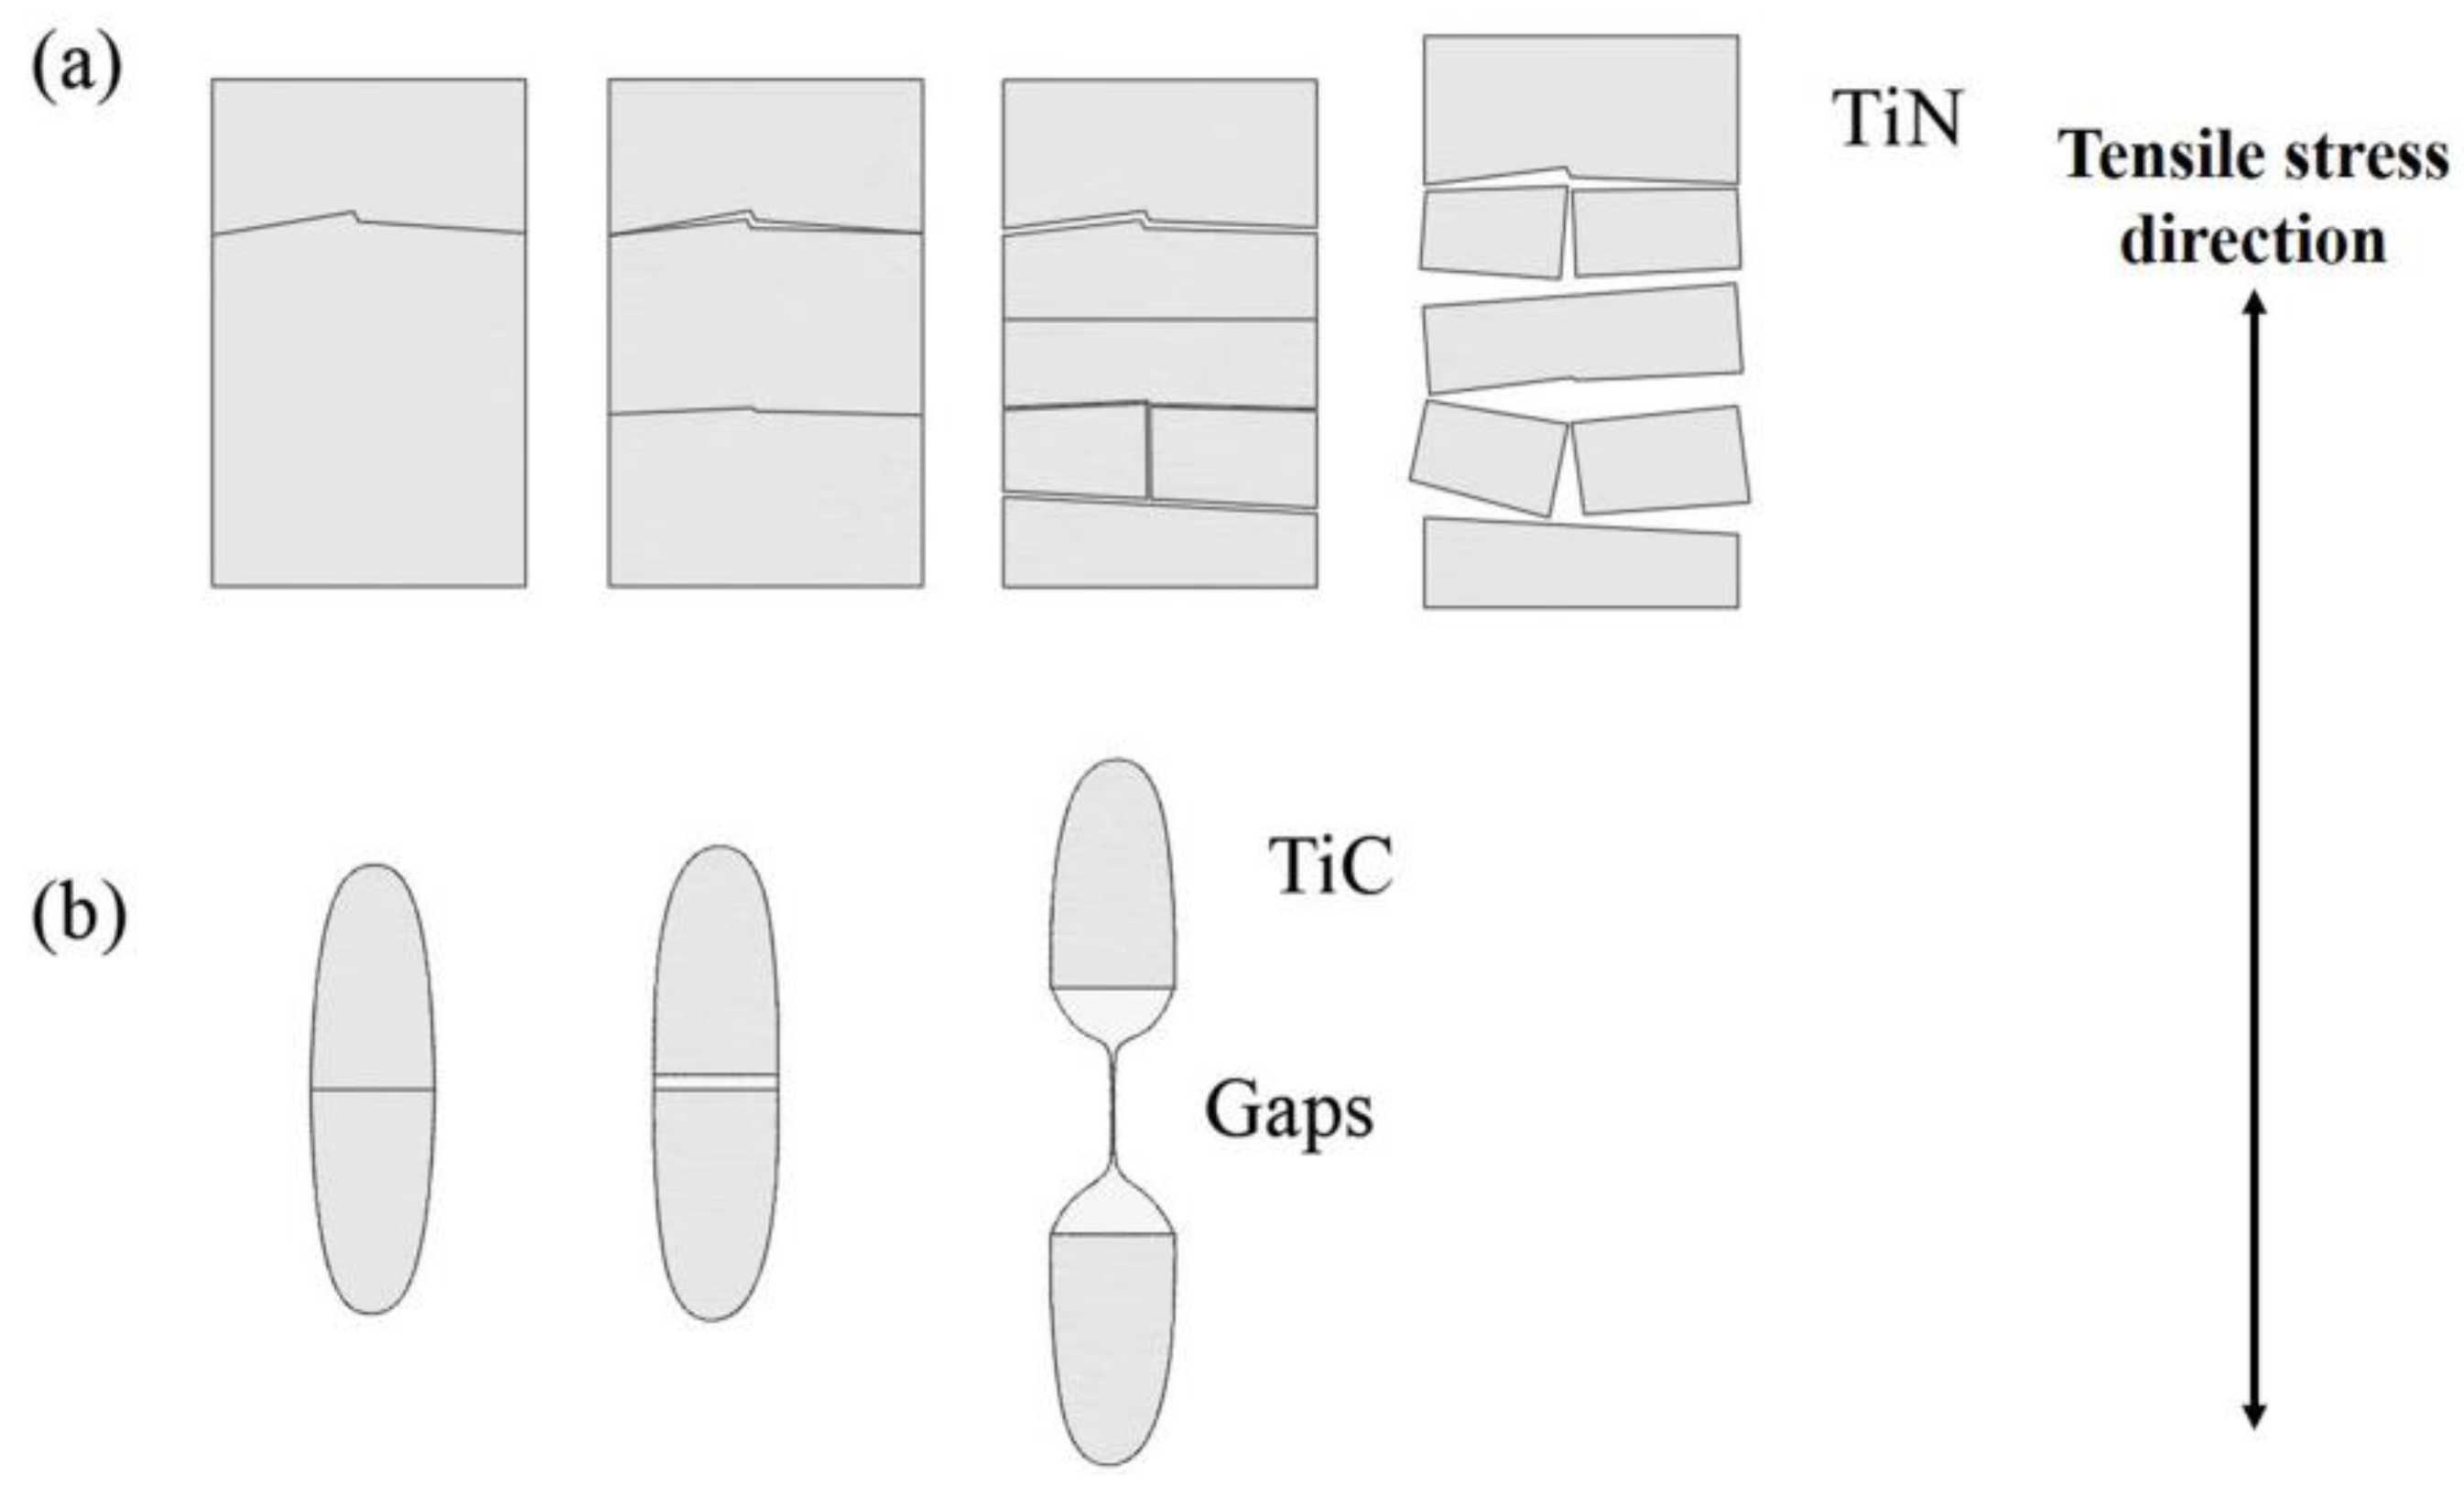
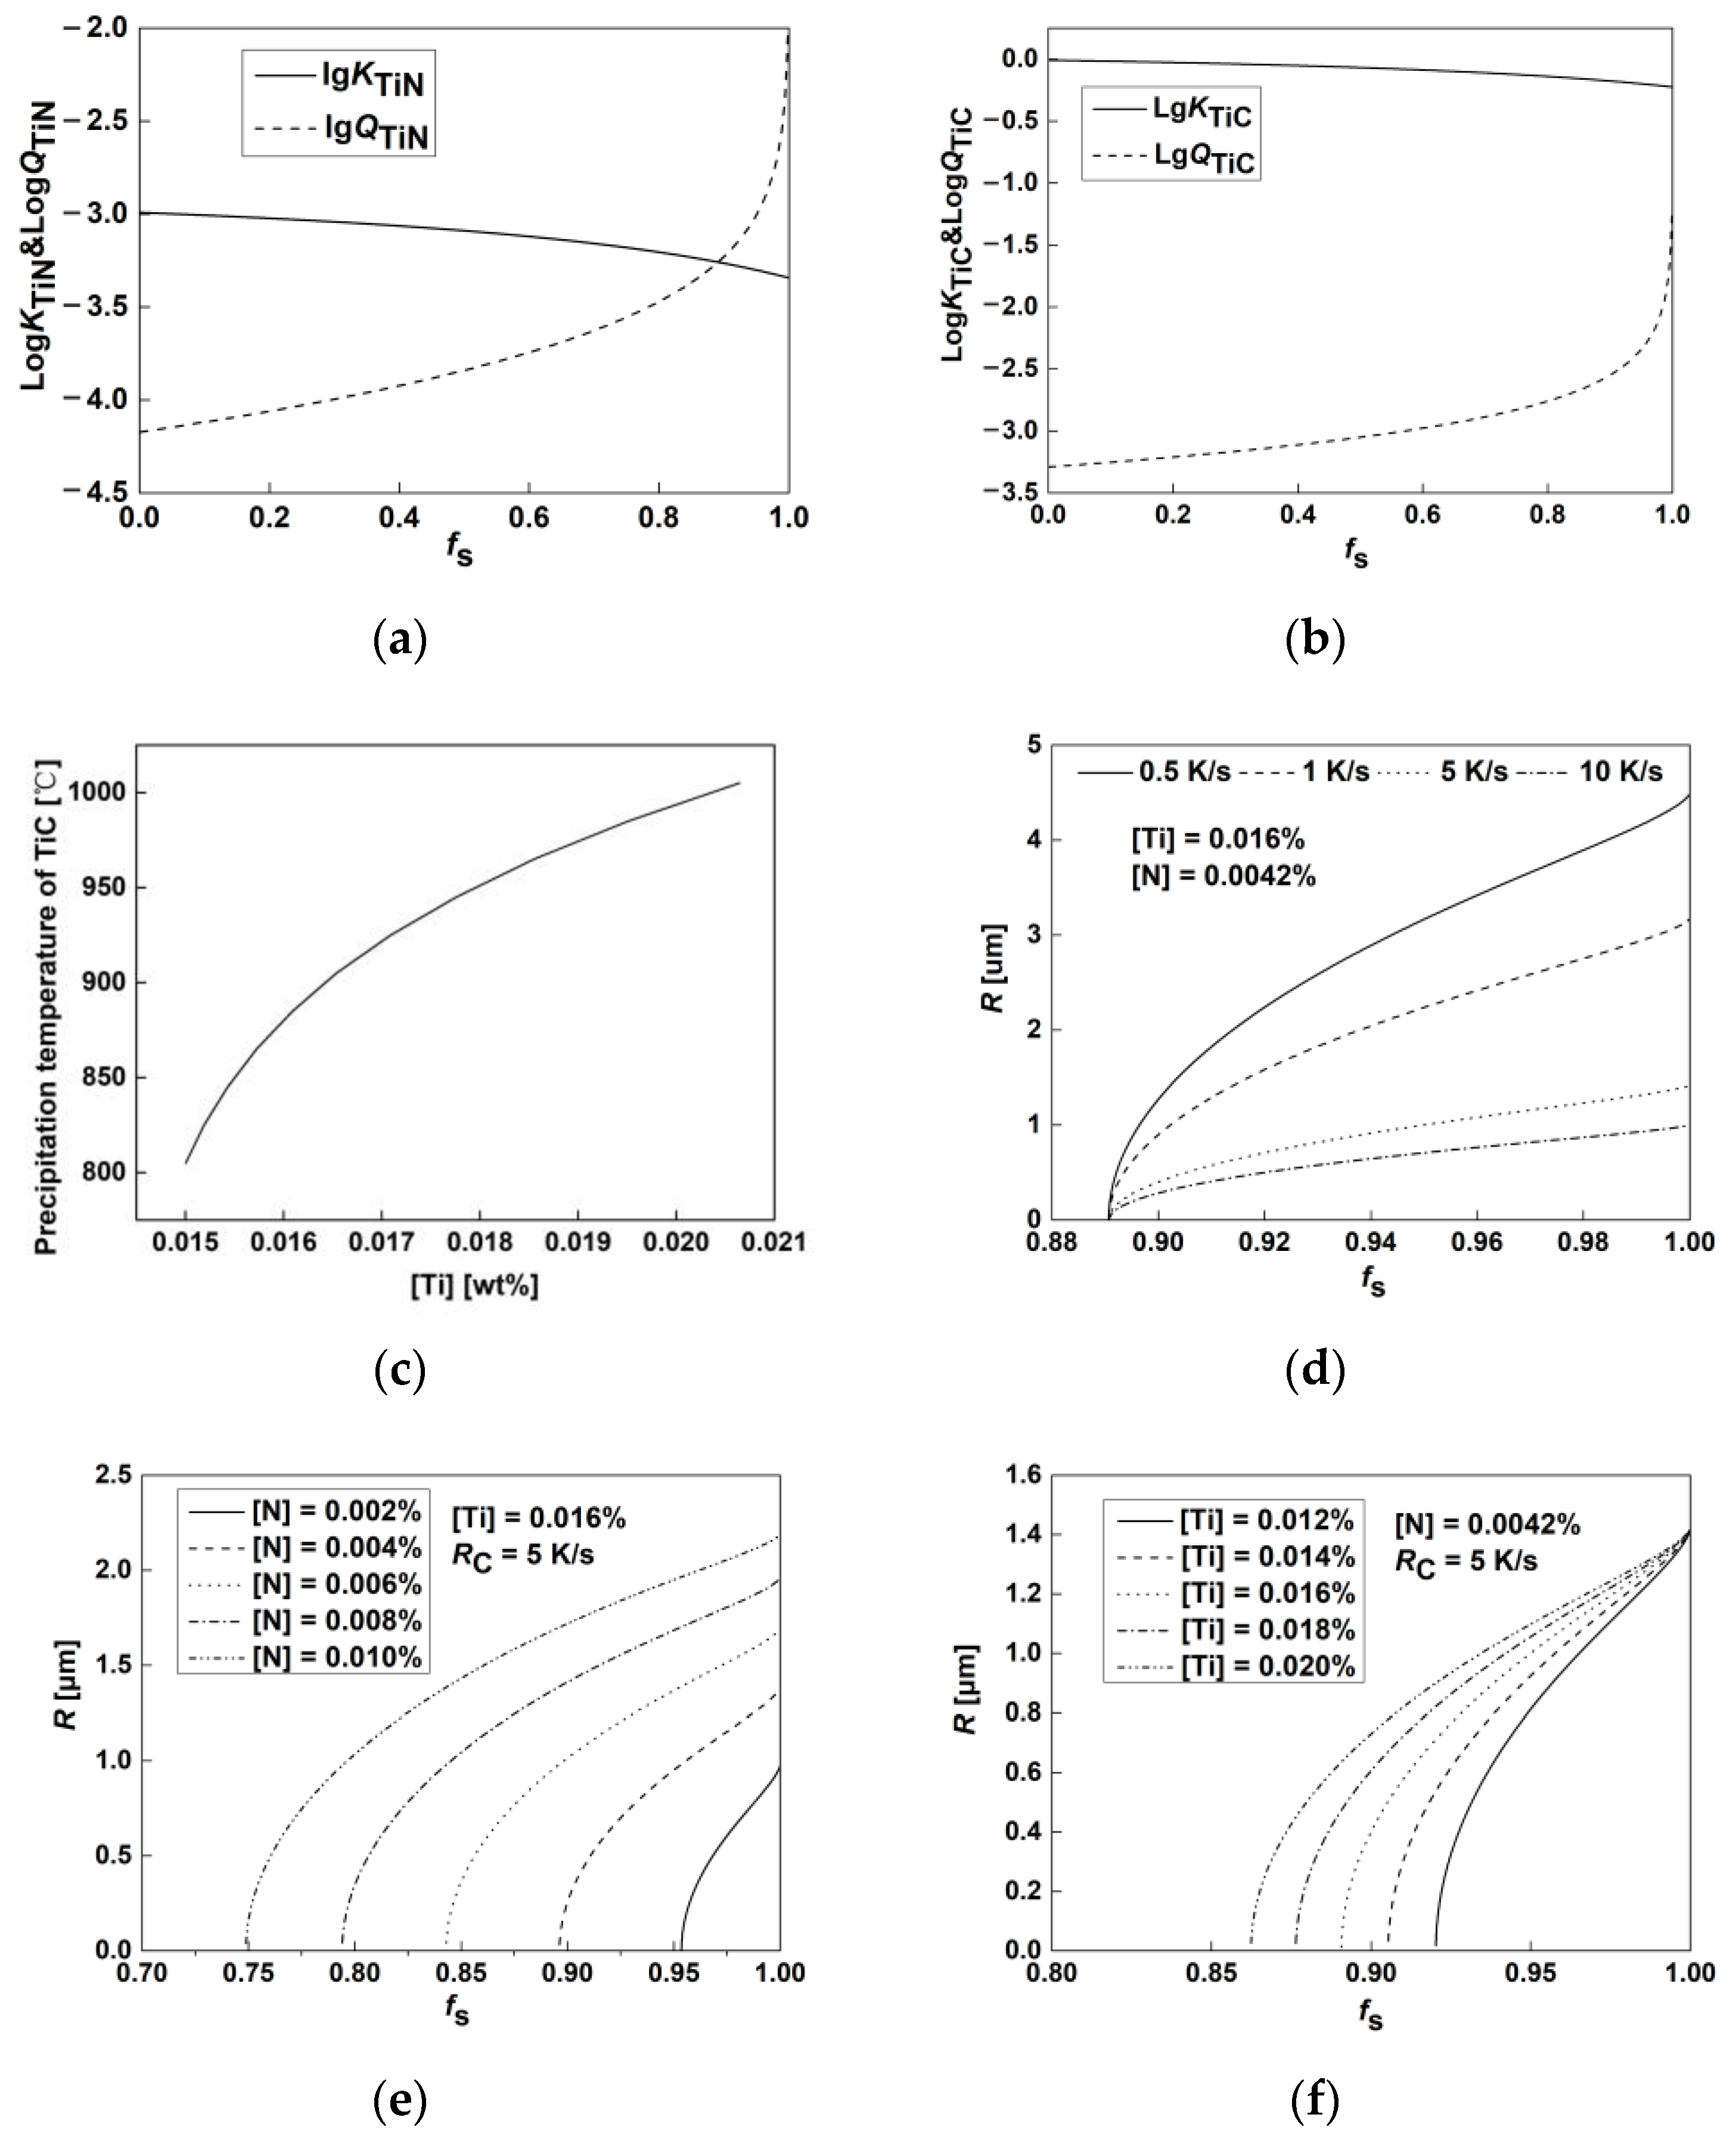
  • The TiN precipitates in the solid–liquid two-phase region at a precipitation temperature of 1710 K, whereas that of TiC is 1158 K along the austenite grain boundary. The sizes of the TiN precipitated in the liquid phase and the TiC precipitated in austenite are both at the micron scale, which is prone to cleavage fracture during the stretching process. Under tensile stress, microcracks are first initiated at the TiN inclusion, which are further separated forming a hole, whereas the TiC inclusion is divided into two sections with a long and narrow gap formed between the substrates.
  • The size of the TiN inclusions precipitated in the liquid phase is related to the local cooling rate and the Ti and N contents. Under the same cooling rate, smaller initial contents of Ti and N result in smaller TiN size. Moreover, the influence of the N content is obviously greater than that of the Ti content on the size of the TiN. Increasing the cooling rate to reduce the size of the TiN inclusion is the most significant mechanism.

Author Contributions

Conceptualization, Z.W. (Zhenlong Wang), X.Z., D.L., Z.W. (Zhongyang Wang) and J.L.; methodology, Z.W. (Zhenlong Wang), X.Z. and D.L.; software simulation, D.L. and Z.W. (Zhongyang Wang); experimental validation, D.L., Z.W. (Zhongyang Wang) and J.L.; formal analysis and investigation, Z.W. (Zhenlong Wang), X.Z., D.L., Z.W. (Zhongyang Wang), and J.L.; resources, X.Z.; data curation, X.Z., D.L. and Z.W. (Zhongyang Wang); writing—original draft preparation, D.L.; writing—review and editing, Z.W. (Zhenlong Wang) and X.Z.; supervision, Z.W. (Zhenlong Wang), X.Z. and D.L.; project administration, X.Z.; funding acquisition, X.Z. All authors have read and agreed to the published version of the manuscript.

Funding

This research was funded by Henan Provincial Science and Technology Cooperation Project China (Grant No. 182106000016) and Key R&D and Promotion Special Project of Henan Province (No. 212102210444).

Institutional Review Board Statement

Not applicable.

Informed Consent Statement

Not applicable.

Data Availability Statement

Data are contained within the article.

Acknowledgments

The authors gratefully acknowledge the financial support provided by Nanjing Iron & Steel Co., Ltd.

Conflicts of Interest

The authors declare no conflict of interest.

References

  1. Nikitin, V.N.; Nastich, S.Y.; Smirnov, L.A.; Mal’Tsev, A.B.; Denisov, S.V.; Chevskaya, O.N.; Brylin, A.M.; Kurash, V.S.; Maslyuk, V.M.; Tarasov, V.M. Economically alloyed high-strength steel for use in mine equipment. Steel Transl. 2016, 46, 742–751. [Google Scholar] [CrossRef]
  2. Cai, M.H.; Chen, L.G.; Fang, K.; Huang, H.S.; Hodgson, P. The effects of a ferritic or martensitic matrix on the tensile behavior of a nano-precipitation strengthened ultra-low carbon Ti-Mo-Nb steel. Mater. Sci. Eng. A 2021, 801, 140410. [Google Scholar] [CrossRef]
  3. Shi, C.; Liu, W.-J.; Li, J.; Yu, L. Effect of Boron on the hot ductility of low-carbon Nb-Ti-microalloyed steel. Mater. Trans. 2016, 57, 647–653. [Google Scholar] [CrossRef] [Green Version]
  4. Pan, T.; Wang, X.Y.; Su, H.; Yang, C.F. Effect of alloying element Al on hardenability and mechanical properties of micro-B treated ultra-heavy plate steels. Acta Metall. Sin. 2014, 50, 431–438. [Google Scholar]
  5. Yoo, J.; Jo, M.C.; Kim, S.; Oh, J.; Bian, J.; Sohn, S.S.; Lee, S. Effects of Ti alloying on resistance to hydrogen embrittlement in (Nb+Mo)-alloyed ultra-high-strength hot-stamping steels. Mater. Sci. Eng. A 2020, 791, 139763. [Google Scholar] [CrossRef]
  6. Wang, R.; Bao, Y.-P.; Yan, Z.-J.; Li, D.-Z.; Kang, Y. Comparison between the surface defects caused by Al2O3 and TiN inclusions in interstitial-free steel auto sheets. Int. J. Miner. Metall. Mater. 2019, 26, 178–185. [Google Scholar] [CrossRef]
  7. Wu, X.; Zuo, X.R.; Zhao, W.W.; Wang, Z.Y. Mechanism of TiN fracture during the tensile process of NM500 wear-resistant steel. Acta Metall. Sin. 2020, 56, 129–136. [Google Scholar]
  8. Han, J.; Zhu, Z.; Wei, G.; Jiang, X.; Wang, Q.; Cai, Y.; Jiang, Z. Microstructure and mechanical properties of Nb- and Nb + Ti-stabilised 18Cr–2Mo ferritic stainless steels. Acta Metall. Sin. 2020, 33, 716–730. [Google Scholar] [CrossRef]
  9. Zhu, Y.; Lu, Y.-M.; Huang, C.-W.; Liang, Y.-L. The effect of TiN inclusions on the fracture mechanism of 20CrMnTi steel with lath martensite. Mater. Res. Express 2020, 7, 036509. [Google Scholar] [CrossRef]
  10. Kostryzhev, A.; Killmore, C.; Yu, D.; Pereloma, E. Martensitic wear resistant steels alloyed with titanium. Wear 2020, 446-447, 203203. [Google Scholar] [CrossRef]
  11. Liu, T.; Long, M.-J.; Chen, D.-F.; Duan, H.-M.; Gui, L.-T.; Yu, S.; Cao, J.-S.; Chen, H.-B.; Fan, H.-L. Effect of coarse TiN inclusions and microstructure on impact toughness fluctuation in Ti micro-alloyed steel. J. Iron Steel Res. Int. 2018, 25, 1043–1053. [Google Scholar] [CrossRef]
  12. Ghosh, A.; Ray, A.; Chakrabarti, D.; Davis, C.L. Cleavage initiation in steel: Competition between large grains and large par-ticles. Mater. Sci. Eng. A 2013, 561, 126–135. [Google Scholar] [CrossRef]
  13. Rassizadehghani, J.; Najafi, H.; Emamy, M.; Eslami-Saeen, G. Mechanical properties of V-, Nb-, and Ti-bearing as-cast micro-alloyed steels. J. Mater. Sci. Technol. 2007, 23, 779–784. [Google Scholar]
  14. Ramachandran, D.C.; Murugan, S.P.; Moon, J.; Lee, C.-H.; Park, Y.-D. The effect of the hyperstoichiometric Ti/N ratio due to excessive Ti on the toughness of N-controlled novel fire- and seismic-resistant steels. Metall. Mater. Trans. A 2019, 50, 3514–3527. [Google Scholar] [CrossRef]
  15. Murakami, Y.; Matsunaga, H.; Abyazi, A.; Fukushima, Y. Defect size dependence on threshold stress intensity for high-strength steel with internal hydrogen. Fatigue Fract. Eng. Mater. Struct. 2013, 36, 836–850. [Google Scholar] [CrossRef]
  16. Liu, J.; Liu, D.; Zuo, X.; Liu, L.; Yan, Q. Influence of TiN inclusions and segregation on the delayed cracking in NM450 wear-resistant steel. Metals 2022, 12, 21. [Google Scholar] [CrossRef]
  17. Wang, Z.; Wu, X.; Liu, D.; Zuo, X. Correlation between microstructure and fracture behavior in thick HARDOX 450 wear-resistant steel with TiN inclusions. Front. Mater. 2021, 8, 691551. [Google Scholar] [CrossRef]
  18. Pandey, C.; Saini, N.; Mahapatra, M.M.; Kumar, P. Study of the fracture surface morphology of impact and tensile tested cast and forged (C&F) Grade 91 steel at room temperature for different heat treatment regimes. Eng. Fail. Anal. 2017, 71, 131–147. [Google Scholar] [CrossRef]
  19. Kim, B.-H.; Moon, J.; Kim, S.-D.; Jang, J.-H.; Lee, T.-H.; Hong, H.-U.; Kim, H.C.; Cho, K.-M.; Lee, C.-H. Effect of concentrations of Ta and Ti on microstructure and mechanical properties of 9Cr-1W reduced activation ferritic/martensitic steel. Fusion Eng. Des. 2020, 151, 111364. [Google Scholar] [CrossRef]
  20. Pandey, C.; Mahapatra, M.M.; Kumar, P.; Sirohi, S. Fracture behaviour of crept P91 welded sample for different post weld heat treatments condition. Eng. Fail. Anal. 2019, 95, 18–29. [Google Scholar] [CrossRef]
  21. Yanagimoto, F.; Shibanuma, K.; Kawabata, T.; Suzuki, K.; Aihara, S. Measurement of local brittle fracture stress for dynamic crack propagation in steel. Procedia Struct. Integr. 2016, 2, 395–402. [Google Scholar] [CrossRef] [Green Version]
  22. Wang, H.; Bao, Y.-P.; Zhao, M.; Wang, M.; Yuan, X.-M.; Gao, S. Effect of Ce on the cleanliness, microstructure and mechanical properties of high strength low alloy steel Q690E in industrial production process. Int. J. Miner. Metall. Mater. 2019, 26, 1372–1384. [Google Scholar] [CrossRef]
  23. Chen, Q.L.; Mao, X.P.; Sun, X.J. Ti (CN) Precipitation in ultra-high strength Ti micro-alloyed steels with 700MPa yield strength on TSCR process. Adv. Mater. Res. 2013, 842, 61–69. [Google Scholar] [CrossRef]
  24. Yang, L.; Cheng, G.-G. Characteristics of Al2O3, MnS, and TiN inclusions in the remelting process of bearing steel. Int. J. Miner. Metall. Mater. 2017, 24, 869–875. [Google Scholar] [CrossRef]
  25. Tian, Q.; Wang, G.; Zhao, Y.; Li, J.; Wang, Q. Precipitation behaviors of TiN inclusion in GCr15 bearing steel billet. Met. Mater. Trans. B 2018, 49, 1149–1164. [Google Scholar] [CrossRef]
  26. Liu, Y.; Zhang, L.F.; Duan, H.J.; Zhang, Y.; Luo, Y.; Conejo, A.N. Extraction, thermodynamic analysis, and precipitation mechanism of MnS-TiN complex inclusions in low-sulfur steels. Metall. Mater. Trans. A 2016, 47, 3015–3025. [Google Scholar] [CrossRef]
  27. Wang, L.; Xue, Z.-L.; Zhu, H.; Lei, J.-L. Thermodynamic analysis of precipitation behavior of Ti-bearing inclusions in SWRH 92A tire cord steel. Results Phys. 2019, 14, 102428. [Google Scholar] [CrossRef]
  28. Li, N.; Wang, L.; Xue, Z.L.; Li, C.Z.; Huang, A.; Wang, F.F. Study of precipitation and growth processes of Ti-bearing inclusions in tire cord steel. Results Phys. 2020, 16, 102929. [Google Scholar] [CrossRef]
  29. Jang, J.H.; Lee, C.-H.; Han, H.N.; Bhadeshia, H.K.D.H.; Suh, D.-W. Modelling coarsening behaviour of TiC precipitates in high strength, low alloy steels. Mater. Sci. Technol. 2013, 29, 1074–1079. [Google Scholar] [CrossRef]
  30. Ma, W.-J.; Bao, Y.-P.; Zhao, L.-H.; Wang, M. Control of the precipitation of TiN inclusions in gear steels. Int. J. Miner. Metall. Mater. 2014, 21, 234–239. [Google Scholar] [CrossRef]
Figure 1. (a) Schematic of tensile specimen of steel plate. (b) Tensile fracture specimens.
Metals 12 00363 g001
Figure 2. Tensile properties of steel plate: (a) Engineering strain–stress curves along the transverse direction, (b) engineering strain–stress curves along the longitudinal direction, (c) YS and UTS on the transverse direction, and (d) YS and UTS on the longitudinal direction.
Metals 12 00363 g002
Figure 3. SEM and TEM images of NM550 Steel: (a) Secondary electron image of SEM and (b) bright-field image of TEM.
Metals 12 00363 g003
Figure 4. Optical microscopy images and size distribution of the TiN inclusions. (a) 1/4 thickness, (b) 1/2 thickness, and (c) size distribution of the TiN.
Metals 12 00363 g004
Figure 5. Secondary electron images of SEM of the top view of the macromorphology of fracture surface in the longitudinal tensile sample: (a) 1/4 thickness, (b) 1/2 thickness, and (c) 3/4 thickness.
Metals 12 00363 g005aMetals 12 00363 g005b
Figure 6. Secondary electron images of SEM of the fiber zone in the longitudinal tensile samples: (ac) the fracture morphologies of 1/4 thickness, 1/2 thickness, and 3/4 thickness samples, respectively, (d) the secondary crack in the fiber zone of the 3/4 thickness sample, and (e,f) TiN inclusions and EDS spectra in the fiber zone of the 3/4 thickness sample.
Metals 12 00363 g006aMetals 12 00363 g006b
Figure 7. Secondary electron images of SEM of the shear lip zone in the longitudinal tensile samples: (a,b) TiN and TiC near the tear ridge in the 1/2 thickness samples, (c) EDS of TiN inclusion in (a), and (d) EDS of TiC inclusion in (b).
Metals 12 00363 g007aMetals 12 00363 g007b
Figure 8. Secondary electron images of SEM of the inclusions at different distances from the tensile fracture surface: (a) TiN far away from the tensile fracture, (b) TiN slightly away from the tensile fracture surface; (c,d) TiN near the fracture surface, (e) TiC far away from the tensile fracture, (f) TiC near the fracture surface, and (g,h) the energy-dispersive spectrums of the inclusions.
Metals 12 00363 g008
Figure 9. Schematic of the microcrack growth behavior of TiN and TiC when subjected to tensile stress. (a) TiN inclusions and (b) TiC inclusions.
Metals 12 00363 g009
Figure 10. Thermodynamic analysis of TiN and TiC: (a) Relationship between kTiN and QTiN of TiN inclusion and fs, (b) relationship between kTiC and QTiC of TiC inclusion and fs, (c) relationship between TiC precipitation temperature and Ti content, (d) variation of the TiN radius (R) with RC, (e) variation of R with N content, and (f) variation of R with Ti content.
Metals 12 00363 g010
Table 1. Chemical compositions of NM550 wear-resistant steel (mass%).
CMnPSSiNiCrMoAlBVTiNbNFe
0.301.030.0060.00040.780.520.490.360.0310.00110.00680.0160.0100.0042Bal.
Table 2. Yield strength, ultimate tensile strength, reductions of area, and elongations of transverse and longitudinal tensile samples.
LocationDirectionYield Strength
(MPa)
Ultimate Tensile Strength
(MPa)
Reduction of Area
(%)
Elongation
(%)
1/4Transverse1427175646.411.4
Longitudinal1421177952.812.1
1/2Transverse1446177335.19.6
Longitudinal1367180548.911.9
3/4Transverse1428179345.612.5
Longitudinal1393178649.311.5
Publisher’s Note: MDPI stays neutral with regard to jurisdictional claims in published maps and institutional affiliations.

