Article

The Effect of Free Volume on the Crystallization of Al87Ni8Gd5 Amorphous Alloy

Institute of Solid State Physics RAS, 142432 Chernogolovka, Russia
*
Author to whom correspondence should be addressed.
Metals 2022, 12(2), 332; https://doi.org/10.3390/met12020332
Submission received: 28 December 2021 / Revised: 25 January 2022 / Accepted: 11 February 2022 / Published: 14 February 2022
(This article belongs to the Special Issue Research on Metallic Glasses)

Abstract

:
The effect of free volume on the process of crystallization of an Al87Ni8Gd5 amorphous alloy is investigated. The deformation of the amorphous alloys leads to the formation of shear bands, which contain an enhanced free volume concentration. To retain the free volume the amorphous alloy was coated with a layer of a refractory metal. The structure of the Al87Ni8Gd5 alloy with a protective Ta coating was studied by X-ray diffraction and transmission electron microscopy methods. The fraction of the nanocrystalline phase formed in the amorphous samples with a protective Ta coating under annealing was found to be larger than that in the uncoated samples. The size of Al nanocrystals formed in the coated and uncoated samples is the same. A higher rate of crystal nucleation in the deformed amorphous samples with a protective coating is caused by a higher diffusion coefficient due to an enhanced free volume concentration.

1. Introduction

Amorphous–nanocrystalline alloys are materials with unique physical and chemical properties [1,2,3]. The properties of these materials depend on both chemical and phase compositions and a number of structural parameters, such as the morphology and size of nanocrystals, the fraction of the crystalline phase, and the localization of nanocrystals. In an amorphous–nanocrystalline structure formed during heat treatment, nanocrystals are usually randomly oriented and uniformly distributed over the sample. If a nanocrystalline structure is formed during deformation, the formation of nanocrystals begins in deformation bands (shear bands) and their vicinity [4,5,6,7]. Today, much work is devoted to the study of shear bands in amorphous materials [8,9,10,11] and changes in the structure in shear bands [12]. According to different data, the width of shear bands can range from 5–30 nm [9,13] to hundreds of nanometers (10–210 nm [12]), and the density of the amorphous phase in a shear band can decrease by 1–12% [12]. No obvious correlation between a shear band and a change in the density (free volume concentration) is observed. However, greater changes in the density usually correspond to thicker shear bands. Investigations showed that there was a local region around shear bands in which deformation resulted in significantly larger atomic displacements than those in the surrounding matrix and in an enhanced free volume concentration. This region was called the shear transformation zone (STZ) [9,14].
As mentioned above, the process of amorphous alloy crystallization under the action of deformation usually begins in shear bands and their vicinity. When analyzing nanocrystal nucleation in shear bands, the emergence of nanocrystals in these places is generally explained by two possible mechanisms: (1) a local strong but short-term (~30 ps) increase in the temperature [15,16] and (2) a decrease in the material density (an increase in the free volume fraction) in the shear band [17,18,19]. Both an increase in the temperature and an increase in the free volume fraction result in a significant increase in the diffusion coefficient, which inevitably leads to an increase in the rates of crystal nucleation and growth, i.e., to the acceleration of crystallization in these regions. An increase in the diffusion rate in a shear band is very significant and can reach 3 × 10⁻²⁴ m2/s at room temperature [20]. The data available in the literature support both explanations. For instance, in [15], the melting of a thin Sn coating on the surface of Zr41.2Ti13.8Cu12.5Ni10Be22.5 amorphous alloy was observed in places where shear bands migrated to the deformed sample surface. On the other hand, the acceleration of diffusion due to increased free volume was demonstrated in [21,22,23]. Shear bands that contained only the amorphous phase after the completion of the deformation process were then filled with nanocrystals, which were formed at room temperature [6,23]. Since, in the latter case, the sample was at room temperature during aging, the crystallization process could be caused only by an increase in the parameters of mass transfer in a less dense structure in the region of a shear band, i.e., by a higher concentration of free volume.
Amorphous alloys produced by rapid melt quenching are not at equilibrium; their density is 2–5% lower than that of the corresponding crystalline materials. Annealing at temperatures below the crystallization temperature leads to structural relaxation, accompanied by a 2–3% decrease in the free volume [24,25] and an increase in the density. Plastic deformation leads to an increase in the free volume, and the value of this increase can be significant in some places (the change in the density in shear bands is from 1% to 12% [12]). The amount of free volume in a sample changes its properties. A decrease in the free volume concentration (under amorphous phase relaxation) leads to a change in the properties of amorphous alloys, such as an increase in the brittleness. To estimate the effect of free volume on the crystallization process, it is necessary to create conditions that maintain its concentration in a sample and, in particular, hinder its migration to the sample surface by diffusion. This can be realized by creating coatings on the surface that hinder the migration of free volume. The ability of such a coating to hinder the migration of the free volume of a sample was demonstrated in [26]. The authors of [26] showed that the deposition of a crystalline coating (tungsten) onto the surface of Zr50.7Cu28Ni9Al12.3 amorphous alloy allowed most of the free volume to be maintained. The estimates made in their work demonstrate that the migration of free volume from the amorphous phase to crystalline W is thermodynamically unfavorable. This idea of maintaining free volume due to the deposition of a protective coating was used in the present work to study the effect of free volume on the crystallization of Al87Ni8Gd5 amorphous alloy subjected to plastic deformation. As noted above, under the deformation of amorphous alloys, shear bands are formed that contain an enhanced free volume concentration, with the total free volume concentration increasing.

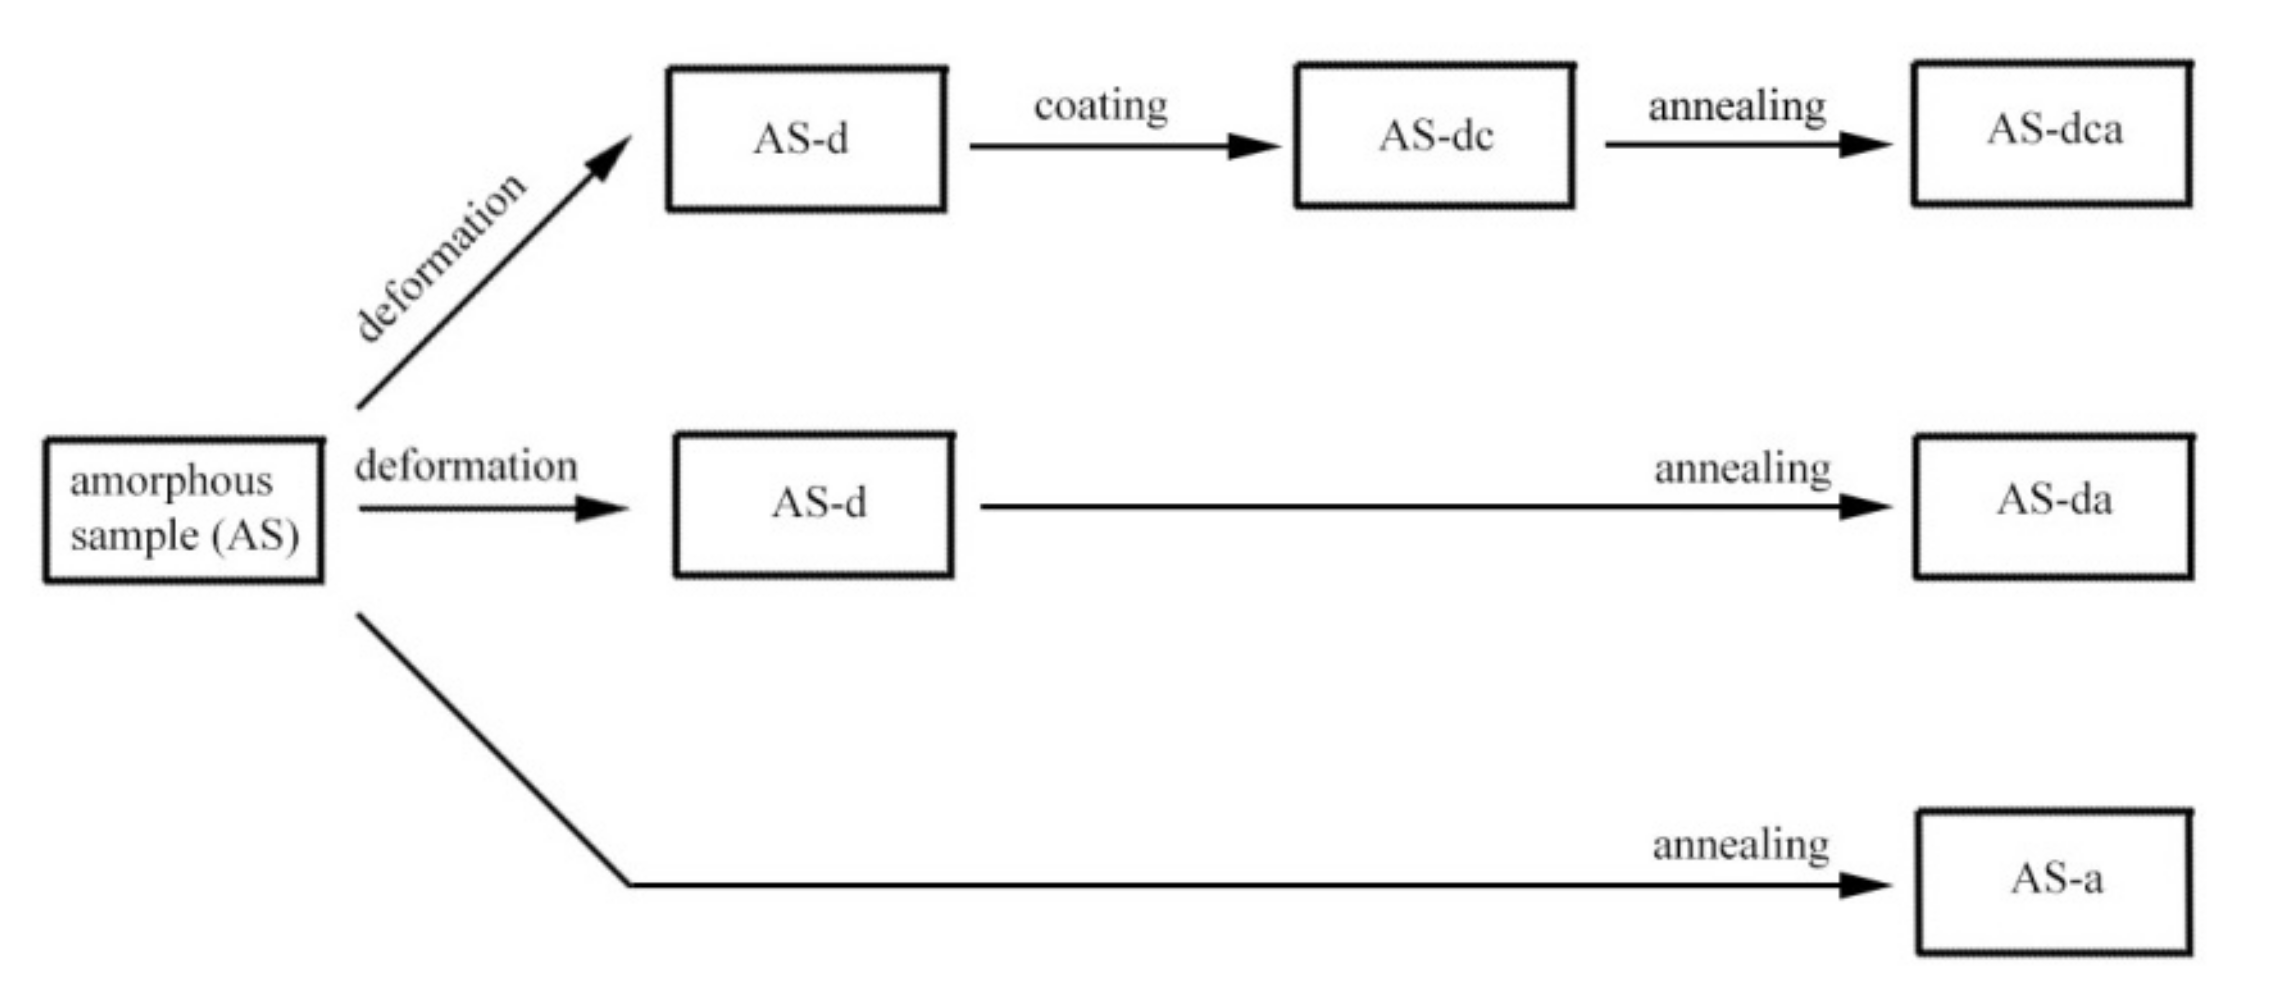
2. Materials and Methods

Al87Ni8Gd5 amorphous alloy was produced by rapid melt quenching on a fast-spinning disk in a helium atmosphere in the form of ribbons with a thickness of about 50 μm and a width of ~15 mm. Alloy ingots with nominal Al87Ni8Gd5 composition were prepared by arc melting under purified argon from elemental Al (99.99%), Ni (99.9%), and Al3Gd compound (Gd 99.7%), preliminarily prepared as a master alloy under similar conditions. The cooling rate was about 106 K/s. The chemical compositions of the master alloy and the melt-spun ribbon were analyzed by energy-dispersive X-ray analysis. The initial and deformed samples were annealed in a resistance furnace. The samples were deformed in a VEB Schwermaschinenbau four-roll mill by using the multiple rolling technique with a run number of 50–150. The strain value was calculated by the formula ε = Δh/h0, where h0 and Δh are the original thickness and its deformation-induced change, respectively. To maintain free volume inside the deformed samples, a Ta coating was sputtered onto both sides of the deformed ribbon. The coating was deposited by cathode sputtering, and its thickness was about 100 nm. The quality of the coating was monitored using scanning electron microscopy.
The structure of the samples was investigated by X-ray diffraction, differential scanning calorimetry, and scanning and transmission electron microscopy. For X-ray diffraction experiments, Co Kα and CuKα radiation were used. To perform the X-ray diffraction studies, special substrates that do not produce intrinsic reflections were used [27]. At the early crystallization stages, the samples contained amorphous and nanocrystalline phases; therefore, separation of the overlapped peaks was performed. The size of the formed nanocrystals was determined from X-ray diffraction data.

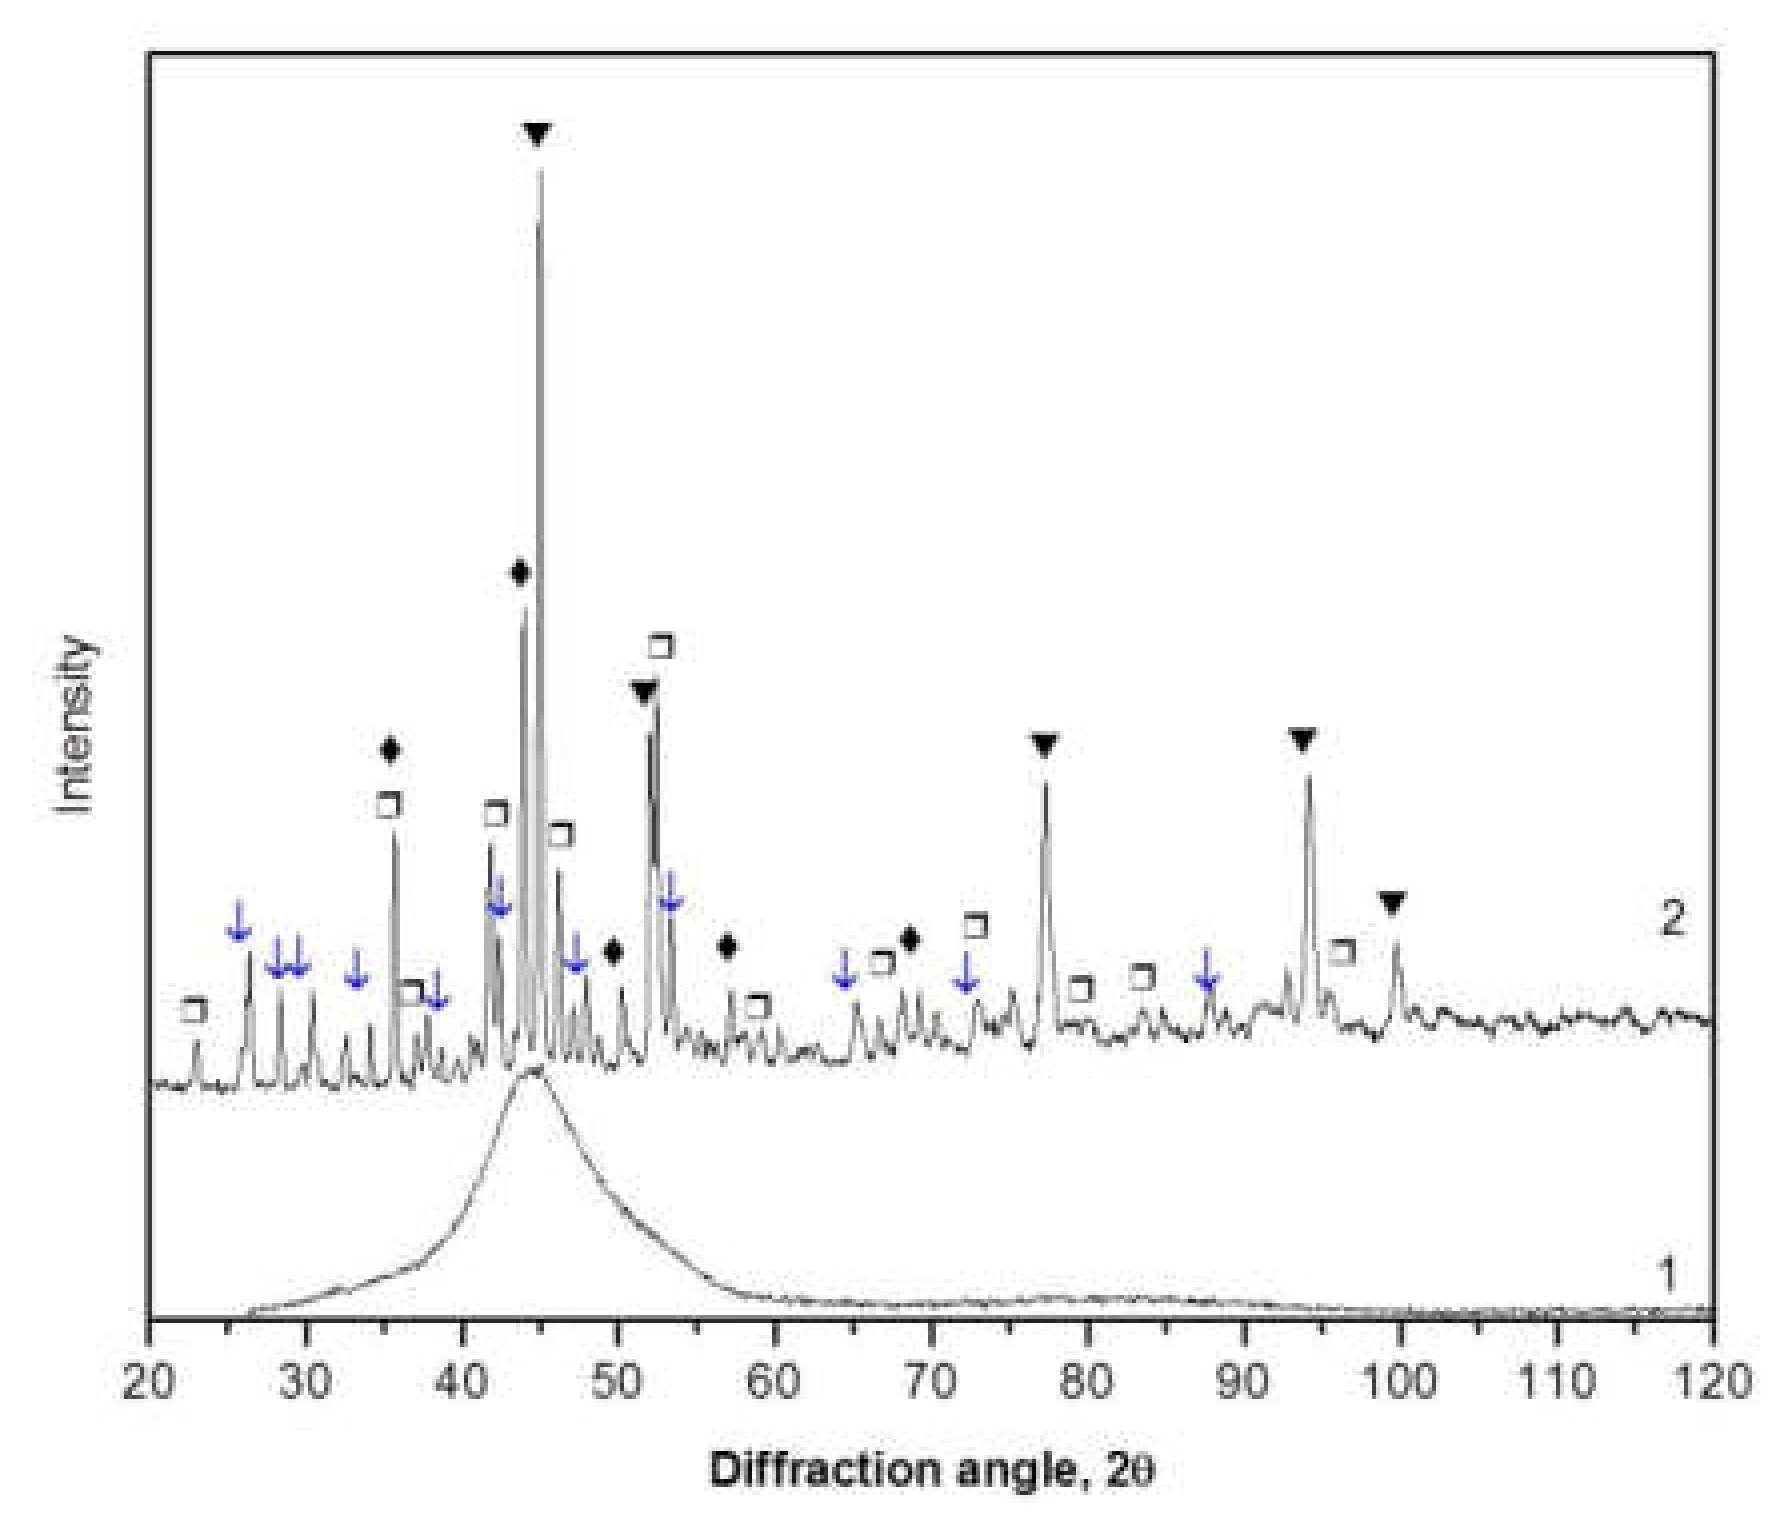
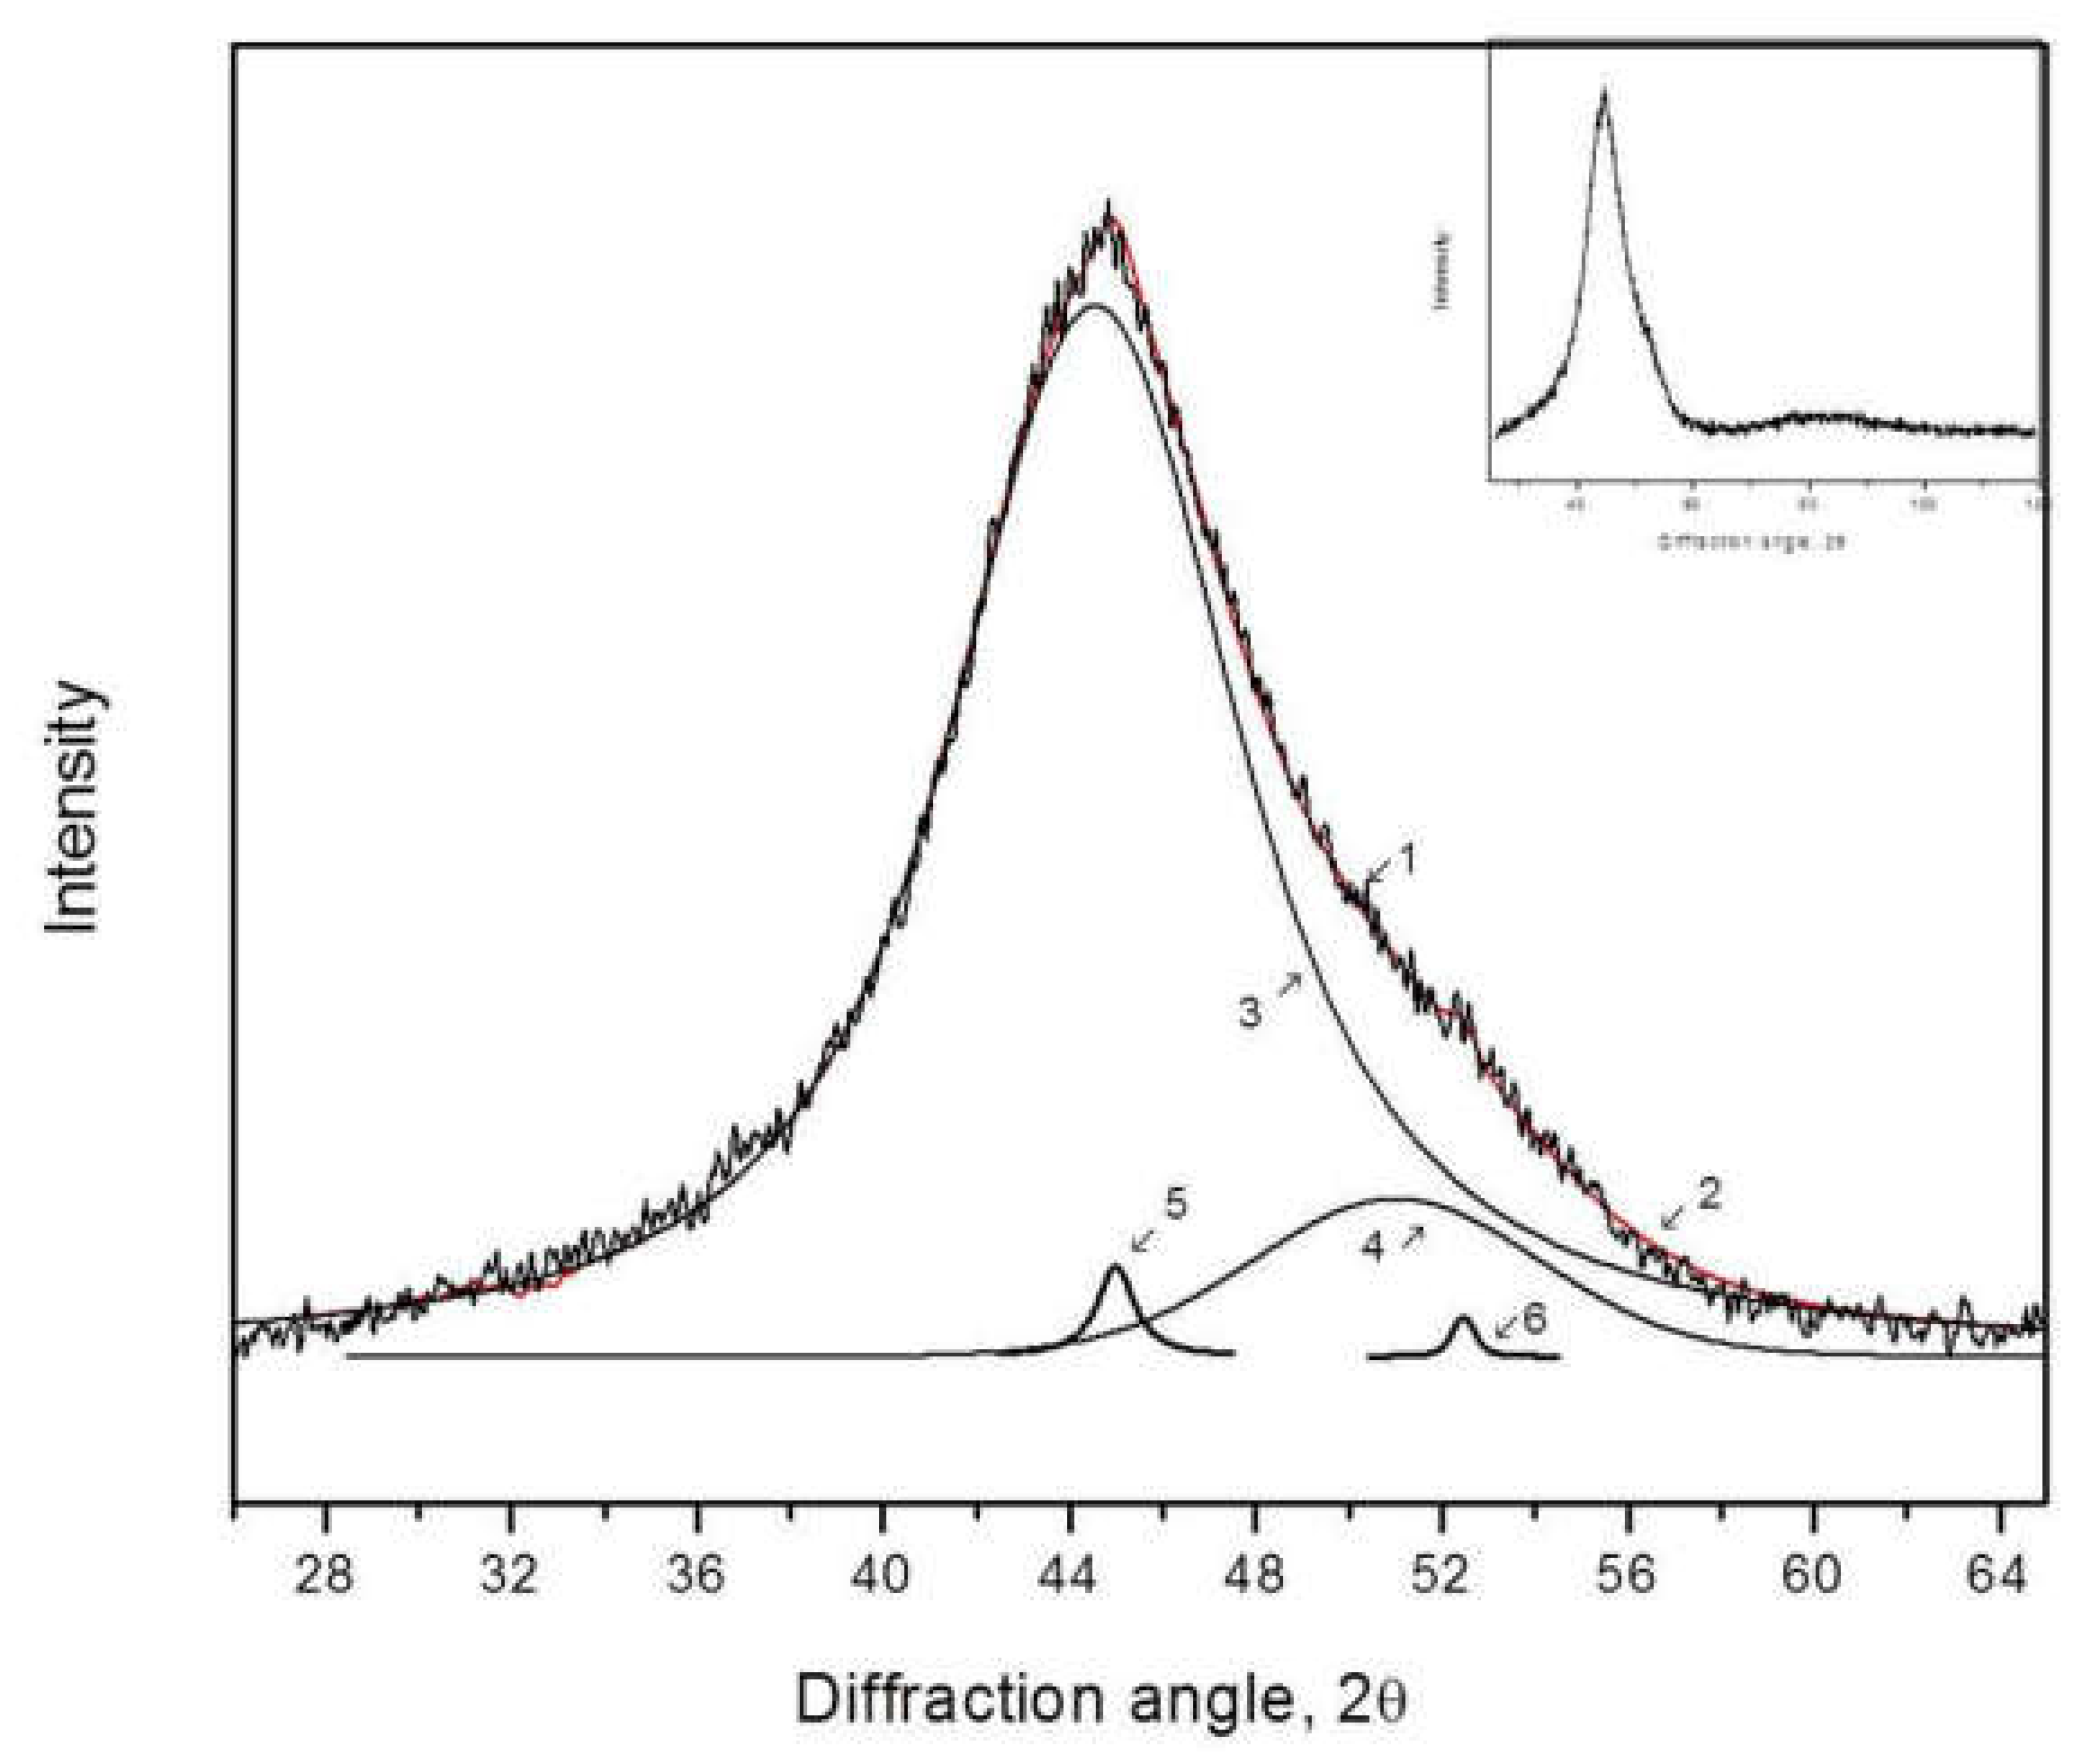
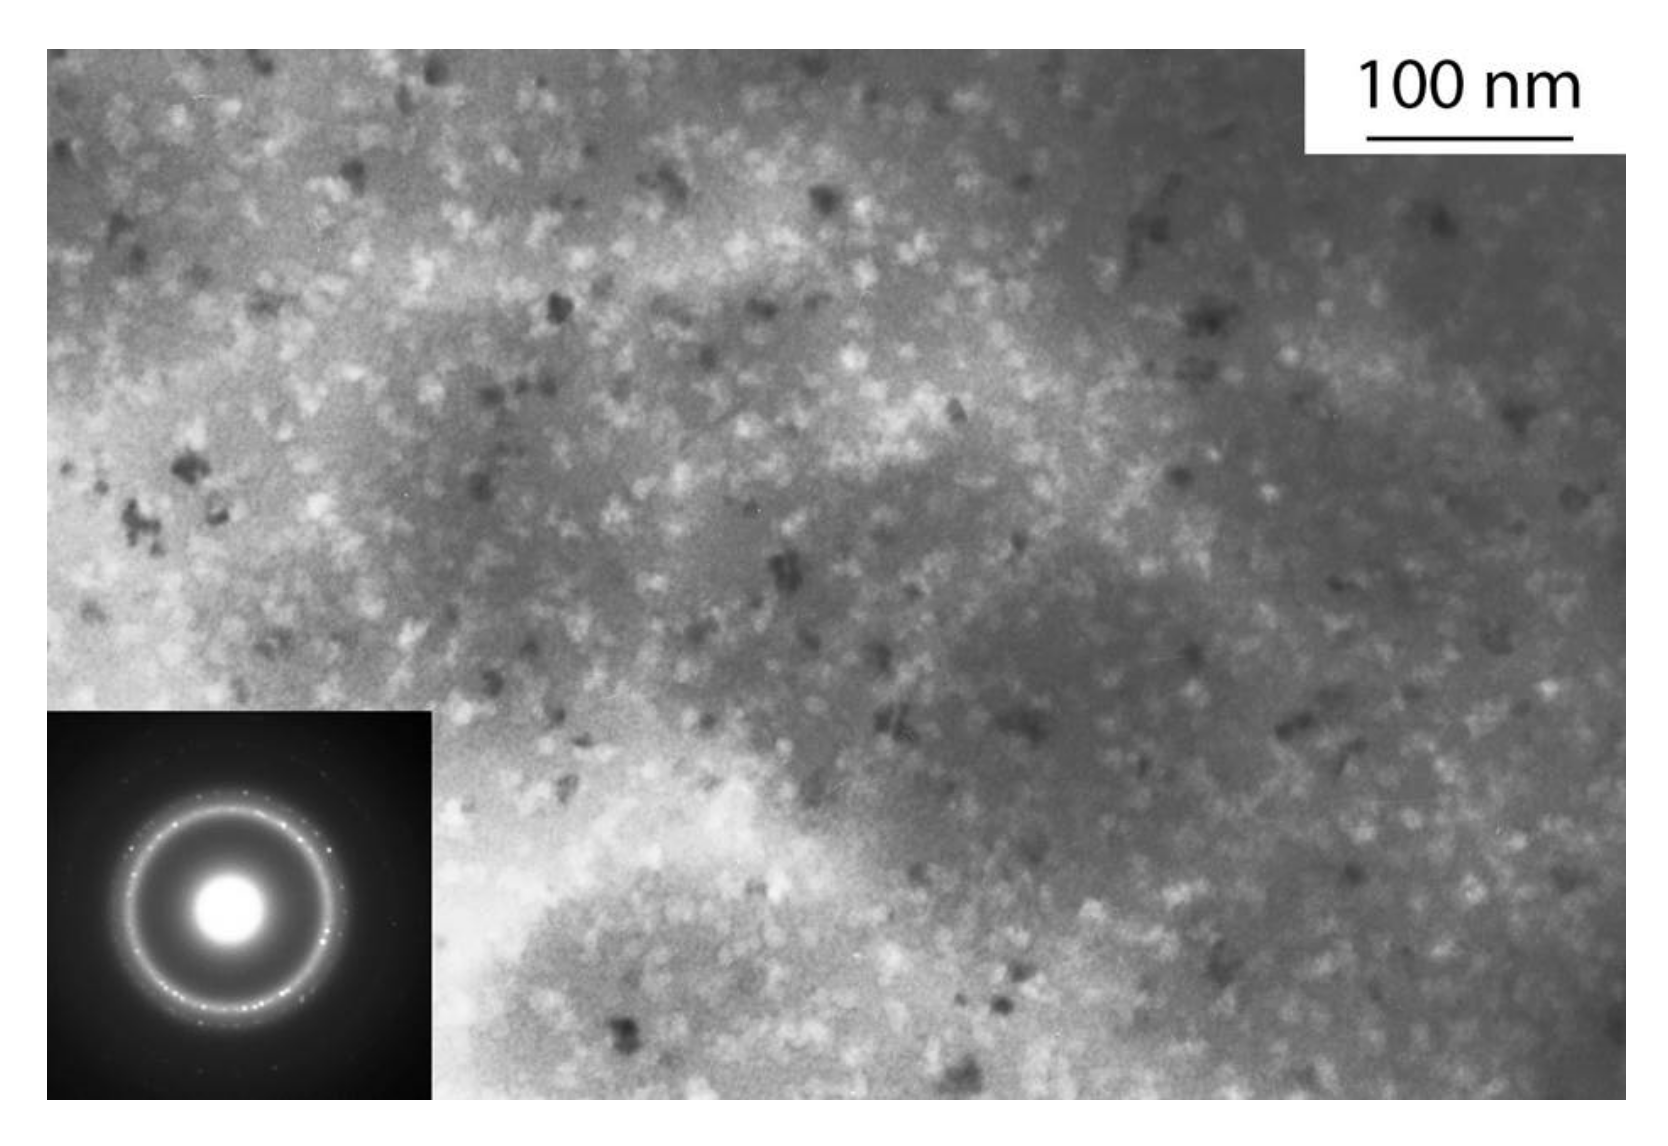
3. Results and Discussion

The quenched ribbons of Al87Ni8Gd5 amorphous alloy were amorphous; no signs of crystalline phases were observed in the X-ray diffraction patterns and electron diffraction patterns. Figure 1 depicts the scheme of sample treatment. The samples were subjected to multiple rolling deformation (AS-d, Figure 1), and the deformation level was 40–75%. A Ta coating (AS-dc) was deposited onto the deformed samples, after which the samples were subjected to isothermal annealing at different temperatures and heating at a constant rate. The annealing duration was 1–4 h, and the temperature was 423–453 K. In each heat treatment, all samples (initial, deformed, and deformed with a protective coating) were annealed simultaneously.
AS-d denotes deformed samples, AS-dс denotes deformed samples with a protective coating, and AS-dca, AS-da, and AS-a denote annealed coated samples after deformation, deformed samples, and initial samples, respectively.
Figure 2 shows DSC curves of the samples immediately after quenching (1), after deformation (2), and after deformation and deposition of a protective coating (3). For illustration purposes, the curves are shifted along the y-axis. Within the accuracy of measurements, no significant difference in the behavior under heating was revealed.
The DSC curve has three peaks corresponding to three stages of crystallization. The temperature of the first stage of crystallization is 487 K (the temperature of the beginning of the transformation is 474 K); the temperatures of the second and third stages of crystallization are 606 K and 635 K, respectively. The thermal effects of crystallization are 26.2 J/g, 39.0 J/g, and 53.5 J/g for the first, second, and third stages, respectively. In the first stage of crystallization, Al nanocrystals precipitate in the amorphous phase. Since neither Ni nor Gd dissolves in the aluminum lattice, these nanocrystals are one-component. In the second stage of crystallization at 606 K, the formation of Al4NiY-type crystals begins; the structure of the samples consists of Al nanocrystals and an Al4NiY-type phase, and the chemical composition of the remaining amorphous matrix changes. After the third stage, completely crystalline samples contain Al, Al3Ni, and Al2Gd crystals and an Al4NiY-type phase. Figure 3 illustrates an X-ray diffraction pattern of the sample after heating to 773 K in a calorimeter.
Figure 4 and Figure 5 show X-ray diffraction patterns of the annealed samples after deformation of 40% (Figure 4) and the same sample with a protective Ta layer (Figure 5). Figure 4 and Figure 5 demonstrate the region of the main diffusion maximum from the amorphous phase; the insets show full X-ray diffraction patterns. One can see that after annealing, the sample of the deformed alloy without a Ta coating remains amorphous. In Figure 4, curve 1 is an experimental curve, curves 3 and 4 correspond to the amorphous phases with different radii of the first coordination sphere, and curve 2 (red) is a summation curve (curve 3 + curve 4). In the system under study, Gd is the largest atom (the radii of Al, Ni, and Gd atoms are 1.431, 1.246, and 1.802 Å, respectively). Therefore, the first coordination sphere of the amorphous phase enriched with this element has a larger radius (curve 3). The amorphous phase with a smaller radius of the first coordination sphere (curve 4) is depleted of Gd. The formation of this structure after heat or deformation treatment in alloys of an Al-TM-RE system (TM is a transition metal, and RE is a rare-earth metal) has been observed many times [28,29,30]. In [31], more free volume was present near the largest atoms (Gd in our case); therefore, the Gd-rich regions should be represented as regions of free volume segregation.
The structure of the deformed sample with a protective Ta layer after the same annealing becomes more complex, and, in addition to the heterogeneous amorphous phase, it contains a small number of nanocrystals. As in the previous case, in Figure 5, curve 1 is an experimental curve, and curves 3 and 4 correspond to amorphous phases with different radii of the first coordination sphere. Curves 5 and 6 are (111) and (200) reflections from Al nanocrystals, respectively, and summation curve 2 (red) contains four curves (3–6). The size of the nanocrystals, determined using the Scherrer equation [32], is about 5 nm; the number of nanocrystals is small.
Thus, after annealing at 428 K, the amorphous phase in both samples is heterogeneous; a small number of nanocrystals are also present in the samples with a protective coating. The positions of (111) and (200) reflections in Figure 5 correspond exactly to those of reflections from fcc Al. As noted above, neither Ni nor Gd dissolves in the Al lattice [33]; therefore, the formation of Al nanocrystals is natural. The crystallization of amorphous alloys of Al-TM-RE systems usually begins with the precipitation of Al nanocrystals.
A typical picture of the structure of a partially crystalline Al87Ni8Gd5 alloy is demonstrated in Figure 6. This figure shows an electron microscope image of the sample heated to the temperature corresponding to the first DSC peak (before the completion of the first crystallization stage). In the figure, one can clearly see Al nanocrystals in the amorphous matrix.
With an increase in the annealing duration, the number of nanocrystals increases. Figure 7 illustrates X-ray diffraction patterns of the alloy with a protective coating annealed for 1 h and 4 h. With an increase in the deformation level, the number of the formed nanocrystals increases.
Figure 8 and Figure 9 show X-ray diffraction patterns of the samples, the deformation of which was 50%. In addition to scattering from the amorphous phase (curves 3 and 4), Al (111) reflection (curve 5) is present in the X-ray diffraction pattern. In the annealed sample with a protective Ta layer, the number of nanocrystals is greater (Figure 9). The size of the nanocrystals is the same in both samples. The analysis of the integral intensities demonstrated that the fraction of nanocrystals in the sample with Ta is about 1.6 times greater than that in the samples without a protective coating, whereas the nanocrystal size is the same and is ~7 nm. An increase in the annealing temperature, of course, leads to an increase in the nanocrystal fraction. Figure 10 illustrates an X-ray diffraction pattern of the sample with Ta deformed by 50% after 1 h annealing at 453 K. One can clearly see that the intensity of the reflections corresponding to nanocrystals (curves 5 and 6) significantly increased.
Thus, the number of nanocrystals formed in the deformed coated samples becomes greater than that in the corresponding uncoated samples. The size of the nanocrystals in the coated and uncoated samples is the same. The observed difference in the number of the formed crystals with similar average size may be caused by an increase in the rate of crystal nucleation in the samples with an enhanced free volume concentration. The samples that we investigated were subjected to plastic deformation, which led to an increase in the free volume concentration. Immediately after the deformation, the coating was deposited onto both ribbon surfaces. As was shown in [26], the deposition of a protective coating allows one to prevent the migration of free volume to the sample surface. In the samples with a protective coating, the possibility of the migration of free volume to the sample surface became extremely limited; i.e., the concentration of free volume was higher.
This aspect is very important since, with an increasing temperature, the processes of structural relaxation take place in amorphous alloys even before the onset of crystallization. During structural relaxation, free volume usually annihilates on the surfaces. If a protective crystalline layer is present on the surface, this process is hindered. In this case, free volume moving to the surface (emerging from an amorphous alloy in the absence of a protective coating) should form quasi-vacancies, which, in turn, can migrate to the Ta layer surface. For this process to take place, the energy of vacancy formation in a crystalline layer must be lower than that of the formation of an elementary carrier of free volume in the amorphous phase. Since the atomic packing in an amorphous structure is less dense than that in a crystalline structure, correspondingly, the energy of the formation of a vacancy analog in an amorphous alloy will be lower. In [26], an approach is described that allows estimating the efficiency of a barrier made of a material in the form of a surface layer for the migration of free volume to the surface. The approach proposed in [26] is based on the comparison of the energy of vacancy formation in different crystalline materials. Our estimates based on this approach showed that the weighted mean energy of vacancy formation for Al87Ni8Gd5 crystalline alloy is about 1.35 × 1029 eV/m3, whereas for Ta, this value is significantly greater and is 2.72 × 1029 eV/m3. This means that tantalum is an effective barrier for the migration of free volume of Al87Ni8Gd5 amorphous alloy to the surface, providing an enhanced free volume concentration in the coated amorphous alloy.
It is known that the number of nanocrystals formed in deformed amorphous alloys depends on the conditions under which they are generated and grow [34,35]. From the results obtained, it follows that in the case when regions with an increased concentration of free volume are preserved in the amorphous phase (regions with an increased value of the diffusion coefficient), the formation of nanocrystals is facilitated, and under the same heat treatment conditions, the number of nanocrystals is greater. The properties of amorphous nanocrystalline materials depend on the size of the nanocrystals and the proportion of the crystalline component [36]. Restricting the possibility of free volume reaching the sample surface makes it possible to develop principles for the preparation of amorphous–nanocrystalline materials with different structural parameters.
Thus, the obtained results show that using protective coatings makes it possible to obtain partially crystalline materials with a larger number of nanocrystals. This shows the possibility of developing nanomaterials with different contents of the crystalline phase and, as a result, with different physicochemical properties.

4. Conclusions

It is shown that the fraction of the nanocrystalline phase formed in the samples of Al87Ni8Gd5 amorphous alloy with a protective Ta coating under annealing is larger than that in the uncoated samples. The size of Al nanocrystals formed in the coated and uncoated samples is the same.
A higher rate of crystal nucleation in the deformed amorphous samples with a protective coating is caused by an enhanced diffusion coefficient, which corresponds to a material with an enhanced free volume concentration.

Author Contributions

Conceptualization, G.A. and A.A.; investigation, G.A., V.C., E.P., N.V., I.S. and A.A.; methodology, I.S. and A.A.; writing—original draft, E.P.; writing—review and editing, G.A. and A.A. All authors analyzed the data, discussed the results, and wrote the paper. All authors have read and agreed to the published version of the manuscript.

Funding

Russian Academy of Science.

Data Availability Statement

Not applicated.

Acknowledgments

The work was supported by the state task of ISSP RAS.

Conflicts of Interest

The authors declare no conflict of interest.

References

  1. Inoue, A.; Ochiai, T.; Horio, Y.; Masumoto, T. Formation and mechanical properties of amorphous Al-Ni-Nd alloys. Mater. Sci. Eng. 1994, A179, 649. [Google Scholar] [CrossRef]
  2. Ashby, M.F.; Greer, A. Metallic glasses as structural materials. Scr. Mater. 2004, 54, 321. [Google Scholar] [CrossRef]
  3. Trexler, M.M.; Thadhani, N.N. Mechanical properties of bulk metallic glasses. Prog. Mater. Sci. 2010, 55, 759. [Google Scholar] [CrossRef]
  4. Boucharat, N.; Hebert, R.; Rösner, H.; Valiev, R.; Wilde, G. Nanocrystallization of amorphous Al88Y7Fe5 alloy induced by plastic deformation. Scr. Mater. 2005, 53, 823–828. [Google Scholar] [CrossRef]
  5. Kovacs, Z.; Henits, P.; Zhilyaev, A.P.; Revesz, A. Deformation induced primary crystallization in a thermally non-primary crystallizing amorphous Al85Ce8Ni5Co2 alloy. Scr. Mater. 2006, 54, 1733–1737. [Google Scholar] [CrossRef]
  6. Abrosimova, G.; Aronin, A.; Barkalov, O.; Matveev, D.; Rybchenko, O.; Maslov, V.; Tkatch, V. Structural transformations in the Al85Ni6.1Co2Gd6Si0.9 amorphous alloy during multiple rolling. Phys. Solid State 2011, 53, 229–233. [Google Scholar] [CrossRef]
  7. Schmidt, V.; Rösner, H.; Peterlechler, M.; Wilde, G. Quantitative Measurement of Density in a Shear Band of Metallic Glass Monitored Along its Propagation Direction. Phys. Rev. Lett. 2015, 115, 035501. [Google Scholar] [CrossRef]
  8. Chen, Y.M.; Ohkubo, T.; Mukai, T.; Hono, K. Structure of shear bands in Pd40Ni40P20 bulk metallic glass. J. Mater. Res. 2009, 24, 1. [Google Scholar] [CrossRef]
  9. Greer, A.L.; Cheng, Y.Q.; Ma, E. Shear bands in metallic glasses. Mater. Sci. Eng. R 2013, 74, 71–132. [Google Scholar] [CrossRef]
  10. Jiang, W.H.; Atzmon, M. Mechanically-assisted nanocrystallization and defects in amorphous alloys: A high-resolution transmission electron microscopy study. Scr. Mater. 2006, 54, 333. [Google Scholar] [CrossRef]
  11. He, J.; Kaban, I.; Mattern, N.; Song, K.; Sun, B.; Zhao, J.; Kim, D.H.; Eckert, J.; Greer, A.L. Local microstructure evolution at shear bands in metallic glasses with nanoscale phase separation. Sci. Rep. 2016, 6, 25832. [Google Scholar] [CrossRef] [PubMed]
  12. Liu, C.; Roddatis, V.; Kenesei, P.; Maaß, R. Shear-band thickness and shear-band cavities in a Zr-based metallic glass. Acta Mater. 2017, 140, 206–216. [Google Scholar] [CrossRef]
  13. Hassanpour, A.; Vaidya, M.; Divinski, S.V.; Wilde, G. Impact of cryogenic cycling on tracer diffusion in plastically deformed Pd40Ni40P20 bulk metallic glass. Acta Mater. 2021, 209, 116785. [Google Scholar] [CrossRef]
  14. Falk, M.L.; Langer, J.S. Dynamics of viscoplastic deformation in amorphous solids. Phys. Rev. E 1998, 57, 7192–7205. [Google Scholar] [CrossRef] [Green Version]
  15. Lewandowski, J.J.; Greer, A.L. Temperature rise at shear bands in metallic glasses. Nat. Mater. 2006, 5, 15–18. [Google Scholar] [CrossRef]
  16. Georgarakis, K.; Aljerf, M.; Li, Y.; LeMoulec, A.; Charlot, F.; Yavari, A.R.; Chornokhvostenko, K.; Tabachnikova, E.; Evangelakis, G.A.; Miracle, D.B.; et al. Shear band melting and serrated flow in metallic glasses. App. Phys. Lett. 2008, 93, 031907. [Google Scholar] [CrossRef]
  17. Jiang, W.H.; Atzmon, M. The effect of compression and tension on shear-band structure and nanocrystallization in amorphous Al90Fe5Gd5: A high-resolution transmission electron microscopy study. Acta Mater. 2003, 51, 4095–4105. [Google Scholar] [CrossRef]
  18. Rösner, H.; Peterlechler, M.; Kűbel, C.; Schmidt, V.; Wilde, G. Density changes in shear bands of a metallic glass determined by correlative analytical transmission electron microscopy. Ultramicroscopy 2014, 142, 1–9. [Google Scholar] [CrossRef]
  19. Klaumünzer, D.; Lazarev, A.; Maaß, R.; Dalla Torre, F.H.; Vinogradov, A.; Löffler, J.F. Probing Shear-Band Initiation in Metallic Glasses. Phys. Rev. Lett. 2011, 107, 185502. [Google Scholar] [CrossRef]
  20. Aronin, A.S.; Louzguine-Luzgin, D.V. On nanovoids formation in shear bands of an amorphous Al-based alloy. Mech. Mater. 2017, 113, 19–23. [Google Scholar] [CrossRef]
  21. Wang, K.; Fujita, T.; Zeng, Y.Q.; Nishiyama, N.; Inoue, A.; Chen, M.W. Micromechanisms of serrated flow in a Ni50Pd30P20 bulk metallic glass with a large compression plasticity. Acta Mater. 2008, 56, 2834–2842. [Google Scholar] [CrossRef]
  22. Hebert, R.J.; Boucharat, N.; Perepezko, J.H.; Rösner, H.; Wilde, G. Calorimetric and microstructural analysis of deformation induced crystallization reactions in amorphous Al88Y7Fe5 alloy. J. Alloys Compd. 2007, 434, 18–21. [Google Scholar] [CrossRef]
  23. Wilde, G.; Rösner, H. Nanocrystallization in a shear band: An in situ investigation. Appl. Phys. Lett. 2011, 98, 251904. [Google Scholar] [CrossRef]
  24. Scott, M.G.; Kursumovic, A. Short-range ordering during structural relaxation of the metallic glass Fe40Ni40B20. Acta Metall. 1982, 30, 853. [Google Scholar] [CrossRef]
  25. Egami, T. Structural relaxation in amorphous alloys—Compositional short range ordering. Mater. Res. Bull. 1978, 13, 557. [Google Scholar] [CrossRef]
  26. Chen, Z.Q.; Huang, L.; Wang, F.; Huang, P.; Lu, T.J.; Xu, K.W. Suppression of annealing-induced embrittlement in bulk metallic glass by surface crystalline coating. Mater. Des. 2016, 109, 179–185. [Google Scholar] [CrossRef]
  27. Abrosimova, G.E.; Shmytko, I.M. The use of single-crystal cuvettes with the properties of an optical shutter in X-ray diffractometers, Industrial laboratory. Diagn. Mater. 2018, 84, 34–37. [Google Scholar] [CrossRef]
  28. Inoue, A.; Yamamoto, M.; Kimura, H.M.; Masomoto, T. Ductile aluminum-based amorphous alloys with two separated phases. J. Mater. Sci. Lett. 1987, 6, 194–196. [Google Scholar] [CrossRef]
  29. Abrosimova, G.; Aronin, A.; Budchenko, A. Amorphous phase decomposition in Al-Ni–RE system alloys. Mater. Lett. 2015, 139, 194–196. [Google Scholar] [CrossRef]
  30. Abrosimova, G.; Aronin, A. On decomposition of amorphous phase in metallic glasses. Rev. Adv. Mater. Sci. 2017, 50, 55–61. Available online: http://www.ipme.ru/e-journals/RAMS/no_15017/07_15017_abrosimova.pdf (accessed on 21 December 2021).
  31. Sun, Y.J.; Qu, D.D.; Huang, Y.J.; Liss, K.D.; Wei, X.S.; Xing, D.W.; Shen, J. Zr–Cu–Ni–Al bulk metallic glasses with superhigh glass-forming ability. Acta Mater. 2009, 57, 1290–1299. [Google Scholar] [CrossRef]
  32. Guinier, A. Theorie et Technique de la Radiocristallographie; Dumond: Paris, France, 1956. [Google Scholar]
  33. Elliot, P.R. Constitution of Binary Alloys; First Supplement; McGraw-Hill Book Company: New York, NY, USA, 1970; p. 472. [Google Scholar]
  34. Abrosimova, G.; Matveev, D.; Pershina, E.; Aronin, A. Effect of treatment conditions on parameters of nanocrystalline structure in Al-based alloys. Mater. Lett. 2016, 183, 131–134. [Google Scholar] [CrossRef]
  35. Aronin, A.; Budchenko, A.; Matveev, D.; Pershina, E.; Tkatch, V.; Abrosimova, G. Nanocrystal formation in light metallic glasses at heating and deformation. Rev. Adv. Mater. Sci. 2016, 46, 53–69. Available online: https://www.ipme.ru/e-journals/RAMS/no_14616/05_14616_aronin.pdf (accessed on 21 December 2021).
  36. Abrosimova, G.; Aronin, A. The increase of strength properties at nanocrystal formation. Mater. Lett. 2017, 206, 64–66. [Google Scholar] [CrossRef]
Figure 1. Scheme of sample treatment.
Metals 12 00332 g001
Figure 2. DSC curve of the samples after quenching (1), after deformation (2), and after deformation and deposition of a protective coating (3).
Metals 12 00332 g002
Figure 3. X-ray diffraction pattern of Al87Gd5Ni18 alloy samples: initial (1) and heated to 773 K (2) (triangles are Al reflections, arrows are Al3Ni, squares are Al2Gd, rhombuses are an Al4NiY-type structure).
Metals 12 00332 g003
Figure 4. X-ray diffraction pattern of the deformed (40%) sample after 1 h annealing at 428 K (1—experimental curve; 3, 4—amorphous phases with different radii of the first coordination sphere; 2 (red)—summation curve).
Metals 12 00332 g004
Figure 5. X-ray diffraction pattern of the deformed (40%) sample with a protective Ta layer after 1 h annealing at 428 K (1—experimental curve; 3, 4—amorphous phases with different radii of the first coordination sphere; 5, 6—diffraction reflections from nanocrystals; 2 (red)—summation curve).
Metals 12 00332 g005
Figure 6. TEM image of the sample after 1 stage of crystallization.
Metals 12 00332 g006
Figure 7. X-ray diffraction pattern of the samples with a protective Ta layer after annealing at 428 K for 1 (1) and 4 (2) h. The arrow marks the position of Al reflection (200).
Metals 12 00332 g007
Figure 8. X-ray diffraction pattern of the deformed (50%) sample after 1 h annealing at 428 K (1—experimental curve; 3, 4—amorphous phases with different radii of the first coordination sphere; 5—Al reflection (111); 2 (red)—summation curve).
Metals 12 00332 g008
Figure 9. X-ray diffraction pattern of the annealed (at 428 K) deformed (50%) sample with a protective Ta layer (1—experimental curve; 3, 4—amorphous phases with different radii of the first coordination sphere; 5, 6—diffraction reflections from the nanocrystals; 2 (red)—summation curve).
Metals 12 00332 g009
Figure 10. X-ray diffraction pattern of the deformed (50%) sample with a protective Ta layer annealed at 453 K for 1 h (1—experimental curve; 3, 4—amorphous phases with different radii of the first coordination sphere; 5, 6—diffraction reflections from the nanocrystals; 2 (red)—summation curve).
Metals 12 00332 g010
Publisher’s Note: MDPI stays neutral with regard to jurisdictional claims in published maps and institutional affiliations.

