
Influence of Inclusions on Mechanical Properties in Flash Butt Welding Joint of High-Strength Low-Alloy Steel


Abstract
:1. Introduction
2. Materials and Methods
2.1. Materials
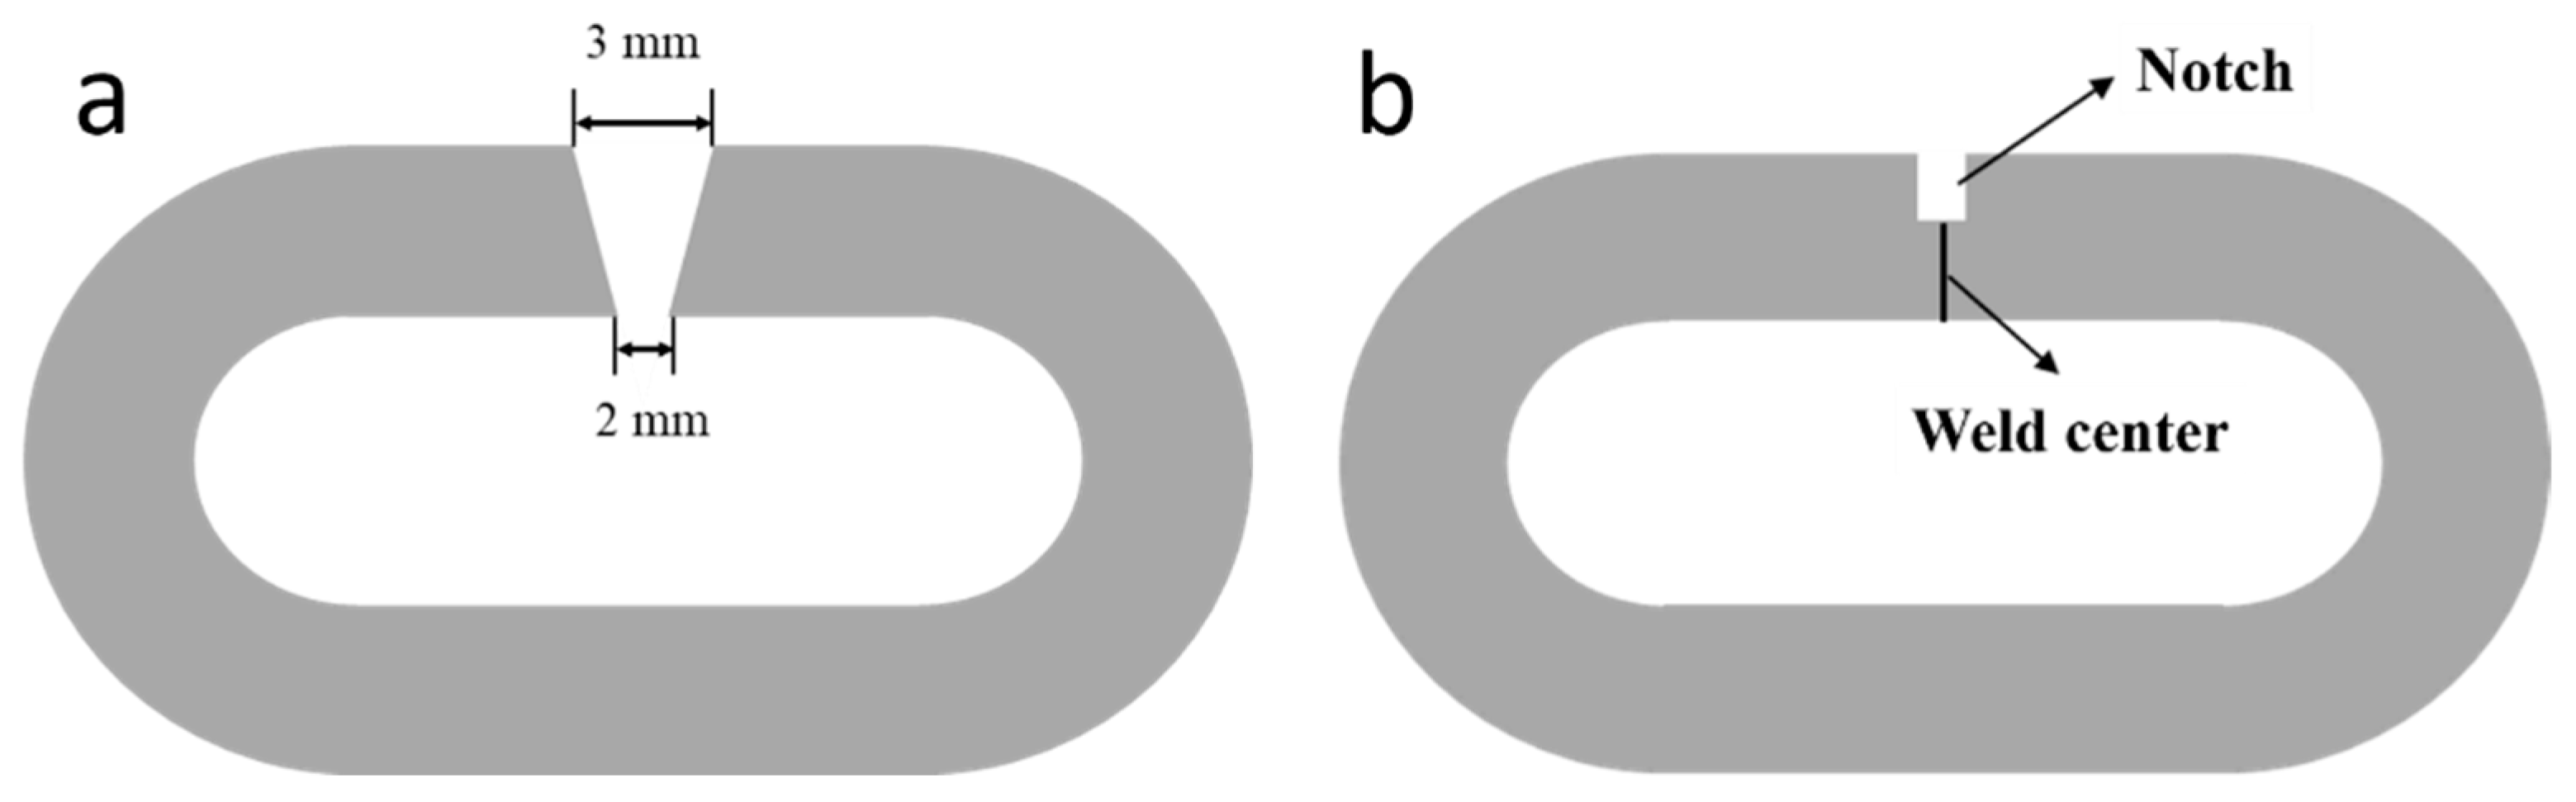
2.2. Flash Butt Welding
2.3. Characterization
3. Results and Discussion
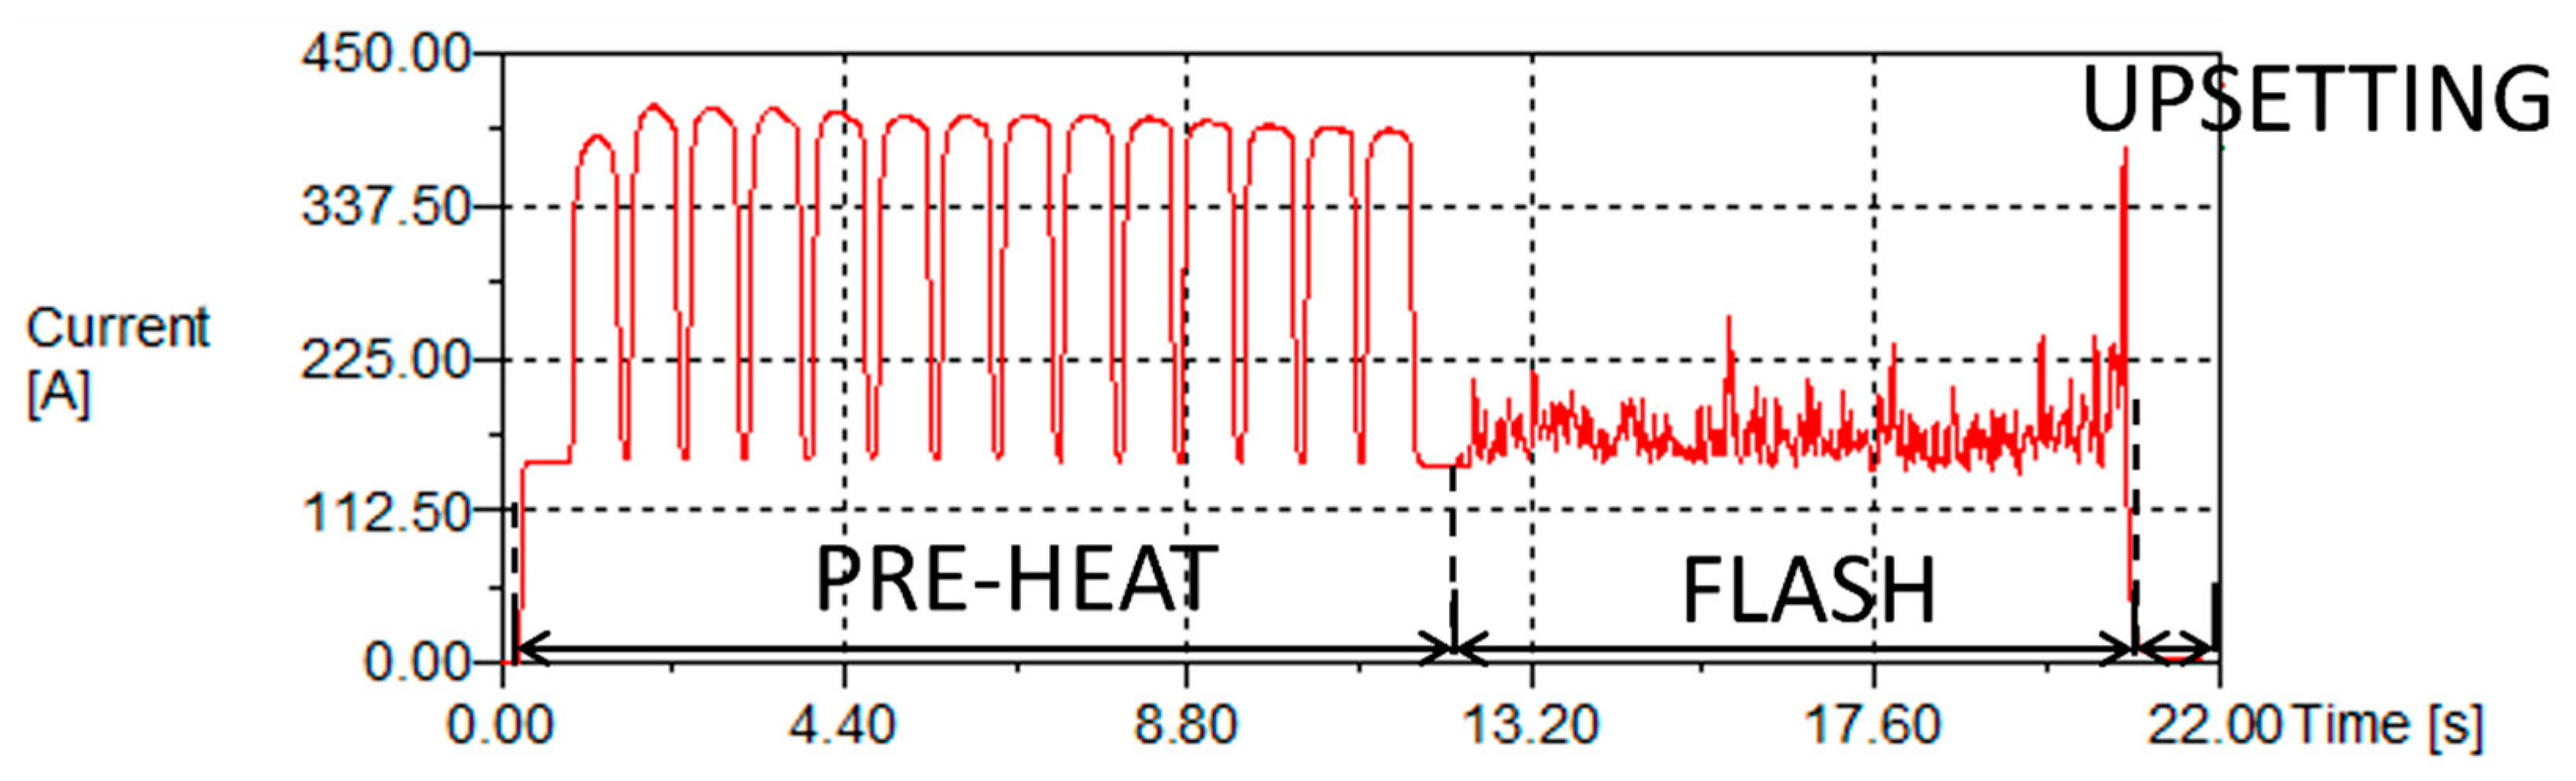
3.1. Flash Butt Welding
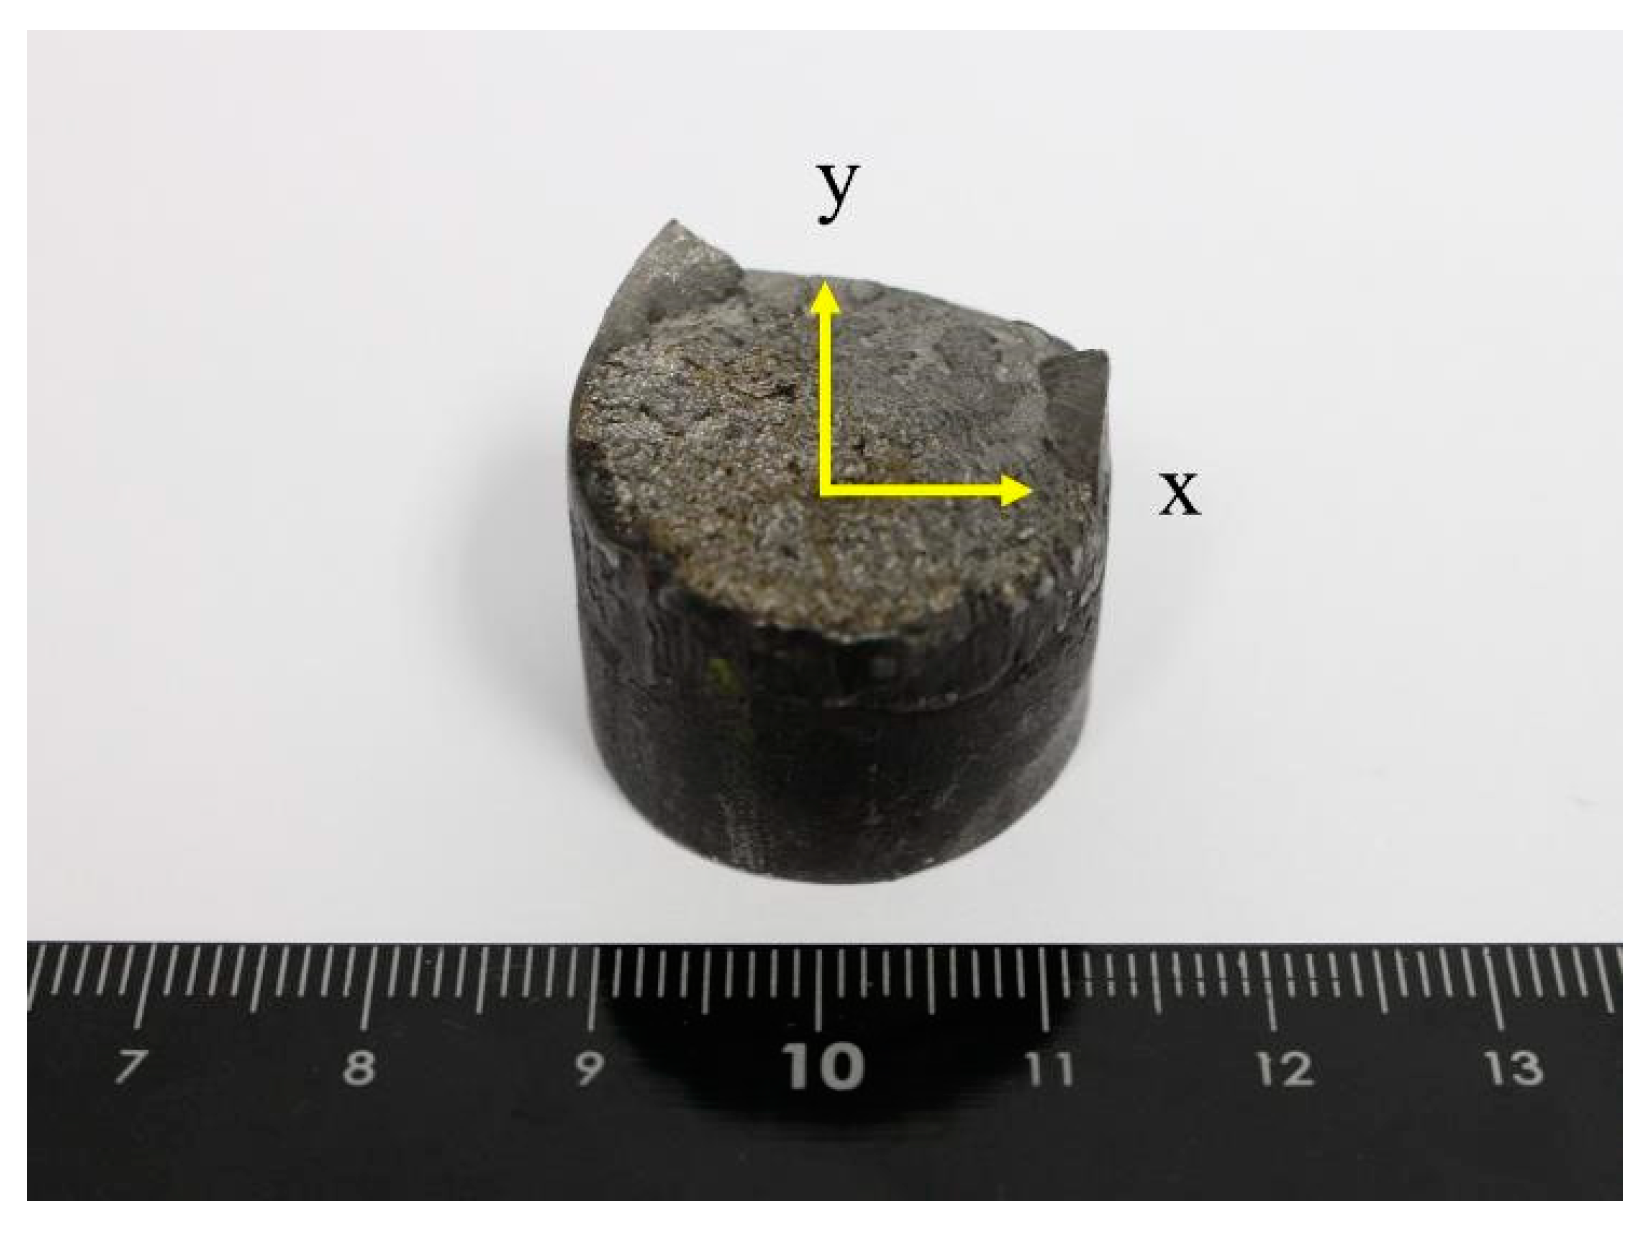
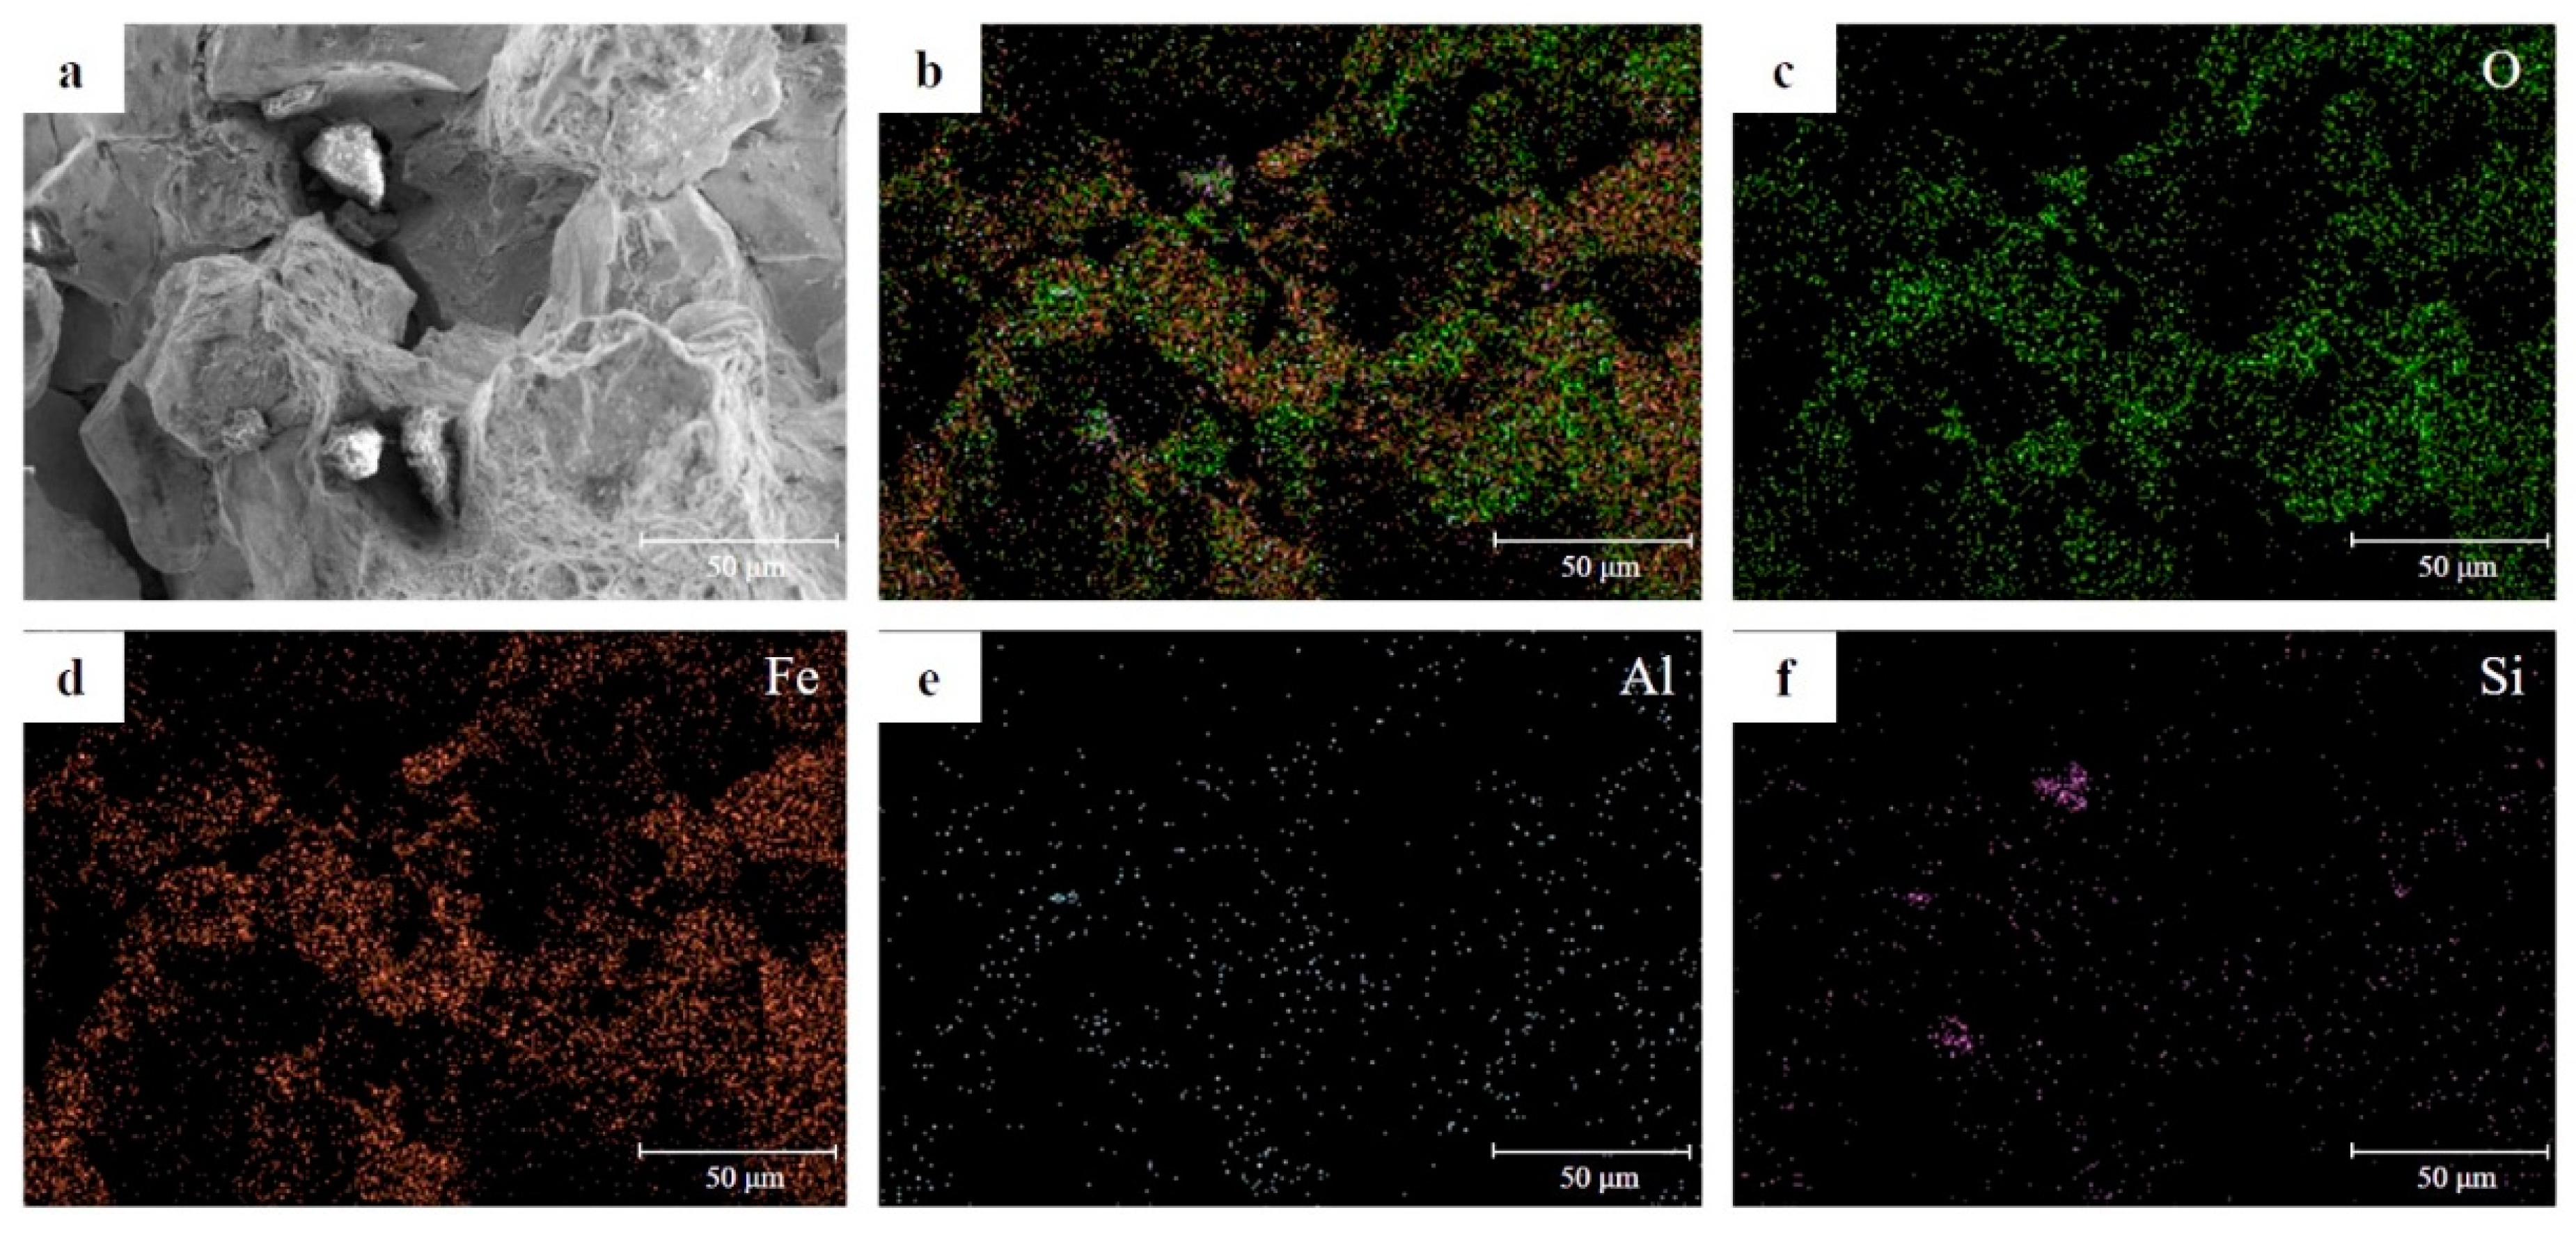
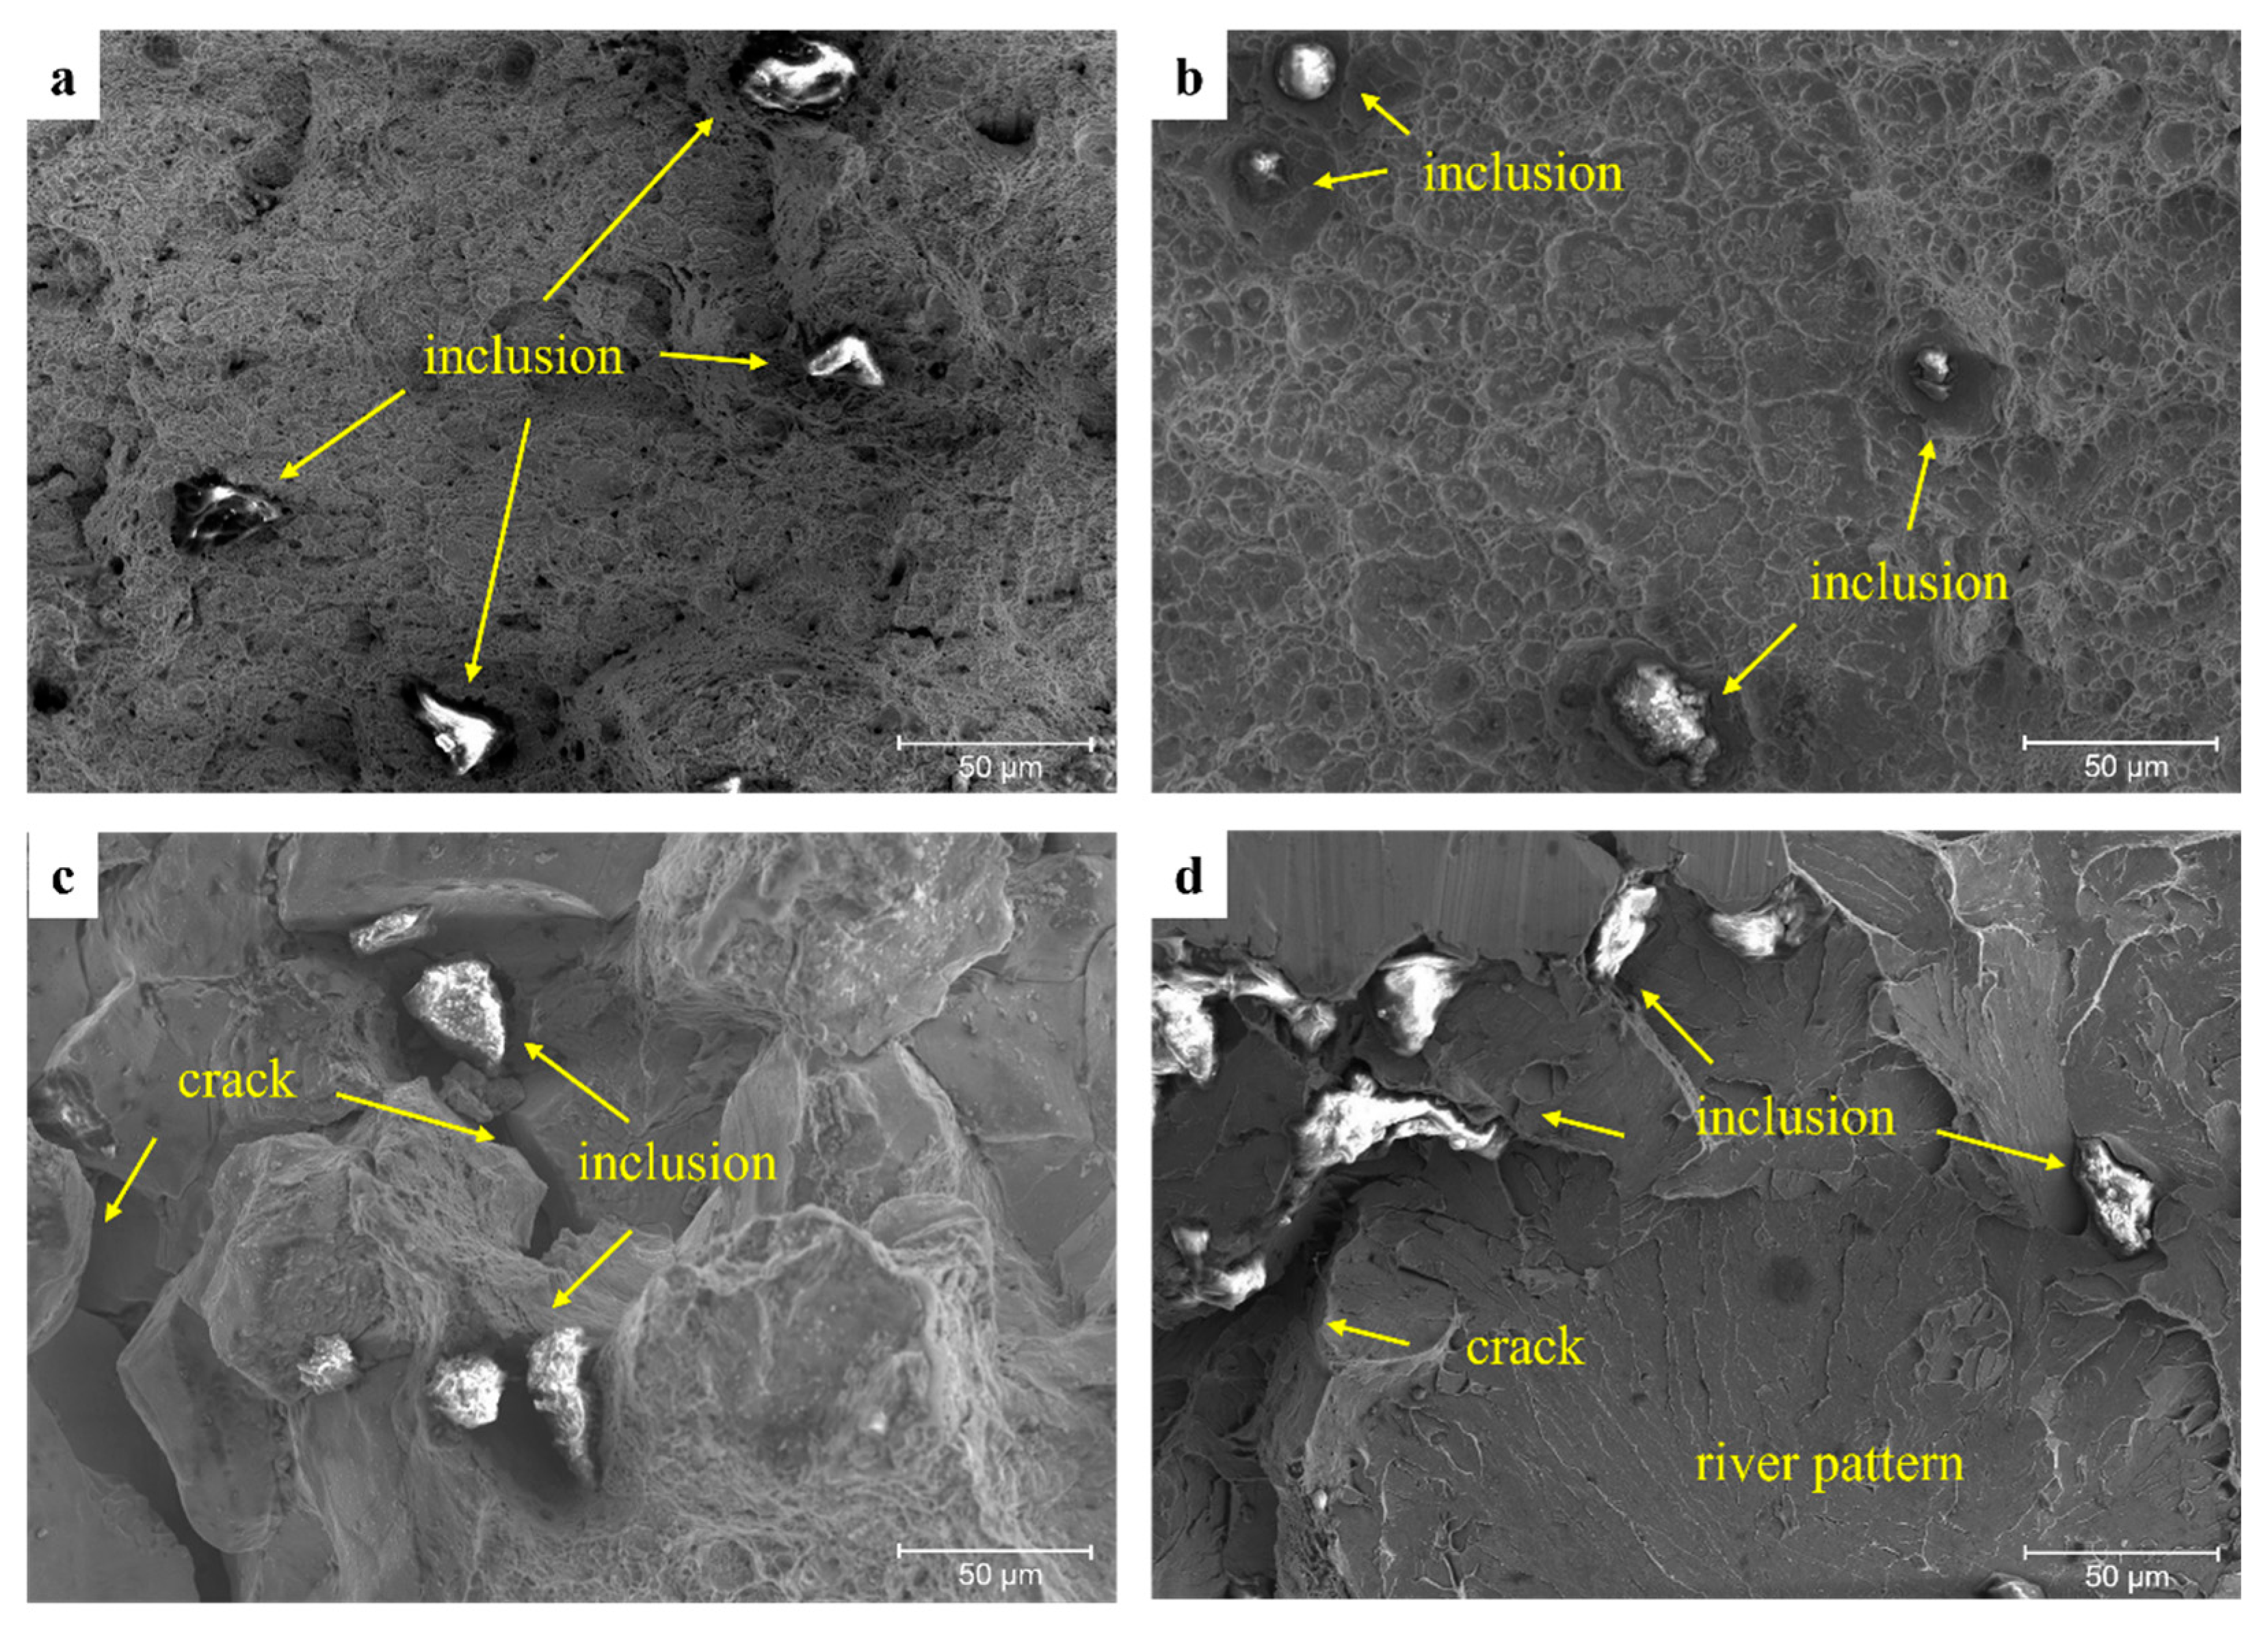
3.2. Characterization
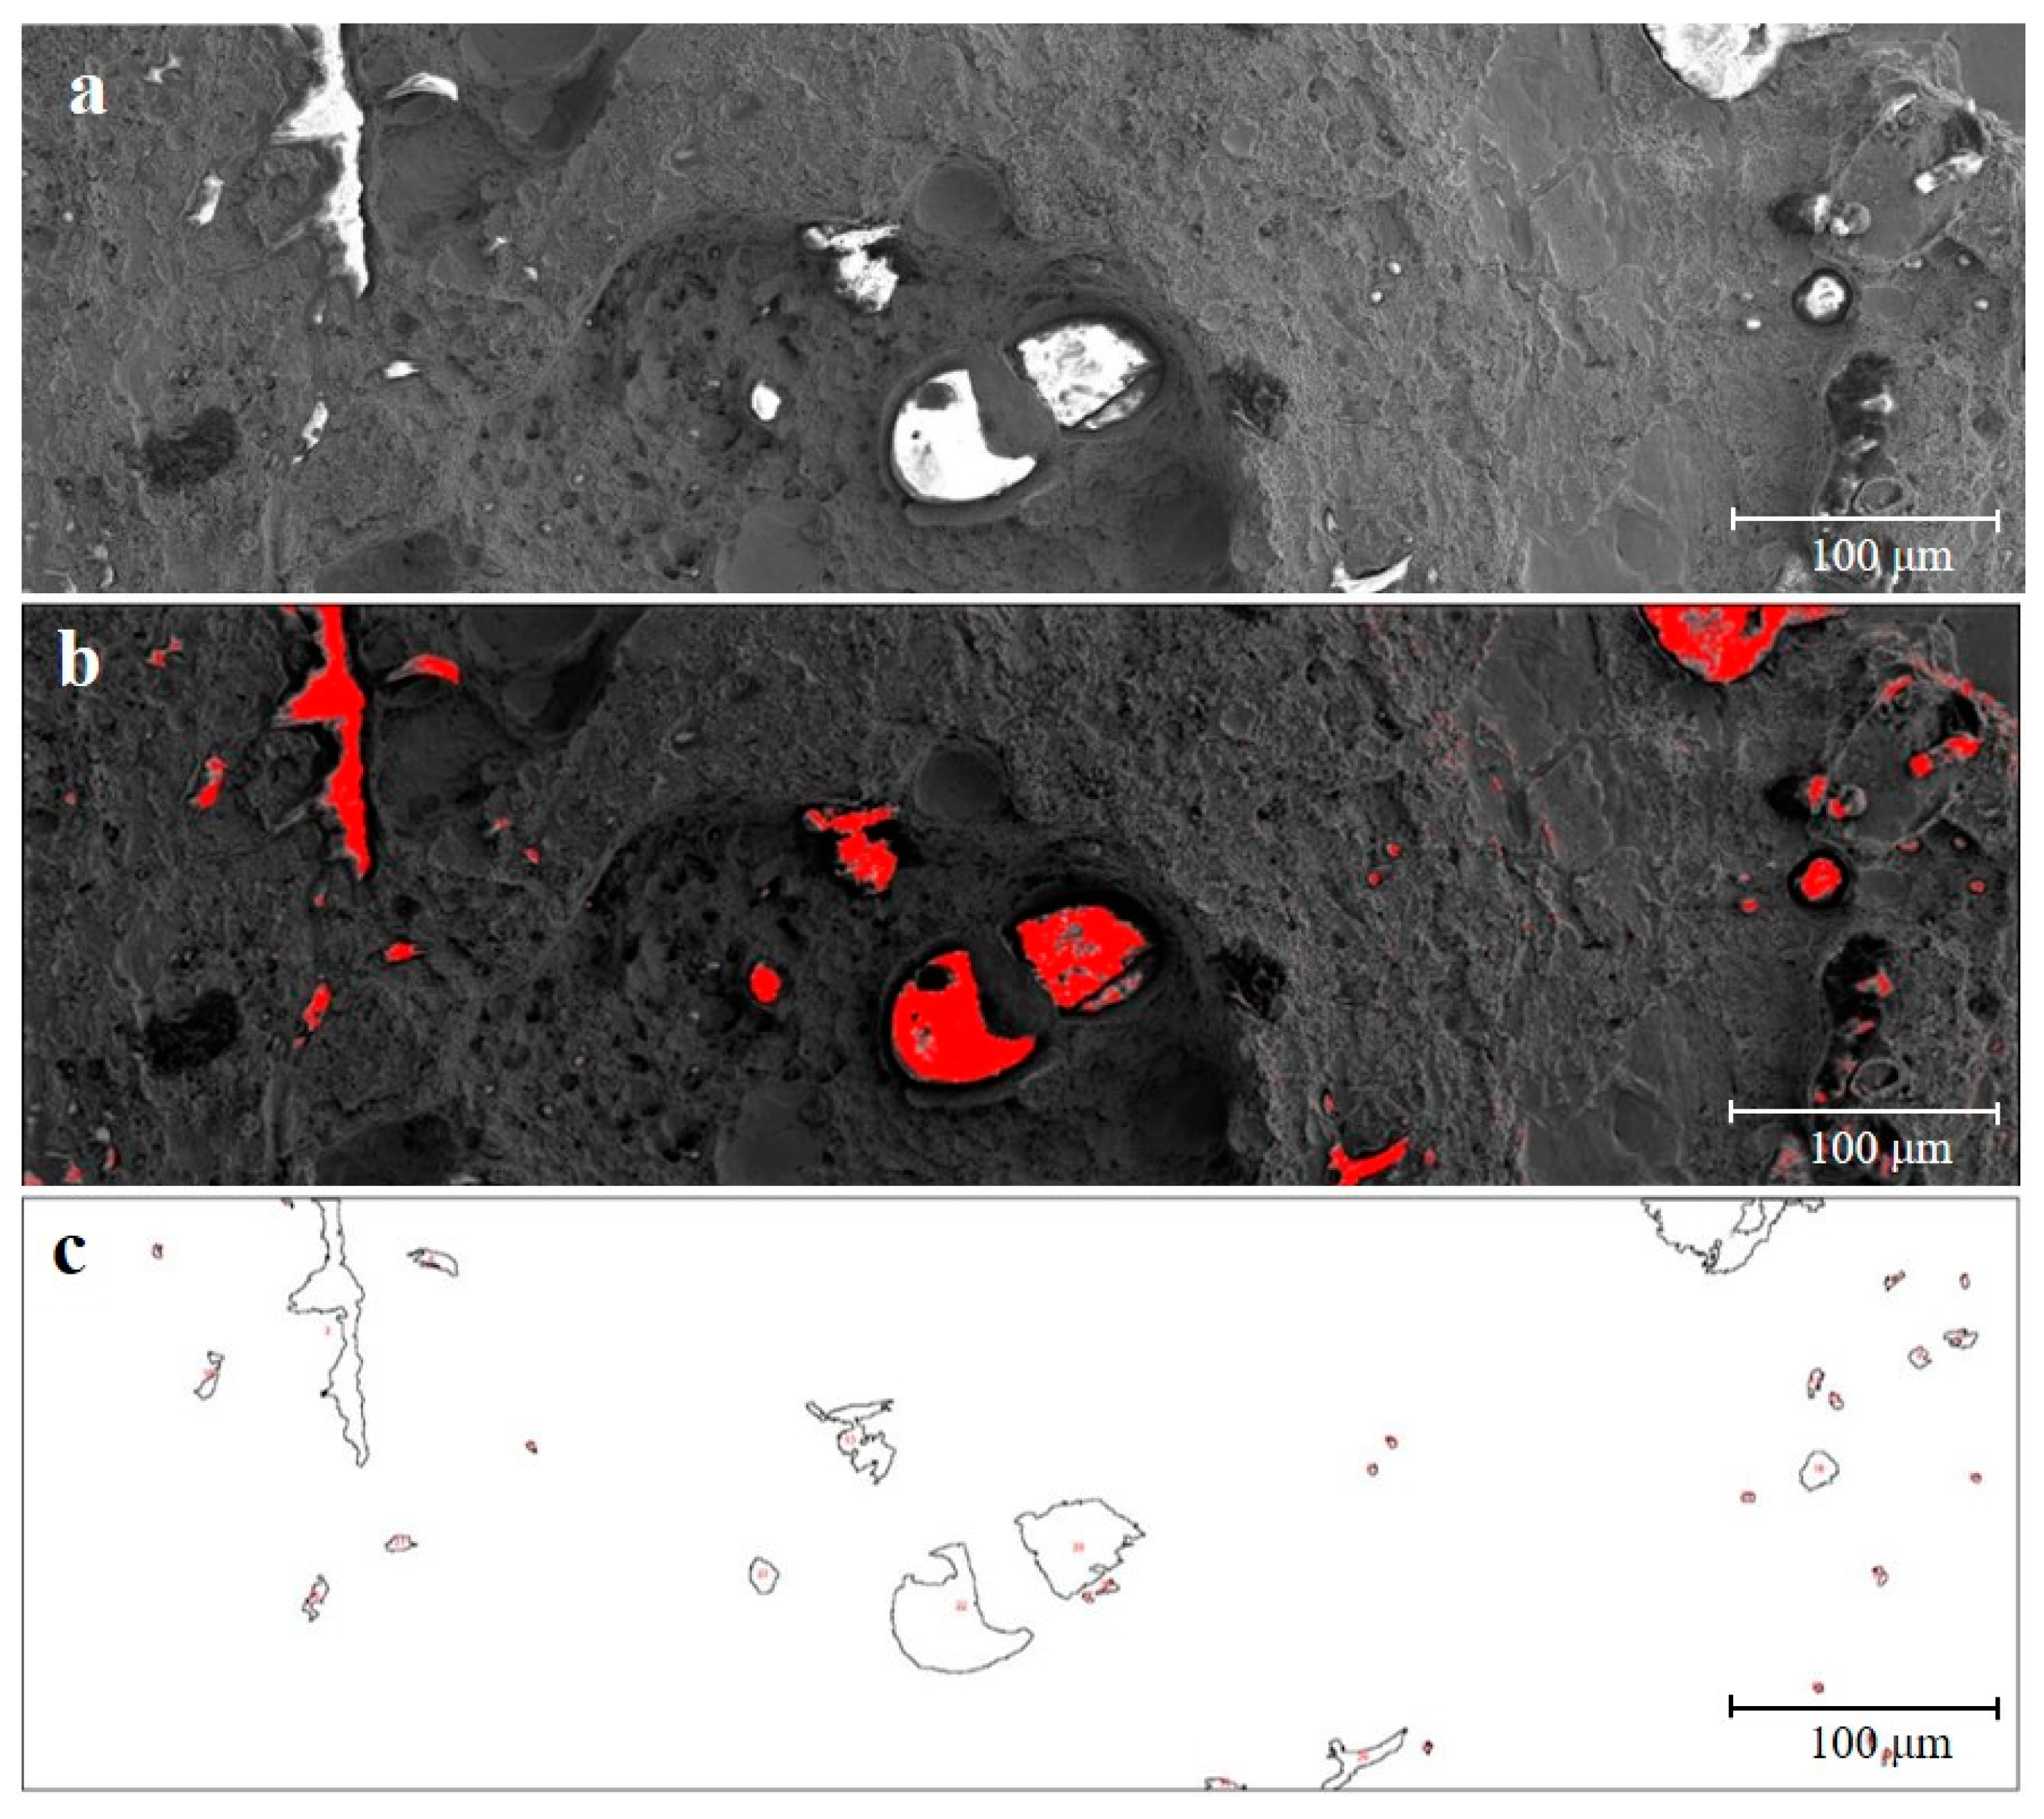
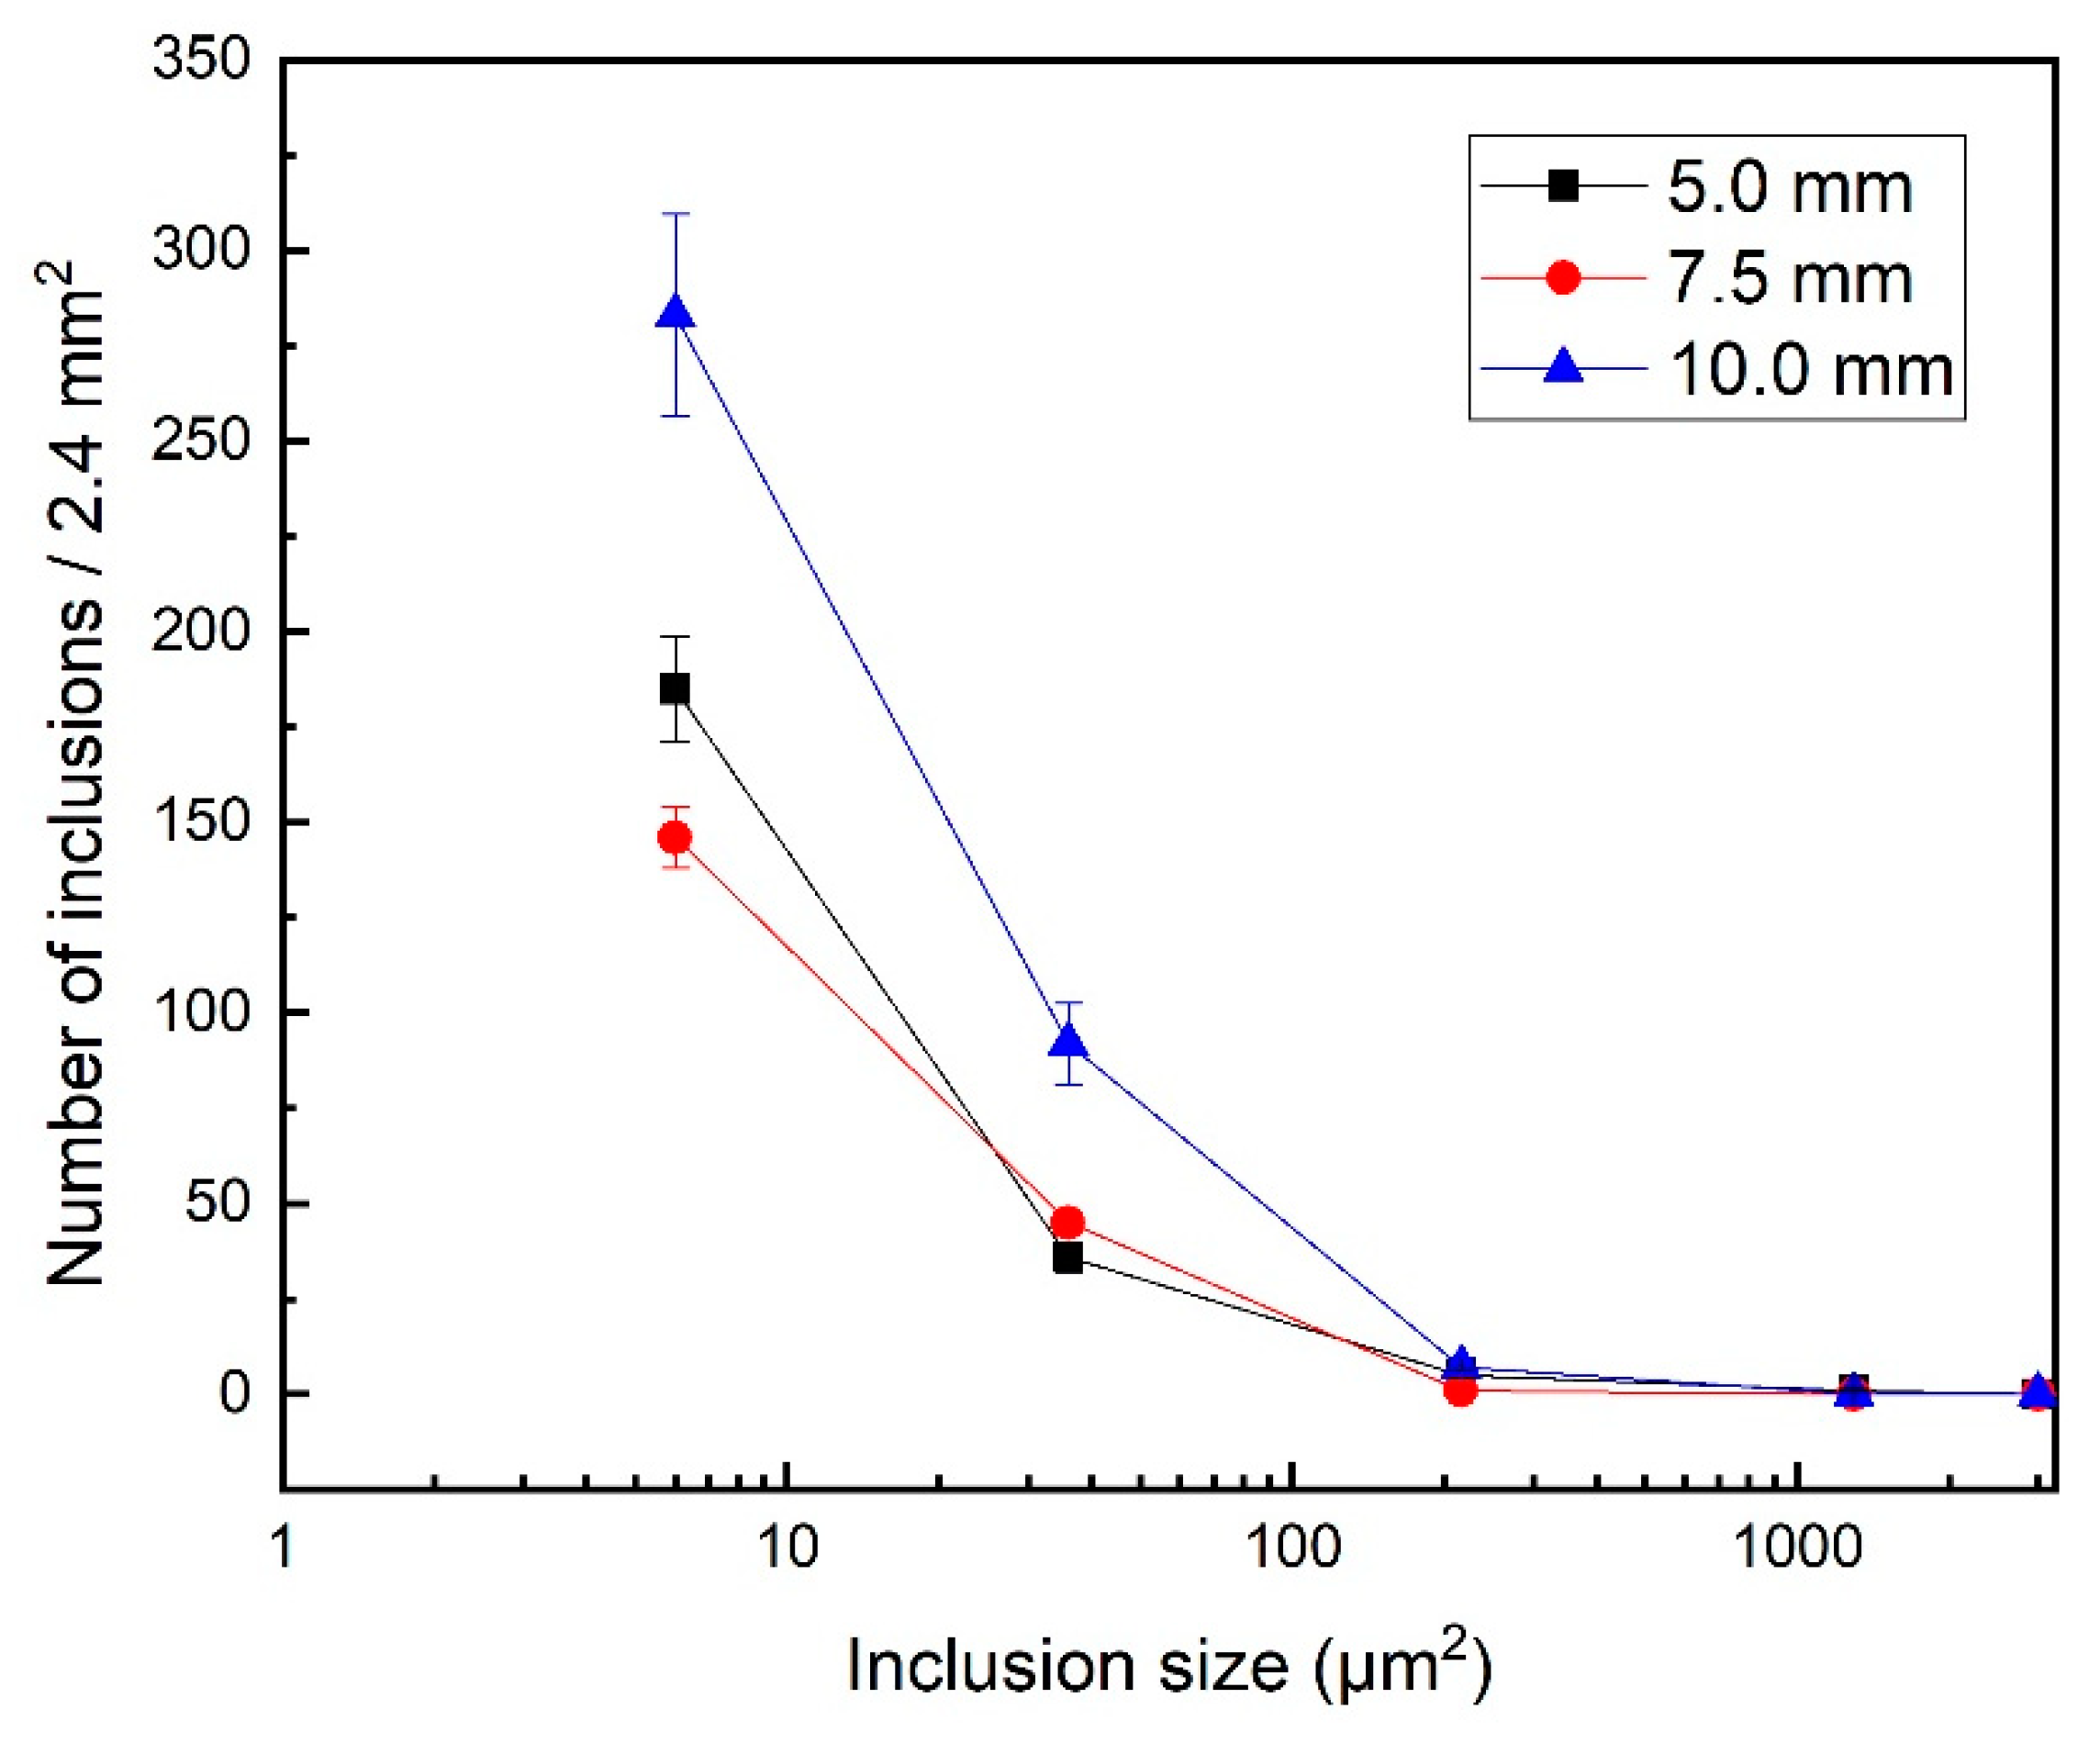
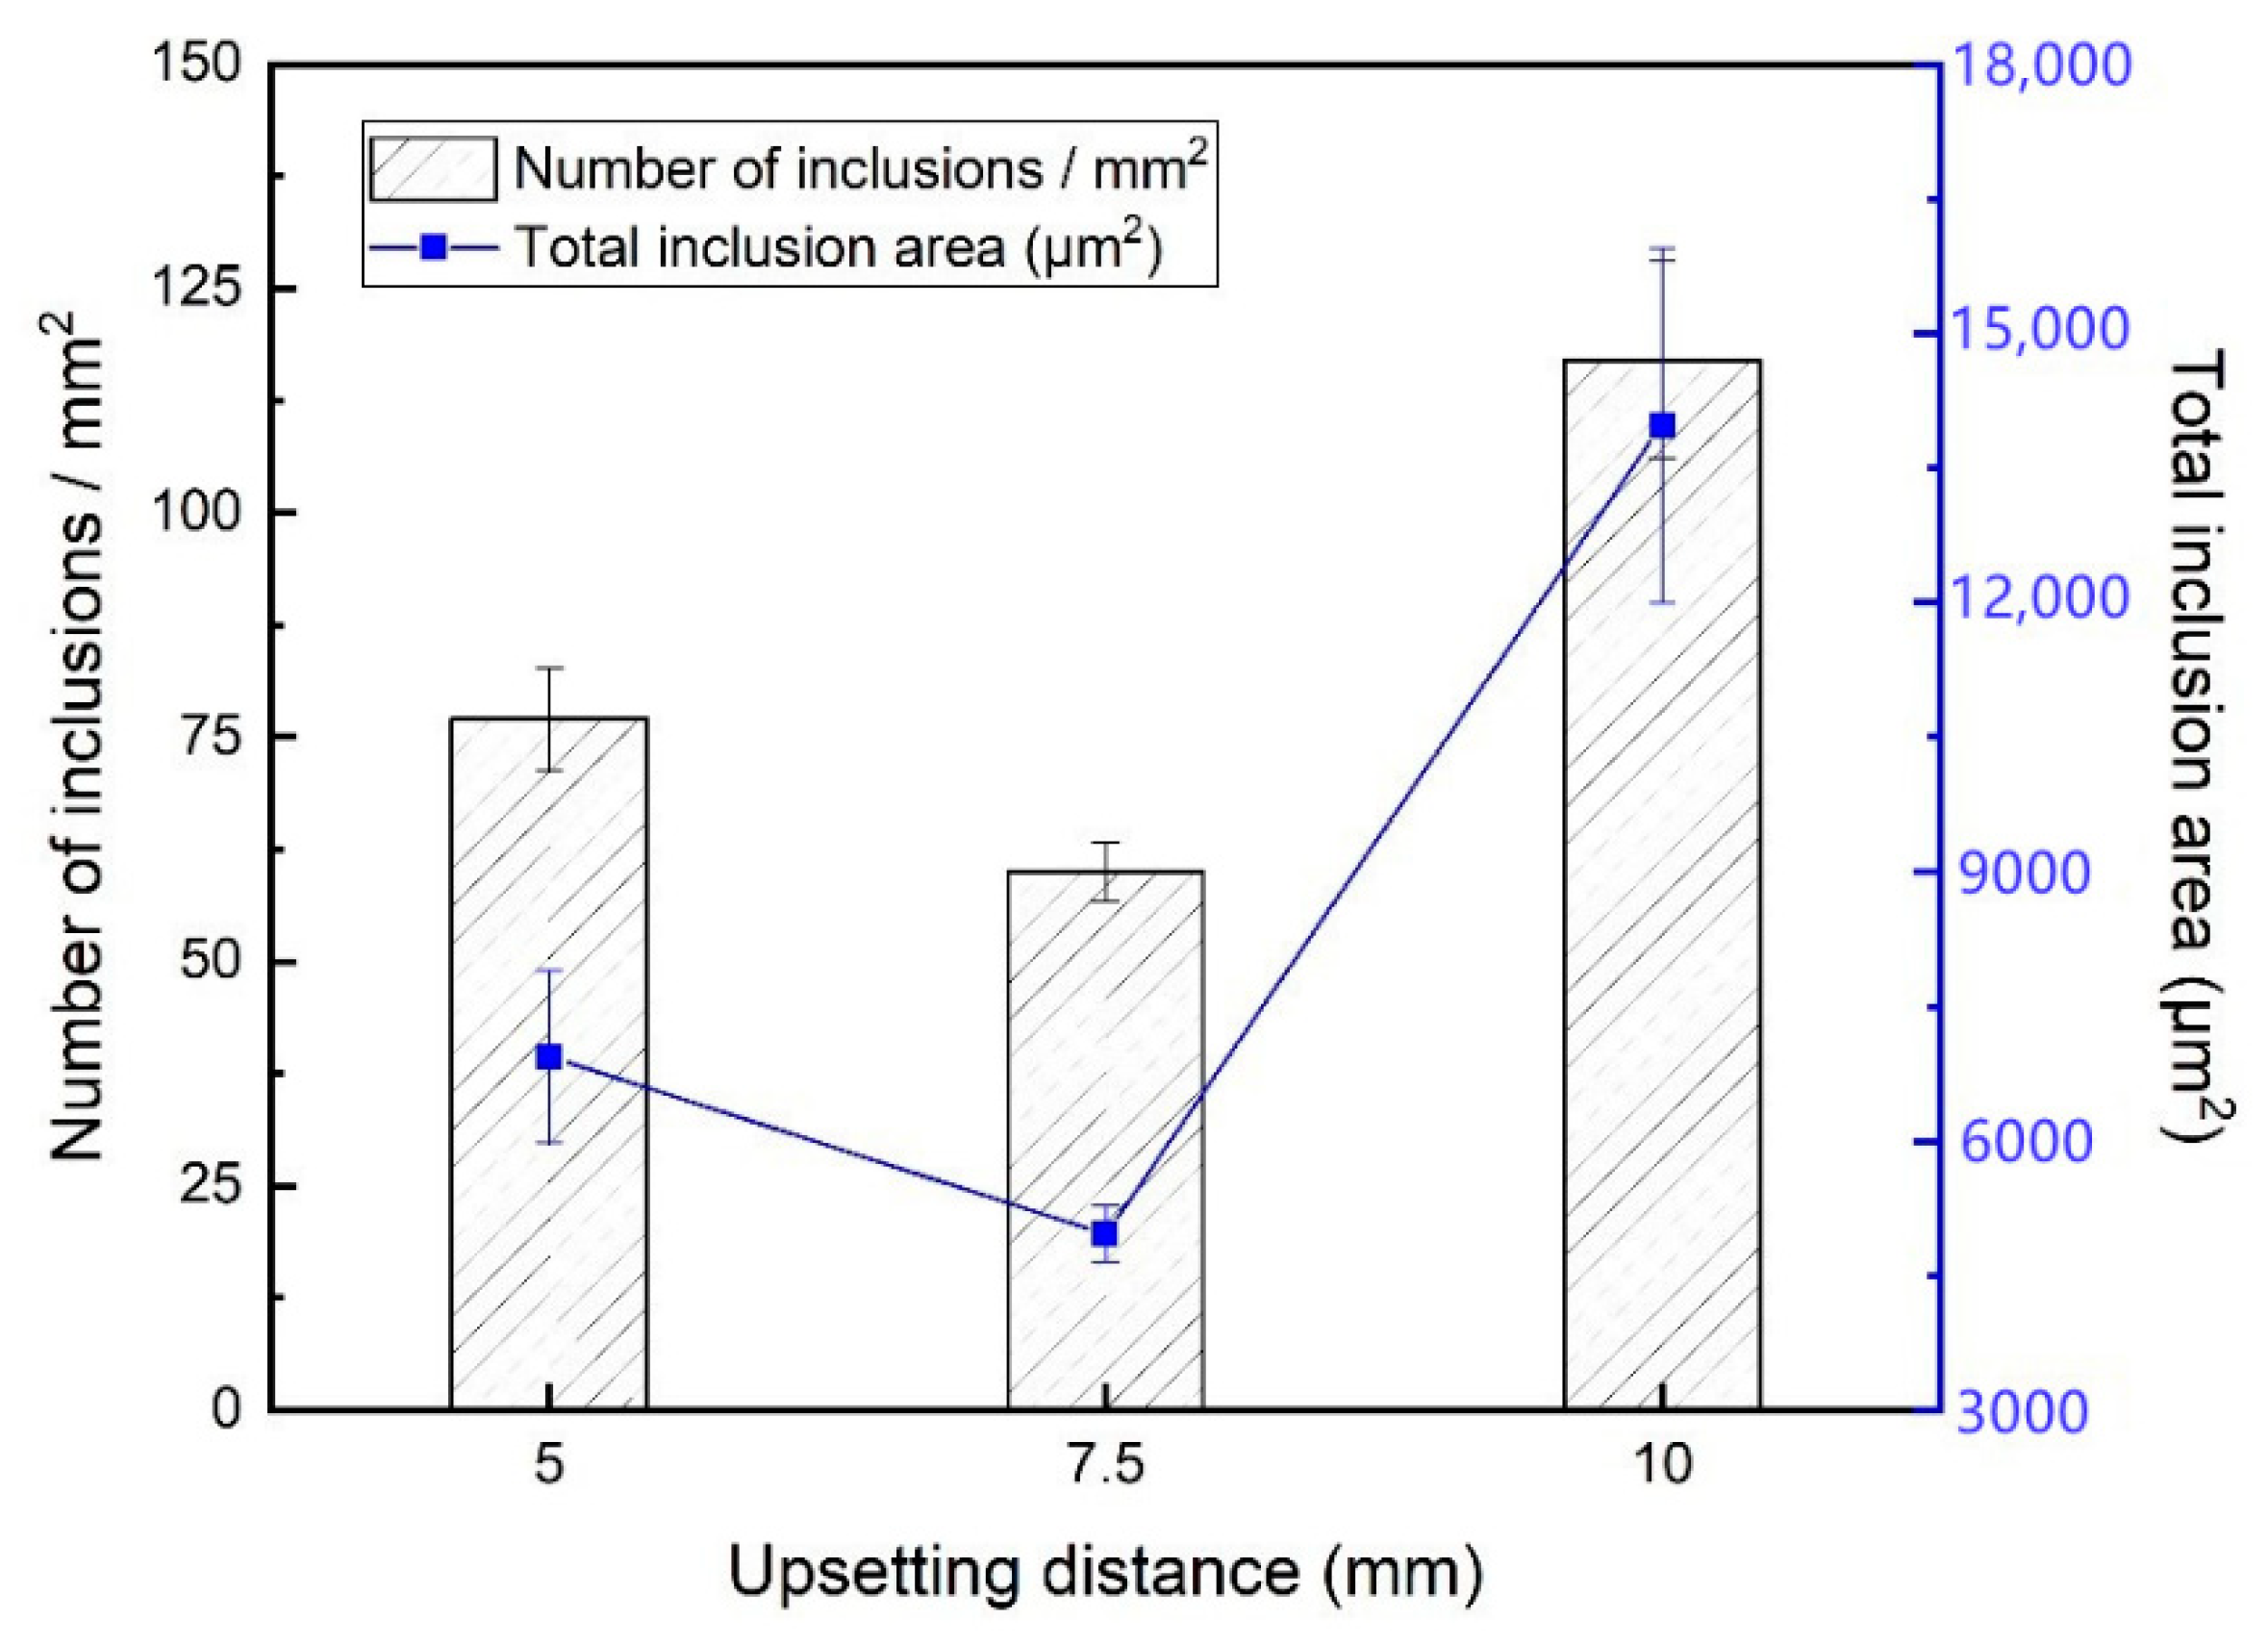
3.3. Results and Discussion of Image Analysis
4. Conclusions
Author Contributions
Funding
Institutional Review Board Statement
Informed Consent Statement
Data Availability Statement
Acknowledgments
Conflicts of Interest
References
- Kim, D.; So, W.; Kang, M. Effect of flash butt welding parameters on weld quality of mooring chain. Arch. Mater. Sci. Eng. 2009, 38, 112–117. [Google Scholar]
- Fujii, M.; Nakanowatari, H.; Nariai, K. Rail flash-butt welding technology. JFE Steel Corp 2015, 20, 159–163. [Google Scholar]
- Ichiyama, Y.; Kodama, S. Flash-butt welding of high strength steels. Shinnittetsu Giho 2006, 385, 74. [Google Scholar]
- Xi, C.; Sun, D.; Xuan, Z.; Wang, J.; Song, G. Microstructures and mechanical properties of flash butt welded high strength steel joints. Mater. Des. 2016, 96, 506–514. [Google Scholar] [CrossRef]
- Maurer, W.; Ernst, W.; Rauch, R.; Vallant, R.; Enzinger, N. Evaluation of the factors influencing the strength of HSLA steel weld joint with softened HAZ. Weld. World 2015, 59, 809–822. [Google Scholar] [CrossRef]
- Okazaki, Y.; Ishida, H.; Suenaga, K.; Hidaka, T. Influence of oxide inclusion compositions on microstructure and toughness of weld metal for high-strength steel. Weld. Int. 2012, 26, 593–600. [Google Scholar] [CrossRef]
- Lu, P.; Xu, Z.; Shu, Y.; Ma, F. Microstructure and failure analysis of flash butt welded HSLA 590CL steel joints in wheel rims. JOM 2017, 69, 135–143. [Google Scholar] [CrossRef]
- Yu, X.; Feng, L.; Qin, S.; Zhang, Y.; He, Y. Fracture analysis of U71Mn rail flash-butt welding joint. Case Stud. Eng. Fail. Anal. 2015, 4, 20–25. [Google Scholar] [CrossRef] [Green Version]
- Idapalapati, S.; Akisanya, A.R.; Loh, K.K.; Yeo, S. Failure analysis of a failed anchor chain link. Eng. Fail. Anal. 2018, 89, 258–270. [Google Scholar] [CrossRef] [Green Version]
- Al-Fadhalah, K.; Elkholy, A.; Majeed, M. Failure analysis of Grade-80 alloy steel towing chain links. Eng. Fail. Anal. 2010, 17, 1542–1550. [Google Scholar] [CrossRef]
- Yin, N.; Meng, X.T.; Li, F.; Cui, Y.; Zhou, Z.W. Cracking analysis of automobile rim flash butt welding. Adv. Mater. Res. 2014, 1004–1005, 1125–1128. [Google Scholar] [CrossRef]
- Ichiyama, Y.; Saito, T. Factors affecting flash weldability in high strength steel—A study on toughness improvement of flash welded joints in high strength steel. Weld. Int. 2004, 18, 436–443. [Google Scholar] [CrossRef]
- Hyzak, J.; Bernstein, I. The role of microstructure on the strength and toughness of fully pearlitic steels. Metall. Trans. A 1976, 7, 1217–1224. [Google Scholar] [CrossRef]
- Neves, J.; Loureiro, A. Fracture toughness of welds—effect of brittle zones and strength mismatch. J. Mater. Processing Technol. 2004, 153, 537–543. [Google Scholar] [CrossRef]
- Ichiyama, Y.; Asahi, H.; Hudson, R.; Carnes, R.; Hebner, R. Toughness Improvement of Resistance-Butt Welded Joints in Steel. Available online: https://repositories.lib.utexas.edu/handle/2152/33071?show=full (accessed on 12 October 2021).
- Ichiyama, Y.; Ichikawa, M.; Saito, T. The effect of upsetting conditions on flash weld toughness. Study on toughness improvement of flash welded joints in high strength steel. Weld. Int. 2004, 18, 683–691. [Google Scholar] [CrossRef]
- Räsänen, A.; Martikainen, J. Experimental review of metallurgical flash weld defects in welded joints: Essence of flat spots, penetrators and oxide inclusions. Sci. Technol. Weld. Join. 2011, 16, 471–476. [Google Scholar] [CrossRef]
- Kuchuk-Yatsenko, S.; Shvets, V.; Didkovsky, A.; Antipin, E.; Kapitanchuk, L. Defects of joints of high-strength rails produced using flash-butt welding. Avtom. Svarka 2013, 9, 3–9. [Google Scholar]
- Chvertko, Y.; Shevchenko, M.; Pirumov, A. Monitoring of the process of Flash-Butt Welding. Soldag. Inspeção 2013, 18, 31–38. [Google Scholar] [CrossRef] [Green Version]
- Lu, P.; Xu, Z.; Jiang, K.; Ma, F.; Shu, Y. Influence of flash butt welding parameters on microstructure and mechanical properties of HSLA 590CL welded joints in wheel rims. J. Mater. Res. 2017, 32, 831–842. [Google Scholar] [CrossRef]
- Baracaldo, R.R.; Santos, M.C.; Echeverría, M.A.A. Effect of flash butt welding parameters on mechanical properties of wheel rims. Sci. Et Tech. 2018, 23, 51–57. [Google Scholar]
- Skachkov, I.; Chvertko, E. Evaluation of stability of the flashing process in flash-butt welding. Paton Weld. J 2011, 3, 29–31. [Google Scholar]
- Shajan, N.; Arora, K.S.; Sharma, V.; Shome, M. Effect of upset pressure on texture evolution and its correlation to toughness in flash butt joints. Sci. Technol. Weld. Join. 2018, 23, 434–440. [Google Scholar] [CrossRef]
- Ziemian, C.W.; Sharma, M.M.; Whaley, D.E. Effects of flashing and upset sequences on microstructure, hardness, and tensile properties of welded structural steel joints. Mater. Des. 2012, 33, 175–184. [Google Scholar] [CrossRef]


| Welding Machine | Upset Pressure (bar) | Flash Allowance (mm) | Upset Distance (mm) | Flashing Time (s) | Upset Speed (mm/s) |
|---|---|---|---|---|---|
| SU50 | 50 | 8 | 2.5, 5, 7.5, 10 | 10 | 110 |
| Upset Distance (mm) | 2.5 | 5 | 7.5 | 10 | ||||||||
|---|---|---|---|---|---|---|---|---|---|---|---|---|
| Preheating energy/total energy | 42% | 41% | 40% | 63% | 62% | 59% | 75% | 74% | 73% | 27% | 27% | 29% |
| Flash welding time/total time | 68% | 69% | 67% | 55% | 55% | 58% | 42% | 44% | 44% | 72% | 75% | 76% |
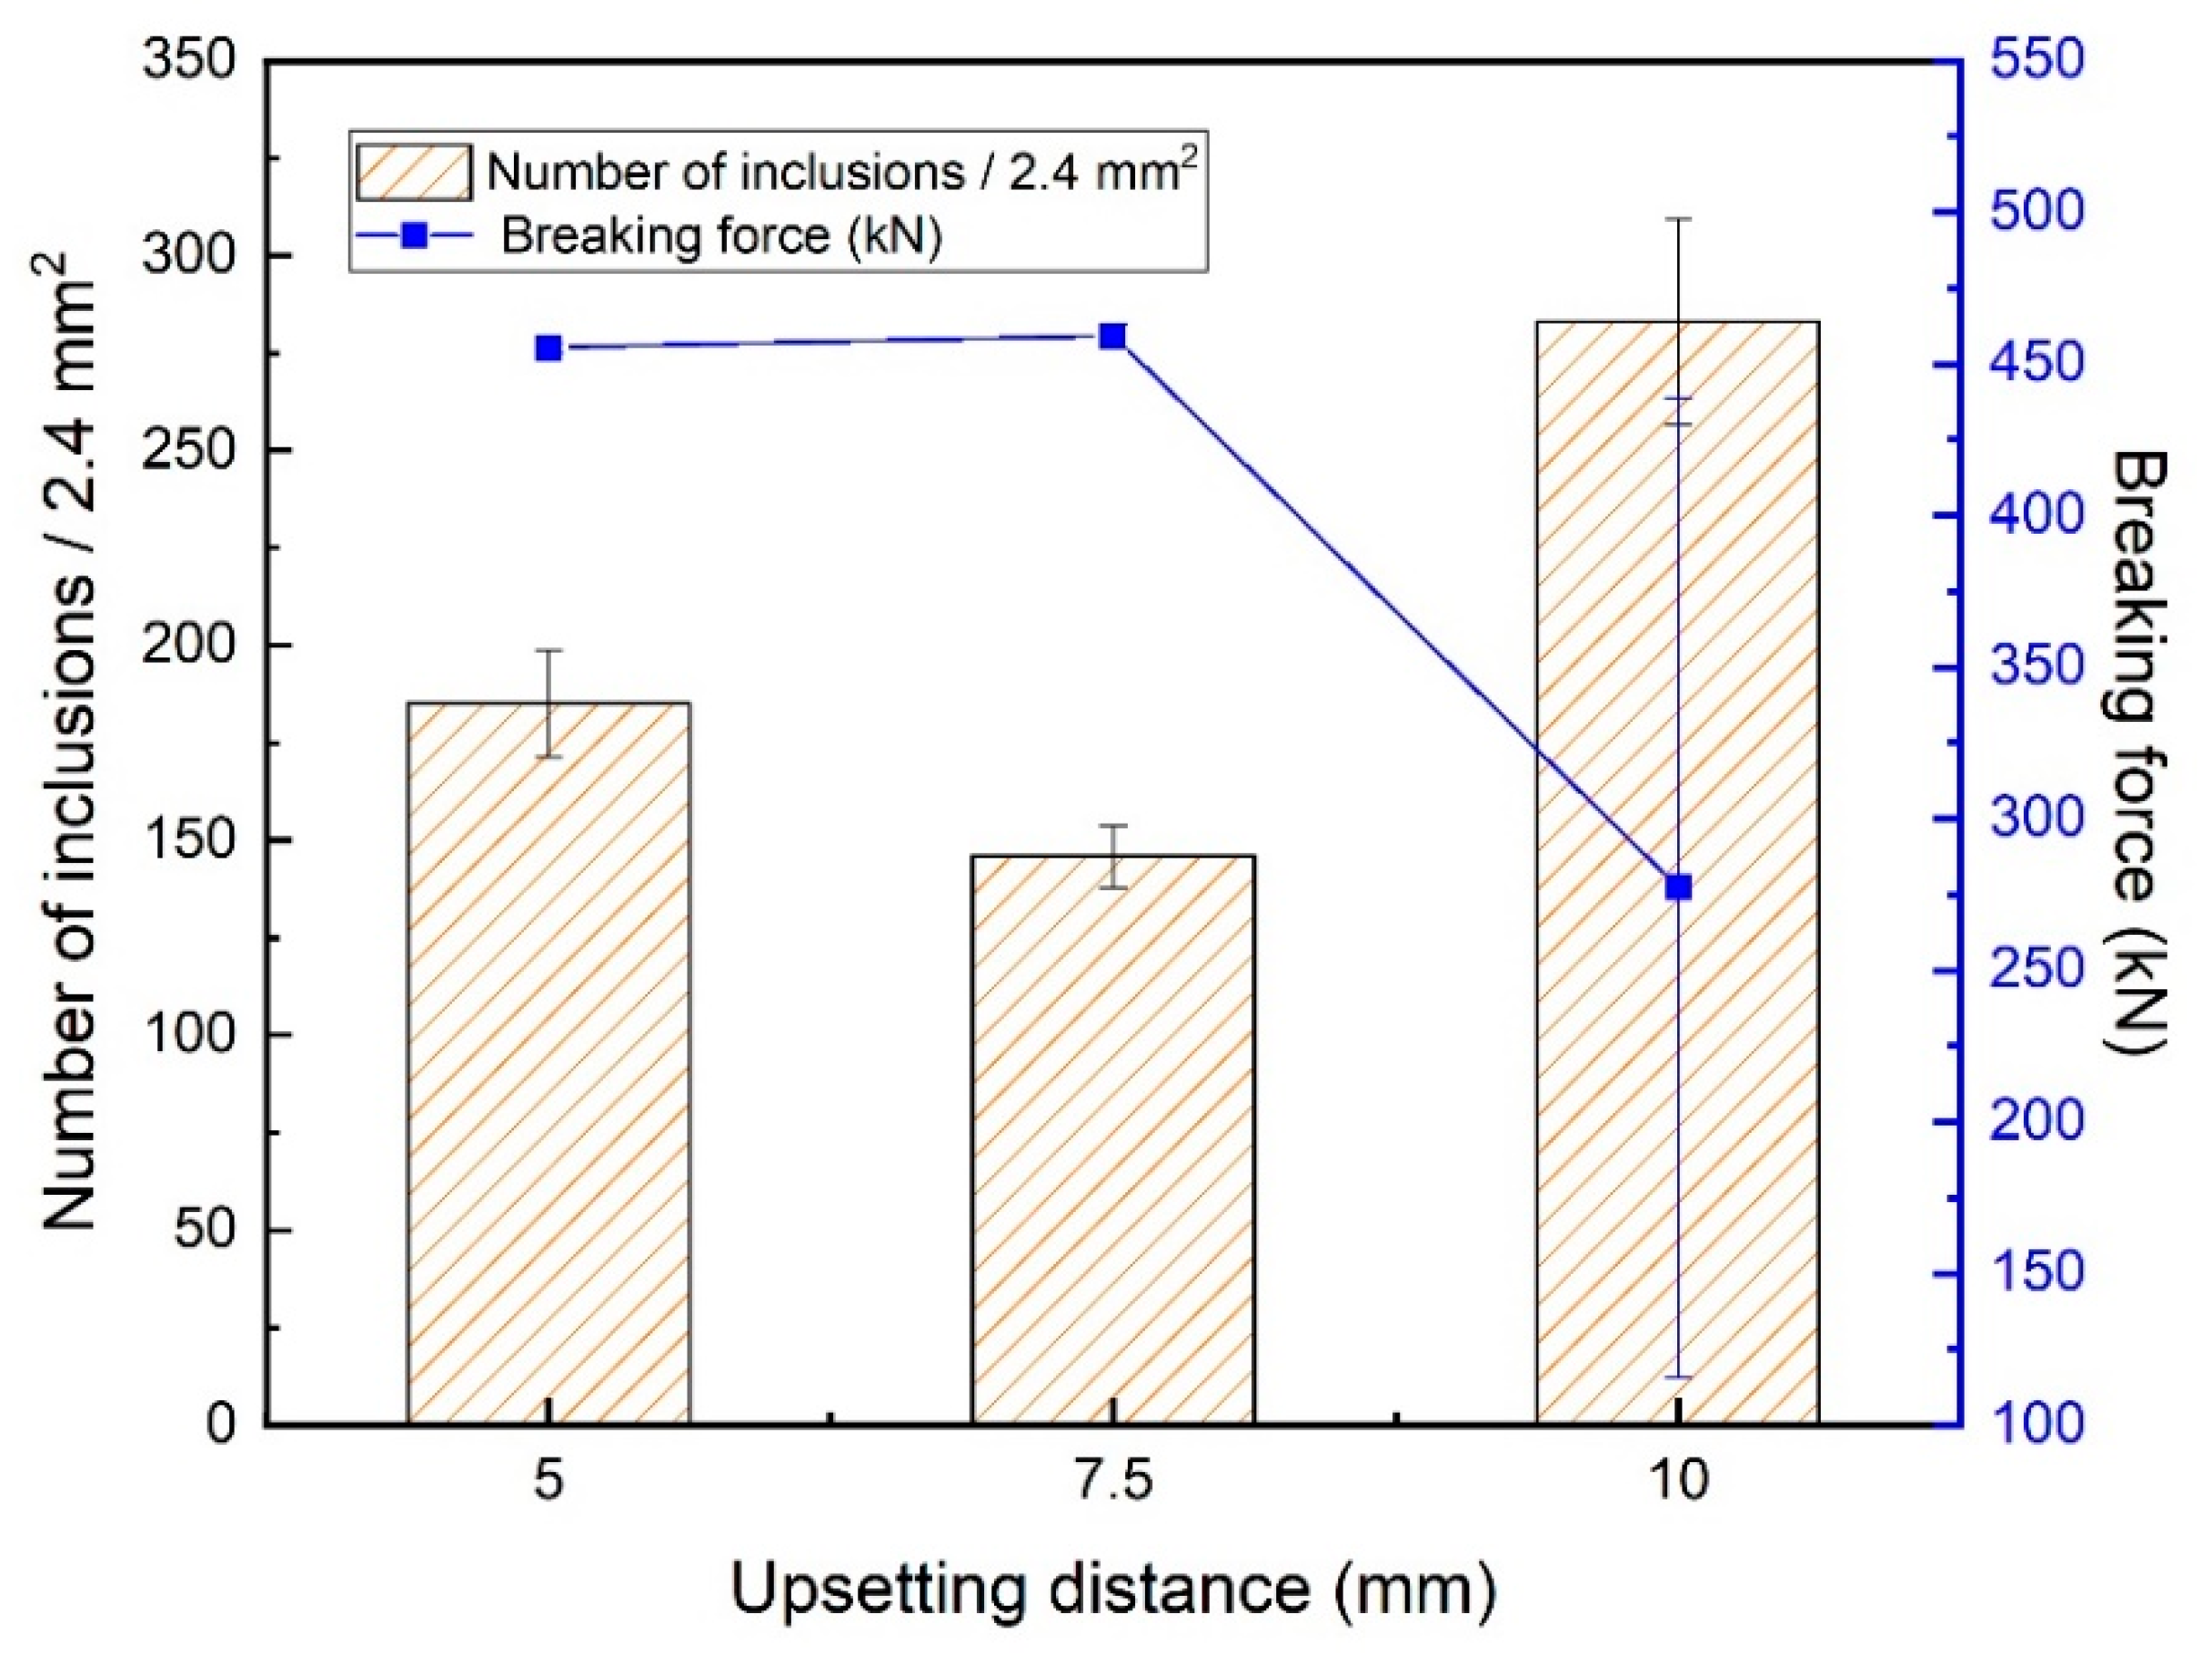
| Breaking force (kN) | - | - | - | 456.3 | 458.8 | 455.4 | 453.5 | 459.1 | 451.5 | 235.3 | 455.6 | 141.4 |
| Destruction location | - | - | - | Outside welding joint | Outside welding joint | Outside welding joint | Outside welding joint | Outside welding joint | Outside welding joint | Weld center | Outside welding joint | Weld center |
| Upset Distance 5.0 mm | Sample Area (μm2) | Inclusion Area (μm2) | Count | Average Size (μm2) | Min (μm2) | Max (μm2) |
|---|---|---|---|---|---|---|
| 1 | 366,566.70 | 826.77 | 24 | 34.45 | 6.45 | 158.93 |
| 2 | 255,911.45 | 3284.13 | 53 | 61.69 | 6.12 | 1355.30 |
| 3 | 192,460.53 | 344.63 | 15 | 22.97 | 7.85 | 63.13 |
| 4 | 126,167.34 | 309.82 | 10 | 30.98 | 7.17 | 115.46 |
| 5 | 296,800.00 | 32.61 | 3 | 10.87 | 7.83 | 15.81 |
| 6 | 109,824.35 | 246.76 | 10 | 24.67 | 6.93 | 70.52 |
| 7 | 260,182.46 | 115.76 | 11 | 10.52 | 6.53 | 22.73 |
| 8 | 288,500.27 | 530.58 | 15 | 35.37 | 6.32 | 307.96 |
| 9 | 254,214.74 | 997.33 | 23 | 43.36 | 6.02 | 516.52 |
| 10 | 264,978.72 | 248.93 | 21 | 11.85 | 6.02 | 51.20 |
| Total | 2,415,606.57 | 6937.33 | 185 | - | ||
| Upset Distance 7.5 mm | Sample Area (μm2) | Inclusion Area (μm2) | Count | Average Size (μm2) | Min (μm2) | Max (μm2) |
|---|---|---|---|---|---|---|
| 1 | 246,923.97 | 470.55 | 11 | 42.77 | 9.81 | 112.63 |
| 2 | 194,290.9 | 60.85 | 4 | 15.21 | 6.06 | 41.10 |
| 3 | 262,870.07 | 582.19 | 15 | 32.81 | 7.73 | 84.51 |
| 4 | 240,981.85 | 867.91 | 19 | 45.68 | 6.31 | 346.93 |
| 5 | 246,933.18 | 365.33 | 13 | 28.10 | 6.39 | 96.30 |
| 6 | 260,281.23 | 417.24 | 20 | 20.86 | 6.17 | 78.05 |
| 7 | 293,597.29 | 912.53 | 22 | 41.47 | 6.31 | 152.66 |
| 8 | 280,730.81 | 773.08 | 24 | 32.21 | 6.93 | 100.76 |
| 9 | 109,191.87 | 0.00 | 0 | 0.00 | 0.00 | 0.00 |
| 10 | 183,251.18 | 436.45 | 14 | 31.18 | 7.26 | 89.14 |
| 11 | 82,375.93 | 76.99 | 4 | 19.25 | 6.96 | 54.43 |
| Total | 2,401,428.26 | 4963.12 | 146 | - | ||
| Upset Distance 10.0 mm | Sample Area (μm2) | Inclusion Area (μm2) | Count | Average Size (μm2) | Min (μm2) | Max (μm2) |
|---|---|---|---|---|---|---|
| 1 | 308,129.52 | 654.04 | 29 | 22.24 | 6.31 | 136.44 |
| 2 | 287,829.61 | 419.27 | 16 | 26.21 | 6.42 | 99.17 |
| 3 | 297,895.50 | 920.85 | 19 | 48.46 | 6.45 | 154.09 |
| 4 | 299,927.04 | 591.32 | 20 | 29.56 | 6.21 | 104.59 |
| 5 | 218,426.28 | 6511.56 | 93 | 70.01 | 6.02 | 808.51 |
| 6 | 266,197.97 | 2408.46 | 53 | 45.44 | 6.44 | 382.37 |
| 7 | 208,845.91 | 1418.65 | 31 | 52.22 | 6.27 | 235.10 |
| 8 | 246,203.56 | 289.58 | 8 | 36.20 | 7.07 | 129.55 |
| 9 | 277,008.41 | 560.96 | 14 | 40.06 | 6.17 | 263.29 |
| Total | 2,410,462.80 | 13,974.69 | 283 | - | ||
Publisher’s Note: MDPI stays neutral with regard to jurisdictional claims in published maps and institutional affiliations. |
© 2022 by the authors. Licensee MDPI, Basel, Switzerland. This article is an open access article distributed under the terms and conditions of the Creative Commons Attribution (CC BY) license (https://creativecommons.org/licenses/by/4.0/).
Share and Cite
Shi, S.-C.; Wang, W.-C.; Ko, D.-K. Influence of Inclusions on Mechanical Properties in Flash Butt Welding Joint of High-Strength Low-Alloy Steel. Metals 2022, 12, 242. https://doi.org/10.3390/met12020242
Shi S-C, Wang W-C, Ko D-K. Influence of Inclusions on Mechanical Properties in Flash Butt Welding Joint of High-Strength Low-Alloy Steel. Metals. 2022; 12(2):242. https://doi.org/10.3390/met12020242
Chicago/Turabian StyleShi, Shih-Chen, Wei-Cheng Wang, and Dun-Kai Ko. 2022. "Influence of Inclusions on Mechanical Properties in Flash Butt Welding Joint of High-Strength Low-Alloy Steel" Metals 12, no. 2: 242. https://doi.org/10.3390/met12020242