Article

Effects of Yttrium on High Temperature Oxidation Resistance of W-Si-Y Self-Passivating Alloys

State Key Laboratory of Materials Processing and Die and Mould Technology, Huazhong University of Science and Technology, Wuhan 430074, China
*
Author to whom correspondence should be addressed.
Metals 2022, 12(12), 2040; https://doi.org/10.3390/met12122040
Submission received: 1 November 2022 / Revised: 19 November 2022 / Accepted: 23 November 2022 / Published: 27 November 2022

Abstract

:
Self-passivating W alloys have excellent high temperature oxidation resistance and are expected to be used as a key component in high temperature environment. In this study, a series of W-Si-xY self-passivating alloys were fabricated by mechanical alloying (MA) and spark plasma sintering (SPS). Effects of Y content on phase compositions, microstructures, and oxidation resistance at high temperatures were investigated systematically. The results show that the oxidation resistance of the alloys increases with the increase of Y content (0.0~5.0 wt.%), but the oxidation resistance of the alloys deteriorates when the Y content reaches 9.6 wt.%. The alloy with 3.8 wt.% Y shows the best oxidation resistance. The thickness of its oxide layer is ~249.1 μm when the oxidation time reaches 80 h, which is thinner than that of other alloys. Effects of Y content on the oxidation resistance are revealed. During the oxidation process, Y can react with other elements to form molten-like W-Y-O and Y2Si2O7 particles. It is found that these two phases play a key role in the oxidation resistance of the alloys. When the Y content is in the range of 0~5.0 wt.%, a W-Y-O covering layer gradually forms with the increase of Y content, which can prevent further oxidation of the alloy. In the meantime, small Y2Si2O7 particles were formed and the microcracks formed around these particles were isolated, which have little effect on the oxidation resistance of the alloys. However, when Y content reaches 9.6 wt.%, large Y2Si2O7 particles and extensive cracks around them are formed. These cracks are interconnected to form penetrating channels for O2 from the environment to the alloy interior, which deteriorates the oxidation resistance of the alloys.

1. Introduction

Tungsten is a promising high-temperature material and can be used as some critical components, including heaters and shields of furnaces [1], rocket nozzles [2], spallation material in European Spallation Source (ESS) [3], and a candidate plasma-facing material in fusion reactors [4,5].
Although W has a high melting point, high strength, and low thermal expansion coefficient, its high-temperature oxidation resistance is poor. When the temperature reaches or exceeds 700 °C, W can be oxidized to WO3, which volatilizes rapidly, resulting in the damage of components composed of W [6,7,8,9]. Koch et al. proposed “W smart alloys” to improve its oxidation resistance, in which alloying elements can form a dense oxide scale on the surface, preventing W from oxidation and volatilization in accidental conditions [10]. In addition, they found W-Cr smart alloys exhibited excellent oxidation resistance because alloying element Cr could create a dense Cr2O3 layer on the surface of the alloy [10,11]. Therefore, W-Cr binary and ternary alloys have received much attention [12,13,14,15,16,17,18]. Recently, we prepared W-Si alloys and found they have good oxidation resistance [19]. The oxidation rate of W-Si at 1000 °C in the air was about two orders of magnitude lower than that of pure W, which was mainly due to the W5Si3 phase in the alloy. A dense WO3/SiOy composite layer was formed on the alloy surface through the in-situ reaction of W5Si3 with O2. However, the oxide layer at the top was porous because of the volatilization of tungsten oxide. Then, the Y element was introduced to further improve the oxidation resistance of the W-Si alloy [20]. It was found that a W-Y-O melt was formed, which could cover the pores and promote the sintering of oxides in the oxide layer, thus enhancing the oxidation resistance.
In our research, it was also found that the phase compositions and oxidation resistance of the W-Si-Y alloys were closely related to the Y content. Thus, in this investigation, the W-Si alloy doped with various Y contents were fabricated by MA and SPS. The composition, microstructure, and oxidation resistance properties of the W-Si-xY alloys were studied. The formation and evolution of the oxide film structure were investigated in detail, and the effect of Y content on the oxidation resistance at high temperature was revealed.

2. Experimental

W powder (99.9% purity, 1–5 µm), Si powder (99.9% purity, 1–5 µm), and Y powder (99.9 % purity, ~15 µm) were used as raw materials. The preparation process is based on our previous reports [20]. Specifically, the powders were weighed according to the stoichiometric ratios of W-6.7Si-xY (x = 0, 1.3, 2.6, 3.8, 5.0, 9.6 wt.%). These powders with ethanol (~5 wt.%) were sealed in stainless-steel vials. The vials were vacuumed and then pumped into high purity Ar gas. Next, the powders were mechanically milled for 4 h in a high-energy planetary ball mill (Nju Instrument, QM-3SP4, Nanjing, China) with the rotation speed 250 rpm. The ball-to-material weight ratio was 15:1 and the gradation of tungsten carbide balls was 1:3 (10 mm and 6 mm diameter, respectively). The as-milled powders were dried at 60 °C in vacuum oven for 24 h. Finally, the powders were sintered on the SPS equipment (SinterLand, LABOX-1575, Niigata, Japan). Bulk alloys were obtained at 1550 °C for 5 min with 50 MPa pressure in vacuum (5–10 Pa).
The as-sintered alloys were cut into 4 mm × 4 mm × 4 mm cubes by wire cutting. All the surfaces of these cubes were polished to 5 μm by using SiC paper and diamond suspension. Next, these cubes were immersed in ethanol, washed by ultrasonic for 10 min, and dried in a vacuum. During cyclic oxidation tests, the cubes were hanged with Φ 0.1 mm-Pt wires and oxidized at 1000 °C for 0~80 h in the air with a heating rate 10 °C/min (0 h means power was switched off when the temperature reached and stabilized at 1000 °C for 3 min). In each oxidation test, three parallel cubes were used. Their average mass changes were obtained by recording the weight of the cubes before and after oxidation using an electronic balance with an accuracy of 0.1 mg.
The phase compositions were determined by X-ray diffraction (XRD, X’pert-PRO, Almelo, The Netherlands), with Cu Kα at 40 kV and 30 mA. The chemical environment of Si and Y was identified by using X-ray photoelectron spectroscopy (XPS, AXIS-ULTRA DLD-600W, Tokyo, Japan). Morphologies and microstructures were observed by a field-emission scanning electron microscope (FE-SEM, Nova NanoSEM 450, Amsterdam, The Netherlands) equipped with energy dispersive X-ray Spectrometry (EDS) and a transmission electron microscope (TEM, Tecnai G2 F30, Amsterdam, The Netherlands), respectively. The TEM samples were processed by a focused ion beam system (FIB, Helios Nanolab G3 CX, Brno, Czech Republic).

3. Results and Discussion

3.1. Phases and Microstructures of As-Sintered Alloys

Figure 1 presents the XRD spectra of as-sintered alloys. The diffraction peaks for the W-Si-xY (x = 1.3~5.0) alloys are similar, so the spectra of W-Si-2.6Y and W-Si-3.8Y are not shown here. It can be seen from Figure 1a that all W-Si-xY alloys contained phases of W, W5Si3, and a small amount of SiO2. The formation of SiO2 is due to the reaction between Si and the residual oxygen in powders during sintering. As the Y content increased to 9.6 wt.%, small Y2O3 peaks were also observed. In addition, it can be observed from Figure 1b that the (110) diffraction peak of W shifted to a higher angle with the addition of Y, indicating that more Si (atomic radius 110 pm) and Y (180 pm) were dissolved in tungsten (135 pm).
The Si 2p and Y3d XPS spectra of the alloys were measured to identify the existence form of Si and Y. Figure 2a,b present the Si 2p XPS spectra of the W-Si and W-Si-9.6Y alloys, respectively. The peaks of Si 2p located at 101.9, 102.6 and 104.5 eV correspond to SiO, Si2O3, SiO2, respectively. The peak at 99.6 eV is related to Si-W bonding in W5Si3. The Si 2p XPS spectra of other W-Si-xY (x = 1.3~5.0) alloys are similar to those of W-Si and W-Si-9.6Y. It indicates that all the alloys contain W5Si3 and SiOx (x = 1, 1.5, 2).
Figure 2c–e gives the Y3d XPS spectra of the W-Si-xY alloys (x = 1.3, 5.0, 9.6). The Y3d peaks at 157.9 eV and 155.9 eV are related to Y. The peaks at 159.0 eV and 157.0 eV belong to Y2O3. The peaks at 160.2 eV and 158.2 eV correspond to Y-Si-O [21]. The results showed that all W-Si-Y alloys contained Y, Y2O3, and Y-Si-O. In addition, it can be observed that the content of Y-Si-O was higher than that of Y2O3 by comparing their peak areas in the W-Si-9.6Y alloy, as shown in Figure 2e. However, the Y2O3 was observed in the XRD pattern of W-Si-9.6Y alloy while Y-Si-O phase was absent (Figure 1). It can be inferred that Y-Si-O is amorphous.
The oxygen contents in the W-Si-xY powders were about 12,000 ppm, which was introduced mainly by a ball milling process. According to the calculation, when Y content exceeded 1.3 wt.%, all these O elements could react with Y to form Y2O3 because Y has a stronger affinity to O than Si. However, it was found that SiOx and Y-Si-O were formed in addition to Y2O3 in all W-Si-Y alloys. This is because the formation of Si-containing phases can be kinetic-related. Since the amount of Si (6.7 wt.%, equivalent to 32 at.% in the alloy) was much higher than that of yttrium (1.3~9.6 wt.%, equivalent to 2~16 at.%) and the diffusivity of Si is much higher than that of Y, especially during a solid phase sintering as SPS sintering, the reaction between Si and O had more chance to occur than that between Y and O, leading to the simultaneous formation of SiOx, Y2O3, and Y-Si-O. When the Y content increased to 9.6 wt.%, most of the oxygen could react with Y to form more Y2O3 and Y-Si-O phases.
The surface backscattered SEM (BSE-SEM) images of the alloys are manifested in Figure 3. All the as-fabricated alloys were mainly composed of the gray phase (marked A), the bright gray phase (marked B), and the black particles (marked C). The black particles were dispersed in the matrix. When the Y content reached and exceeded 2.6%, some large and irregular particles with light black contrast (marked D) appeared. The number of irregular particles (D) increased with the increase of Y content. The corresponding EDS compositions for each phase are listed in Table 1. Combining EDS, XRD, and XPS results, it can be concluded that the gray phase (A) is W5Si3, the bright gray phase (B) is W, and the irregular particles (D) are Y-Si-O. The black particles (C) are confirmed to be SiOx in the W-Si alloy, while they are SiOx and yttrium-rich oxides (Y2O3 and Y) in the W-Si-Y alloys. When the Y content reached 9.6 wt.%, the size of black particles, which was confirmed to be mostly yttrium-rich oxides, increased greatly. The ratios of various phases were obtained by counting the areas of corresponding phases in BSE-SEM images. The contents of W5Si3 (A), W (B), and oxide particles (C) in W-Si were about 59%, 26%, and 15%. The contents of phase W5Si3 (A), W (B), and oxide particles (C and D) in W-Si-xY (x = 1.3~5.0) were basically the same, ~70%, ~20%, and ~10%. However, when Y content reached 9.6 wt.%, the content of W (B) decreased to ~12% and the content of oxide particles (C and D) increased to ~18%. Sometimes C and D were difficult to distinguish, so they were counted together.

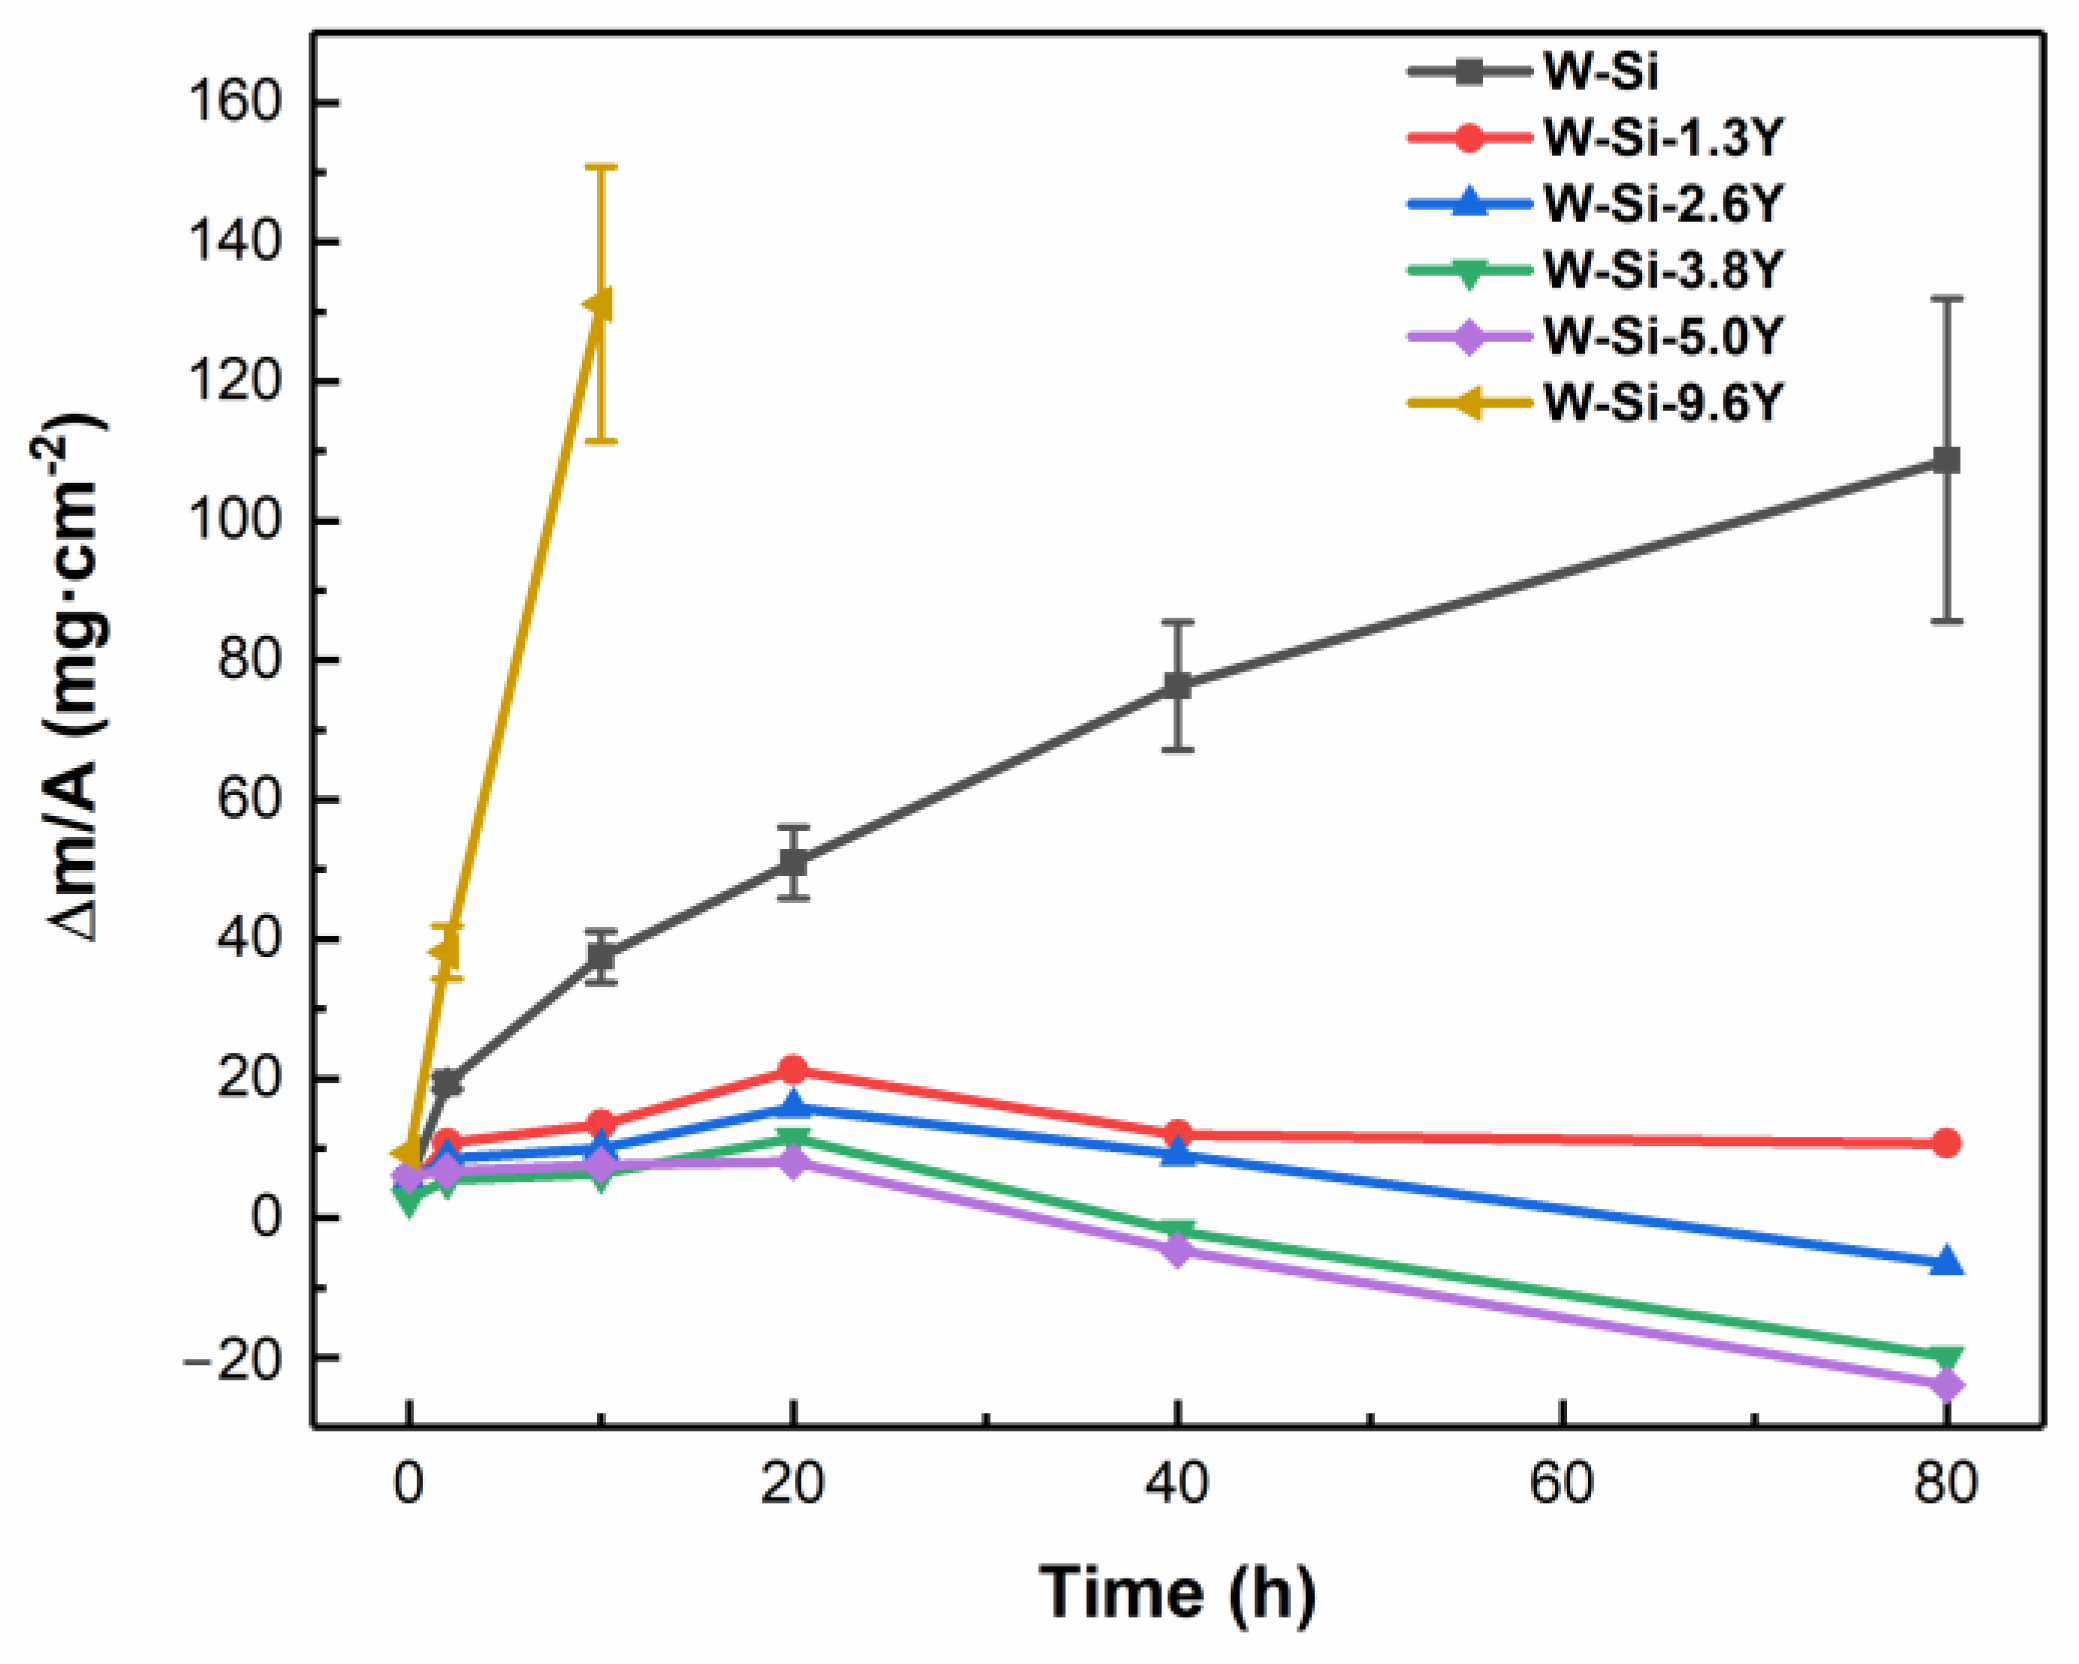
3.2. Oxidation Behavior

The macro morphology of W-Si-xY alloy after oxidation for different times is shown in Figure 4. The insert on the bottom right corner shows pure W oxidized for 2 h. Due to the tip thermal effects [22], the edges of all cubes were preferentially oxidized. The edge epitaxial growth of pure W oxidized for 2 h was serious and the cube was completely destroyed. The color of the sample was yellow, indicating that it was completely oxidized to pure WO3. The other W-Si-xY (x = 0~5.0 wt.%) alloys retained a cubic shape. The edge epitaxial growth of W-Si alloy became obvious with the oxidation time increased. When the oxidation time reached 40 h and above, the shape of the W-Si alloy was destroyed. On the contrary, the W-Si-xY (x = 1.3~5.0 wt.%) alloys exhibited good dimensional stability under the same oxidation conditions. Moreover, the higher the Y content, the more stable the size of the cube is. It was also observed that their surface shifted in colors of gray, violet, blue, and yellow with the oxidation time increasing, implying the presence of a range of nonstoichiometric oxides (WO3-x) [3]. However, when the Y content reached 9.6%, the alloy was severely oxidized after 2 h.
The above results show that adding appropriate amount of Y can greatly improve the high temperature oxidation resistance of W alloy.
Figure 5 shows the specific weight change of the W-Si-xY alloys oxidized for different times. The weight gains of W-Si alloy increased from 5.4 ± 0.8 to 108.7 ± 23.1 mg⋅cm−2, with an increase of oxidation time from 0 to 80 h, while the weight gains of W-Si-xY (x = 1.3~5.0) alloys increased firstly (0~20 h) and then decreased (20~80 h). The decrease is because the weight gain by oxidation was less than the weight loss by volatilization of tungsten oxides [20]. The weight gain of W-Si-9.6Y alloy increased rapidly. Since this alloy was destroyed after oxidation for 10 h, no further oxidation experiment was carried out. The oxidation rate of W-Si-xY alloys (x = 1.3~5.0) was found to be lower than that of W-Si by comparing these curves, especially in the case of long oxidation time. The average oxidation rates of W-Si-xY (x = 0~5.0) alloys before the occurrences of weight losses were 7.08 × 10⁻⁴ mg⋅cm−2⋅s−1 (W-Si), 2.95 × 10⁻⁴ mg⋅cm−2⋅s−1 (W-Si-1.3Y), 2.20 × 10⁻⁴ mg⋅cm−2⋅s−1 (W-Si-2.6Y), 1.59 × 10⁻⁴ mg⋅cm−2⋅s−1 (W-Si-3.8Y), 1.12 × 10⁻⁴ mg⋅cm−2⋅s−1 (W-Si-5.0Y). It is further shown that Y can improve the oxidation resistance of the W-Si alloy.

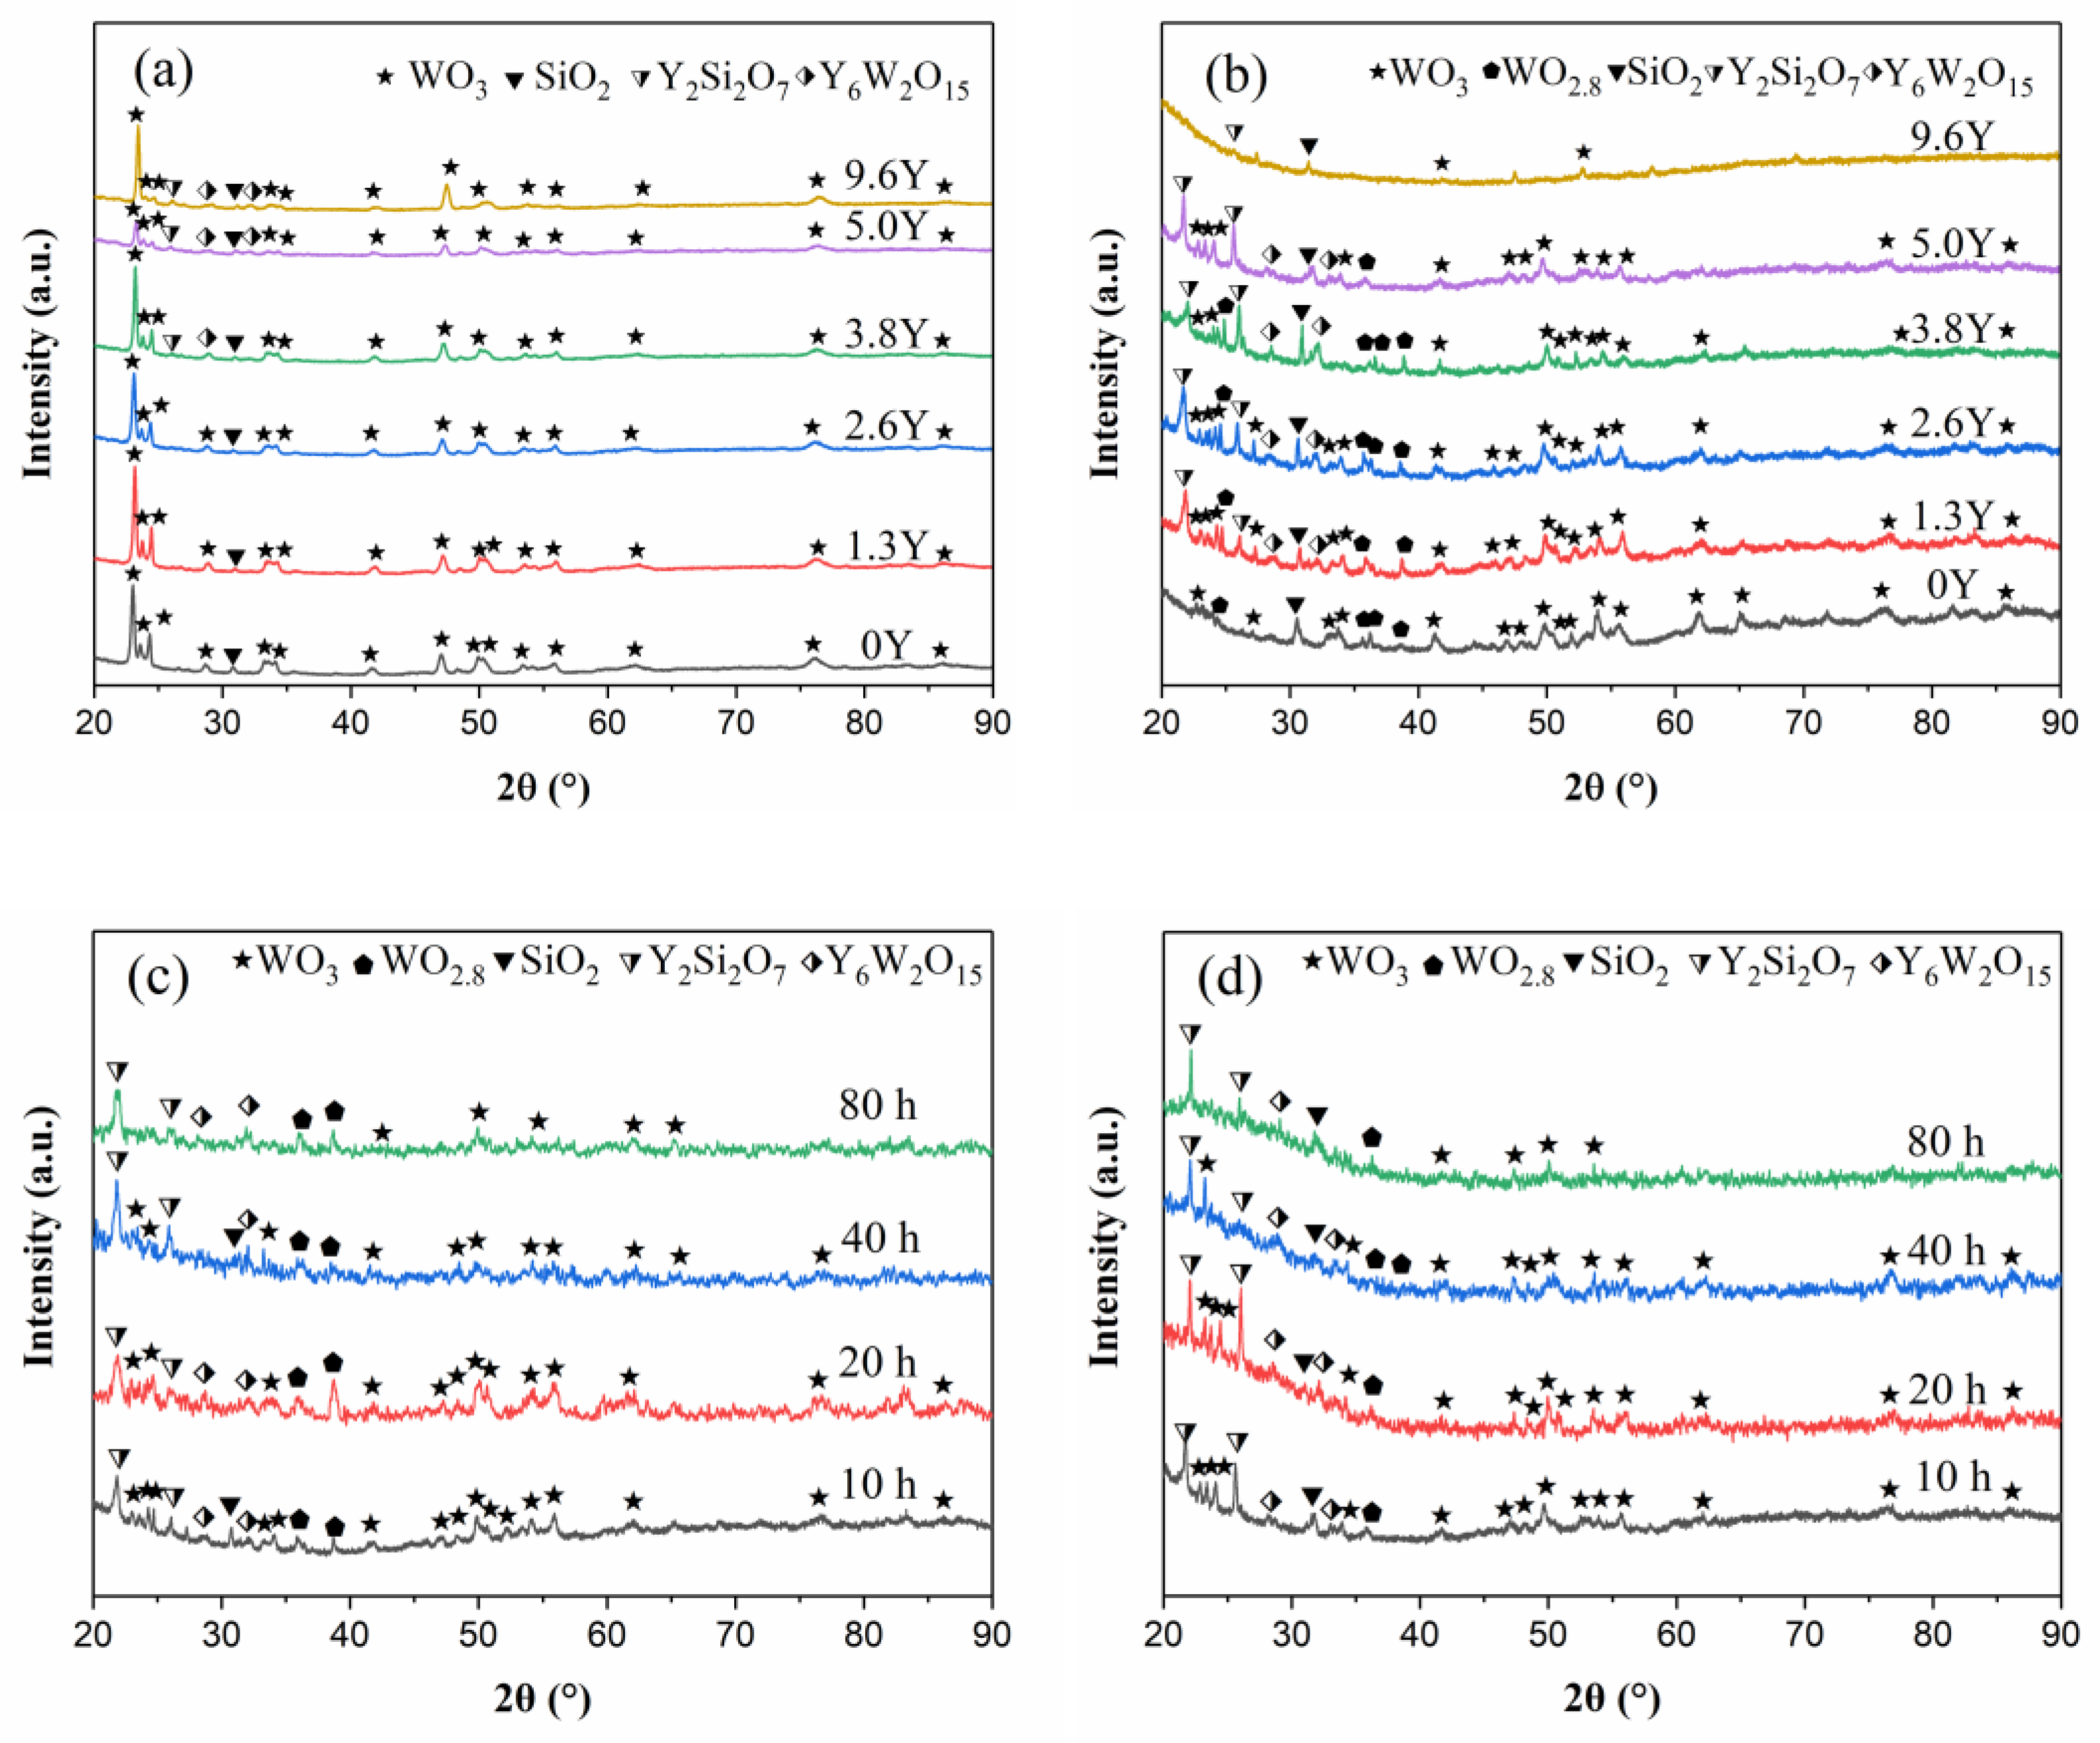
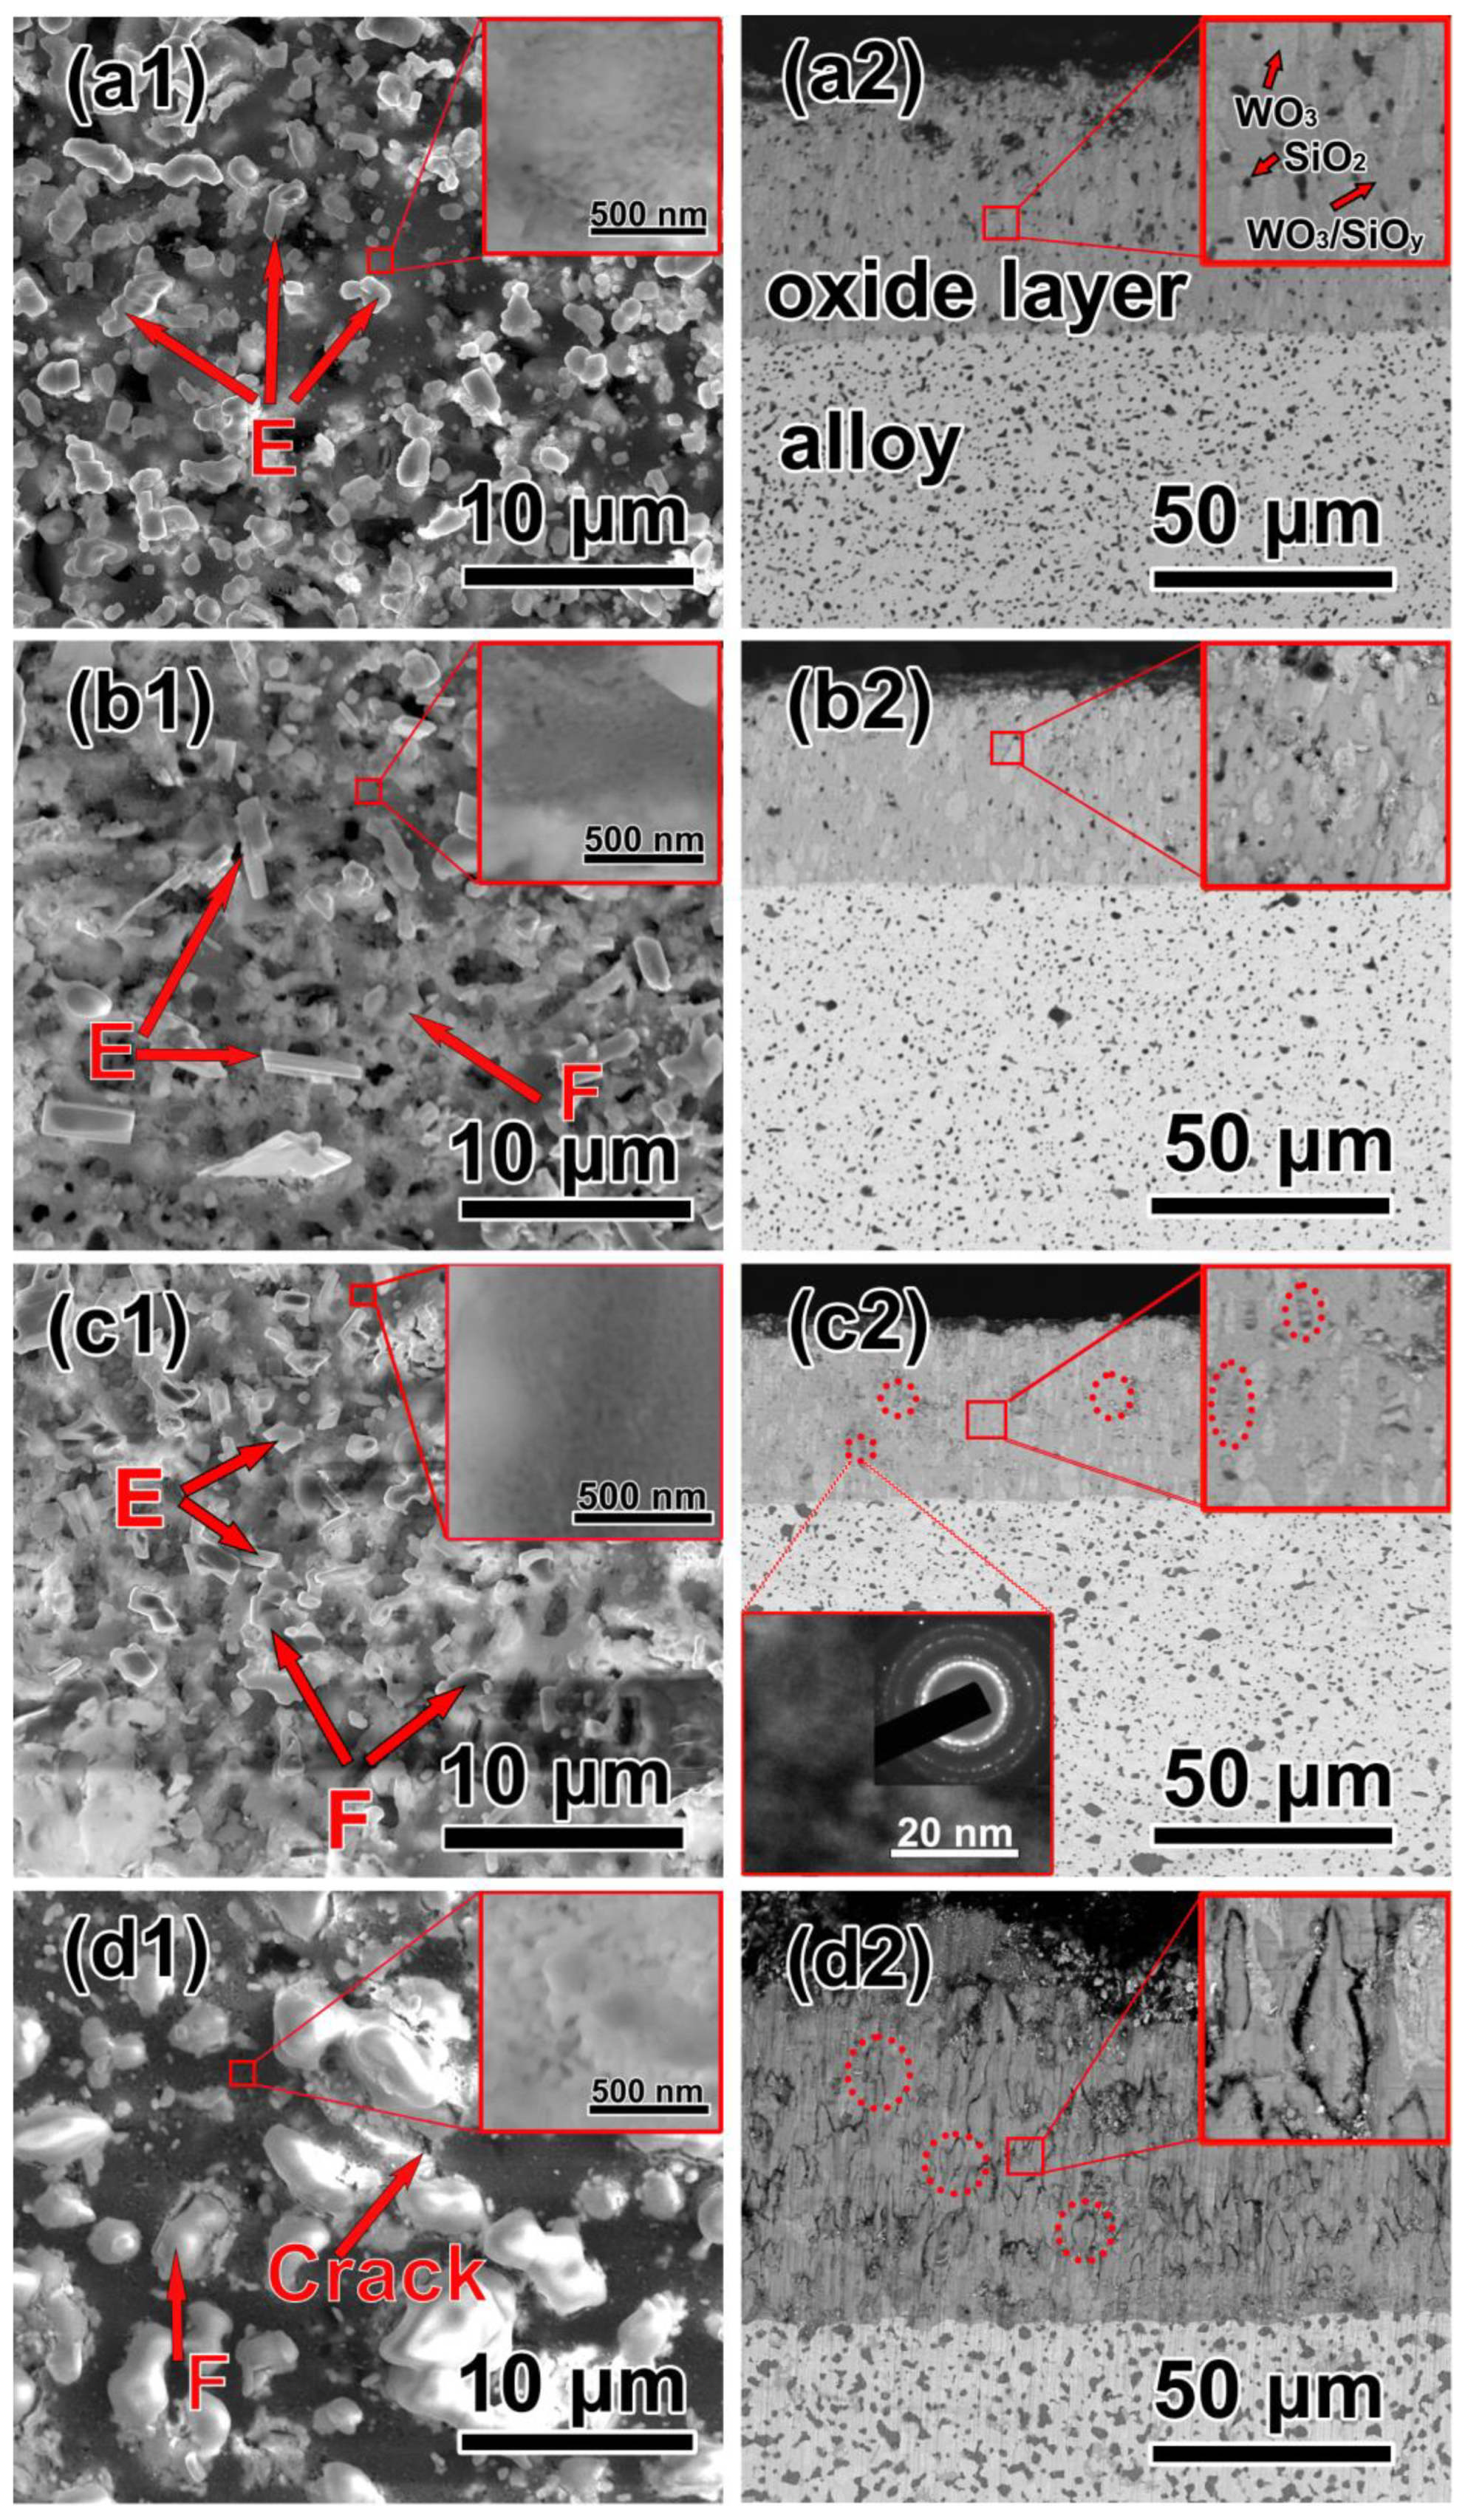
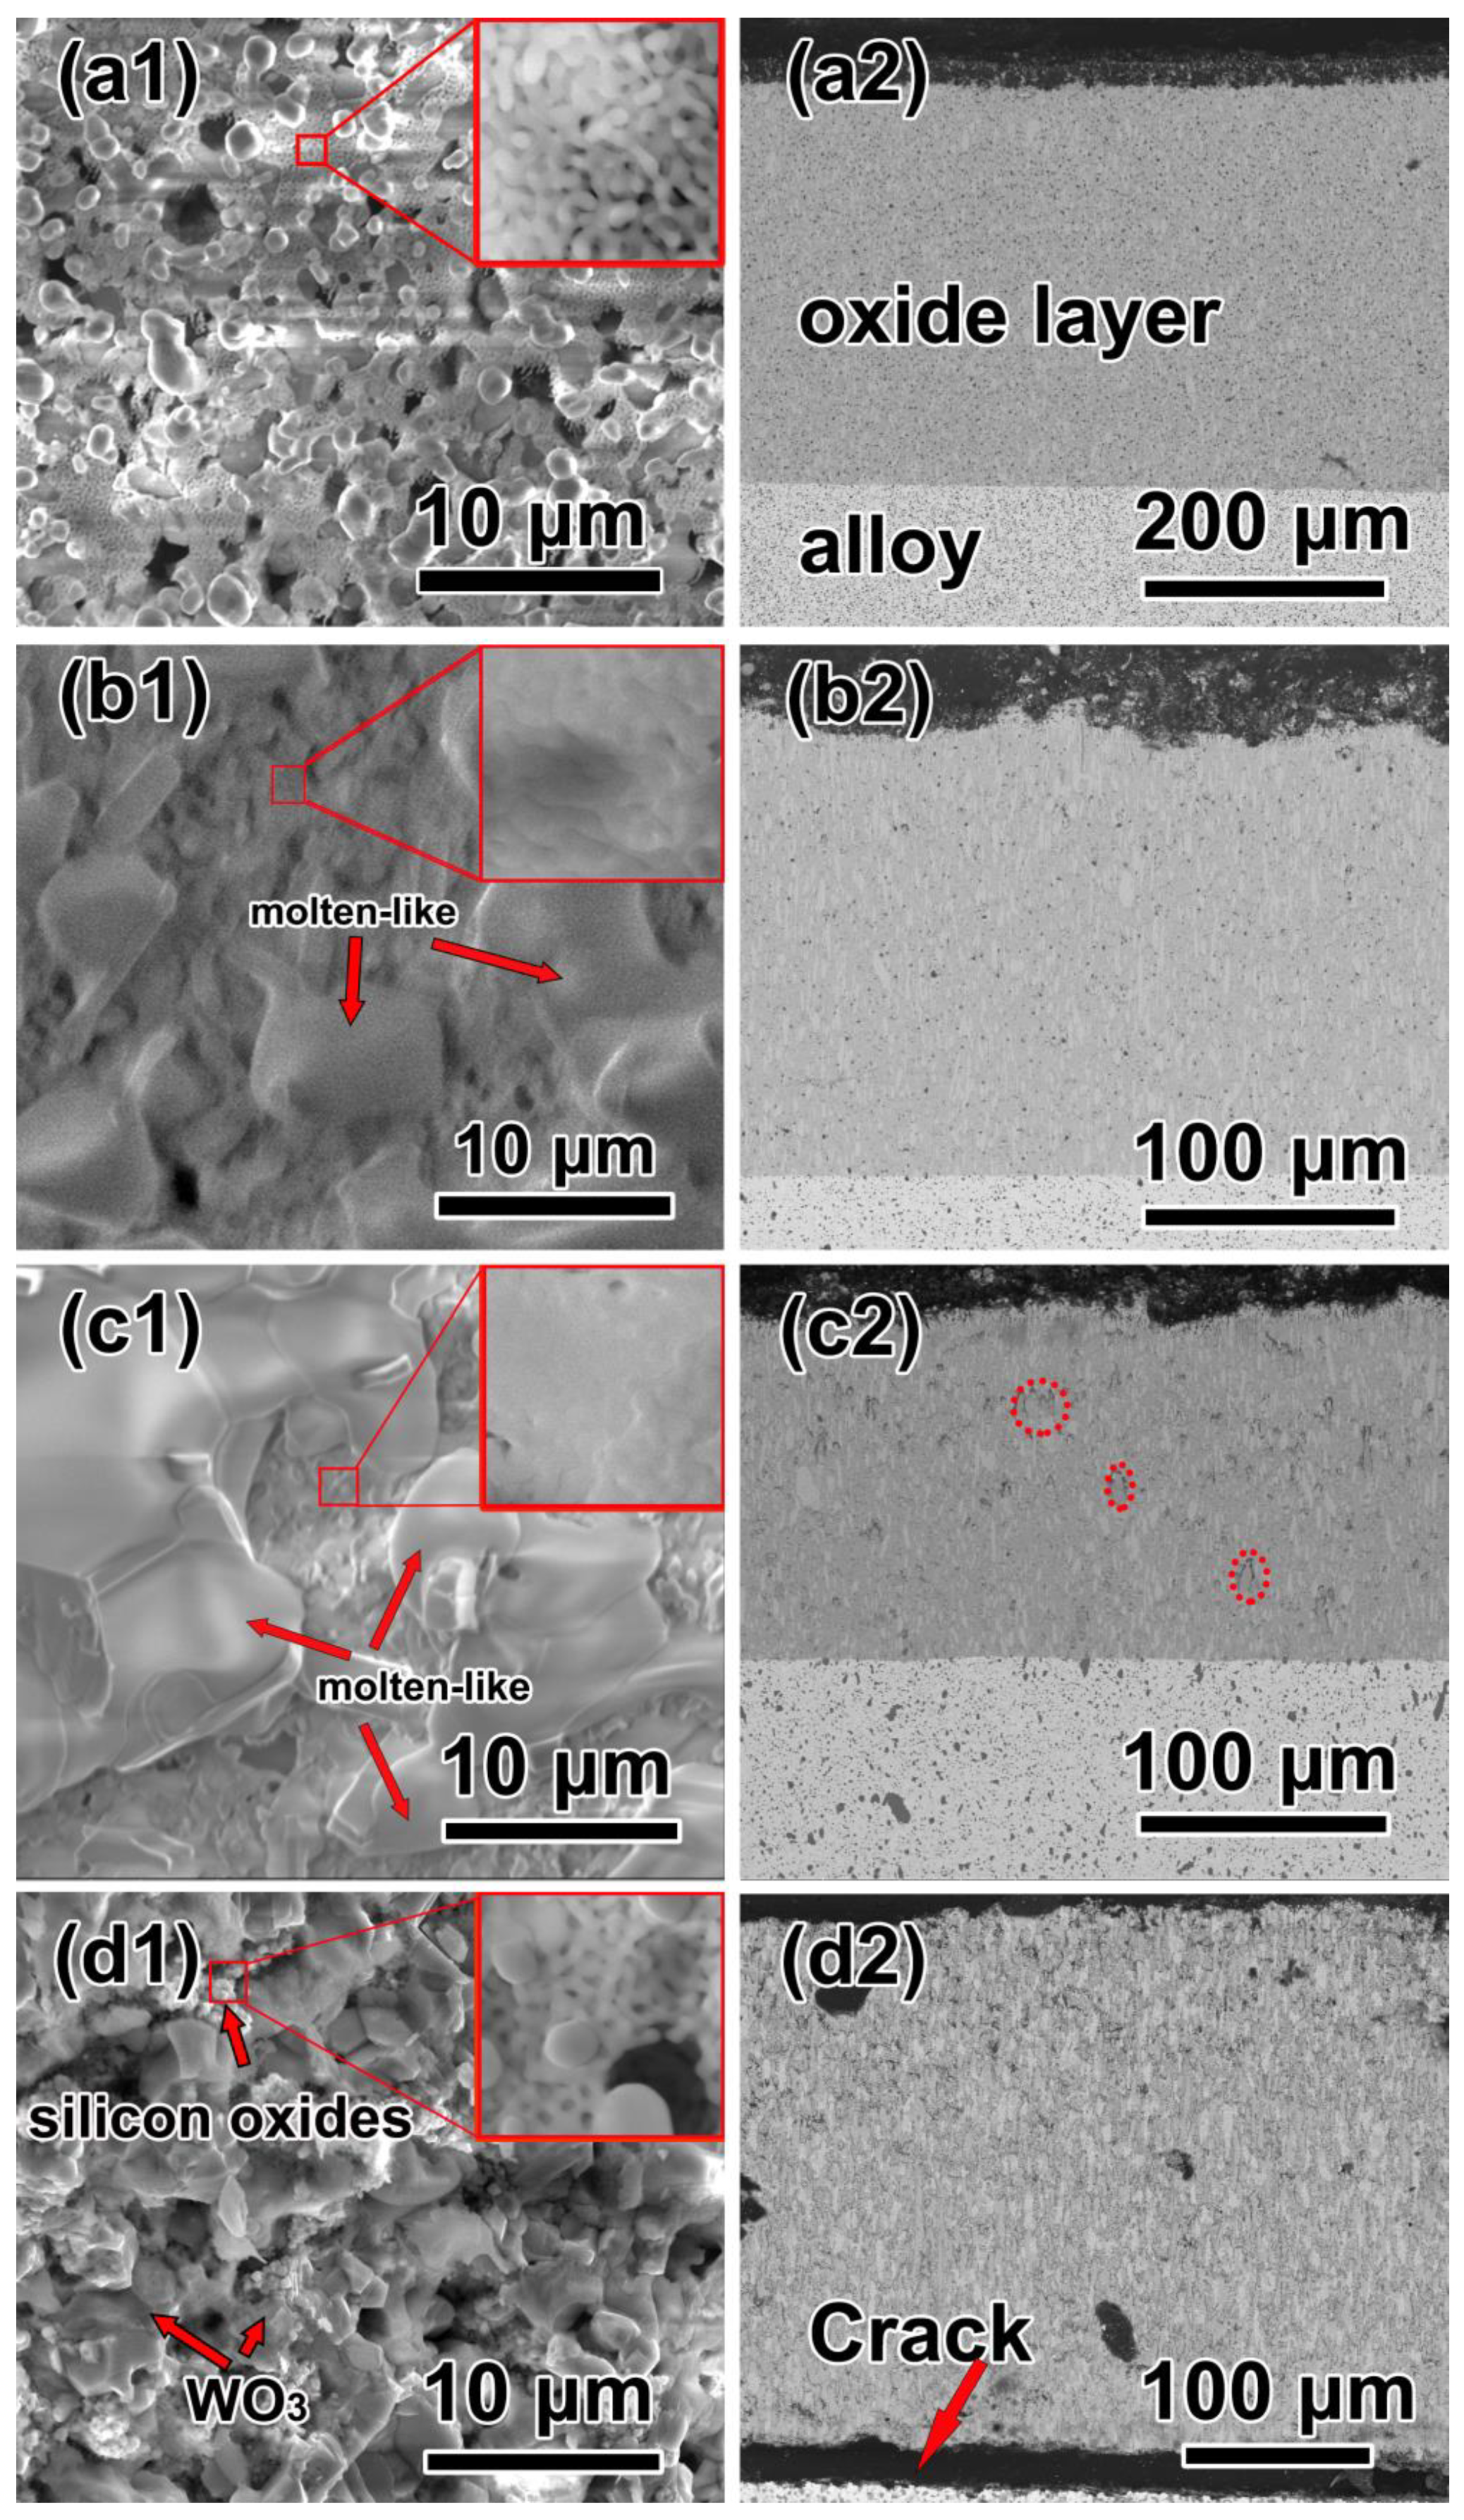
3.3. Phases and Microstructures of Oxidized Alloys

Figure 6a,b exhibit the XRD patterns of the surface of W-Si-xY alloys oxidized for different times. For the W-Si-xY alloys oxidized for 0 h, as shown in Figure 6a, it can be found that the surfaces of the alloys were mainly composed of WO3 and SiO2. When the Y content increased to 3.8% and above, Y2Si2O7 and Y6W2O15 phases were also detected. According to literature [23,24,25], Y2Si2O7 has excellent oxidation resistance at high temperatures because of its low thermal expansion coefficient (3.90 × 10⁻⁶ K−1), volatilization rate, and oxygen permeability. As shown in Figure 6b, Y2Si2O7 and Y6W2O15 phases can be found in the W-Si-xY (x = 1.3~5.0) alloys with the increase of the oxidation time to 10 h. Compared with the alloys oxidized for 0 h, the diffraction peak intensity of Y2Si2O7 increased obviously and that of WO3 decreased, which indicates the Y2Si2O7 formation and growth and the WO3 volatilization. In the W-Si-9.6Y alloy oxidized for 10 h, weak WO3, SiO2, Y2Si2O7, and unknown phase peaks were found, suggesting that the structure of surface oxide scale changed.
Figure 6c,d show the XRD patterns of the surface of W-Si-1.3Y and W-Si-5.0Y alloys oxidized at 1000 °C for 10~80 h, respectively. The XRD patterns of W-Si-2.6Y and W-Si-3.8Y are very similar to W-Si-5.0Y, so they are not shown here. These two XRD patterns show that their phases were the same. All the samples contained WO3, SiO2, Y2Si2O7, and Y6W2O15. The intensity of the WO3 diffraction peaks decreased with the increase of oxidation time, indicating that WO3 continued to volatilize.
Figure 7a1–d1 displays surface SEM images of W-Si-xY alloys oxidized for 0 h. For the oxidized W-Si alloy, as presented in Figure 7a1, there were isolated particles (marked E) with the average size of 2.5 μm on the surface of the oxide layer. The inset is the high-magnification image of the red rectangle of the oxide layer, which exhibited a nano-porous structure. The surface microstructure of the oxidized W-Si-Y alloys (Figure 7b1–d1) is similar to the oxidized W-Si alloy. The oxide layers also exhibited nano-porous structures (see the insets), where many particles were dispersed. These phases have been discussed in our report [19,20]. The oxide layer was WO3(polycrystalline)/SiOy (amorphous) composite oxides. The nano-porous oxide layer was formed because of the evaporation of WO3 particles in the WO3/SiOy composite. The E particles in the oxidized W-Si alloy were confirmed to be W-Fe-O oxides and had no effect on the oxidation resistance of the alloys. Fe was introduced from wear debris of the vial, and its content was 0.19~0.25 wt.% in W-Si-xY powders by XRF. The particles in the W-Si-Y alloys were composed of the rod-shaped W-Fe-O (marked E) and molten-like Y-W-O (marked F). With the increase of Y content, the number of molten-like Y-W-O particles increased and the shape tended to be spherical. For the oxidized W-Si-9.6Y alloy, there were many micron-level cracks around the particles in the oxide layer, which were not found in other alloys.
Figure 7a2–d2 shows the corresponding cross-section BSE-SEM image of the oxidized W-Si-xY alloys. The insets are the enlarged images of the red rectangles. The oxide scale thickness of the alloys is listed in Table 2. As the addition of Y and its content increased, the oxide layer thickness decreased firstly and then increased. The oxide layer thickness of W-Si-3.8Y alloy was the smallest, about 38.1 μm, while that of W-Si-9.6Y alloy was 80.3 μm, which was thicker than that of W-Si alloy (53.3 μm).
For the oxidized W-Si alloy, as shown in Figure 7a2, the bright gray phases in the oxide layer were oriented WO3 grains, which originated from the oxidation of W grains in the alloy. The dark gray phases were WO3/SiOy composites formed by the oxidation of W5Si3 phases. The black SiO2 particles came from the further oxidation of SiOxin the alloy. The details have been discussed in the report [19]. The SiO2 particles, oriented WO3 grains, and WO3/SiOy composite were also observed in the oxide layer of all the W-Si-Y alloys. However, the content of black SiO2 particles decreased with the increase of Y. Additionally, some phases with black edges marked by red dotted circles appeared in the oxide scale, as shown in Figure 7c2. These phases were also observed by HRTEM and found to contain nanoparticles, as shown in the inset. The corresponding SAED pattern indicated they consisted of Y2Si2O7, so these phases were confirmed to be Y2Si2O7 aggregates, which have been also discussed in the report [20]. The black edges were cracks due to the separation of Y2Si2O7 aggregates and WO3/SiOy composite. This phenomenon shows that there is a difference in thermal expansion between the Y2Si2O7 and WO3/SiOy composite oxide layer. With the Y content increasing, more and larger Y2Si2O7 phases were generated, and more interface separation occurred, especially in W-Si-9.6Y alloy (Figure 7d2). If these micro-cracks are isolated, they have little effect on the oxidation resistance of the alloy. When these micro-cracks penetrate each other, the oxygen in the atmosphere will penetrate into the matrix through these cracks. It can be observed that there were many through cracks in the oxidized W-Si-9.6Y alloy, and the crack width was approximately 145.7 nm. These penetrating cracks resulted in an inferior oxidation resistance of W-Si-9.6Y alloy to W-Si alloy.
Figure 8a1–d1 shows surface SEM images of the W-Si-xY (x = 0, 1.3, 3.8) alloys oxidized at 1000 °C for 10 h and W-Si-9.6Y at 1000 °C for 2 h. The insets are the enlarged images of the part of the oxide layer marked by the red rectangle. Compared with the alloys oxidized for 0 h, the pore size of the nano-porous layer in the oxidized W-Si alloy for 10 h became large because WO3 continued to volatilize with the extension of oxidation time. For the oxidized W-Si-1.3Y and W-Si-3.8Y alloys, the amount and size of molten-like Y-W-O particles increased with the oxidation time and Y content. Especially for W-Si-3.8Y, the surface of oxidized alloys was almost completely covered by a continuous Y-W-O layer. It was found that the nano-porous structure near the molten-like particles (the insets in Figure 8b1,c1) was dense, indicating that the molten particles helped to close the pores by covering the pores and promote the sintering of oxides in the oxide layer. On the surface of the oxidized W-Si-9.6Y alloy (Figure 8d1), the continuous WO3/SiOy composite oxide layer was not observed. The oxide layer was broken into pieces and mixed with oxide particles. The compositions of these oxide particles were analyzed by EDS. Combined with the EDS and the above XRD, it was speculated that they were tungsten oxides and silicon oxides.
Figure 8a2–d2 shows the corresponding cross-section BSE-SEM image of the oxidized W-Si-xY alloys. Compared with the alloys oxidized for 0 h, the thickness of the oxide scale for all the alloys increased, as shown in Table 2. Y2Si2O7 aggregated in the same component alloys marked by red dotted circles increased with the extension of oxidation time. When the W-Si-9.6Y alloy was oxidized at 1000 °C for 2 h, many Y2Si2O7 aggregated and cracks were observed, which resulted in part of the oxide layer being separated from the alloy (Figure 8d2) and destruction of the cube (as shown in Figure 4).
Figure 9 exhibits the cross-section BSE-SEM image of the oxidized W-Si-3.8Y alloy at 1000 °C for 10~80 h. The thickness of the oxide scale is increased from 147.9 to 249.1 μm with the extension of time from 10 to 80 h. The thickness of oxide layers of other alloys vs. time is also shown in Table 2. There was a thin (about several microns) loose oxide layer (marked by red line) near the surface, which increased with the extension of oxidation time. From the enlarged image (the inset in Figure 9a,d), it can be observed that there was a dense layer on the outermost surface, which was the molten-like W-Y-O layer. Thus, from the surface to the inside, the oxide layer was divided into three layers: dense molten-like W-Y-O layer, loose WO3/SiOy composite oxide layer, and dense WO3/SiOy composite oxide layer. This dense molten-like oxide layer also existed on the surface of the oxidized W-Si-2.6Y and W-Si-5.0Y alloys, but it was not found in the oxidized W-Si-1.3Y and W-Si-9.6Y alloys. This is because the number of molten-like particles generated in W-Si-1.3Y alloy is too small to form a continuous W-Y-O layer. There were many cracks in the oxide layer of W-Si-9.6Y alloy, and the melt could penetrate into these cracks, thus a continuous W-Y-O layer was difficult to form.
In addition, it is worth mentioning that with the extension of oxidation time, the thickness of the molten-like dense layer changed minimally, but that of loose oxide layer increased. The XRD (Figure 6c,d) patterns also show that the amount of Y6W2O15 did not change significantly from 10 to 80 h. It can be speculated that the W-Y-O layer may be in a dynamic equilibrium during the long-term oxidation process at 1000 °C, that is, it continuously decomposes and releases WO3 into the air and absorbs WO3 from the following composite oxide layer to form molten materials. Therefore, the thickness of the molten-like layer does not change significantly, but the thickness of the loose layer below increases. There are minimal reports on the volatility of W-Y-O oxides, and their stability needs further study.

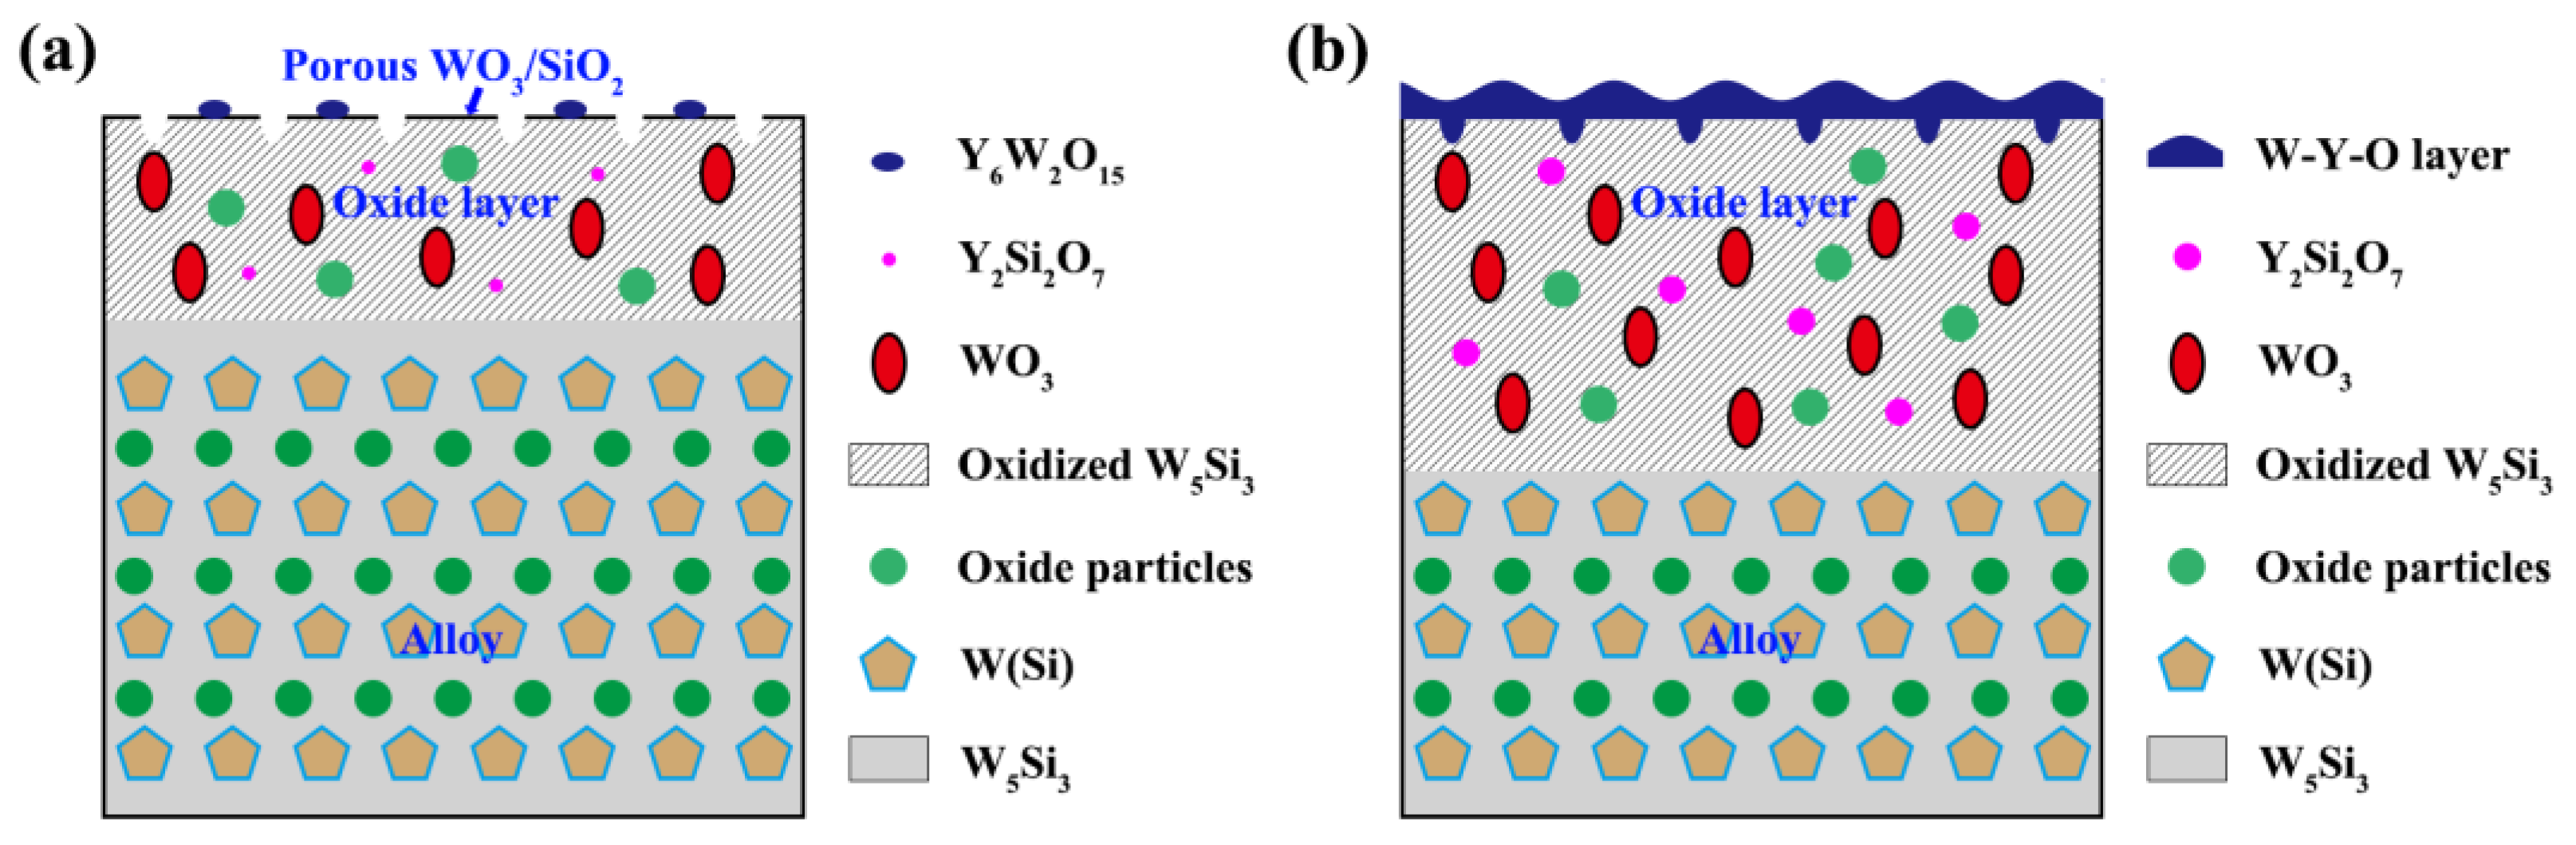
3.4. Oxidation Resistance Mechanism

Based on the above results and previous studies [20], the effect of Y content on the oxidation resistance of W-Si-Y can be clarified. The molten-like W-Y-O particles and Y2Si2O7 play a key role in the oxidation resistance of the alloys.
Figure 10 shows the schematic diagram of oxidation process. In the initial stage of oxidation, as shown in Figure 10a, W grains and W5Si3 phases on the surface of the alloys would be oxidized into oriented WO3 grains and WO3/SiOy composite oxide layer, respectively. With the volatilization of WO3 near the surface, the composite oxide layer close to the surface forms a nano-porous structure. Meanwhile, Y2Si2O7 and molten-like particles containing Y6W2O15 are formed.
The molten-like particles increased, and a W-Y-O covering layer gradually formed with the Y content increasing and oxidation time extending, as shown in Figure 10b. The molten particles can fill or close the pores by sintering and viscoplastic flow and hinder the inward diffusion of oxygen into the alloys. Therefore, with the increase of Y content, the oxidation resistance of the alloys was improved. However, during the oxidation process, Y2Si2O7 particles also grow. Because of different thermal expansion of Y2Si2O7 and WO3/SiOy composite, cracks appear around Y2Si2O7 particles. For the alloys with 1.3~5.0 wt.% Y addition, the size and number of Y2Si2O7 particles are small, so there exists a small number of cracks. These cracks are isolated and do not form penetrating cracks, which have little effect on the oxidation resistance of the alloys. When the Y addition is increased to 9.6 wt.%, there are many large Y2Si2O7 particles and cracks in the alloy. These cracks are interconnected to form penetrating channels for O2 from the environment to the alloy interior. The Y6W2O15 phase is not enough to fill these cracks or channels, so the oxidation resistance of the alloy is greatly deteriorated.

4. Conclusions

A series of self-passivating W-Si-xY alloys were prepared by SPS. The effect of Y on the oxidation resistance was revealed. It is found that oxidation resistance of W-Si-xY alloys is improved by adding appropriate amount of Y (x = 1.3~5.0 wt.%). With the extension of oxidation time, a three-layer oxide scale is formed on the surface of the alloy. From the surface to the inside, the oxide layer is composed of dense molten-like W-Y-O layer, loose WO3/SiOy composite oxide layer, and dense WO3/SiOy composite oxide layer. The dense W-Y-O layer can prevent the further oxidation of the alloy and effectively improve its oxidation resistance. At the same time, Y2Si2O7 particles are formed in the oxidation process, and they can cause micro-cracks because of their different thermal expansion with WO3/SiOy composite oxide layer. These cracks are isolated and have little effect on the oxidation resistance of the alloys. When the addition of Y is small, the molten-like W-Y-O particles generated in the alloy are too few to form a continuous W-Y-O layer. When too much Y is added, many Y2Si2O7 particles are formed, causing many cracks in the alloy. These cracks are interconnected to form penetrating channels for O2 from the environment to the alloy interior, which deteriorates the oxidation resistance of the alloys.

Author Contributions

Conceptualization, C.Y. and L.X.; methodology, W.L.; investigation, C.Y., S.C. and W.L.; resources, S.C., W.L. and L.X.; writing—original draft preparation, C.Y. and L.X.; writing—review and editing, C.Y. and L.X.; visualization, C.Y.; supervision, L.X., S.Y. and Y.Y.; project administration, L.X., S.Y. and Y.Y.; funding acquisition, Y.Y. All authors have read and agreed to the published version of the manuscript.

Funding

This research was funded by the National MCF Energy R&D Program, grant number 2018YFE0306104.

Data Availability Statement

The data used to support the findings of this study are available from the corresponding author upon request.

Acknowledgments

The authors thank the help from analytical and testing center in Huazhong University of Science and Technology.

Conflicts of Interest

The authors declare no conflict of interest.

References

  1. Rieth, M.; Doerner, R.; Hasegawa, A.; Ueda, Y.; Wirtz, M. Behavior of tungsten under irradiation and plasma interaction. J. Nucl. Mater. 2019, 519, 334–368. [Google Scholar] [CrossRef]
  2. Wang, Y.; Peng, H.-X.; Zhou, Y.; Song, G.-M. Influence of ZrC content on the elevated temperature tensile properties of ZrCp/W composites. Mater. Sci. Eng. A 2011, 528, 1805–1811. [Google Scholar] [CrossRef]
  3. Habainy, J.; Iyengar, S.; Surreddi, K.B.; Lee, Y.; Dai, Y. Formation of oxide layers on tungsten at low oxygen partial pressures. J. Nucl. Mater. 2017, 506, 26–34. [Google Scholar] [CrossRef]
  4. Maisonnier, D.; Campbell, D.; Cook, I.; Di Pace, L.; Giancarli, L.; Hayward, J.; Puma, A.L.; Medrano, M.; Norajitra, P.; Roccella, M.; et al. Power plant conceptual studies in Europe. Nucl. Fusion 2007, 47, 1524–1532. [Google Scholar] [CrossRef]
  5. Neu, R.; Bobkov, V.; Dux, R.; Kallenbach, A.; Pütterich, T.; Greuner, H.; Gruber, O.; Herrmann, A.; Hopf, C.; Krieger, K.; et al. Final steps to an all tungsten divertor tokamak. J. Nucl. Mater. 2007, 363–365, 52–59. [Google Scholar] [CrossRef] [Green Version]
  6. Kellett, E.A.; Rogers, S.E. The Structure of Oxide Layers on Tungsten. J. Electrochem. Soc. 1963, 110, 502. [Google Scholar] [CrossRef]
  7. Fu, T.; Cui, K.; Zhang, Y.; Wang, J.; Shen, F.; Yu, L.; Qie, J.; Zhang, X. Oxidation protection of tungsten alloys for nuclear fusion applications: A comprehensive review. J. Alloys Compd. 2021, 884, 161057. [Google Scholar] [CrossRef]
  8. Romanyuk, A.; Melnik, V.; Oelhafen, P. Oxidation of tungsten surface with reactive oxygen plasma. Nucl. Instruments Methods Phys. Res. Sect. B Beam Interactions Mater. Atoms 2005, 232, 358–361. [Google Scholar] [CrossRef]
  9. Cifuentes, S.C.; Monge, M.A.; Pérez, P. On the oxidation mechanism of pure tungsten in the temperature range 600–800 °C. Corros. Sci. 2012, 57, 114–121. [Google Scholar] [CrossRef] [Green Version]
  10. Koch, F.; Bolt, H. Self passivating W-based alloys as plasma facing material for nuclear fusion. Phys. Scr. 2007, T128, 100–105. [Google Scholar] [CrossRef]
  11. Calvo, A.; García-Rosales, C.; Koch, F.; Ordás, N.; Iturriza, I.; Greuner, H.; Pintsuk, G.; Sarbu, C. Manufacturing and testing of self-passivating tungsten alloys of different composition. Nucl. Mater. Energy 2016, 9, 422–429. [Google Scholar] [CrossRef] [Green Version]
  12. Vilémová, M.; Illková, K.; Lukáč, F.; Matějíček, J.; Klečka, J.; Leitner, J. Microstructure and phase stability of W-Cr alloy prepared by spark plasma sintering. Fusion Eng. Des. 2018, 127, 173–178. [Google Scholar] [CrossRef]
  13. Hou, Q.Q.; Huang, K.; Luo, L.M.; Tan, X.Y.; Zan, X.; Xu, Q.; Zhu, X.Y.; Wu, Y.C. Microstructure and its high temperature oxi-dation behavior of W-Cr alloys prepared by spark plasma sintering. Materialia 2019, 6, 100332. [Google Scholar] [CrossRef]
  14. Wegener, T.; Klein, F.; Litnovsky, A.; Rasinski, M.; Brinkmann, J.; Koch, F.; Linsmeier, C. Development of yttrium-containing self-passivating tungsten alloys for future fusion power plants. Nucl. Mater. Energy 2016, 9, 394–398. [Google Scholar] [CrossRef] [Green Version]
  15. Litnovsky, A.; Wegener, T.; Klein, F.; Linsmeier, C.; Rasinski, M.; Kreter, A.; Tan, X.; Schmitz, J.; Coenen, J.W.; Mao, Y.; et al. New oxidation-resistant tungsten alloys for use in the nuclear fusion reactors. Phys. Scr. 2017, T170, 014012. [Google Scholar] [CrossRef]
  16. Tan, X.; Klein, F.; Litnovsky, A.; Wegener, T.; Schmitz, J.; Linsmeier, C.; Coenen, J.; Breuer, U.; Rasinski, M.; Li, P.; et al. Evaluation of the high temperature oxidation of W-Cr-Zr self-passivating alloys. Corros. Sci. 2019, 147, 201–211. [Google Scholar] [CrossRef]
  17. Laaziz, Z.; Guennoun, A.; Fechtal, I.; Moultif, R.; Salama, L.; Dezairi, A. Monte Carlo simulations of pure tungsten and advanced “smart” tungsten alloys under helium bombardment for future fusion power plants. Surf. Interface Anal. 2021, 53, 876–883. [Google Scholar] [CrossRef]
  18. Litnovsky, A.; Klein, F.; Tan, X.; Ertmer, J.; Coenen, J.W.; Linsmeier, C.; Gonzalez-Julian, J.; Bram, M.; Povstugar, I.; Morgan, T.; et al. Advanced Self-Passivating Alloys for an Application under Extreme Conditions. Metals 2021, 11, 1255. [Google Scholar] [CrossRef]
  19. Liu, W.; Di, J.; Zhang, W.; Xue, L.; Yan, Y. Oxidation resistance behavior of smart W-Si bulk composites. Corros. Sci. 2020, 163, 108222. [Google Scholar] [CrossRef]
  20. Yi, G.; Liu, W.; Ye, C.; Xue, L.; Yan, Y. A self-passivating W-Si-Y alloy: Microstructure and oxidation resistance behavior at high temperatures. Corros. Sci. 2021, 192, 109820. [Google Scholar] [CrossRef]
  21. Chambers, J.J.; Parsons, G.N. Yttrium silicate formation on silicon: Effect of silicon peroxidation and nitridation on interface reaction kinetics. Appl. Phys. Lett. 2000, 77, 2385. [Google Scholar] [CrossRef]
  22. Gulbransen, E.A.; Andrew, K.F. Kinetics of the oxidation of pure tungsten from 500 °C to 1300 °C. J. Electrochem. Soc. 1960, 107, 619–628. [Google Scholar] [CrossRef]
  23. Fukuda, K.; Matsubara, H. Anisotropic thermal expansion in yttrium silicate. J. Mater. Res. 2003, 18, 1715–1722. [Google Scholar] [CrossRef]
  24. Huang, J.F.; Li, H.J.; Zeng, X.R.; Li, K.Z. Yttrium silicate oxidation protective coating for SiC coated carbon/carbon compo-sites. Ceram. Int. 2006, 32, 417–421. [Google Scholar] [CrossRef]
  25. Aparicio, M.; Durán, A. Yttrium Silicate Coatings for Oxidation Protection of Carbon-Silicon Carbide Composites. J. Am. Ceram. Soc. 2000, 83, 1351–1355. [Google Scholar] [CrossRef]
Figure 1. XRD spectra of as-sintered W-Si-xY alloys: (a) 2θ = 20–90°, (b) 2θ = 39–42°.
Metals 12 02040 g001
Figure 2. Si 2p XPS spectra of (a) W-Si and (b) W-Si-9.6Y. Y 2p XPS spectra of (c) W-Si-1.3Y, (d) W-Si-5.0Y, (e) W-Si-9.6Y. The solid lines are the as-recorded data. The dotted lines show various oxidation states of Si and Y.
Metals 12 02040 g002
Figure 3. Surface BSE-SEM images of the W-Si-xY alloys: (a) 0Y, (b) 1.3Y, (c) 2.6Y, (d) 3.8Y, (e) 5.0Y, (f) 9.6Y.
Metals 12 02040 g003
Figure 4. The macro morphology of the W-Si-xY alloys oxidized at 1000 °C for different times. Reprinted with permission from ref. [20]. Copyright 2021 Copyright Corrosion Science.
Metals 12 02040 g004
Figure 5. Specific weight change of the W-Si-xY alloys oxidized at 1000 °C for different times. Reprinted with permission from ref. [20]. Copyright 2021 Copyright Corrosion Science.
Metals 12 02040 g005
Figure 6. XRD patterns of W-Si-xY alloys after oxidation at 1000 °C for (a) 0 h and (b) 10 h. XRD patterns of (c) W-Si-1.3Y and (d) W-Si-5.0Y alloy after oxidation at 1000 °C for different times.
Metals 12 02040 g006
Figure 7. Images of W-Si-xY alloys oxidized at 1000 °C for 0 h: (a) 0Y, (b) 1.3Y, (c) 3.8Y, (d) 9.6Y, in which (1) are Surface SEM images and (2) are cross-section BSE-SEM images.
Metals 12 02040 g007
Figure 8. Images of W-Si-xY alloys oxidized at 1000 °C for 10 h: (a) 0Y, (b) 1.3Y, (c) 3.8Y. (d) W-Si-9.6Y oxidized at 1000 °C for 2 h. (1) are Surface SEM images and (2) are cross-section BSE-SEM images.
Metals 12 02040 g008
Figure 9. Cross-section BSE-SEM images of W-Si-3.8Y alloys oxidized at 1000 °C for different times: (a) 10 h, (b) 20 h, (c) 40 h, (d) 80 h.
Metals 12 02040 g009
Figure 10. Schematic diagrams of oxidation process: (a) initial stage (b) late stage.
Metals 12 02040 g010
Table 1. EDS compositions of the W-Si-xY alloys in Figure 3.
AlloysPositionCompositions/at %Major Phase
WSiYO
W-SiA66.7333.27--W5Si3
B97.242.76--W
C6.3433.25-60.41SiOx
W-Si-5.0YA65.1534.85--W5Si3
B100---W
C110.7725.7519.9243.55SiOx, Y2O3
C27.517.3733.9651.16Y-rich oxides
D1.8125.0428.0145.14Y-Si-O
W-Si-9.6YC--49.5250.48Y-rich oxides
D-32.7428.1539.11Y-Si-O
Table 2. The thickness of W-Si-xY alloys oxidized at 1000 °C for different times.
AlloysThickness (μm)
0 h2 h10 h20 h40 h80 h
W-Si53.3 ± 1.9172.6 ± 1.2342.2 ± 8.1412.3 ± 11.9Severe oxidation-
W-Si-1.3Y41.3 ± 1.6106.7 ± 7.0198.3 ± 8.6291.4 ± 9.6366.6 ± 13.3433.9 ± 14.1
W-Si-2.6Y43.6 ± 1.7101.6 ± 4.4173.3 ± 5.9198.2 ± 6.4247.3 ± 7.1309.2 ± 9.9
W-Si-3.8Y38.1 ± 1.189.3 ± 6.7147.9 ± 7.6192.9 ± 8.5204.0 ± 10.0249.1 ± 10.5
W-Si-5.0Y50.9 ± 1.9107.8 ± 10.6170.9 ± 9.1194.1 ± 11.2203.4 ± 11.5257.2 ± 12.4
W-Si-9.6Y80.3 ± 2.4destroyed----
Publisher’s Note: MDPI stays neutral with regard to jurisdictional claims in published maps and institutional affiliations.

