1. Introduction
Additive manufacturing (AM) is considered to be a revolutionary technology [
1], which allows engineers to create complex shaped components in an end-to-end workflow that quickly moves from CAD files to the final part [
2,
3,
4]. Numerous unique advantages have enabled AM technology to demonstrate significant potential in complex metal fabrication, multi-material/multi-functional design, and integrated manufacturing [
2,
4] As a result, innovative design may be obtained using AM for nickel-based superalloys [
5]. AM can provide a competitive advantage by enhancing heat transfer and reducing turbine blade pressure loss in complex microchannel cooling systems. [
6]. In this regard, electron beam–powder bed fusion (E-PBF) [
7,
8,
9] and laser beam–powder bed fusion (L-PBF) [
10,
11] have shown the potential for the processing of nickel-based superalloys [
12,
13]. High-γ′ nickel-based superalloys are abundantly used in aircraft and power generation turbines, rocket engines, and other high-temperature environments because of their excellent corrosion and oxidation resistance and superior mechanical properties [
1]. This phase based on Ni3(Ti, Al) that has an ordered FCC L12 structure [
14] constitutes the precipitate used to strengthen the alloy. The γ′ phase is coherent with the matrix of the superalloy having a lattice parameter that varies by around 0.5%. As particles of γ′ precipitates aggregate, they decrease their energy states by aligning along the <100> directions, forming cuboidal structures [
15].
The physical phenomena occurring in the melting pool with AT are largely similar to the phenomena occurring in welding. Unfortunately, cracks were frequently observed in AM nickel-based superalloys [
16,
17,
18,
19]. So, while nickel-based superalloys could easily be we L-DED in sheet-metal thicknesses, they suffered from strain-age cracking during welding or in the post-weld aging treatment. These cracks were found in the heat-affected zone (HAZ) of the weld. This is attributed to the fact that the majority of the superalloys contain 3 to 5% (Al + Ti) and are strengthened γ′ phase. This precipitation is very effective in strengthening cracks developed in HAZ during welding as it forms very rapidly and reduces ductility [
20].
The overall complexity associated with processing advanced hot-section high-γ′ nickel-based superalloys through additive manufacturing (AM) originates from non-weldability due to the presence of the secondary -γ′ precipitate phases in high proportions (i.e., more than 60 vol. %) in these alloys, arising from combined additions of aluminum (Al) and titanium (Ti) [
21,
22]. While these additions provide excellent benefits in improving overall high-temperature creep properties in new castings, they cause different types of cracking such as solidification, grain boundary liquation, strain-age, and hot tearing [
1].
The presence of high-γ′ fraction (which is an obvious peril of Ti + Al addition) increases the likelihood of cracking during post-weld heat treatment known as “strain-age cracking” [
23]. The alloys also become susceptible to ductility-dip cracking associated with the formation of grain boundary carbides [
24]. Based upon the compositions of 1.0% Al + 0.84% Ti (in wt. %) versus 0.28% Cr + 0.043% Co (in wt. %), the relationship between the alloy chemistry and the weld susceptibility is illustrated in
Figure 1 [
25].
Researchers have proposed several potential crack initiation mechanisms in nickel-based superalloys:
- (i)
The first mechanism is solid-state cracking. Harrison et al. suggested that residual thermal stresses would lead to solid-state cracking. In this case, the cracks usually showed the characteristics of clean and straight fracture surfaces. To improve the thermal shock resistance of nickel alloys in AM, Harrison et al. proposed a slight increase in the concentration of substituent atoms that strengthen the crystal lattice of the solid solution, which increases the ultimate tensile strength and yield strength at elevated temperature, thereby suppressing the tendency to form cracks [
26].
- (ii)
The second mechanism is liquation cracking. Liquation cracks also occur as a result of the separation of liquid films. Liquid films are formed as a result of the remelting of low-melting precipitates or the eutectic phase [
27,
28]. This mechanism of crack formation differs from solid-state cracking [
29]. Since the introduction of the main elements forming the γ′-phase (Al + Ti) is limited by the weldability area, the heat resistance of superalloys for AM is ensured by the introduction of refractory carbide-forming elements, in particular Cr, Mo, and W, which form MC, M
23C
6, and M
6C (M = metal) [
30]. A large amount of carbides provides dispersion strengthening and grain boundary stabilization. Han et al. [
19] hypothesized that the Mo and Cr-rich carbides in Hastelloy X would dissolve and then form a liquid eutectic film with a low melting point. Liquation cracks are also commonly observed in the HAZ (Heat Affected Zone) of a Hastelloy X weld in earlier papers [
31,
32,
33]. More recently, Zhang et al. [
34] reported that the continuous formation of γ-M
23C
6 eutectic at grain boundaries is responsible for liquation cracks in Hastelloy X by directed energy deposition (DED). In addition, they also hypothesized that solidification cracks could be produced from liquation cracks when liquid phase replenishment during solidification is insufficient.
- (iii)
The third mechanism is solidification cracking. Cracks are formed at the final stage of solidification (
fS is close to 1, and
fS is the fraction of solid matter), when replenishment from the liquid phase becomes difficult [
35,
36,
37,
38,
39,
40], which is the result of the stretching of liquid films in the mushy zone [
41]. Montero-Sistiaga et al. [
42] further testified to solidification cracking in Hastelloy X, where the surface of the cracks had the appearance of a smooth surface of dendrites. Recent studies on solidification cracking have shown that strain rate, rather than stress or strain, plays a more important role in cracking, and some modern cracking models are based on this hypothesis [
38,
43,
44,
45]. According to the cracking criterion proposed by Kou [
38], cracking can start when the separation rate of grains
dεlocal/dt exceeds the sum of the grain growth rate relative to each other (lateral growth rate) and the feed rate from the liquid phase along grain boundaries (GB).
As for solidification cracking, many theories were developed for cracking during solidification. Lippold [
29] reviewed the following five theories of hot tearing or solidification cracking: the shrinkage-brittleness theory of Pumphrey and Jennings [
46], the strain theory of Apblett and Pellini [
47], the generalized theory of Borland [
48], the modified generalized theory of Matsuda et al. [
49], the technological strength theory of Prokhorov [
50], and the vulnerable range theory of Clyne and Davies [
51].
The theory of Rappaz, Drezet, and Gremaud (the RDG model) [
44] has been the most widely cited theory of solidification cracking since it was developed in 1999, although it was not considered by Lippold [
29]. The RDG model considers stress in the transverse direction of the mushy zone and replenishment from the liquid phase through the mushy zone, from the ends of columnar dendrites to their roots. However, the model does not take into account the grain boundary where solidification cracking occurs. Instead, the entire mushy zone is viewed as a single area of a semi-solid structure through which interdendritic fluid enters the dendrite roots. More recently, Kou [
35] proposed a criterion for solidification cracking. In contrast to the RDG model [
44], Kou [
35] took into account the influence of three factors along the grain boundary between adjacent closely spaced columnar dendrites in the mushy zone: (1) Cracking inducing transverse tensile strain rate separating dendrites; (2) Opposing cracking counter speed of lateral growth of dendrites, facilitating their connection; (3) The rate of fluid replenishment to prevent the formation of voids (cracks). He proposed the following criterion for solidification cracking based on volume indicators: cracking can occur if the result of factor 1 exceeds the result of the sum of factors 2 and 3. Based on the criterion, Kou [
35,
52] further proposed the ratio
as a simple indicator of solidification cracking susceptibility near
fS = 1. He showed that the characteristic dendrite radius
r of columnar dendrites is proportional to
, and thus the lateral growth rate
is proportional to
. For a given
,
or
are higher if the ratio
is smaller for grains that grow and merge with each other to resist cracking. A slower increase in the characteristic radius—
contributes to an increase in the length of the channels between the columnar dendrites, which slows down the replenishment from the liquid phase, which is necessary to avoid cracking. Maximum
usually occurs near
fS = 1, so a convenient index value is the maximum value
at
[
52], beyond which cracking is unlikely due to extensive interboundary bonding between grains. The RDG model [
44] also assumed the absence of cracking beyond
fS = 0.98, i.e.,
. The index has been found to work for Al alloys [
53,
54], Mg alloys [
55], carbon steels [
56], and Ni-based alloys [
57]. Again, Scheul-based solidification curves can be used to relate this index to the slope solidification curve (Sheila):
.
Regardless of the mechanism of crack formation, the cause of its formation is the difference in chemical composition at points on both sides of the phase boundary. In this case, the difference in thermodynamic potentials between the points leads to crack formation if this difference exceeds the value characteristic of this material.
To quantitatively assess the risk of crack formation depending on the difference in the chemical composition of the phases in the components of superalloy powders, we will propose a method for determining and a criterion for assessing the dangerous level of fracture energy—the crack initiation criterion (CIC). The CIC will be derived from an estimate of the local energy balance from the heat transfer equation for the two-phase area. This criterion will be tested in the analysis of crack formation conditions during laser direct energy deposition (L-DED) of samples from Ni50Cr33W4.5Mo2.8TiAlNb alloy powder with an overestimated carbon content, which leads to excessive precipitation of carbides, which are the cause of crack formation. Based on the microchemical analysis of the γ-matrix in the area of cracking of the alloy samples obtained by L-DED and the composition of the precipitates of primary carbides, the critical values of CIC for characteristic precipitates will be determined.
2. Theoretical Foundations of the Research Method
In previous works [
58,
59], the authors of the article showed that the heat balance equation at the interface between two phases can serve as a basis for identifying the energy of discontinuity and identifying the conditions for the initiation of cracks, given the possible displacement of the phases relative to each other. Without taking into account heat transfers to the external environment, the heat balance equation near the phase boundary or an area with a large gradient in the change in chemical composition takes the following form:
where
is the phase fraction denoted by the index (
) near the phase boundary;
is the velocity of phases
(points of a continuous medium with a certain chemical composition);
are the isochoric heat capacities of phases;
are the isobaric heat capacities of phases;
are the coefficients of linear expansion of phases;
is the molar heat capacity at the interface;
is the material derivative of temperature;
is the force constant at the interface.
Consider the condition for a crack formation. Let the speed of the medium in the local region corresponding to the state
be:
Then, in the region with the state
the speed of the medium is defined as:
where
is the discontinuity in velocity corresponding to the condition of crack formation, and in the considered local area:
In this case,
can be interpreted as a Heaviside function defined by (5) on a section with coordinates
:
Taking into account (3), (4), (5), the heat balance Equation (1) can be written as a differential Equation (6):
where:
In general, Equation (7) can be represented as:
After simplifying (8), we obtain:
Suppose that in (2) and (3),
and
are small by definition, then analysis (9) shows that the function argument
tg must be small because the function
tg increases sharply with the growth of the argument. For small values of the argument
. In this case, it follows from (9) that:
The integration constant in (9) is found from the second of the boundary conditions (11), which follow from (2) and (3):
From the first boundary condition (11) follows the dependence for the discontinuity of the flow velocity (13):
Consider the condition for the formation of a hypothetical crack with a size
over time
t on the interval
based on condition (13):
In the interval
, the material derivative of the temperature change in the interfacial area will take the form:
Considering only the rate of temperature change at a material point, we obtain an approximate estimate of the material derivative of temperature:
Using (16), from dependence (14) we obtain the average value of the discontinuity interval:
In this case, from dependence (17), taking into account (7) and (18), it follows:
where
can be interpreted as a condition of discontinuity equal to the width of a hypothetical crack divided by the length of the interval on which the velocity jump is recorded
.
The recalculation of the isochoric heat capacity to the isobaric heat capacity was carried out according to the Magnus–Lindemann equation [
60]:
where
n is the number of atoms in the compound (
n = l + m + k);
is the melting point of the compound with chemical formula A
lB
mD
k.
Substituting the Magnus–Lindemann Equation (20) into dependence (19) and integrating over temperature, we obtain:
For two arbitrarily close points located at a distance
, the following condition will be satisfied:
i.e., in this case, there will be no discontinuity (crack formation).
The condition for maintaining the continuity of the medium corresponds to the middle of a small interval , while according to (5).
In this case (21), taking into account (22), takes the form:
The final temperature in (23) corresponds to the temperature of normal conditions, and the initial to the melting temperature of the phase that crystallizes last. Let it be a more fusible phase, denoted by the superscript , i.e., . The second phase, denoted by the index , is considered a more brittle separation from the first phase.
Taking into account the Magnus–Lindemann Equation (20), the dependence for the continuity condition (23) will take the form:
Let us restrict continuity condition (24) from below, for which we introduce the following inequalities into (24):
Inequality (25) is based on the fact that for the vast majority of alloys, the more brittle phase (
w), which is separated from the phase (
v) in the form of precipitation, has a lower coefficient of thermal expansion. An example is the precipitation of brittle carbides along the grain boundaries of the EP648 alloy (
Table 1).
For a complex substance with the structural formula
, where
are the components that make up the complex substance, and
are, respectively, the number of atoms in the molecule of this substance, the isochoric heat capacity is determined according to the Neumann–Kopp rule [
63]:
From the Koref rule for the Debye law for isochoric heat capacity, it follows that the heat capacity of an elementary substance included in a complex structure with a higher melting point will be greater than the heat capacity of the same substance included in a structure with a lower melting point.
Taking into account (28), it follows from (27) that:
Substitution (29) into inequality (26) does not change the sign of inequality:
In (30), the expression in square brackets is nothing else than the rule of mixtures for the isochoric heat capacity of the components. Passing to the atomic concentration of components
at a point, we can obtain an estimate of the continuity preservation condition in a local neighborhood of this point:
In (31), the coefficient 24.304 has the dimension J/K·mol. Dependence (31) characterizes the dimensionless specific internal energy, the excess of which can lead to crack formation with a local change in the molar isochoric heat capacity.
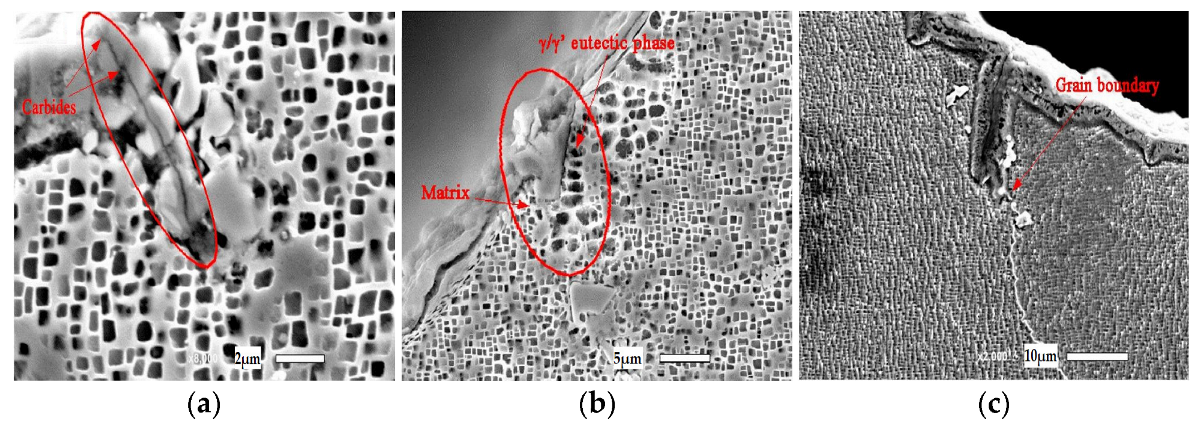
Cracks usually occur either along the phase interface (
Figure 2a,b) or near the interface area in places of the greatest inhomogeneity of the chemical composition, for example, along grain boundaries (
Figure 2c) [
64].
Let the concentration of elementary substances (chemical elements) at point (
v) be determined by the set of atomic concentrations
and the continuity criterion
, and at the point (
w) in the selection area, for example, carbide is determined by the values
and
. Then, a dangerous energy increment leading to the crack formation in the interface between points (
v) and (
w) based on the dependences (30), (31) can be found by formula (32), where
CIC is the crack initiation criteria (crack formation criterion).
Dependence (32) determines the potential difference of internal energy at points (
w) and (
v) at distance s, which can lead to the formation of a crack (
Figure 3).
4. Results and Discussion
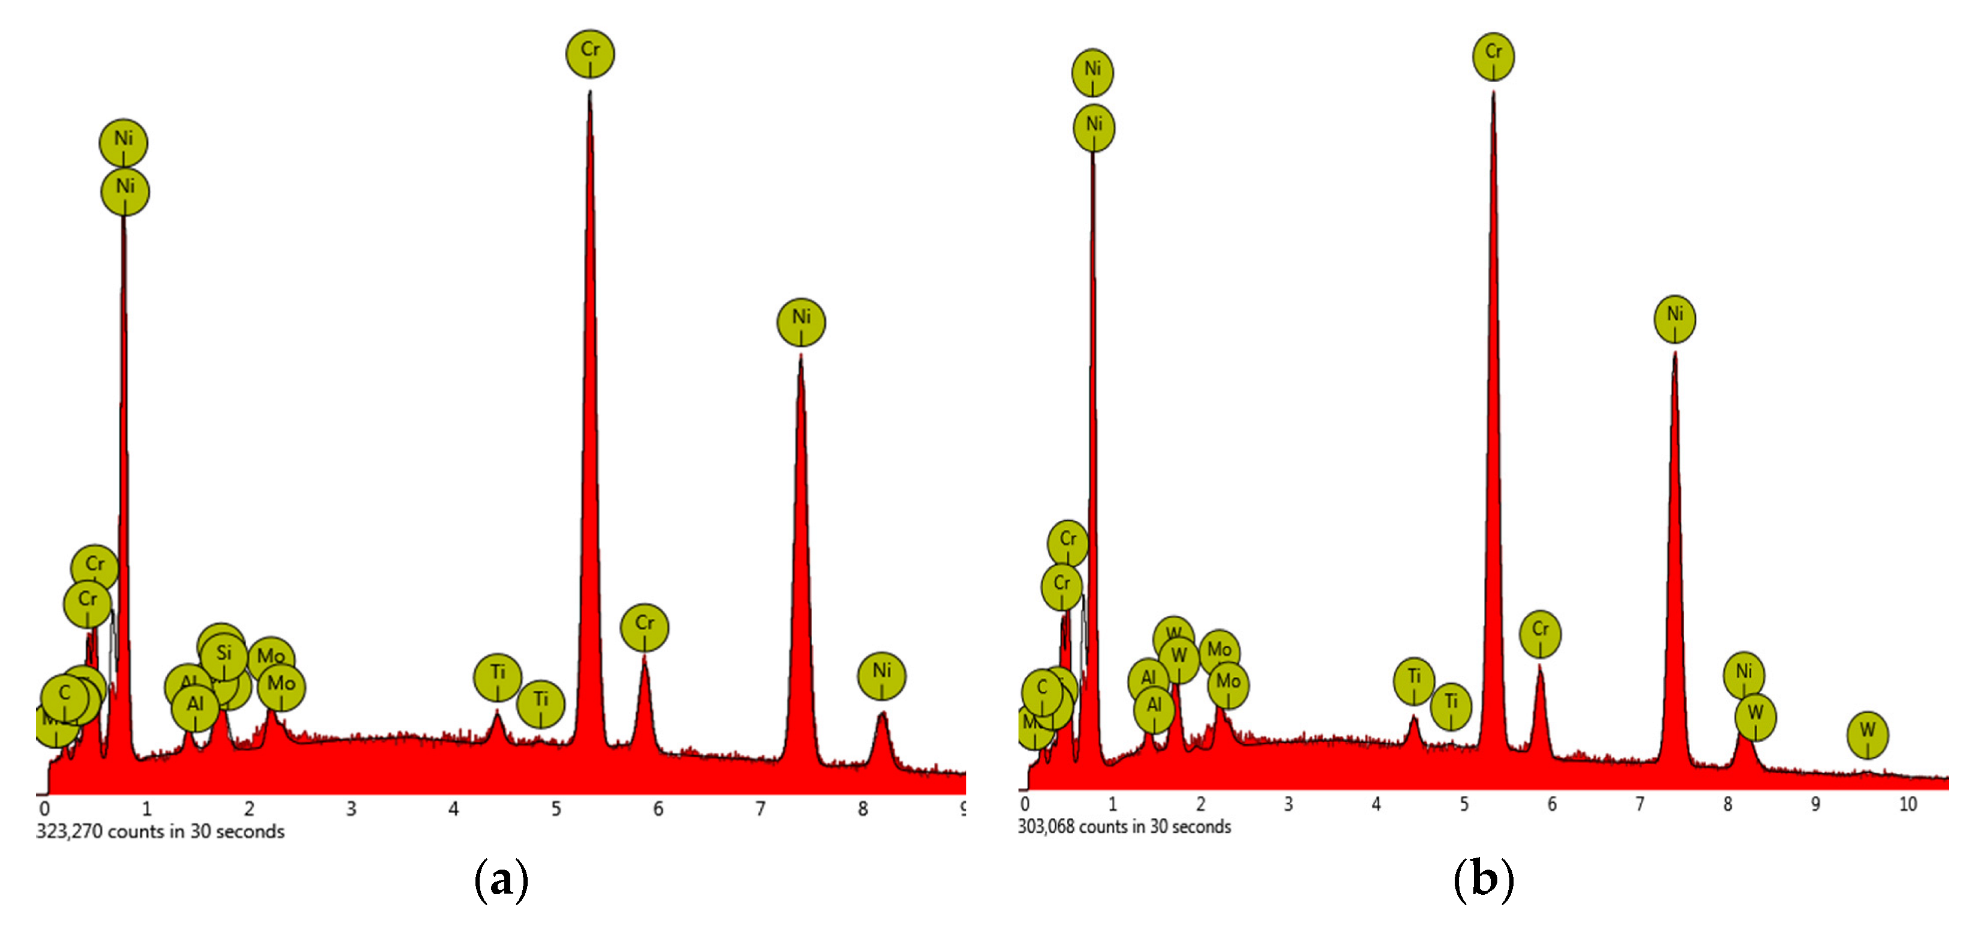
Data on the measurement of the chemical composition for the key components of the EP648 samples obtained by the L-DED method at points 1–12 (
Figure 6) are shown in
Table 4. Typical data of trace element EDS analysis with SEM are presented in
Figure 7.
The isochoric heat capacity of the key elements was calculated by the Debye method using the dependence:
where
θ is the Debye’s temperature, which is defined as
In Equations (33) and (34),
is Planck’s constant;
k is Boltzmann’s constant;
ν is the vibration frequency of atoms;
x is the parameter, determined on the basis of the solid-state theory [
65]; and
T is the temperature (all calculations are made for room temperature,
T = 298 K). The Debye model has been quite successful in approximating the thermal energy properties of a variety of solids.
The characteristic Debye temperatures of chemical elements are known from the reference literature, for example, [
60]. So, the isochoric heat capacity can be calculated by the method given in [
66].
Table 5 contains data on the isochoric heat capacity of the key chemical elements of the EP648 samples obtained by the L-DED method.
The calculated isochoric heat capacity at the points of control of the chemical composition is shown in
Table 6. The calculation was carried out according to the Neumann–Kopp rule. The results of the continuity preservation condition (CPC) calculation for these points according to dependence (31) are also presented in
Table 6.
Analysis of the data in
Table 6 shows that despite the significant difference in chemical composition (
Table 4), the values of continuity conditions (31) for points 1–12 (
Figure 4) for the γ-phase matrix on both sides of the crack are almost the same. This suggests that the cause of the crack initiation is the precipitation of carbides, which have a thermodynamic potential different from the background of the rest of the medium and, consequently, the values of the condition for maintaining continuity. Before turning to dependence (32) to quantitatively determine the thermodynamic conditions for crack formation, let us dwell on the analysis of the conditions for carbide precipitation.
The complication of alloying leads to a change in the phase composition and microstructure of nickel alloys: the appearance of excess phases during crystallization, which are eutectic (γ–γ′), and M
6C carbides based on (Ni,Co)
3(W,Cr)
3 n of alloying solution tungsten [
67,
68,
69]. According to the data of [
70], in order to decrease the negative effect on cracking, the elements are arranged in the sequence Al, Ti, W, Mo, Cr. In a similar sequence, these elements are arranged in decreasing order of their γ′-forming ability: Al > Ti > Nb > W > Mo > Cr [
71].
It is also clear that fast cooling (quenching) of Ni–Cr–Mo based alloys with Ni content more than 50% (in wt. %) from high temperature (e.g., 1250 °C) displays the γ phase with carbide precipitates. Only a long time low-temperature aging regime (e.g., 700–600 °C) leads to long-range ordering (LRO) and the formation of phases based on complex crystalline structures (such as σ, µ, or P phase) [
72]. During additive manufacturing of Ni–Cr–Mo-based alloys cooling occurs quite quickly, so the dominant type of structure will be σ. Moreover, it is clear that fast cooling (quenching) of Ni–Cr–Mo-based alloys with Ni content of more than 50% (in wt. %) leads to precipitation of Hf, Ta, etc. carbides near the grain boundaries.
On slow cooling or under the influence of high MC temperature, the carbides are converted into M
6C-type and M
23C
6-type carbides. At high temperature in In625 superalloy [
73], the MC-type carbides degenerate to M
6C-type and M
23C
6-type carbides. The precipitation of an M
6C-type carbide phase within the matrix and the formation of near continuous films, comprising discrete M
6C/M
23C6 carbide particles, occur after prolonged (∼70,000 h) service at temperatures close to but less than 600 °C. The shape of MC-type carbides is an irregular lump and those of the M
6C and M
23C
6 are bone-like or long-strip-like, and most are located near the grain boundaries. A long carbide band along the grain boundary is formed by M
6C and M
23C
6.
Let us consider the values of the crack formation criterion (32) in relation to the precipitation of some Al, Ti, W carbides alongside a solid solution of the γ-phase matrix with continuity preservation condition CPC = 0.0564 (
Table 3). The calculation results are shown in
Table 7.
As initially follows from (19), continuity preservation condition (CPC) and crack initiation criteria CIC are dimensionless quantities. These are interpreted through the ratio of the infinitely small width of a hypothetical crack to the length of the conditional segment connecting the points at the crack boundaries, in which the mutual change in the chemical composition, and hence the thermodynamic characteristics, is significant from the point of view of crack formation.
It can be seen from the data in
Table 7 that aluminum carbide has the highest tendency to form cracks in the γ-phase matrix (
CIC = 0.20096) compared to titanium and tungsten carbides at
CIC = 0.03630 and
CIC = 0.03960, respectively. In this regard, a limited amount of Al and Ti carbide-forming elements is introduced into the alloy. Thus, the main reason for the crack formation during DED is the high concentration of tungsten carbides WC and MoC, which precipitate during alloying mainly along the grain boundaries. It should be noted that WC with a melting point of 3141K has a higher crystallization range compared to MoC, the melting point of which is 2960K. A quantitative indicator of the risk of crack formation (appearance of discontinuities) is the CIC indicator proposed by the authors, which for the presented experimental data at the interface with carbides W turned out to be equal to 0.03960. In addition to CIC, an equally important factor is the concentration of carbide-forming elements (points 2, 4, 5, 6, 10 —
Table 4,
Figure 6), which, with an increased carbon content, leads to the formation of dangerous carbide precipitates.

 ,
, 


