Article

Heat Dissipation Behavior of a Low-Strength-Steel Welded Joint in Ultrasonic Fatigue

1
Key Laboratory of Pressure Systems and Safety, Ministry of Education, School of Mechanical and Power Engineering, East China University of Science and Technology, Shanghai 200237, China
2
Failure Mechanics and Engineering Disaster Prevention, Key Laboratory of Sichuan Province, Sichuan University, Chengdu 610207, China
*
Author to whom correspondence should be addressed.
Metals 2022, 12(11), 1857; https://doi.org/10.3390/met12111857
Submission received: 6 October 2022 / Revised: 27 October 2022 / Accepted: 27 October 2022 / Published: 30 October 2022
(This article belongs to the Special Issue Fatigue and Fracture in Steels)

Abstract

:
The coupled effects of heat and frequency in very-high-cycle fatigue are known under ultrasonic testing, while the heat dissipation behavior of welded joints is less investigated. In this work, the specimen surface temperature of a low-strength-steel welded joint and its base metal were monitored by infrared thermal imaging technique under ultrasonic fatigue loading. Results showed that the surface temperature distribution of both welded and base metal exhibited a parabola shape, and the temperature evolved with three stages. The location of the highest temperature within the weld metal correlated well with fatigue failure location. The inhomogeneity and asymmetry of temperature distribution implied a dominant role for heat transfer mode and insignificant influence of microstructure heterogeneity or specimen type. The nature of heat dissipation in low-strength steel in ultrasonic fatigue was thermal–mechanical coupling effect, which should be paid close attention in the standardization of ultrasonic fatigue testing.

1. Introduction

The development trend for mechanical structures is safe service in a long-life regime [1,2]. As an important form of structural failure mode, fatigue is gradually developing from low to high cycle and very-high cycle [3,4,5]. The service life of key components such as steam turbine rotors and engine blades has reached 108–1010 cycles or even beyond [6,7], resulting in new challenges to the fatigue strength of materials and structures [8,9,10]. As a time- and cost-saving practice, fatigue testing using higher frequency machines is an important option for fatigue failure investigation, among which ultrasonic fatigue at 20 kHz has been widely employed in testing in the very-high-cycle fatigue (VHCF) regime [11,12,13].
It has been found that there are significant frequency effects and heat dissipation in ultrasonic fatigue testing. Mayer et al. [14] reported that the frequency effect was accompanied by increased fatigue life in titanium, nickel, and their alloys. Furuya et al. [15] found that smooth specimens were affected by frequency with increasing fatigue strength, while notched specimens were not affected by frequency. Wagner et al. [16] reported that the cyclic deformation behavior of material affected the resonant frequency. Zhu et al. [17] investigated the frequency effect of a low-strength-steel welded joint, establishing the relationship between the frequency influence coefficient and damage mechanism. Zhang et al. [18] found that the fatigue strengths of austempered ductile iron essentially corresponded with each other under 90 Hz and 20 kHz, and the specimens showed similar fracture behaviors. Zhao et al. [19] concluded that the higher the loading frequency, the shorter the dislocation travel distance and the smaller the accumulated damage. Moreover, the frequency effect has also been correlated with the type of crystal structure of the material, i.e., the frequency effect is not significant for face-centered cubic and hexagonal close-packed structures, while it is significant for body-centered cubic structures.
On the other hand, ultrasonic vibration increases the internal friction of the material, often causing temperature rise and the thermal damage of specimens, especially in low-strength steels. Ranc et al. [20] proposed that the thermal effect in C45 steel under ultrasonic fatigue occurred in three stress amplitude ranges. Krewerth et al. [21] proposed an in situ surface thermographic measurement method to determine the crack initiation location and propagation life in G42CrMo4 steel. Huang et al. [22] investigated the ultrasonic fatigue heat dissipation behavior of TC17 alloy and established a model to describe the ultra-high-cycle fatigue temperature increment by estimating the inelastic heat dissipation in the active part. Generally, welded tubular joints are reinforced with fiber-reinforced polymer [23] and collar plates [24] to increase static capacity as a weak point in the structure. It is not clear whether the non-uniformity of heat dissipation is related to material type, and the current studies are focused on homogeneous materials and have not yet involved inhomogeneous microstructures such as welded joints, which is an important issue in the process of understanding the fidelity of test data for low-strength steel and the associated standardization of fatigue testing under ultrasonic frequency.
Therefore, in this study, a lower-strength 25Cr2Ni2MoV steel welded joint and its base metal were selected for investigation, and the ultrasonic fatigue test was carried out at R = −1 under both intermittent and continuous loading without air cooling. In addition, the heat dissipation behavior was analyzed by infrared thermography, and the temperature distribution pattern was discussed aiming for standardization considerations.

2. Materials and Experiments
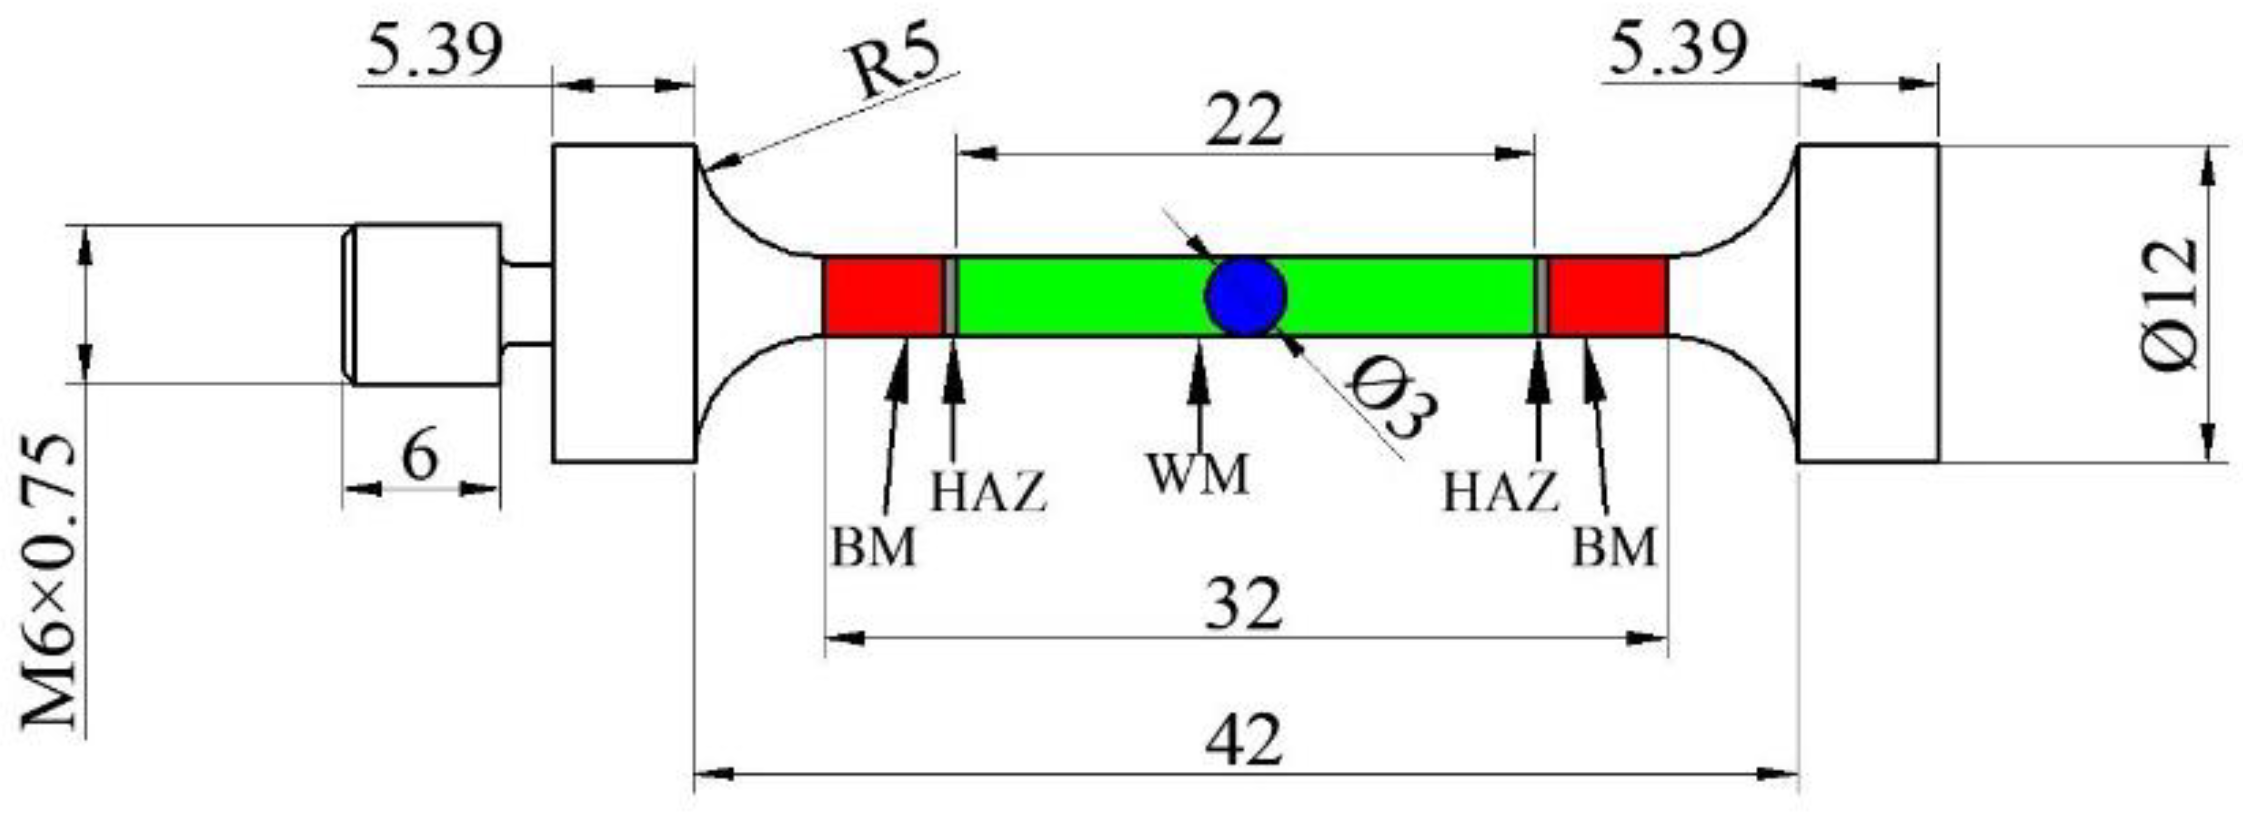
2.1. Materials

The material employed in this work was the welded joint of 25Cr2Ni2MoV steel, which was welded by submerged arc welding (SAW) technique with multi-layer and two-pass welding using a welded metal (WM) rich in Ni. The welding current, voltage, and welding speed for each pass were around 500 A, 30 V, and 0.6 m/min, respectively [25]. The weld width was 22 mm, which is the preferred parameter for heavy section welding with the deep-narrow gap method. A post-weld heat treatment (PHWT) under furnace cooling was carried out at 580 °C for 20 h to reduce welding residual stress [26]. The chemical compositions of the weld and the base metal (BM) are listed in Table 1 and Table 2, and the tensile properties of the joint are listed in Table 3. The yield strength (YS) and ultimate tensile strength (UTS) of the base metal were 768 MPa and 864 MPa after quenching (860 °C) and tempering (630 °C), respectively [27]. The microstructures of the BM, heat affected zone (HAZ), and WM are presented in Figure 1. The microstructure of the WM is mainly long-tempered bainite, while the BM is strip-tempered martensite, as shown in Figure 1a,b, respectively. The microstructure of HAZ is mainly tempered bainite with gradient distribution, which can be further divided into three micro-zones. In addition, the morphological difference between martensite and bainite may affect the heat dissipation behavior of the materials.

2.2. Experiments

Welded joint and pure BM specimens were prepared, as shown in Figure 2. The middle of the specimen was a 32 mm parallel section to ensure the same applied stress. Meanwhile, the temperature along the parallel section was ideally the same, which can reflect the actual temperature distribution and the effect of heat dissipation. After cutting and forming, the roughness of the specimen was guaranteed to be less than 0.2 μm by grinding and polishing.
An ultrasonic fatigue testing machine (Shimadzu USF-2000, Kyoto, Japan) was used for the VHCF test on welded joints and BM at room temperature, with a loading frequency of 20 kHz. The stress amplitude and stress ratio were 645 MPa and −1, respectively. One end of the specimen was fixed on the ultrasonic fatigue testing machine through threaded connection, and the other end was a free end. During the test, the specimen was applied cyclic load with intermittent loading-uncooled (500 ms followed by 1000 ms of pause), which means stopping the loading for 1 s to dissipate heat after every 10,000 cyclic loads. The temperature on the specimen surface was monitored in real time with the testo-865 infrared thermal imager (Testo, Shanghai, China). In order to reduce temperature measurement errors, the following measures were taken: (1) the fatigue loading and infrared thermography were carried out in a relatively confined space to reduce the influence of the environment; and (2) the photographs of the specimen surface were taken at different numbers of cycles but at the same distance, height, and position of the specimen to reduce the influence of the photographing position. The infrared thermal imaging of the specimen was taken at the loading cycle of 5 × 10⁵, followed by one capture at every 1 × 10⁶ interval with loading cycles within 1 × 10⁷. Then the temperature was captured at every 1 × 10⁷ interval for loading cycles beyond 1 × 10⁷ until failure. The infrared thermograms were processed using the IRSoft software (IRsoft 4.7, Testo, Shanghai, China) to evaluate the distribution and evolution of temperature. After the test, the fractured specimens were ultrasonically cleaned and analyzed for fracture morphology and mechanism. Finally, the fracture morphology of the specimen was analyzed by scanning electron microscope (EVO MA15, Zeiss, Oberkochen, Germany).

3. Results

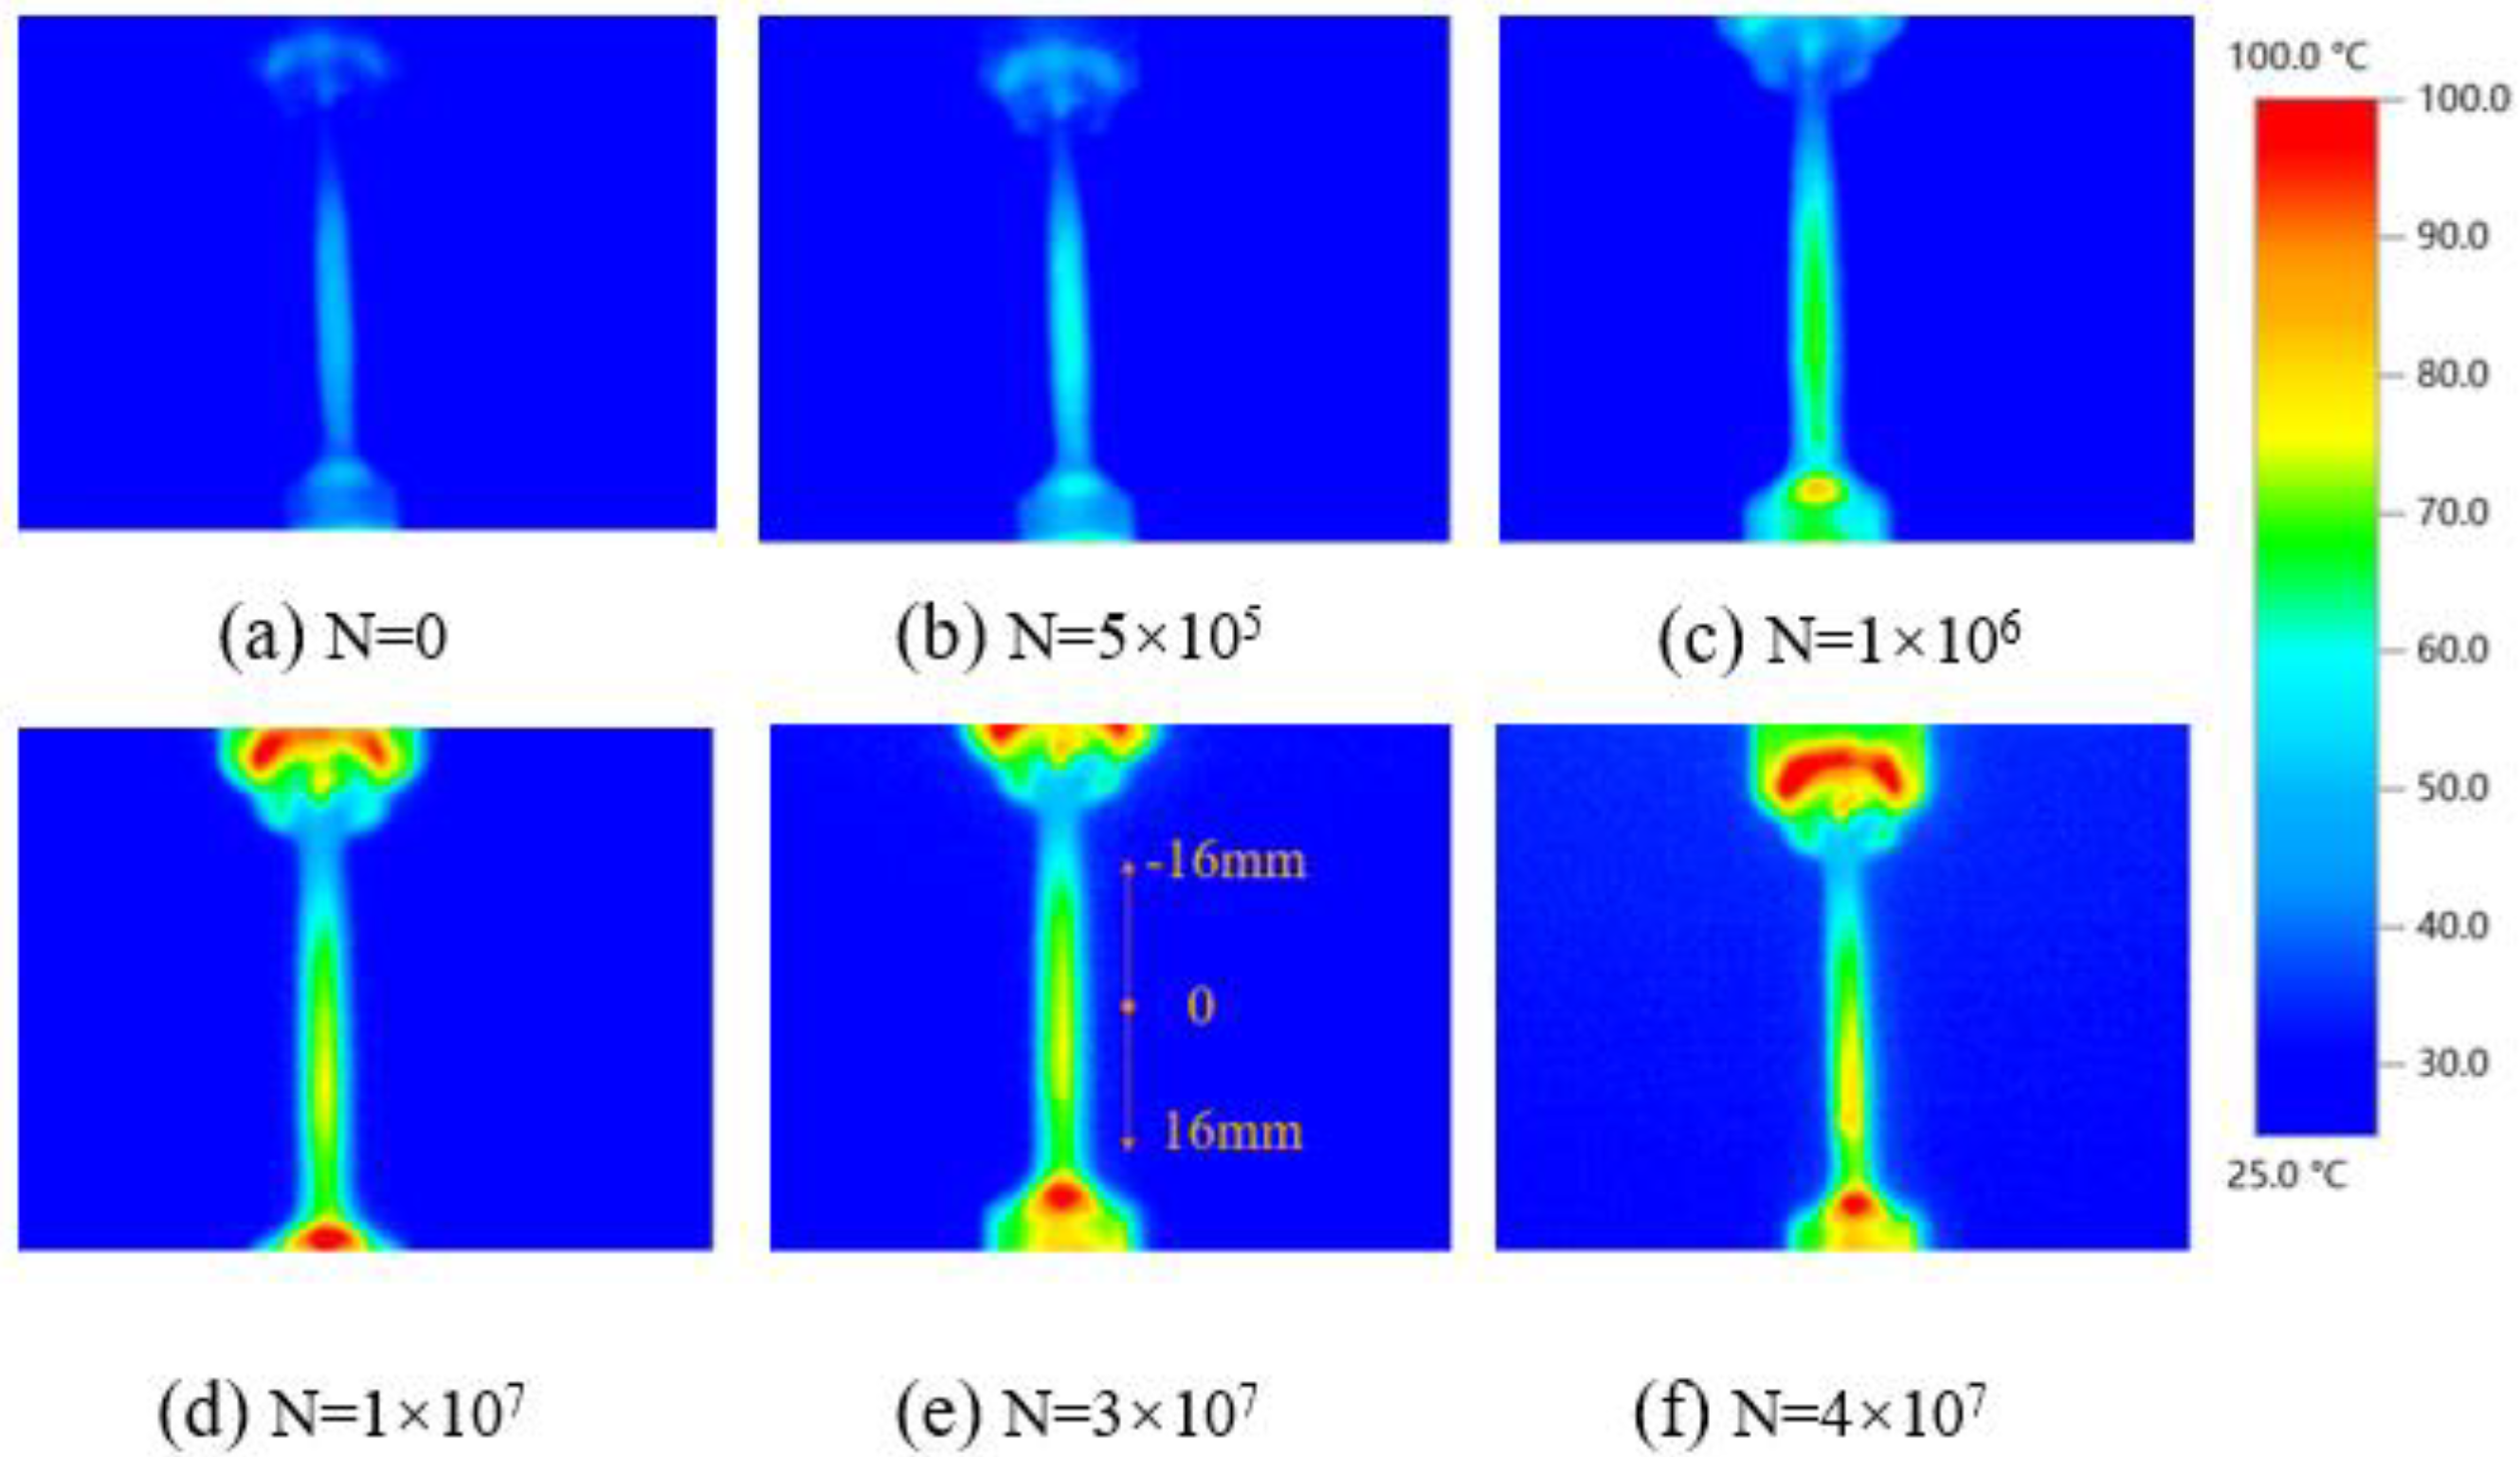
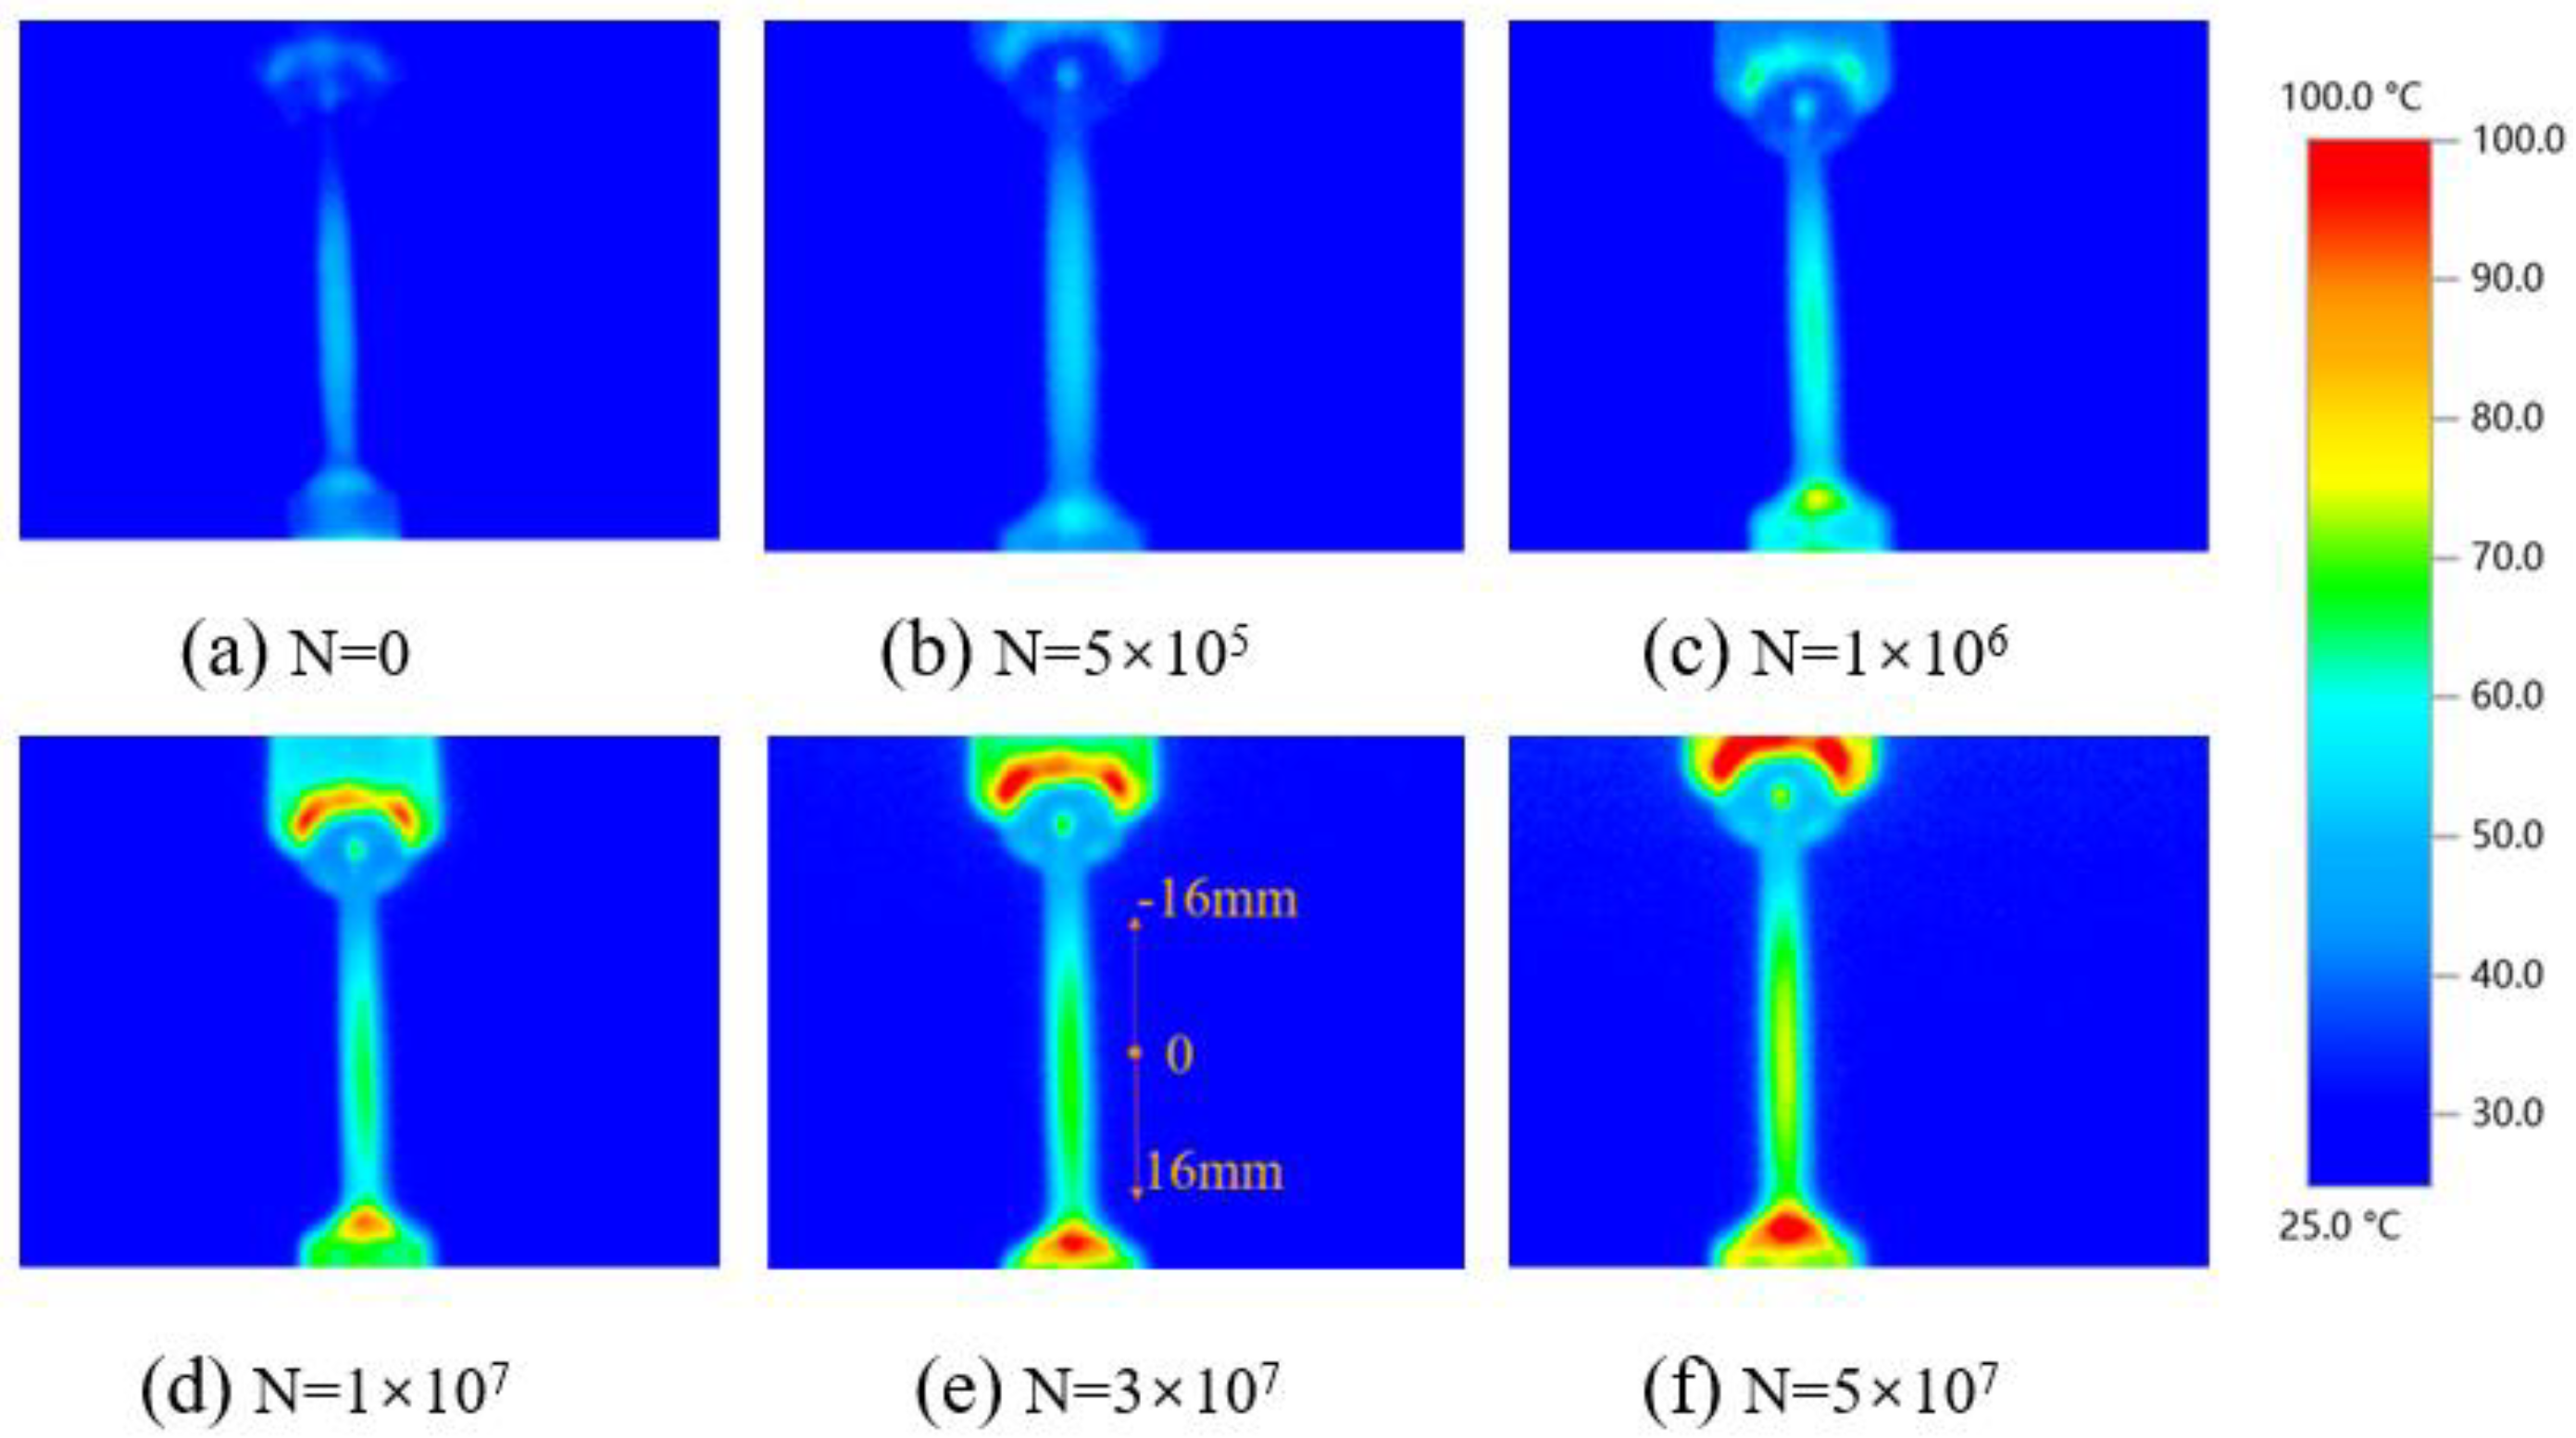
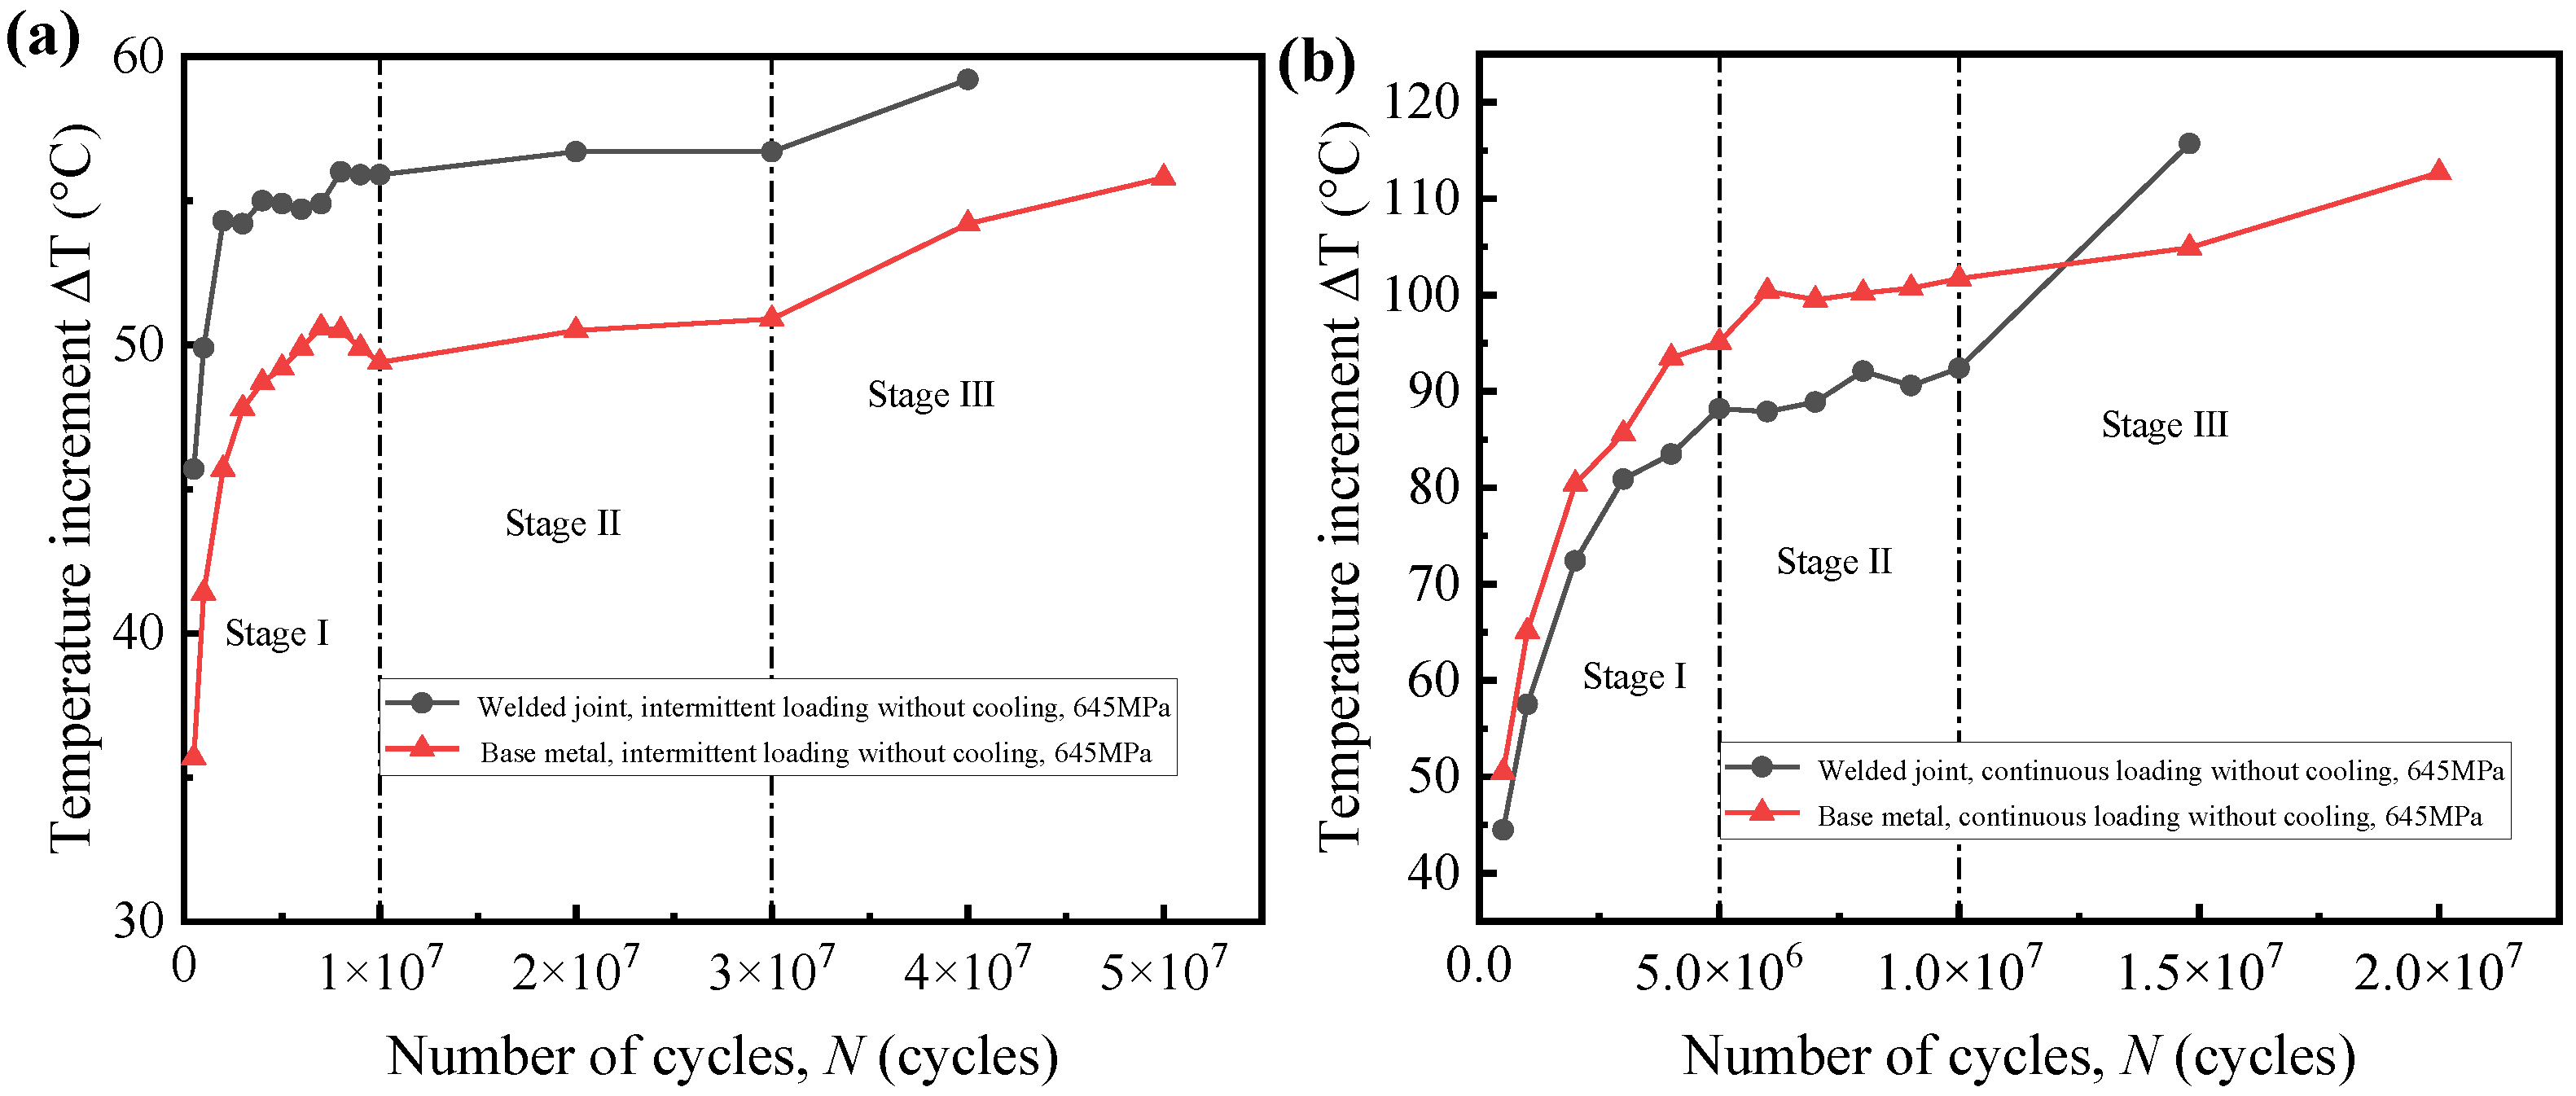
3.1. Surface Temperature Measurement

This work will focus on the temperature distribution and inhomogeneity under intermittent loading. Figure 3 and Figure 4 present the infrared thermograms of welded joints and BM with different cycles, respectively. Note that the middle of specimen is a parallel section, the upper end is the clamping side, and the lower end is the free side. Figure 3a or Figure 4a are the initial temperatures of the welded joint and BM at room temperature, respectively. Figure 3a–d and Figure 4a–d indicate that the temperature at the center of the two types of materials gradually increases with the increase of N, corresponding to the first stage of the sharp rise in temperature. Figure 3d–e and Figure 4d–e represents the specimen entering the stage where temperature remains stable, at which the surface temperature at the center of the two materials changes insignificantly. As the number of cycles increased, the temperature difference, ΔT, of the welded joint specimen is slightly elevated, and the ΔTmax has a tendency to move downward away from the center of the weld, while that of the BM specimen remains near the center of the specimen.

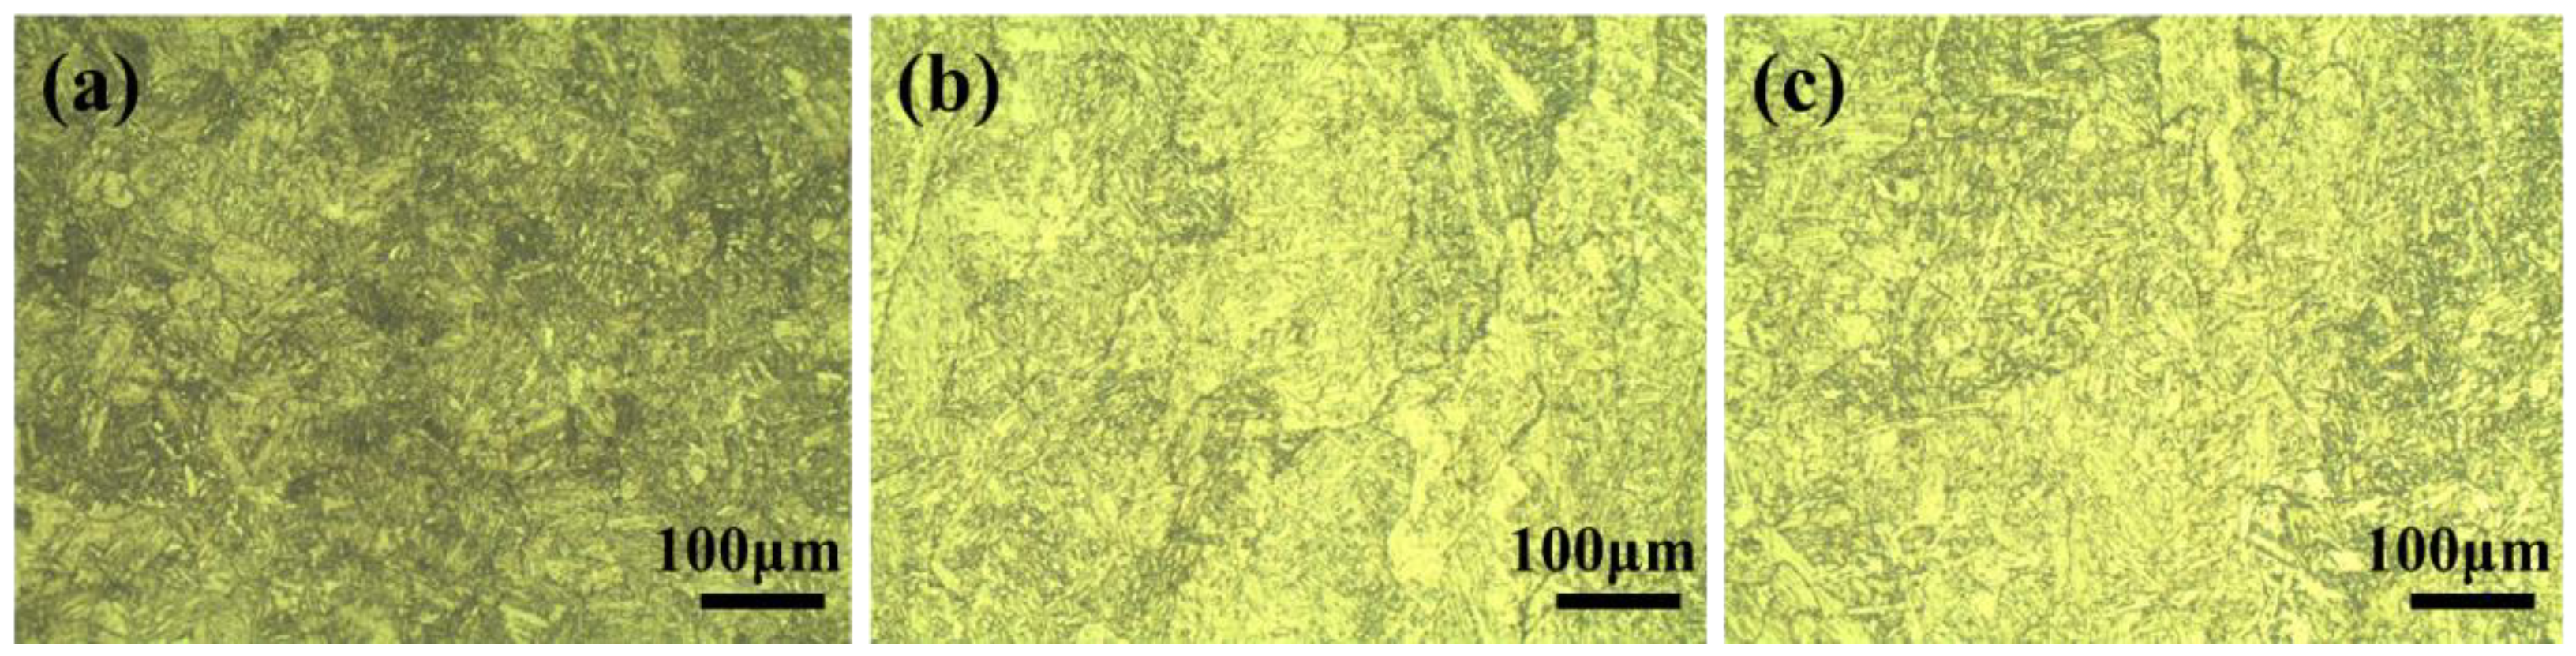
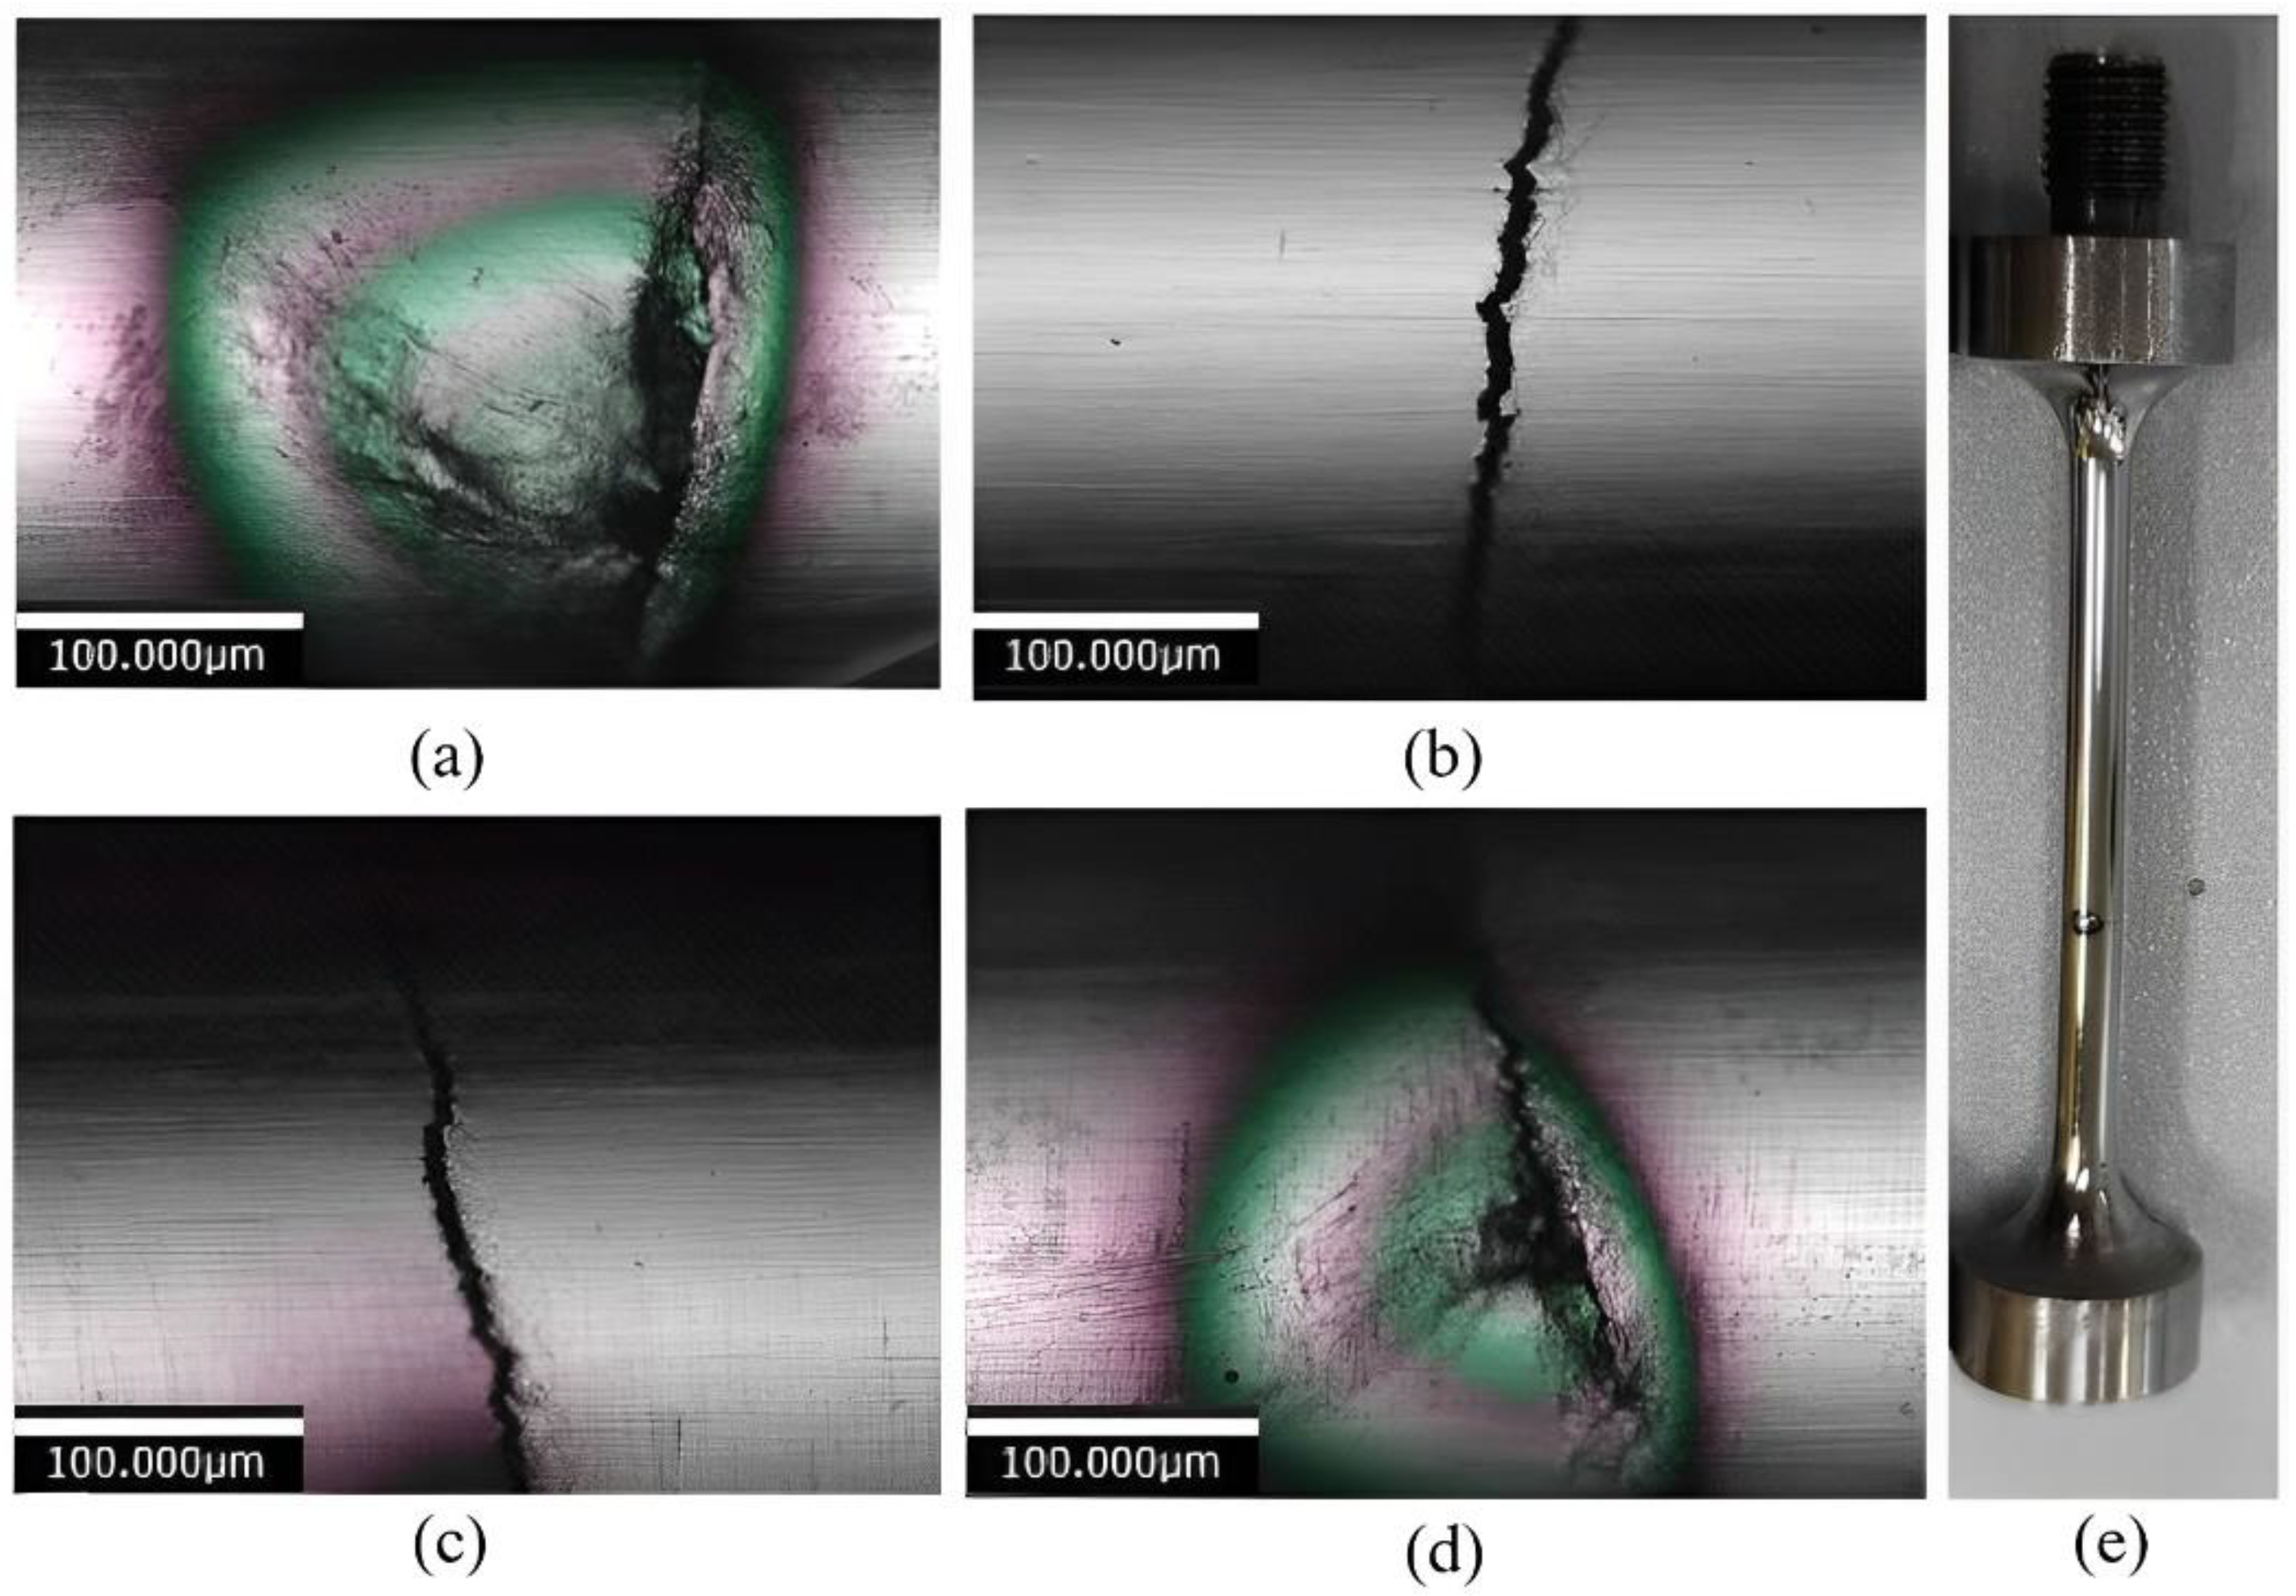
3.2. Surface Fractographies

Figure 5a–d shows the surface morphology of the welded joint specimen near the fracture location taken in four equal parts along circumferential direction. Apparent cracks and significant burning areas are observed. It is implied that thermoplastic damage occurred in the low-strength steel during ultrasonic fatigue, dissipating a large amount of heat and increasing the surface temperature, providing important evidence for the measurement of the associated temperature rise. The fracture location of the specimen is consistent with the position of the ΔTmax in the welded joint, indicating that heat dissipation induces local plasticity and has an important effect on fatigue fracture.

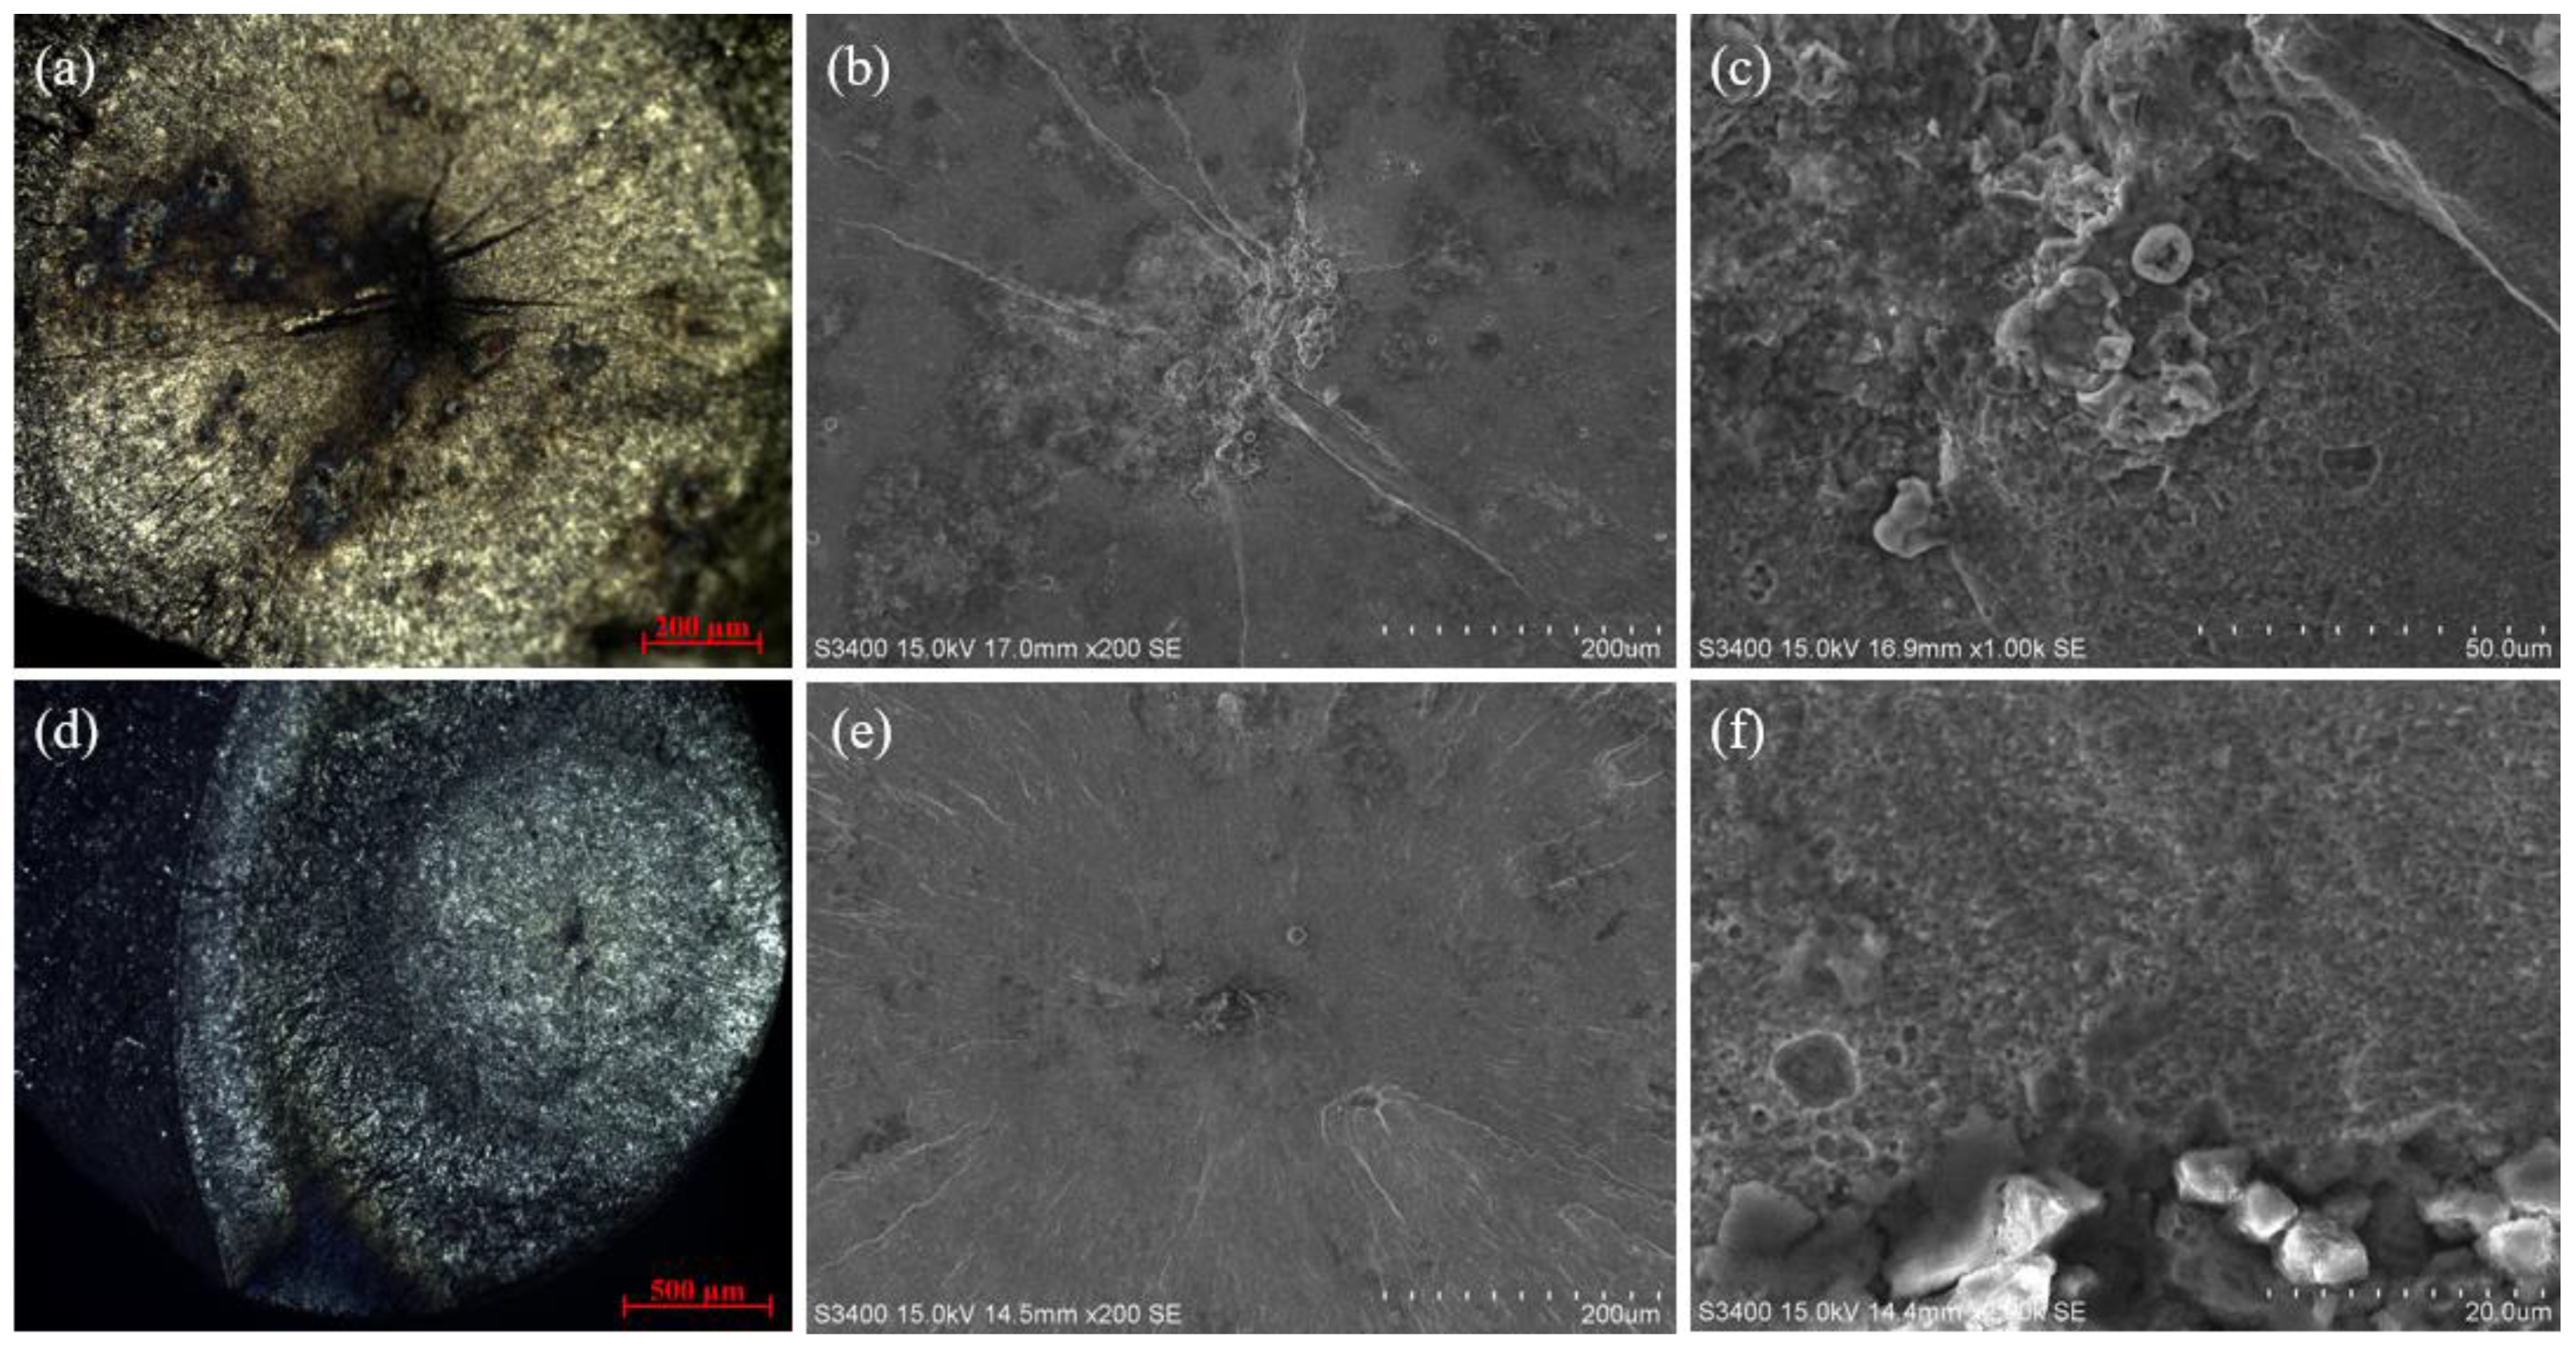
3.3. Fracture Morphologies

Figure 6 shows the fracture morphology of crack initiation zone in base metal (Figure 6a–c) and welded joint (Figure 6d–f). It can be observed that there are typical fish eyes, fine granular area (FGA), and burning areas in both BM and welded joint. It is worth noting the obvious burning mark around inclusion in Figure 6a; meanwhile, FGA is observed around inclusion in Figure 6b,c. In addition, the same features are also seen in Figure 6d–f. It was reported that the formation of FGA is related to local microplasticity [28]; thus, it can be inferred that interior microplasticity was affected by the thermal dissipation behavior under ultrasonic fatigue.

4. Discussion

4.1. Surface Temperature Evolution

Figure 7 presents evolution of the surface temperature of the welded joint and base metal specimen. The temperature ΔT is given by ΔT = TCT0, where TC is the maximum surface temperature of the specimen and T0 is the room temperature (25 °C). It can be observed that the temperature rise of the welded joint and BM specimens are similar, experiencing three stages: a sharp rise, relatively stable, and a rapidly increasing stage. The fatigue life of the joint specimens in both loading modes was lower than that of the BM. Therefore, the material type has little effect on the temperature increment law, while it has a significant effect on the magnitude of temperature increment, which reflects the difference in heat dissipation process of the two types of specimens.
As the number of loading cycles increases, the plastic strain energy accumulates and the surface temperature of the specimen increases, leading to microstructural damage of the material, and resulting in irreversible distortions such as cavity growth and dislocation multiplication as well as the release of thermal energy. In stage I, the surface temperature of the specimen is close to room temperature, which means that thermal convection and heat dissipation losses are small, and thus almost all the heat generated is used to raise the temperature of the specimen. Thus, the first stage of the sharp rise in temperature is mainly due to internal friction with the thermoelastic effect dominating, with the plastic strain energy and thermal dissipation being relatively small. At the second stage, the heat transfer between the specimen and the surrounding environment reaches a balance, at which the temperature is in equilibrium and remains stable. At the third stage, with the rapid increase in plastic deformation, a large quantity of energy needs to be released, causing the surface temperature of the specimen to rise rapidly until fracture. As the temperature rise in the third stage is too fast, it is difficult to take images.
Considering the heat transfer behavior, it is anticipated that the specimen can dissipate heat during the intermittent loading, where the free end of the specimen is in direct contact with air and convection dominates the heat transfer process. The higher ΔT of the joint than the BM may be due to fact that the heat transfer coefficient of bainite is lower than that of martensite. As for the continuous loading mode without 1000 ms of pause, heat conduction between the specimen clamping end and the fatigue testing machine becomes the dominant mode of heat transfer. In this case, a lower increase in temperature in the weld joint than in the BM may be due to the fact that the thermal conductivity of bainite is higher than that of martensite. It can be concluded that differences in loading modes lead to differences in the heat transfer, which in turn implies the effect of materials on the evolution law and magnitude of ΔT. Later discussions on heat dissipation behavior will be focused on intermittent loading as it is more popular in ultrasonic fatigue testing.

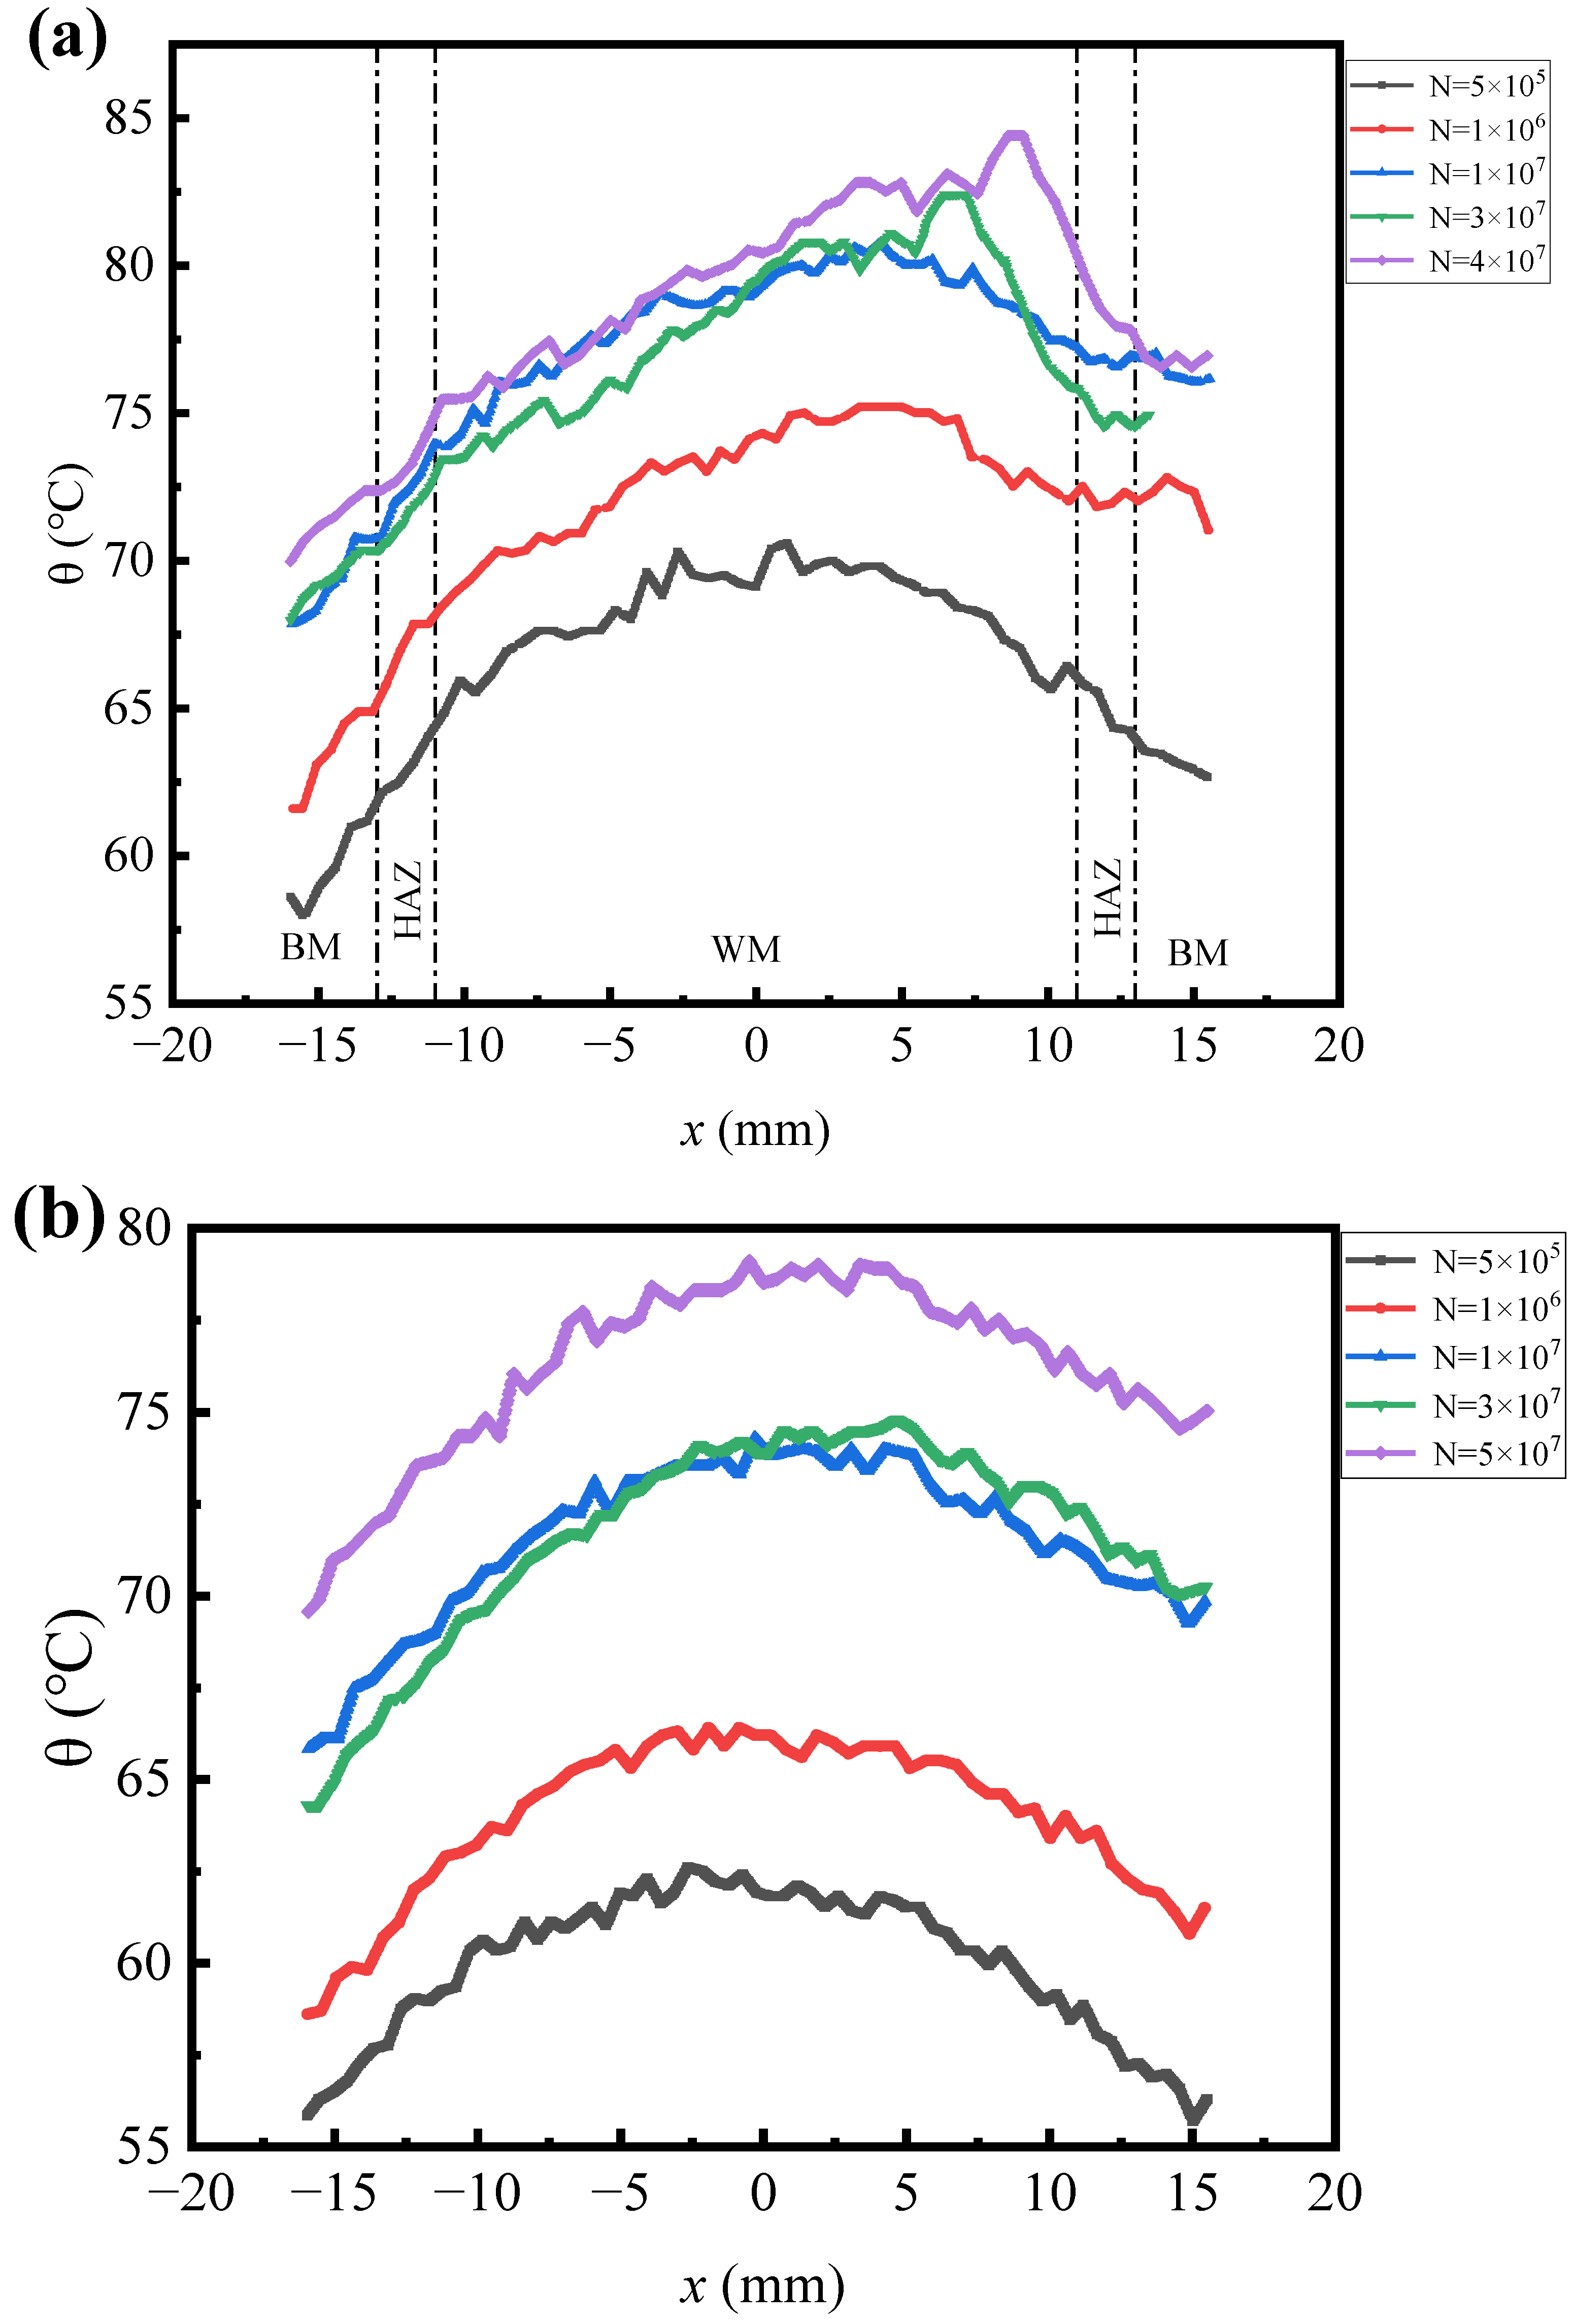
4.2. Surface Temperature Distribution along Axial Direction

Figure 8a,b represents the temperature distribution along the length of the welded joint and BM specimens at different interrupted cycles. It can be observed that the variation of ΔT corresponding to three stages behaves similarly with the evolution law in Figure 7. It is worth noting that the temperature distributions are parabolic along the specimen length direction rather than ideally uniform, indicating that the temperature distribution of the specimen is less affected by the microstructure discontinuity of the welded joint, that is, there is no obvious correlation between the material and temperature distribution. Nevertheless, ΔTmax of the welded joint is gradually transferred from the weld to the BM, while ΔTmax of the BM remains stable in the middle of the specimen. It can be concluded that the temperature distribution of the welded joint is more inhomogeneous than that of the BM.
The heat dissipation caused by heat convection, heat radiation, and heat conduction accounts for a large proportion in the fatigue test and cannot be ignored. The surface temperature of the specimen can be simplified to a one-dimensional field since the diameter to length ratio of the ultrasonic fatigue specimen is extremely small and the temperature is distributed in a gradient mode along the length of specimen. Therefore, taking the center of the specimen as the origin and the direction of the free side as the positive direction of the X-axis, the theoretical model of the specimen temperature is given as θ(x) = A1x2 + A2x + A3, where A1 < 0, θ is a one-dimensional temperature, and A2 and A3 are fitting parameters. It is indicated that the experimentally determined temperature distribution is in good agreement with the theoretical formula.

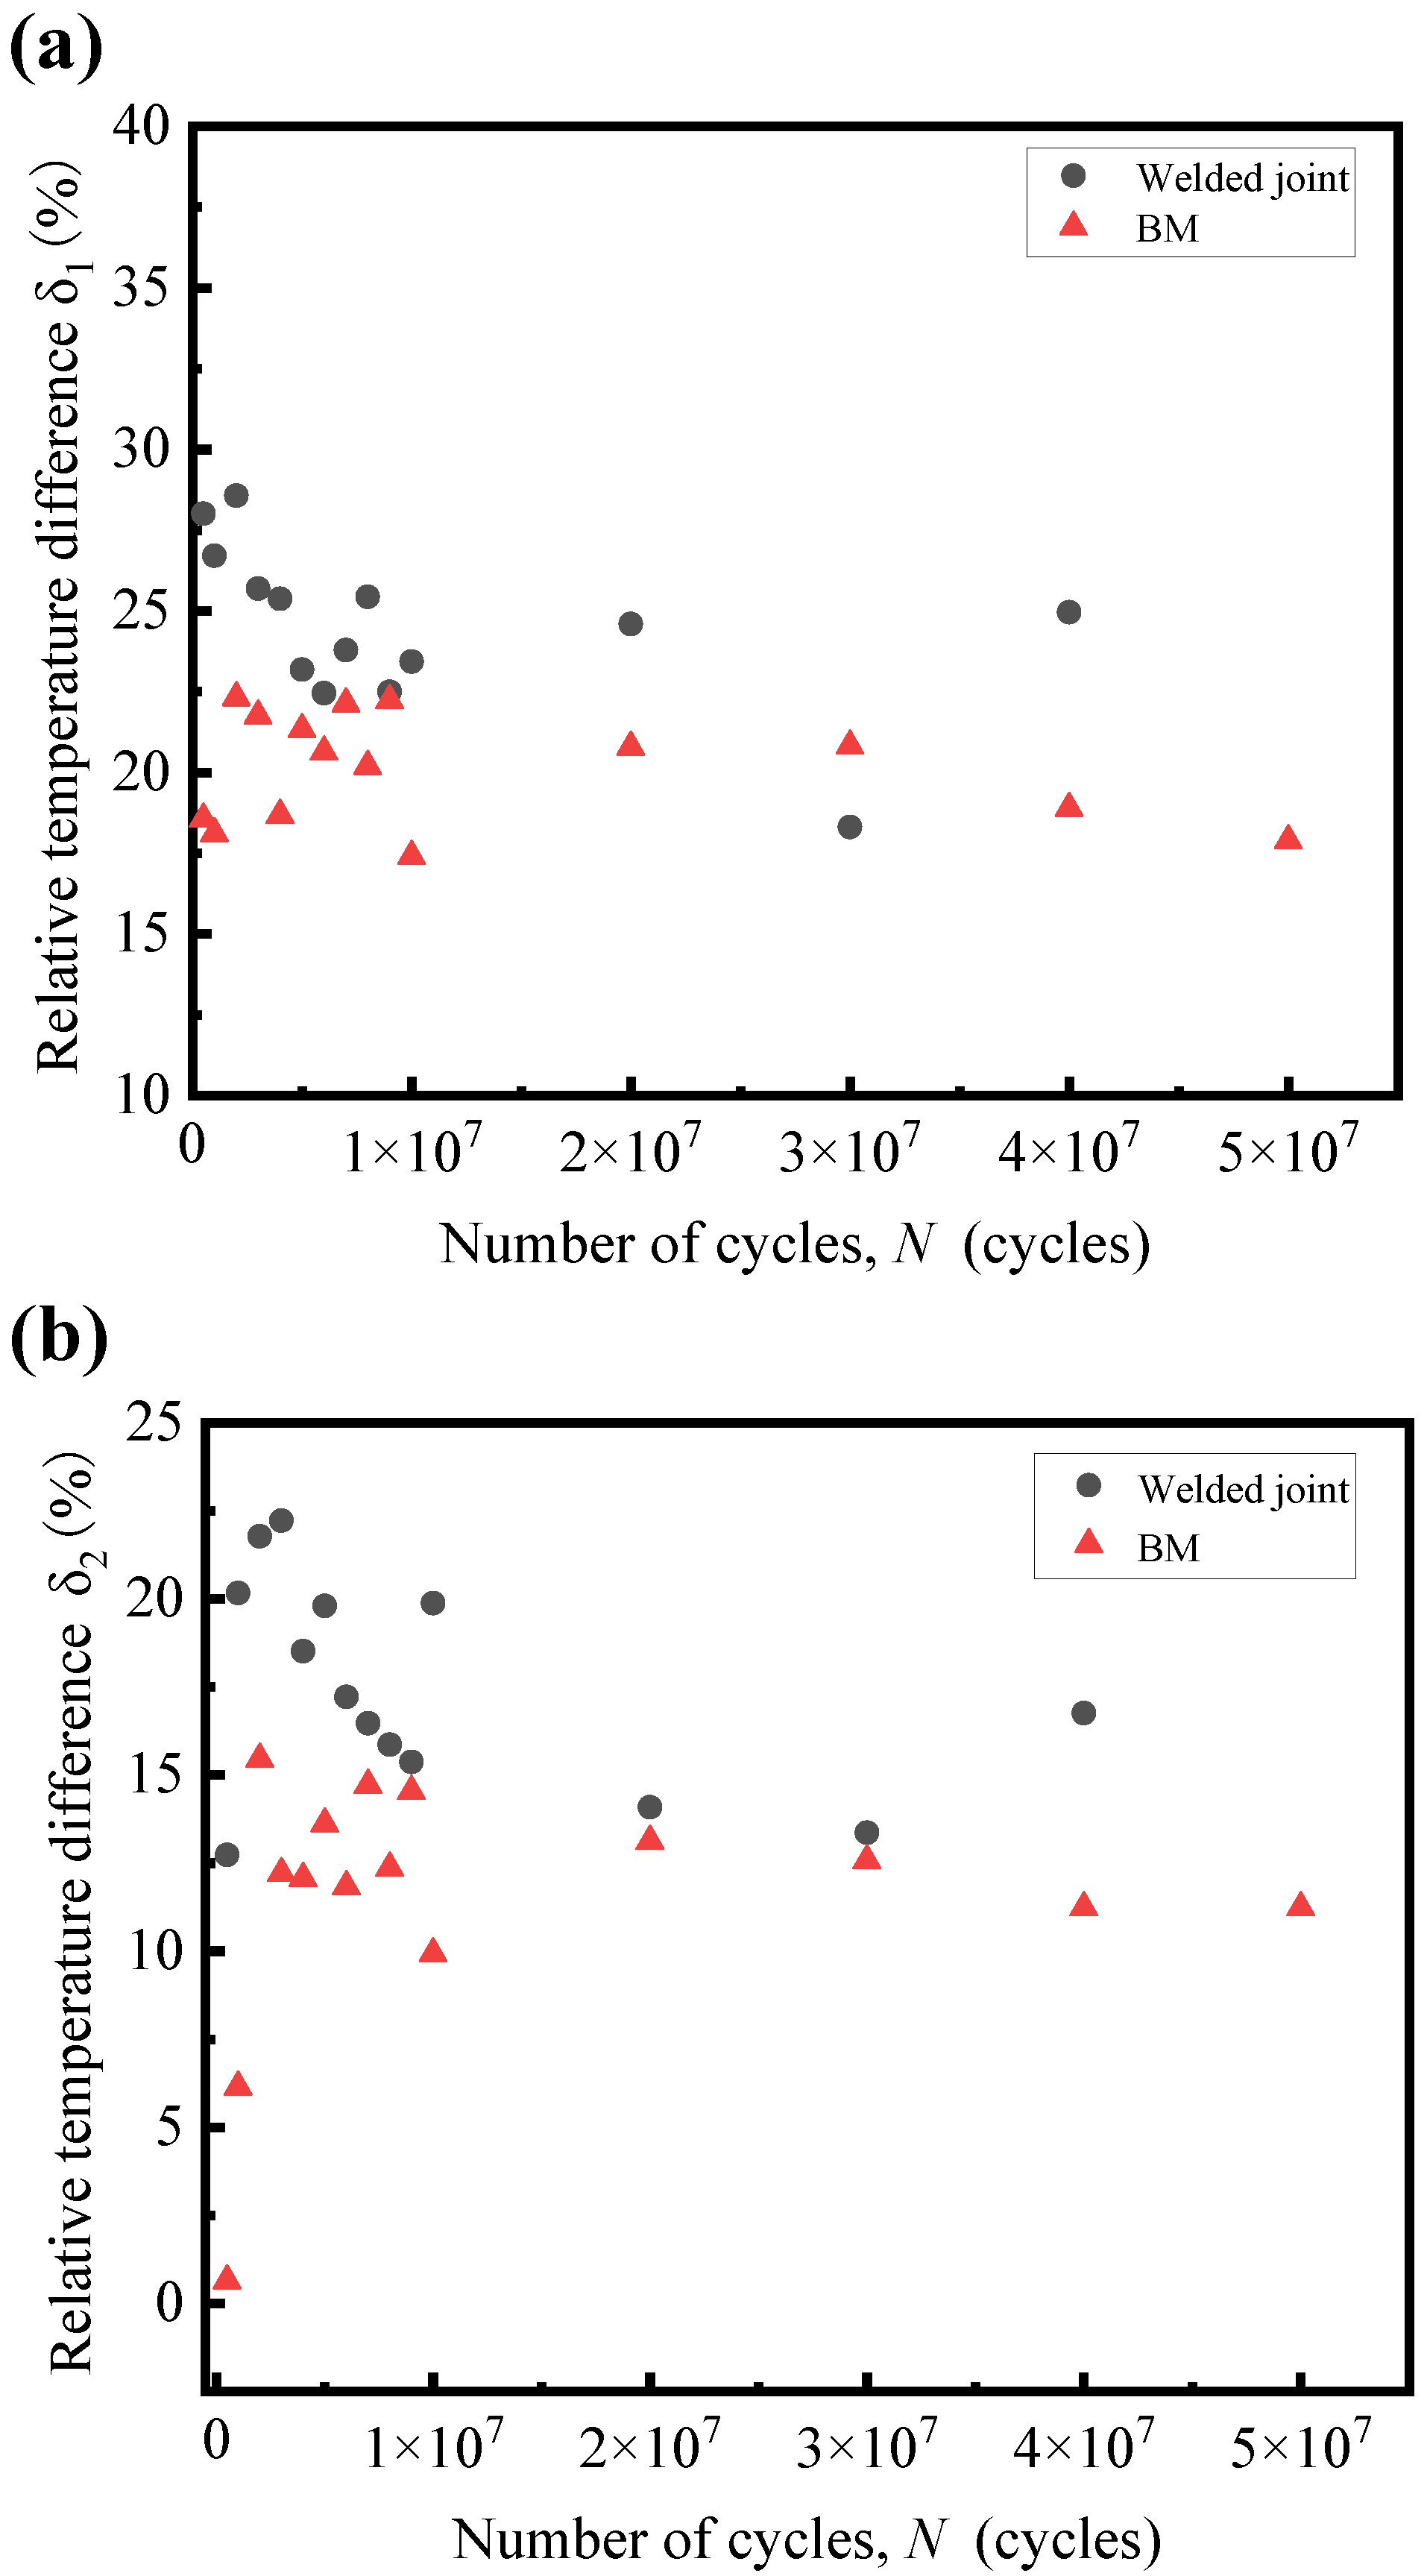
4.3. Relative Temperature Difference

Figure 9a shows the variation of relative temperature difference with number of cycles of base metal and weld joint specimens. δ1 is defined as the relative temperature difference and reflects the inhomogeneity of the specimen temperature distribution. δ1 is given as δ1 = (TmaxTmin)/Tmax, where Tmax and Tmin are the highest and lowest surface temperature of the specimen, respectively. As depicted in Figure 9a, δ1 of the BM has been maintained at approximately 20%, as the microstructure of the BM is uniform. However, δ1 of the welded joint decreases gradually and then stabilizes due to the location transfer of the ΔTmax. The microstructure of the welded joint is not uniform, and the heat transfer coefficients and heat dissipation are different, causing a more severe inhomogeneous temperature distribution. Therefore, the parameter of δ1 implies the degree of inhomogeneity of temperature distribution within the specimen.
Figure 9b exhibits the variation of relative temperature difference at both side of specimen with number of cycles of the two materials under intermittent loading. δ2 is the relative temperature difference at both sides of the specimen, and it is obtained by δ2 = (T2T1)/T2, where T1 and T2 are the surface temperature at the clamping and free side of the specimen, respectively. Note that both the δ2 of the welded joint and BM show a rising–declining–stable evolution as N increases. Nevertheless, the relative temperature difference at both sides of specimen of the welded joint is higher than that of the BM, as shown in Figure 9b. The temperature at the specimen clamping side is lower than the free side, which is most probably due to a higher heat conduction rate at the specimen clamping side and a lower heat convection rate at the free side. It appears that the difference of heat transfer mode leads to the asymmetry of temperature distribution, resulting in the change of δ2. It is expected that the temperature difference between both sides of the specimen remains basically constant at a time when the heat transfer between the specimen and the environment forms a dynamic balance. Therefore, the parameter of δ2 implies the degree of asymmetry of temperature distribution within the specimen.

4.4. Ultrasonic Fatigue Testing Consideration

Common ultrasonic fatigue specimens include iso-sectional, dog-bone, and plate shapes, and the corresponding specimen is selected based on the purpose of study. In this work, the specimens with parallel sections in the middle were chosen to ensure the same stress at the region of interest, excluding the influence of non-uniform stress on the results, facilitating the analysis of material microstructure and heat transfer on heat dissipation and judgment of the weak zone of the welded joint, and most importantly, providing further guidance for the selection of ultrasonic fatigue specimens of the welded joint.
Furthermore, intermittent loading-uncooled and continuous loading-uncooled were used to investigate the effect of loading condition on heat dissipation, which is essentially a thermal–mechanical coupling behavior. The current knowledge can provide guidance for the use of cooling in ultrasonic fatigue. In the loading without cooling, the specimen will fail in a very short time due to the influence of heating. On the contrary, the heat–force coupling effect is not evident in fatigue tests with air-cooling, where the fatigue strength of low-strength steel will be increased due to frequency effect, and the fidelity of test results needs to be compared with conventional frequency loading. This is a new field where the strengthening and microscopic mechanisms need further study.

5. Conclusions

The specimen surface temperature of a low-strength steel 25Cr2Ni2MoV welded joint and its base metal were monitored by infrared thermal imaging technique, and related mechanisms were studied. The main conclusions are listed as follows.
(1)
The influence of specimen type on heat dissipation behavior was insignificant due to similar temperature rise stages and distribution curve shape.
(2)
The position of ΔTmax on the welded joint was variable but remained in the WM, while that on BM was in the center. The ΔTmax position correlated well with fatigue failure location.
(3)
The inhomogeneity and asymmetry of temperature distribution could be well described by δ1 and δ2, implying a dominant role of heat transfer mode and insignificant influence of microstructure heterogeneity.
(4)
The standardization of ultrasonic fatigue testing should consider the thermal–mechanical coupling effect of low-strength materials.

Author Contributions

Conceptualization, M.-L.Z.; methodology, M.-L.Z.; software, J.-T.H., R.C. and G.Z.; validation, J.-T.H., R.C. and G.Z.; formal analysis, J.-T.H., R.C. and G.Z.; investigation, J.-T.H., R.C., G.Z., C.W., M.-L.Z. and F.-Z.X.; resources, C.W., M.-L.Z. and F.-Z.X.; data curation, J.-T.H.; writing—original draft preparation, J.-T.H.; writing—review and editing, R.C., G.Z. and M.-L.Z.; visualization, J.-T.H., R.C., G.Z. and M.-L.Z.; supervision, M.-L.Z.; project administration, G.Z., C.W., M.-L.Z. and F.-Z.X.; funding acquisition, G.Z. and M.-L.Z. All authors have read and agreed to the published version of the manuscript.

Funding

This research was funded by the National Natural Science Foundation of China grant number 51922041, 51835003 and the 2021 Open Project of Failure Mechanics and Engineering Disaster Prevention, Key Lab of Sichuan Province, grant number FMEDP202102.

Institutional Review Board Statement

Not applicable.

Informed Consent Statement

Informed consent was obtained from all subjects involved in the study.

Data Availability Statement

The study did not report any data.

Conflicts of Interest

The authors declare no conflict of interest.

Nomenclature

Rstress ratio
σastress amplitude
ΔTtemperature rise
ΔTmaxmaximum temperature rise
TCmaximum surface temperature of the specimen
T0room temperature
θone-dimensional temperature
A1, A2, A3fitting parameters
Tmaxhighest surface temperature
Tminlowest surface temperature
δ1relative temperature difference
T1surface temperature at the clamping side of the specimen
T2surface temperature at the free side of the specimen
δ2relative temperature difference at both sides of the specimen
SAWsubmerged arc welding
BMbase metal
WMwelded metal
PHWTpost-weld heat treatment
HAZheat-affected zone
YSyield strength
UTSultimate tensile strength

References

  1. Pyttel, B.; Schwerdt, D.; Berger, C. Very high cycle fatigue—Is there a fatigue limit? Int. J. Fatigue 2011, 33, 49–58. [Google Scholar] [CrossRef]
  2. Stanzl-Tschegg, S. Very high cycle fatigue measuring techniques. Int. J. Fatigue 2014, 60, 2–17. [Google Scholar] [CrossRef]
  3. You, X.; Liu, Y.; Cui, S.; Wang, R.; Wang, Q. Low Cycle Fatigue Behaviors of Q345B Steel and Welded Joint. J. Sichuan Univ. 2015, 47, 112–117. [Google Scholar]
  4. Liu, W.C.; Dong, J.; Zhang, P.; Zhai, C.Q.; Ding, W.J. Influence of shot peening on high cycle fatigue properties of ZK60 magnesium alloy. Chin. J. Nonferrous Met. 2009, 19, 1733–1740. [Google Scholar]
  5. Zuo, J.H.; Wang, Z.G.; Han, E.H. Effect of microstructure on ultra-high cycle fatigue behavior of Ti-6Al-4V. Mater. Sci. Eng. A 2008, 473, 147–152. [Google Scholar] [CrossRef]
  6. Zhao, X.; Ru, D.; Wang, P.; Gan, L.; Wu, H.; Zhong, Z. Fatigue life prediction of a supercritical steam turbine rotor based on neural networks. Eng. Fail. Anal. 2021, 127, 105435. [Google Scholar]
  7. Liu, F.; Chen, Y.; He, C.; Li, L.; Liu, Y. Tensile and very high cycle fatigue behaviors of a compressor blade titanium alloy at room and high temperatures. Mater. Sci. Eng. A 2021, 811, 141049. [Google Scholar] [CrossRef]
  8. Liu, C.; Zhao, M.C.; Zhao, Y.C.; Zhang, L.; Yin, D.F.; Tian, Y.; Shan, Y.Y.; Yang, K.; Atrens, A. Ultra-high cycle fatigue behavior of a novel 1.9 GPa grade super-high-strength maraging stainless steel. Mater. Sci. Eng. A 2019, 755, 50–56. [Google Scholar] [CrossRef]
  9. Sun, C.; Lei, Z.; Hong, Y. Effects of stress ratio on crack growth rate and fatigue strength for high cycle and very-high-cycle fatigue of metallic materials. Mech. Mater. 2014, 69, 227–236. [Google Scholar] [CrossRef] [Green Version]
  10. Liu, Y.B.; Yang, Z.G.; Li, Y.D.; Chen, S.M.; Li, S.X.; Hui, W.J.; Weng, Y.Q. Dependence of fatigue strength on inclusion size for high-strength steels in very high cycle fatigue regime. Mater. Sci. Eng. A 2009, 517, 180–184. [Google Scholar] [CrossRef]
  11. Jarv, A.; Gmda, B.; Masm, C. Ultrasonic Fatigue Endurance of the Maraging 300 Steel. Procedia Struct. Integr. 2021, 33, 658–664. [Google Scholar]
  12. Almaraz, G.; Tapia, M.G.; Dominguez, A. Ultrasonic Fatigue Tests on the Inconel Alloy 718. Procedia Struct. Integr. 2020, 26, 20–27. [Google Scholar] [CrossRef]
  13. Shi, Q.; Hsiel, S.A.; Jones, J.W.; Allison, J.E. Effects of alloying and processing on ultrasonic fatigue behavior in binary Ti-Al alloys. Mater. Sci. Eng. 2019, 756, 564–577. [Google Scholar] [CrossRef]
  14. Mayer, H. Recent developments in ultrasonic fatigue. Fatigue Fract. Eng. Mater. Struct. 2016, 39, 3–29. [Google Scholar] [CrossRef]
  15. Furuya, Y.; Torizuka, S.; Takeuchi, E.; Bacher-Hoechst, M.; Kuntz, M. Ultrasonic fatigue testing on notched and smooth specimens of ultrafine-grained steel. Mater. Des. 2012, 37, 515–520. [Google Scholar] [CrossRef]
  16. Wagner, V.; Starke, P.; Kerscher, E.; Eifler, D. Cyclic deformation behaviour of railway wheel steels in the very high cycle fatigue (VHCF) regime. Int. J. Fatigue 2011, 33, 69–74. [Google Scholar] [CrossRef]
  17. Zhu, M.L.; Liu, L.L.; Xuan, F.Z. Effect of frequency on very high cycle fatigue behavior of a low strength Cr–Ni–Mo–V steel welded joint. Int. J. Fatigue 2015, 77, 166–173. [Google Scholar] [CrossRef]
  18. Zhang, J.; Song, Q.; Ning, Z.; Lu, L.; Zhang, M.; Cui, G. Very high cycle fatigue property of high-strength austempered ductile iron at conventional and ultrasonic frequency loading. Int. J. Fatigue 2015, 70, 235–240. [Google Scholar] [CrossRef]
  19. Zhao, A.; Xie, J.; Sun, C.; Lei, Z.; Hong, Y. Effects of strength level and loading frequency on very-high-cycle fatigue behavior for a bearing steel. Int. J. Fatigue 2012, 38, 46–56. [Google Scholar] [CrossRef] [Green Version]
  20. Ranc, N.; Favier, V.; Munier, B.; Vales, F.; Thoquenne, G.; Lefebvre, F. Thermal Response of C45 Steel in High and Very High Cycle Fatigue. Procedia Eng. 2015, 133, 265–271. [Google Scholar] [CrossRef] [Green Version]
  21. Krewerth, D.; Lippmann, T.; Weidner, A.; Biermann, H. Application of full-surface view in situ thermography measurements during ultrasonic fatigue of cast steel G42CrMo4. Int. J. Fatigue 2015, 80, 459–467. [Google Scholar] [CrossRef]
  22. Huang, Z.Y.; Liu, H.Q.; Wang, C.; Wang, Q.Y. Fatigue life dispersion and thermal dissipation investigations for titanium alloy TC17 in very high cycle regime. Fatigue Fract. Eng. Mater. Struct. 2015, 38, 1285–1293. [Google Scholar] [CrossRef]
  23. Nassiraei, H.; Rezadoost, P. Stress concentration factors in tubular T/Y-joints strengthened with FRP subjected to compressive load in offshore structures. Int. J. Fatigue 2020, 140, 105719. [Google Scholar] [CrossRef]
  24. Nassiraei, H. Static strength of tubular T/Y-joints reinforced with collar plates at fire induced elevated temperature. Mar. Struct. 2019, 67, 102635. [Google Scholar] [CrossRef]
  25. Lu, F.; Liu, X.; Wang, P.; Wu, Q.; Cui, H.; Huo, X. Microstructural characterization and wide temperature range mechanical properties of NiCrMoV steel welded joint with heavy section. J. Mater. Res. 2015, 30, 2108–2116. [Google Scholar] [CrossRef]
  26. Guo, S.-J.; Wang, R.-Z.; Chen, H.; Xuan, F.-Z. A comparative study on the cyclic plasticity and fatigue failure behavior of different subzones in CrNiMoV steel welded joint. Int. J. Mech. Sci. 2019, 150, 66–78. [Google Scholar] [CrossRef] [Green Version]
  27. Zhu, M.L.; Xuan, F.Z. Effect of microstructure on strain hardening and strength distributions along a Cr–Ni–Mo–V steel welded joint. Mater. Des. 2015, 65, 707–715. [Google Scholar] [CrossRef]
  28. Zhu, G.; Wu, Y.C.; Zhu, M.L.; Xuan, F.Z. Towards a general damage law for interior micro-defect induced fatigue cracking in martensitic steels. Int. J. Fatigue 2021, 153, 106501. [Google Scholar] [CrossRef]
Figure 1. OM observation of microstructures of the welded joint: (a) WM, (b) BM, (c) HAZ.
Metals 12 01857 g001
Figure 2. Shape and dimension of cross-welded ultrasonic fatigue specimen (mm).
Metals 12 01857 g002
Figure 3. Full-surface view of thermography measurements of welded joint under different cycles at σa = 645 MPa (the stress level is beyond yield point meaning obvious frequency effect): (a) N = 0, (b) N = 5 × 10⁵, (c) N = 1 × 10⁶, (d) N = 1 × 10⁷, (e) N = 3 × 10⁷, (f) N = 4 × 10⁷.
Metals 12 01857 g003
Figure 4. Full-surface view of thermography measurements of BM under different cycles at σa = 645 MPa: (a) N = 0, (b) N = 5 × 10⁵, (c) N = 1 × 10⁶, (d) N = 1 × 10⁷, (e) N = 3 × 10⁷, (f) N = 5 × 10⁷.
Metals 12 01857 g004
Figure 5. The surface topography of welded joint fatigued specimen (σa = 645 MPa, Nf = 4.02 × 10⁷ cycles): (a) and (d) burning area, (b) and (c) crack, (e) fatigue specimen.
Metals 12 01857 g005
Figure 6. Fracture morphology of crack initiation zone: (ac) base metal specimen at σa = 645 MPa, (df) welded joint specimen at σa = 645 MPa.
Metals 12 01857 g006
Figure 7. Evolution of specimen surface temperature with the number of cycles of welded joint and base metal specimens at σa = 645 MPa: (a) intermittent loading without cooling, (b) continuous loading without cooling.
Metals 12 01857 g007
Figure 8. Specimen surface temperature distribution along axial direction of welded joint and BM specimens at σa = 645 MPa: (a) welded joint, (b) base metal.
Metals 12 01857 g008
Figure 9. Relative temperature difference versus the number of cycles: (a) δ1, (b) δ2.
Metals 12 01857 g009
Table 1. Chemical composition of WM (wt%).
CrMoNiCMnSi
0.690.712.620.201.630.35
Table 2. Chemical composition of BM (wt%).
CSiMnPSNiCrMoVCu
0.18–0.270.120.12–0.280.0150.0152.05–2.352.15–2.450.62–0.820.120.17
Table 3. Mechanical properties of the welded joint.
Yield Strength (MPa)Ultimate Tensile Strength (MPa)Modulus of Elasticity (GPa)Elongation (%)Reduction of Area (%)
63472219313.278.4
Publisher’s Note: MDPI stays neutral with regard to jurisdictional claims in published maps and institutional affiliations.

