Article

Microstructure-Based Modelling of Flow and Fracture Behavior of Tailored Microstructures of Ductibor® 1000-AS Steel

Department of Mechanical and Mechatronics Engineering, University of Waterloo, 200 University Avenue West, Waterloo, ON N2L 3G1, Canada
*
Author to whom correspondence should be addressed.
Metals 2022, 12(10), 1770; https://doi.org/10.3390/met12101770
Submission received: 2 October 2022 / Revised: 15 October 2022 / Accepted: 17 October 2022 / Published: 21 October 2022
(This article belongs to the Special Issue Hot Sheet Metal Forming of High Performance Materials)

Abstract

:
Emerging grades of press-hardening steels such as Ductibor® 1000-AS are now commercially available for use within tailor-welded blanks (TWBs) to enhance ductility and energy absorption in hot-stamped automotive structural components. This study examines the constitutive (hardening) response and fracture limits of Ductibor® 1000-AS as functions of the as-quenched microstructure after hot stamping. Three different microstructures consisting of bainite and martensite were obtained by hot stamping with die temperatures of 25 °C, 350 °C, and 450 °C. Mechanical characterization was performed to determine the hardening curves and plane-stress fracture loci for the different quench conditions (cooling rates). Uniaxial-tension and shear tests were conducted to experimentally capture the hardening response to large strain levels. Shear, conical hole-expansion, plane-strain notch tension, and Nakazima tests were carried out to evaluate the stress-state dependence of fracture. A mean-field homogenization (MFH) scheme was applied to model the constitutive and fracture behavior of the mixed-phase microstructures. A dislocation-based hardening model was adopted for the individual phases, which accounts for material chemistry, inter-phase carbon partitioning, and dislocation evolution. The per-phase fracture modelling was executed using a phenomenological damage index based upon the stress state within each phase. The results revealed that the 25 °C hot-stamped material condition with a fully martensite microstructure exhibited the highest level of strength and the lowest degree of ductility. As bainite was formed in the final microstructure by quenching at higher die temperatures, the strength decreased, while the ductility increased. The predicted constitutive and fracture responses in the hot-stamped microstructures were in line with the measured data. Accordingly, the established numerical strategy was extended to predict the mechanical behavior of Ductibor® 1000-AS for a broad range of intermediate as-quenched microstructures.

Graphical Abstract

1. Introduction

Boron steels are commonly used in the production of car structures with intrusion-resisting applications [1]. The hot-stamping (press-hardening) process is typically used to form these steels so as to exploit their higher formability at elevated temperatures and strengthening during quenching [2,3]. The resultant high-strength hot-stamped components often have limited ductility and energy-absorption capacity and might not be suitable for crash-safety applications individually [4]. To expand the range of applications of hot stamping, tailor-welded blanks (TWBs) were introduced to fabricate products with various combinations of strength and ductility. The parent metals in such weldments acquire distinct levels of strength and ductility in final press-hardened products due to differences in their hardenability [5].
Usibor® 1500-AS and Ductibor® 500-AS, with strength levels of around 1500 MPa and 600 MPa and elongation of 6% and 22% in the die-quenched condition, respectively, are two steels that have been combined within hot-stamping TWBs [6]. Usibor® 1500-AS attains a fully martensitic microstructure after die quenching [7], whilst the press-hardened Ductibor® 500-AS microstructure is mostly ferritic-martensitic [8]. Naderi et al. [9], Bardelcik et al. [10], Eller et al. [11], Turetta et al. [12], Barcellona and Palmeri [13], Taylor et al. [14], and Mohr and Ebnoether [15] studied the mechanical response of Usibor® 1500-AS with various microstructures. Abdollahpoor et al. [16] investigated the sensitivity of the Usibor® 1500-AS microstructure and hardness to hot-stamping process parameters. Hagenah et al. [17] generated a material model to calculate the Usibor® 1500-AS tensile strength in different hot-stamped conditions according to the quench rates and plastic strains experienced during the press-hardening process. Srithananan et al. [18], Östlund et al. [19], and Golling et al. [20,21] calculated the flow and fracture behavior of various as-quenched conditions of Usibor® 1500-AS using microstructure-based models. Mishra [22] reported on the microstructures of Ductibor® 500-AS under distinct cooling conditions and examined their mechanical properties. Samadian et al. [23] investigated the dependency of the constitutive and fracture behavior of Ductibor® 500-AS on its as-quenched microstructures.
Ductibor® 1000-AS is an alternative to Ductibor® 500-AS in press-hardening TWBs, with strength and ductility that are intermediate between those of Usibor® 1500-AS and Ductibor® 500-AS after hot stamping. Similar to Ductibor® 500-AS, this steel can also be joined to Usibor® 1500-AS within TWBs to enhance the ductility of press-hardened products, thereby improving their energy absorption. There are relatively few studies on Ductibor® 1000-AS in the open academic literature. Notable exceptions include Güner et al. [24] and Sarkar et al. [25], who studied the effects of different process parameters such as the austenitization temperature, furnace-to-die transfer time, as well as the die pressure, temperature, and geometry on the final properties of Ductibor® 1000-AS after hot stamping. In terms of in-service properties, Lee [26] examined the crashworthiness of monolithic Ductibor® 1000-AS in the die-quenched condition. Mohamadizadeh et al. [27] investigated the spot-weld failure in the die-quenched Ductibor® 1000-AS.
At present, no published research has focused on the correlation between the microstructure and mechanical properties of the hot-stamped Ductibor® 1000-AS, while the mechanical performance of press-hardened products is known to vary significantly with microstructural changes due to fluctuations in hot-stamping conditions. Given the crash-safety applications of Ductibor® 1000-AS and the dependency of its mechanical response on the as-quenched microstructure, it is crucial to understand the interrelationship between the microstructure and mechanical properties of this steel following hot stamping. To address this gap in the literature, the current work examined the hardening and fracture behavior of Ductibor® 1000-AS in different die-quenched conditions under quasi-static loading. To develop distinct microstructures, the steel blanks were hot-stamped using flat dies kept at temperatures of 25 °C, 350 °C, and 450 °C. Microstructure and hardness investigations were conducted on the as-quenched blanks. Uniaxial-tension, shear, conical hole-expansion, plane-strain notch tension, and Nakazima tests were performed to characterize the mechanical behavior of each material condition (microstructure) in terms of hardening and fracture. A mean-field homogenization (MFH) strategy was developed to model the hardening and fracture responses in the mixed-phase microstructures based on the flow behavior of the micro-constituents calculated using a dislocation-based constitutive model and tracking damage accumulation within each micro-constituent using a phenomenological damage indicator. The predictions and measurements for the produced multi-phase microstructures were then compared. Ultimately, the developed numerical scheme was applied to predict the constitutive and fracture responses in Ductibor® 1000-AS for a range of the as-quenched microstructures with several phase volume fractions.

2. Experiments

The material of interest in the study was a 1.2 mm-thick Ductibor® 1000-AS steel sheet, with the nominal elemental composition given in Table 1.
Three different microstructures were obtained by austenitization at 930 °C for 390 s (6.5 min) in an air furnace and then quenching between flat dies with temperatures of 25 °C, 350 °C, and 450 °C under a 15 MPa contact pressure for 15 s, followed by air cooling to room temperature. The 25 °C temperature represents an “ideal” die temperature targeted for hot stamping, although hot-stamping die temperatures in practice can increase up to 200 °C during mass production due to inadequate cooling [24]. Ductibor® 1000-AS, similar to Usibor® 1500-AS, also has the potential to be used within the in-die heating (IDH) hot-stamping process to create components with graded strength and ductility. The local die temperature in the IDH hot-stamping process can exceed 400 °C [28]; therefore, the selected die temperatures cover the range of expected values within various hot-stamping processes and serve to produce different microstructures. The average heating rate of the blanks was 7 °C/s, and their average cooling rates while cooling from 700 °C to 200 °C were 243 °C/s, 47 °C/s, and 21 °C/s for the 25 °C, 350 °C, and 450 °C die temperatures, respectively. The thermal history measurements were conducted using thermocouples and a data acquisition system of Omega OMB-DAQ-55 (Omega, St-Eustache, QC, Canada). The details about the specimen geometry and thermocouple locations are provided by Omer et al. [29]. Microstructure and hardness investigations were performed for the as-received and as-quenched blanks. Light optical microscopy (LOM) (Keyence, Mississauga, ON, Canada) and scanning electron microscopy (SEM) (FEI, Hillsboro, OR, USA) were used for the microstructural examinations. A 5% nital etchant was used to reveal the microstructures. Analyses of phase quantities were performed on the SEM images (due to higher clarity with respect to the LOM images) using a systematic manual point-count method [30]. Vickers microhardness measurements were carried out under a load of 1 kgf (~9.8 N) for a 15 s dwell time.
To measure the constitutive behavior of each material condition, tensile tests were performed on samples (Figure 1) of the hot-stamped blanks cut at angles of 0°, 45°, and/or 90° relative to the rolling direction (RD). The fracture response along the limiting direction in terms of ductility, i.e., the transverse direction (TD), was characterized through shear, conical hole-expansion, plane-strain notch tension, and Nakazima tests, with the specimen geometries illustrated in Figure 1.
The tensile, shear, and plane-strain notch tension tests were conducted with an initial nominal strain rate of 0.01/s. In the hole-expansion and Nakazima tests, a constant punch speed of 0.25 mm/s and a binder force of 660 kN were applied. To promote a fracture near the sample center in the Nakazima tests, Teflon sheets with petroleum jelly were placed between the punch and specimens. At least four repeats were performed for each experiment type. A stereoscopic digital image correlation (DIC) system with Point Grey Research GRAS-50S5M-C cameras (Point Grey, Richmond, BC, Canada) and the Correlated Solutions DIC software of Vic3D (9, Correlated Solutions, Irmo, SC, USA) were utilized to measure the surface strains of the specimens. In the DIC analyses, a 0.3 mm virtual strain gauge length (VSGL) [36] with a 1 or 2 pixel step size and a 5 filter size was employed. Sandblasting was carried out on the hot-stamped samples prior to testing to remove the Al-Si coating, which would otherwise flake off and compromise the DIC strain measurements. For the tensile tests, the instant of fracture was considered to be the moment prior to material rupture given the rapid occurrence of fracture across the gauge area. For the hole-expansion, plane-strain notch tension, and Nakazima tests, the first visible cracks corresponded to the onset of fracture. Due to the difficulty in the visual determination of crack formation in the shear tests, the point of maximum load was chosen to correspond to the onset of fracture, which is expected to be a conservative estimate [36]. For the tensile samples, axial extensometers with 50 mm lengths were set up in Vic3D to measure engineering strains. For the shear, plane-strain notch tension, and Nakazima specimens, the principal strains at fracture were extracted from rectangle- (0.25 mm × 0.4 mm) and circle-shaped (0.25 mm and 0.5 mm in radius) sampling areas around the fracture locations in Vic3D, respectively. For the hole-expansion samples with the CNC-machined hole edges, the outer diameters of the holes at the initial and final stages of deformation ( d 0 and d f , respectively) were measured to obtain the equivalent fracture strains ( ε f e q ) via Equation (1), given the pure tension stress state that was assumed at the edges of the holes, away from the conical punch.
ε f e q = ln d f d 0
It is noted that for the plane-strain notch tension and Nakazima specimens, the fracture strains were also measured based on post-mortem thickness measurements (Figure 2) due to localized necking before fracture. The surface-measurement basis of the DIC system normally results in the underestimation of fracture strains for the above-mentioned samples. Nonetheless, the post-mortem thickness measurements are rupture strains and thus generally overestimate the fracture strain that corresponds to the onset of fracture [37]. For the strain corrections, the methodology by Gorji et al. [38] was adopted, whereby deformation is assumed to be plane strain between the last DIC image and rupture. Given von Mises plasticity, the corrected equivalent fracture strains were calculated using Equation (2) in terms of the DIC-based equivalent fracture strains ( ε D I C e q ), initial thicknesses ( t 0 ), thicknesses at fracture ( t f ), and DIC-based third principal strains at fracture ( ε 3 D I C ) [23]:
ε f e q = ε D I C e q 2 3 ( ln t f t 0 ε 3 D I C )

3. Microstructure-Based Modelling

To model the constitutive and fracture responses in the bainitic-martensitic microstructures of the die-quenched Ductibor® 1000-AS, the mean-field homogenization (MFH) approach due to Samadian et al. [39] was extended to consider changes in the strength levels of the constituent phases in different microstructures. A detailed description of the proposed numerical strategy is provided in the following sections.

3.1. Flow Response

The continuum hardening behavior of multi-phase (bainitic-martensitic) microstructures of Ductibor® 1000-AS in the TD was modelled micromechanically using the interpolative self-consistent (INSC) MFH model developed by Samadian et al. [40]. The mixed-phase microstructures were treated as dual-phase composites, in which the softer bainitic-phase matrix encloses randomly distributed, spherical, harder martensitic-phase inclusions. Strain partitioning between the micro-constituents for any given displacement boundary conditions was computed using the INSC strain concentration tensors for the inclusions and matrix ( A I N S C ( i ) and A I N S C ( m ) , respectively), presented in Equations (3) and (4):
ε ( i ) = A I N S C ( i ) : ε A I N S C ( i ) = ( 1 ξ ) A S C ( i ) + ξ A I S C ( i )
ε ( m ) = A I N S C ( m ) : ε A I N S C ( m ) = I ( 4 ) f ( i ) A I N S C ( i ) f ( m )
in which:
A S C ( i ) = [ I ( 4 ) + S ¯ : [ L ¯ ] 1 : ( L ( i ) L ¯ ) ] 1
A I S C ( m ) = [ I ( 4 ) + S ¯ : [ L ¯ ] 1 : ( L ( m ) L ¯ ) ] 1 A I S C ( i ) = I ( 4 ) f ( m ) A I S C ( m ) f ( i )
In the above equations, ε ( i ) and ε ( m ) are strain tensors for the inclusions and matrix; ε is the macroscopic strain tensor; A S C ( i ) is the self-consistent (SC) strain concentration tensor for the inclusions; A I S C ( i ) and A I S C ( m ) are the inverse self-consistent (ISC) strain concentration tensors for the inclusions and matrix; I ( 4 ) and ξ are the fourth-order identity tensor and an interpolation function; f ( i ) and f ( m ) are the volume fractions of the inclusions and matrix; L ( i ) , L ( m ) , and L ¯ are the inclusion, matrix, and composite fourth-order elastic tensors; and S ¯ is the fourth-order Eshelby tensor based upon the properties of the composite and the geometry of inclusions, respectively. The interpolation function by Lielens et al. [41] was applied in the INSC model:
ξ = 1 2 f ( i ) ( 1 + f ( i ) )
In Equations (5) and (6), since the mechanical properties of the composite (steel) are not known in advance, L ¯ and S ¯ are computed iteratively within the MFH integration for each step of deformation. It should be noted that the INSC model, which is an interpolation of the SC and ISC schemes, is able to consider the influences of the inclusion volume fractions and self-interactions. The first-order secant-based linearization scheme was used to enable the MFH model to describe the non-linear hardening behavior of the material [42]. This linearization scheme updates stresses and strains in the micro-constituents via their secant moduli (ratios of overall stress and strain in the micro-constituents) and can only be used in proportionally monotonic loading.
The per-phase flow behavior was modelled using the hardening law due to Rodriguez and Gutierrez [43]:
σ ( MPa ) = σ 0 + Δ σ + α M μ b 1 exp ( M k ε ¯ p ) k L
where:
σ 0 = 77 + 750 ( % P ) + 60 ( % S i ) + 80 ( % C u ) + 45 ( % N i ) + 60 ( % C r ) + 11 ( % M o ) + 5000 ( % N s s )
for bainite (adopted from [18]):
Δ σ = 900 ( % C s s B )
for martensite:
Δ σ = 3065 ( % C s s M ) 161
This model takes account of the lattice friction (Peierls stress) and alloying elements by σ 0 , inter-phase carbon partitioning by Δ σ , and dislocation evolution with plastic deformation by the last expression in Equation (8). In this study, the intra-phase contents of all alloying elements but carbon were assumed to be the same as the macroscopic chemistry. The carbon concentration of martensite was considered to be a calibration parameter for the studied mixed-phase microstructures. Accordingly, the carbon content of bainite was calculated using Equation (12) in terms of the carbon weight percentages within the steel and martensite ( % C s s s t e e l and % C M , respectively) and the martensite volume fraction ( V M ), given the carbon weight balance in the steel:
% C B = % C s t e e l V M . % C M 1 V M
A dislocation strengthening constant ( α ) of 0.33, Taylor’s factor ( M ) of 3, a shear modulus ( μ ) of 80,000 MPa, and a Burgers vector ( b ) of 2.5 × 10⁻¹⁰ m were considered [44]. The martensite dislocation mean free path ( L ) and recovery rate ( k ) were obtained by the calibration of the hardening model in Equation (8) with the experimental hardening response of the fully martensitic microstructure. For the bainite, L and k were identified by a least-squares minimization of the deviation of the predicted flow stress-strain data with respect to the tensile and shear-based experimental results.
The mixed-phase microstructures and the constituent phases were assumed to be isotropic and adhere to von Mises plasticity. The stresses within the micro-constituents, corresponding to the partitioned strains calculated by the INSC model, were obtained via the convex cutting-plane (CCP) algorithm [45]. A constraint of plane-stress loading was imposed at the macroscopic level based on the Newton iteration scheme [45]:
( Δ ε 33 ) k = ( Δ ε 33 ) k 1 [ σ 33 L ¯ 3333 ] k 1 ( k = 1 , 2 , , & n )
In this technique, through-thickness stress components ( σ 33 ) at different steps of deformation were enforced to be within a given tolerance ( | σ 33 | 10 4 MPa) by varying the respective strain-increment components ( Δ ε 33 ) in distinct iterations ( k ).

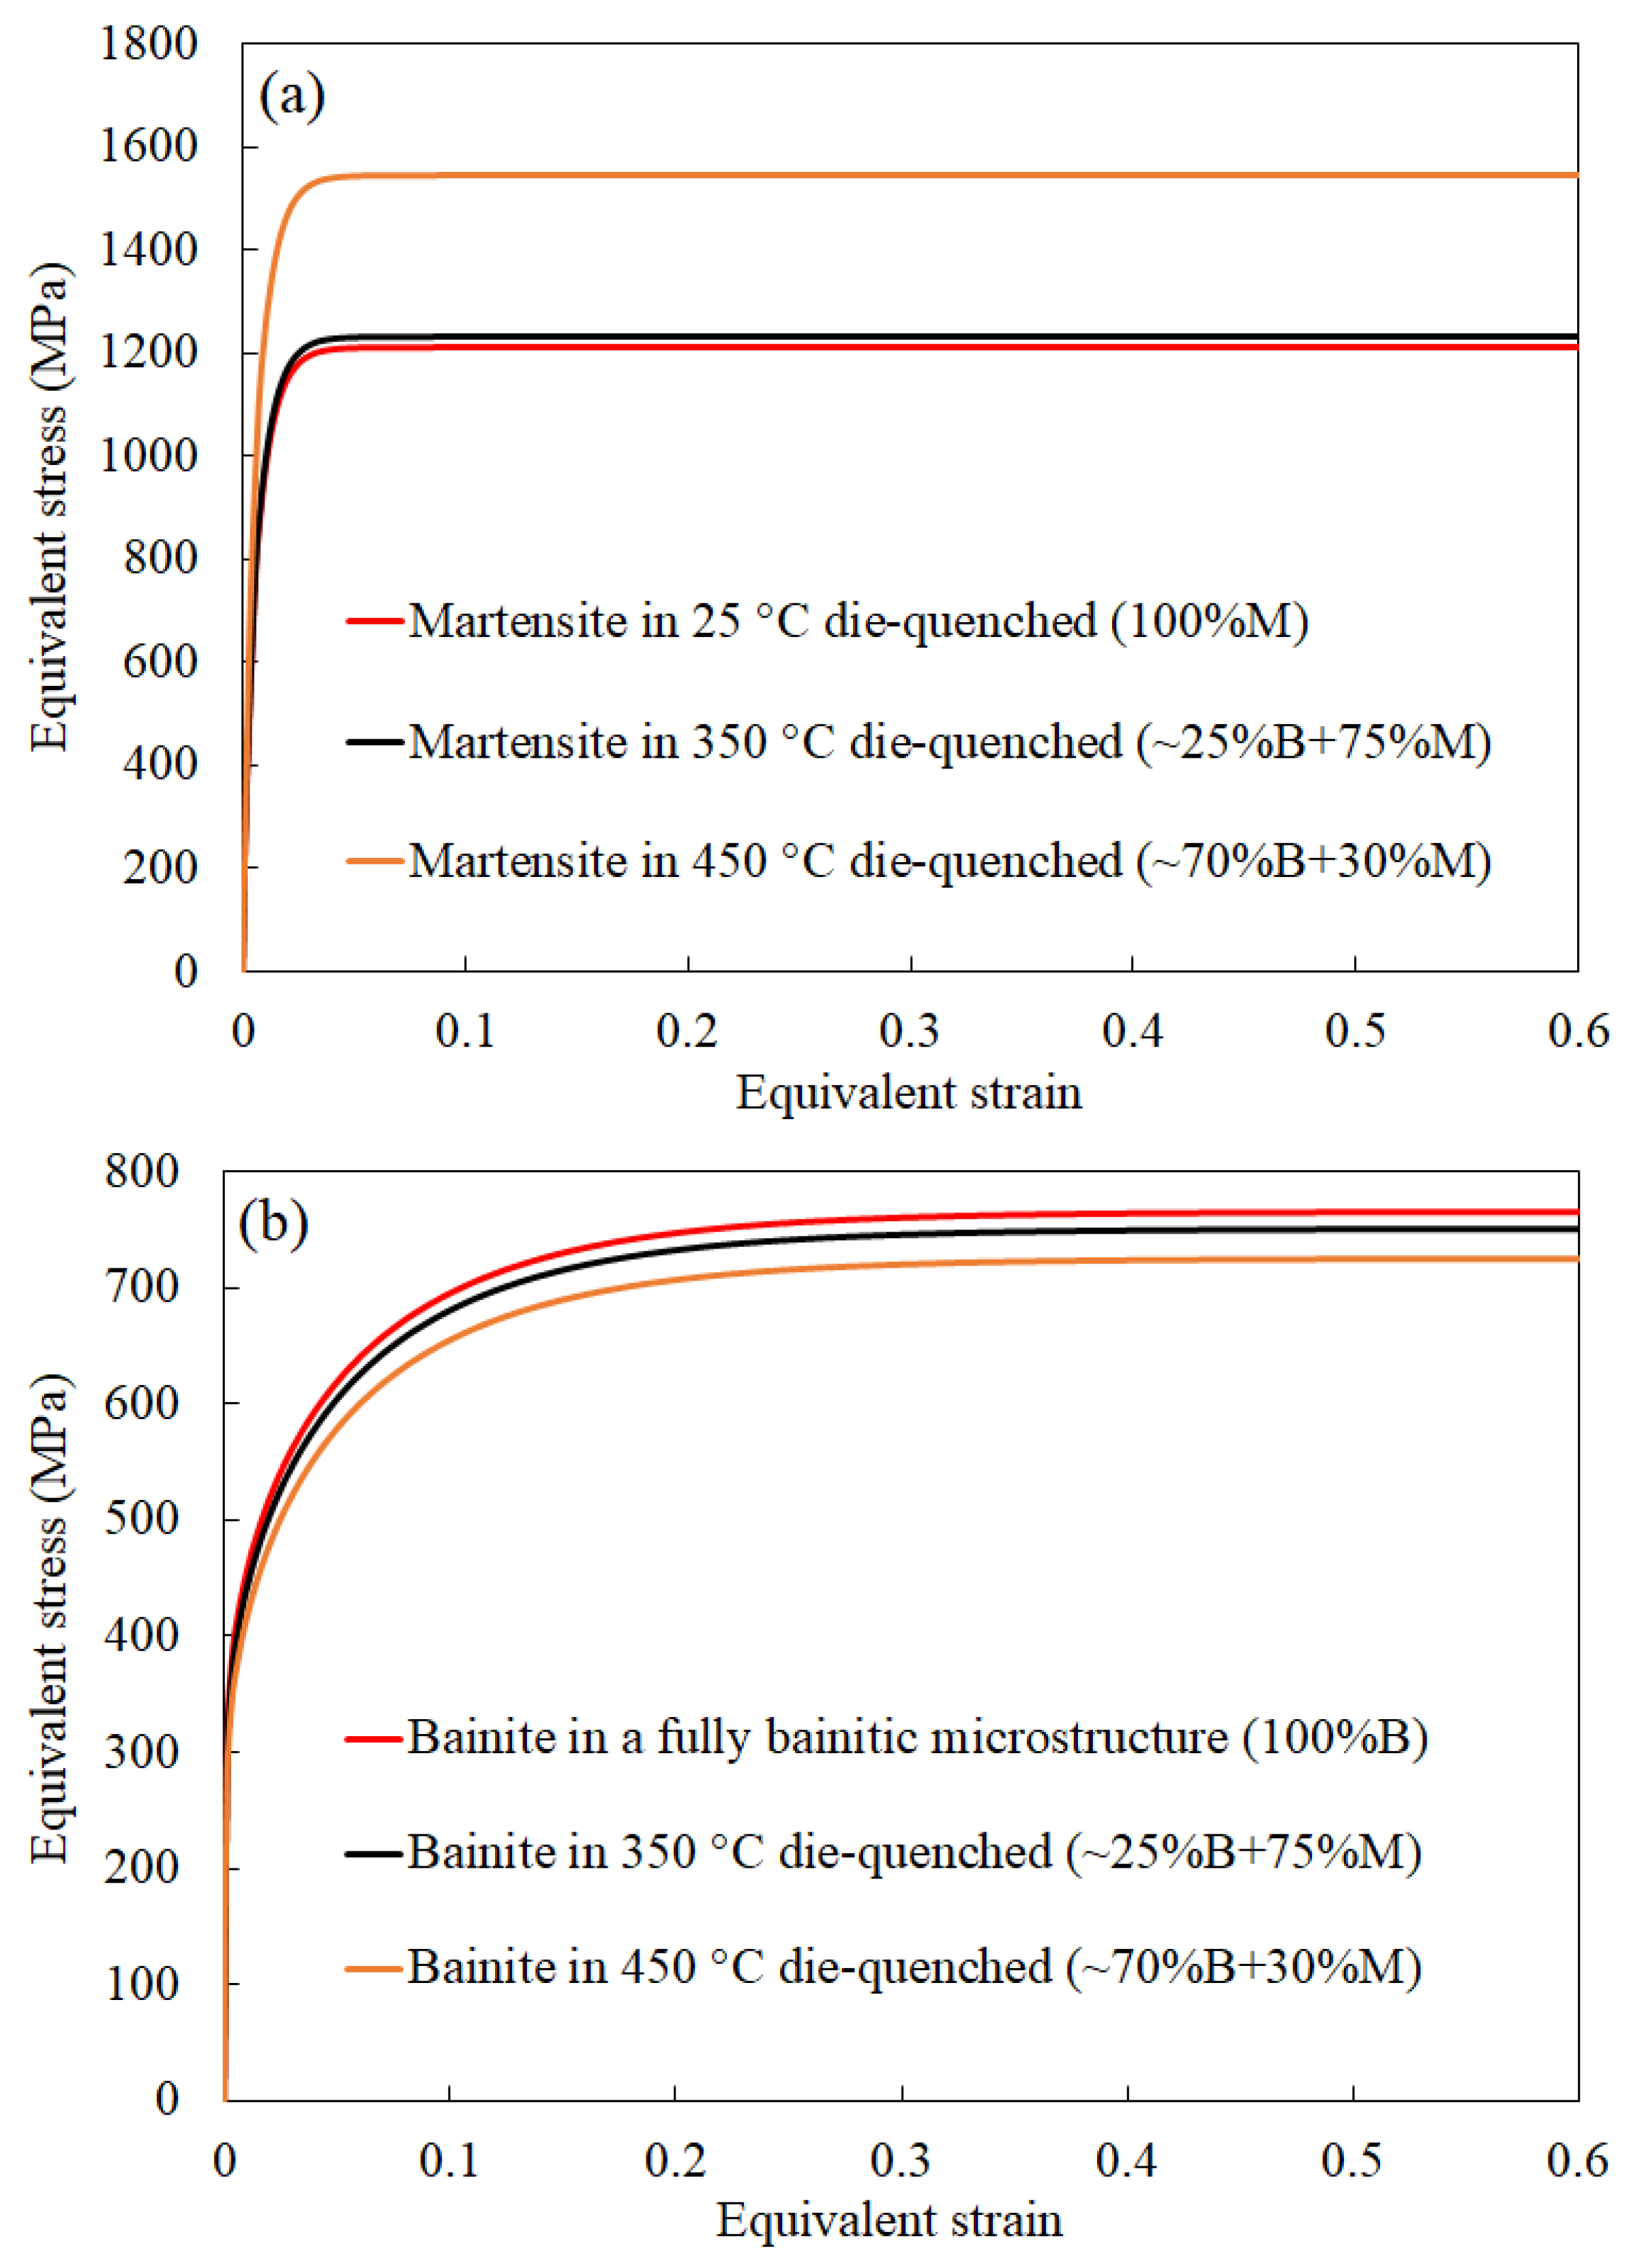
3.1.1. Flow Curves of Reference Microstructures

The true stress-strain response of the developed microstructures of Ductibor® 1000-AS was first calculated up to the ultimate tensile strength (UTS) based on the engineering stress-strain data acquired in the tensile tests along the TD. The obtained flow stresses and strains were then extrapolated beyond the UTS points using the shear-test data based on the shear-conversion technique due to Rahmaan et al. [36]. In this method, the lack of localized necking up to very large strains in the shear specimens is exploited, and shear stresses and strains are converted to tensile values using the shear-to-tensile stress ratio and plastic-work equivalence. In this work, as per a suggestion by Noder and Butcher [46], the stress ratios at the diffuse-necking (UTS) points were adopted for converting the shear stresses (until the peak shear stress) to the tensile stresses beyond the UTS points. The work-conjugate equivalent plastic strains ( ε e q p ) were then computed using Equation (14) [47], considering the deviation of stress and strain principal axes from each other during simple-shear loading:
ε e q p = 2 ( τ σ n ) sinh ( ε 1 p )
In the above equation, τ and σ n are the shear stress and tensile (normal) stresses, and ε 1 p is the major principal plastic strain in the shear testing.

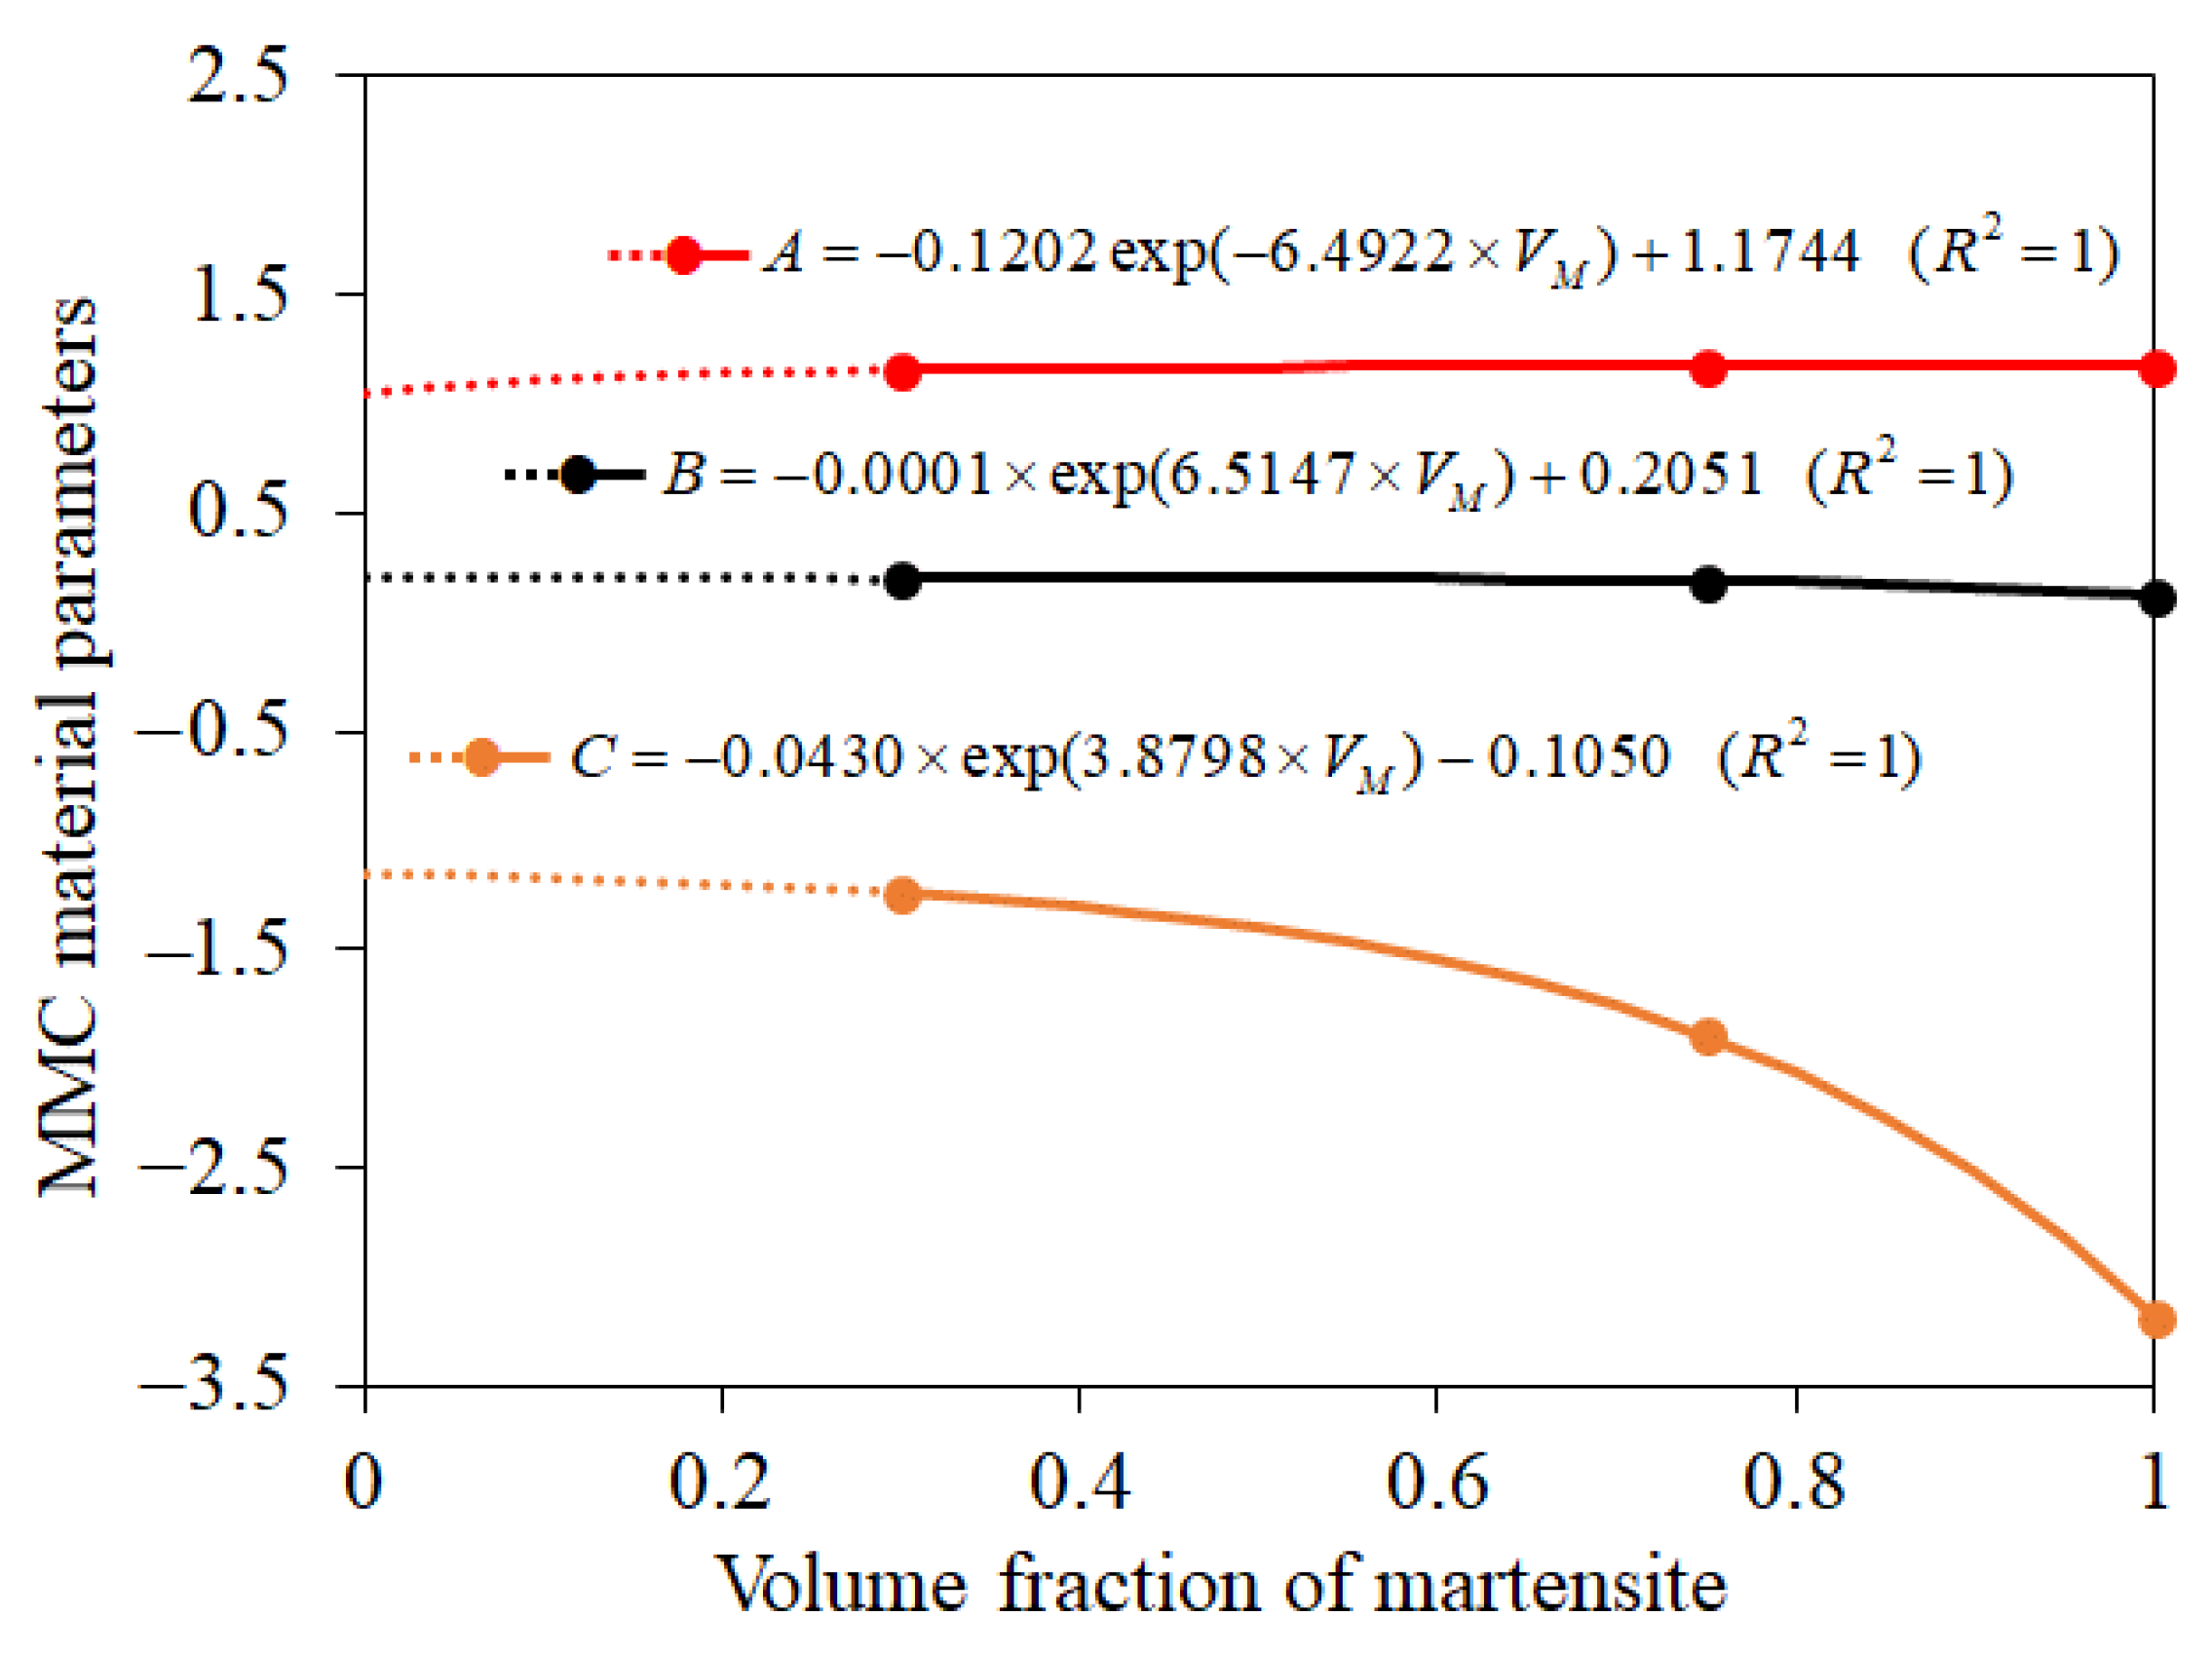
3.2. Fracture Response

To model fracture in the Ductibor® 1000-AS mixed-phase (bainitic-martensitic) microstructures, the Generalized Incremental Stress State Dependent Damage Model (GISSMO) [48] was employed within the MFH numerical framework to compute the accumulation of damage at the micro level. In this manner, the GISSMO damage indicator for the individual phases ( D ( r ) ) was calculated using Equation (15) based on their instantaneous equivalent plastic strain ( ε ¯ p ( r ) ) and equivalent fracture strain associated with their current stress states ( ε ¯ f ( r ) ) at each deformation level.
D ( r ) = d D ( r ) = d [ ( ε ¯ p ( r ) ε ¯ f ( r ) ) n ( r ) ] = ε ¯ p ( r ) n ( r ) ε ¯ f ( r ) ( ε ¯ p ( r ) ε ¯ f ( r ) ) n ( r ) 1 d ε ¯ p ( r )
The fracture limits of bainite and martensite were taken from the fracture loci for the Ductibor® 1000-AS fully bainitic and fully martensitic microstructures, respectively, given the stress triaxiality ( η ) and Lode parameters ( ξ ) calculated for each phase using Equations (16) and (17):
η = σ m σ ¯
ξ = 27 2 J 3 σ ¯ 3
In the above equations, σ m , J 3 , and σ ¯ represent the hydrostatic stress, deviatoric stress tensor third invariant, and von Mises equivalent stress, respectively. Given the unknown influence of changes in the micro-scale strength with the phase quantity on the per-phase damage accumulation within the Ductibor® 1000-AS bainitic-martensitic microstructures, the GISSMO damage exponent for each micro-constituent ( n ( r ) ) was considered to be a calibration parameter. The optimized values of n ( r ) were determined using a least-squares technique in FORTRAN 90, minimizing the deviation of the predicted fracture strains from the experimental values. The initiation of fracture in the bainitic-martensitic microstructures corresponded to the moment that the GISSMO damage indicator became unity for either bainite or martensite.
The numerical strategy outlined in Section 3.1 and Section 3.2 was written in the format of a FORTRAN 90 code. Then the constitutive and fracture responses in the Ductibor® 1000-AS bainitic-martensitic microstructures with a variety of micro-constituent contents were calculated under different loading conditions. The algorithm of the employed scheme for MFH integration is described in [23].

Fracture Loci of Reference Microstructures

The Modified-Mohr-Coulomb (MMC) fracture function (Equation (18)) [49] was used to describe the fracture loci of the hot-stamped microstructures.
ε ¯ f = [ A cos ( θ ¯ π 6 ) + B ( η + 1 3 sin ( θ ¯ π 6 ) ) ] C
The material parameters of this model ( A , B , and C ) were calibrated for the individual microstructures based on the respective experimental fracture strains ( ε ¯ f ) and stress states, as described by the stress triaxiality ( η ) and normalized Lode angle ( θ ¯ ). Given a plane-stress condition, the average stress triaxiality and normalized Lode angle for each fracture test were obtained by Equations (19) and (20) in terms of the ratio of the minor-to-major principal strain increment ( ρ = d ε 2 / d ε 1 ) averaged over the measured strain paths until the fracture points.
η = α + 1 3 α 2 α + 1 α = σ 2 σ 1 = 2 ρ + 1 ρ + 2
θ ¯ = 1 2 π a r c cos ( 27 2 η ( η 2 1 3 ) )
The calibration operations were carried out based on a least-squares method using a generalized reduced gradient (GRG) algorithm [50].

4. Results and Discussion

4.1. Microstructures and Hardness

Figure 3, Figure 4, Figure 5 and Figure 6 show LOM and SEM images from the as-received and die-quenched microstructures. The phase-quantity and hardness measurements are also presented in Table 2. The as-received microstructure (Figure 3) comprised a ferritic matrix (the brighter phase in the LOM image and the darker phase in the SEM image) with around 12%v of scattered martensite islands. The mostly ferritic microstructure of this material condition resulted in a relatively low measured hardness of 226 HVN. Following hot stamping, the 25 °C die-quenched (fully quenched) condition exhibited a fully martensitic (100%M) microstructure (Figure 4) with a hardness value of 384 HVN. The lath-type martensite existing in this microstructure shows some degree of auto-tempered morphology. Given the low carbon content of Ductibor® 1000-AS (0.081 wt.%) and, as a result, its high austenite-to-martensite transformation start temperature ( M s = 451 °C, calculated by Andrew’s model in Equation (21) [51]), the martensite auto-tempering phenomenon [52,53] was not unexpected for this steel.
M s = 539 423 C 7.5 S i 30.4 M n 17.7 N i 12.1 C r 7.5 M o + 10 C o
The increase in the die temperature to 350 °C and 450 °C led to the decreased martensite volume fractions and the transformation of austenite to the softer phases within the microstructure, thereby reducing the overall hardness. The 350 °C die-quenched condition revealed a ~25% bainitic + ~75% martensitic microstructure (Figure 5) with a hardness value of 340 HVN, while the microstructure of the 450 °C die-quenched condition (Figure 6) comprised around 3% ferrite, 67% bainite, and 30% martensite and had a hardness value of 276 HVN. The measured reductions in the martensite volume fraction and hardness value are due to the decrease in the cooling rate of the blanks (from 243 °C/s to 21 °C/s) with the increase in the temperature of the quenching die (from 25 °C to 450 °C).

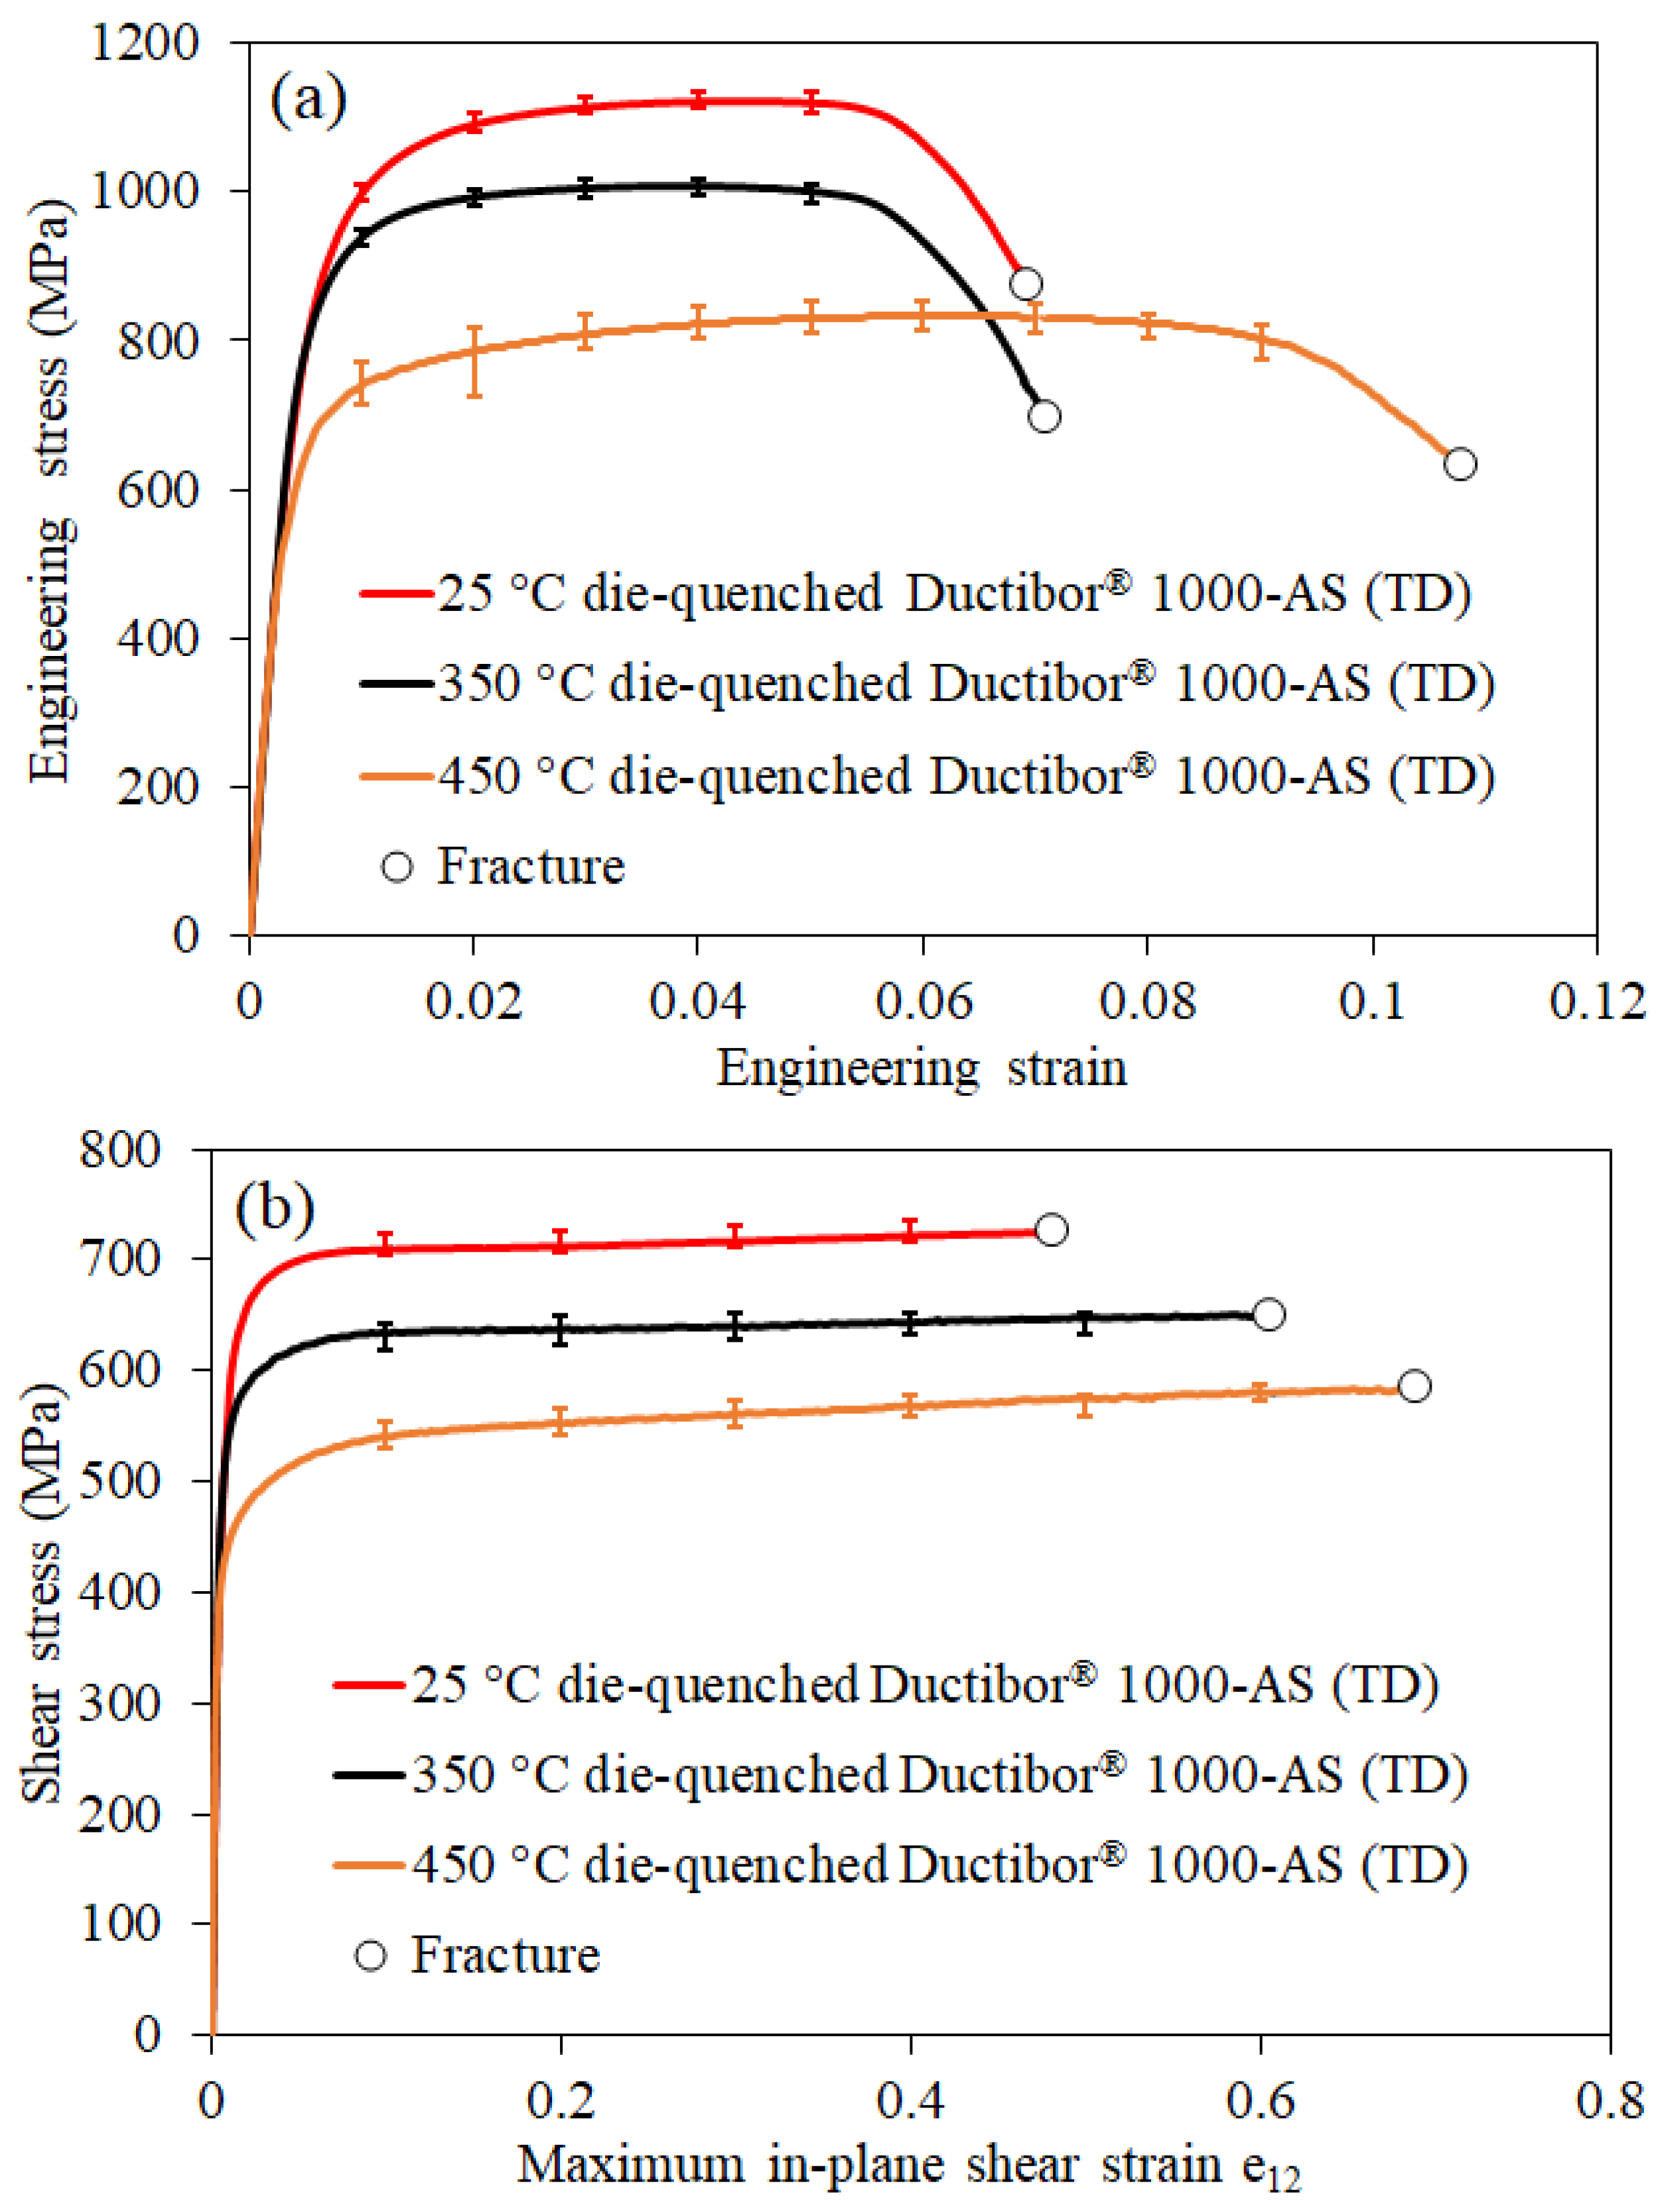
4.2. Measured Constitutive Behavior

Figure 7 displays the measured stress-strain response along the TD for different hot-stamped conditions in the tensile and shear tests. Table 3 presents a summary of the acquired tensile properties. It can be seen that the 25 °C die-quenched condition revealed the highest strength level and lowest elongation to fracture in both tests, followed by the 350 °C and 450 °C die-quenched conditions, respectively. These trends stem from the increased contents of martensite (the harder phase) within the as-quenched microstructures with the decreased die temperatures (See Table 2). The 450 °C die-quenched condition exhibited the highest uniform elongation due to its higher bainite volume fraction. However, the 25 °C die-quenched condition with a harder microstructure revealed a slightly higher uniform elongation than the 350 °C die-quenched condition. This behavior is correlated with a higher work-hardening rate of the fully quenched condition by virtue of its martensitic microstructure.
As detailed in Section 3.1.1, the shear-conversion technique was employed to extend the tensile flow data for the three hot-stamped conditions to larger strains using the shear-test results. The calculated ratios of shear and tensile stresses vs. plastic work up to the UTS points are displayed in Figure 8a, and the extrapolated flow curves are shown in Figure 8b. It is evident that the stress ratios become almost constant after the initial transients around the material yielding. The stress ratio is then assumed to remain constant at larger strain levels. The shear-to-tensile stress ratios at UTS, adopted for converting the post-UTS shear stresses to the corresponding tensile stresses, were 0.590, 0.579, and 0.588 for the 25 °C, 350 °C, and 450 °C die-quenched conditions, respectively. The converted shear data exhibits a smooth transition from the equivalent plastic strains that correspond to the UTS points to the equivalent plastic strains that are approximately 20 times higher.
For comparison purposes, the hardening curve acquired for the fully quenched Ductibor® 1000-AS is compared with the flow curves of two common hot-stamping steels of Ductibor® 500-AS and Usibor® 1500-AS in the cold die-quenched condition in Figure 9. As can be seen, both Ductibor® 500-AS and Ductibor® 1000-AS are weaker than Usibor® 1500-AS. The higher strength level of Ductibor® 1000-AS with respect to Ductibor® 500-AS makes Ductibor® 1000-AS an attractive alloy to combine with Usibor® 1500-AS in hot-stamped TWB components.
It is noted that the influence of anisotropy in the material hardening response and the accuracy of the measured tensile-plus-converted shear data were also evaluated in this study, with the results documented within Appendix A and Appendix B as supplemental information.

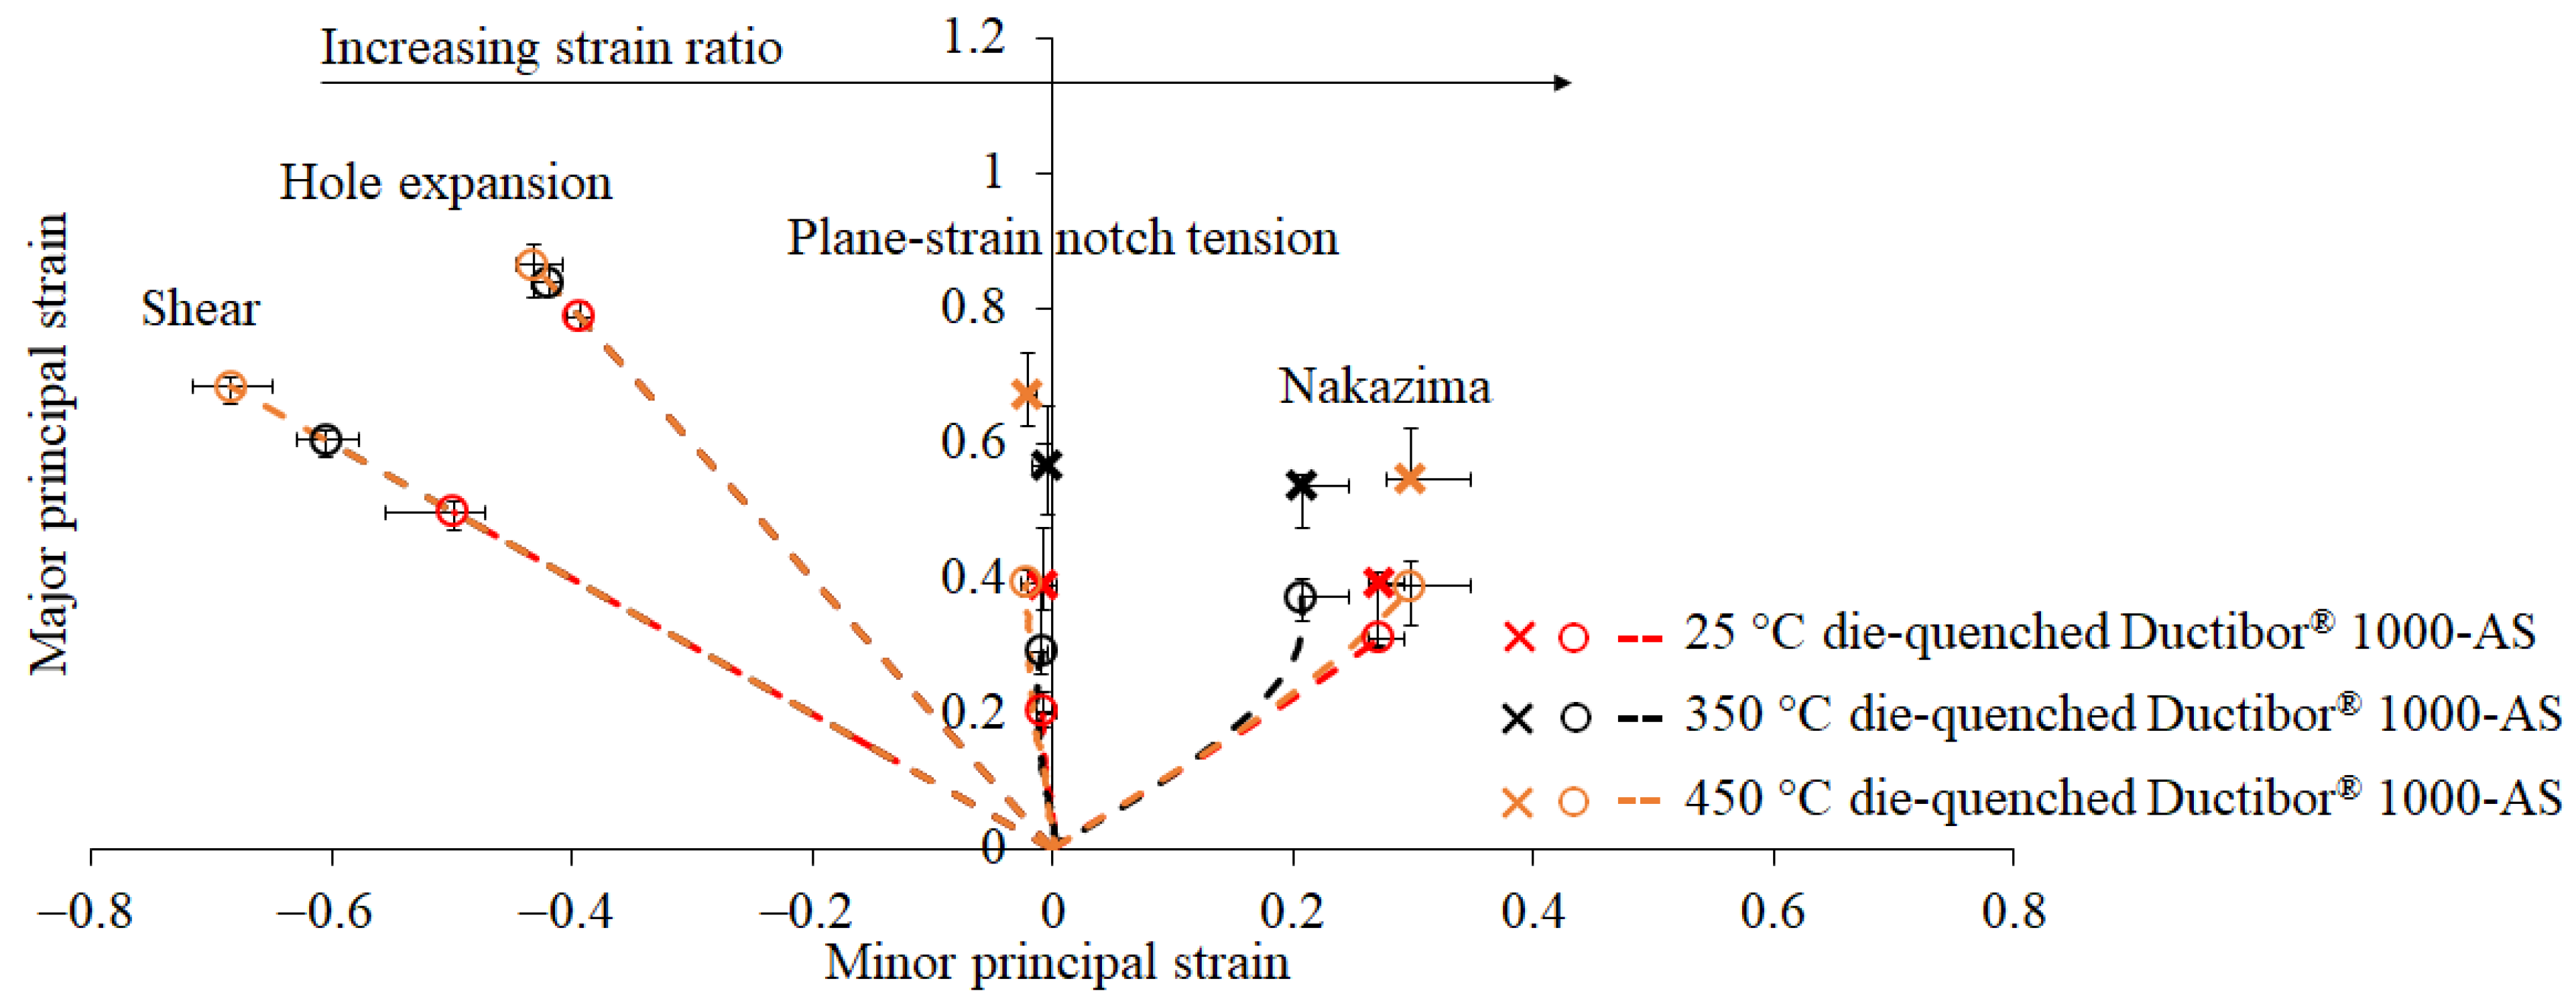
4.3. Fracture Behavior

Figure 10 shows the distributions of the major principal strain on surfaces of a range of fracture-test specimens of different hot-stamped conditions at one frame prior to fracture. For all cases, it can be seen that deformation was localized within the central regions of the samples. As the distance from the center increases, the material straining decreases.
Figure 11 displays the strain paths, together with the DIC and thickness measurement-based fracture points, obtained at the fracture locations of samples of the three hot-stamped conditions during different fracture experiments. The corresponding averaged stress triaxiality ( η ), Lode parameters ( ξ ), and strain ratios ( ρ ) are listed in Table 4. The trends of the measured strain paths for each test type are similar in different material conditions. In general, the 25 °C die-quenched samples underwent the lowest strains prior to fracture, followed by the 350 °C and 450 °C die-quenched specimens, respectively. Such discrepancies are consistent with the microstructure and hardness data since material conditions with higher martensite and hardness normally exhibit lower ductility. The DIC-based fracture strains compared to the thickness measurement-based ones have lower values for the plane-strain notch tension and Nakazima tests. This difference reflects the deficiency of the DIC techniques in the measurement of through-thickness straining within the localized necks formed during these tests before fracture.
Figure 12 presents the von Mises equivalent fracture strains of the three hot-stamped conditions for each test. The hardest material condition (25 °C die-quenched), with its fully martensitic microstructure, had the lowest equivalent fracture strains, whilst the intermediate and softest material conditions (350 °C and 450 °C die-quenched, respectively), with a lower martensite content, revealed the higher equivalent fracture strains. As expected, the DIC-based equivalent fracture strains in the plane-strain notch tension and Nakazima tests are lower than the rupture strains from post-mortem thickness measurements. It is noted that the evaluation of the fracture strain in plane-strain tension loading can be impacted by the specimen geometry, test type, and thickness of press-hardening steels. For example, the fracture strains for plane-strain notch tension tests may differ from those obtained in VDA 238–100 V-bend tests [54], whereby fracture is initiated at the surface rather than within the thickness plane. Sarkar et al. [25] reported an equivalent fracture strain in excess of 0.6 in the V-bend testing of a 1.5 mm-thick fully quenched and paint-baked Ductibor® 1000-AS sheet. The lower equivalent fracture strain measured for this loading condition in the current work (0.47) may also be due to the lack of the paint-baking treatment and lower thickness (1.2 mm) compared to the case in the work by Sarkar et al. [25].
Figure 13a shows fracture loci for each of the three hot-stamped conditions, interpolated using the MMC fracture function (Equation (18)) based on the measured equivalent fracture strains (Figure 12) and stress-state parameters (Table 4) from the fracture tests. The calibrated MMC material parameters for each material condition are given in Table 5. It is noted that in the calibration process, the equivalent fracture strains obtained by the thickness measurements in the plane-strain notch tension and Nakazima tests were utilized. As expected based on the microstructure and hardness-test results, the 25 °C die-quenched condition with the hardest and most martensitic microstructure revealed the lowest degree of ductility in all of the stress states, while the 350 °C and 450 °C die-quenched conditions with the lower hardness and martensite exhibited the intermediate and highest ductility, respectively. For comparative purposes, the Ductibor® 1000-AS fracture locus is compared to the fracture loci of two other common hot-stamping steels, Ductibor® 500-AS and Usibor® 1500-AS [55], in the cold die-quenched condition in Figure 13b. It is evident that the ductility of Ductibor® 1000-AS is intermediate to that of Ductibor® 500-AS and Usibor® 1500-AS. The higher fracture limits of both Ductibor® steels make them suitable candidates for joining to Usibor® 1500-AS in hot-stamping TWBs for use in energy-absorbing components of automobiles.

4.4. MFH Predictions

This section presents the predictions of the established microstructure-based modelling technique for the constitutive and fracture response in Ductibor® 1000-AS with multi-phase microstructures. It should be noted that in the numerical analyses, the small amount of ferrite (3%) in the 450 °C die-quenched microstructure (Table 2) was assumed to be bainite for simplicity due to the closer mechanical properties of ferrite to bainite as compared to martensite. Therefore, the reference microstructures of the 25 °C, 350 °C, and 450 °C die-quenched conditions in the modelling work were 100% martensitic (100%M), ~25% bainitic plus ~75% martensitic (~25%B + 75%M), and ~70% bainitic plus ~30% martensitic (~70%B + 30%M), respectively.

4.4.1. Predicted Flow Response

The calculated hardening curves for micro-constituents of the three hot-stamped microstructures based on Rodriguez and Gutierrez’s model (Equation (8) [43]) are illustrated in Figure 14. The optimized values of carbon concentrations as well as dislocation mean free paths and recovery rates for the constituent phases are listed in Table 6 and Table 7, respectively. Figure 14a indicates that martensite had the lowest strength level in the 25 °C die-quenched condition with a fully martensitic microstructure. As the die temperature increased (or the martensite content decreased), the martensitic phase strengthened. This behavior is due to the lower solubility of carbon in bainite, which results in an increased carbon concentration of martensite as the bainite volume fraction increases at higher quenching-die temperatures (See Table 6). Such predictions are consistent with the study by Young and Bhadeshia [56] on the strength of bainitic-martensitic microstructures. They elucidated that as the volume fraction of the bainitic phase increases, more carbon is rejected into the remaining austenite, and as a result, martensite with a higher carbon concentration is transformed from the austenitic phase. A comparison of the predicted hardening response for bainite in the reference mixed-phase microstructures and a fully bainitic (100%B) microstructure of Ductibor® 1000-AS (Figure 14b) reveals that the bainitic micro-constituent had the highest strength level when it was the only phase in the microstructure (i.e., 100%B). The reason is that bainite in a fully bainitic microstructure had the highest carbon content (equal to the total amount of carbon in the steel), while its carbon concentration dropped within the bainitic-martensitic microstructures. Seol et al. [57], Clarke et al. [58], and Timokhina et al. [59] also reported lower amounts of carbon in the bainitic phase of bainitic-austenitic (potentially martensitic) microstructures of low and high carbon steels, as compared to the overall carbon content in the steel. Bainite in the 350 °C die-quenched microstructure was predicted to have a higher carbon content and, as a result, higher strength than that in the 450 °C die-quenched microstructure. Such a prediction is in line with the observations by Bhadeshia and Christian [60], who demonstrated that bainite formed at lower temperatures has higher carbon.
It is noted that the calibrated dislocation mean free paths and recovery rates for bainite and martensite (Table 7) have values on the same order of magnitude as those reported in the literature. For example, Rodrigues and Gutierrez [43] reported dislocation mean free paths and recovery rates of 1.6–2.4 µm and 2.3–13 for bainite and 0.035–0.045 µm and 37.8–43.8 for martensite in C-Mn steels, respectively. Ramazani et al. [44,61] applied dislocation mean free paths of 0.2 µm and 0.038 µm and recovery rates of 0.83 and 41 for bainite and martensite in dual-phase steels, respectively. The lower dislocation mean free path and the higher dislocation recovery rate for the martensitic phase are indicators of a larger density of dislocations in this micro-constituent.
Figure 15 shows the predicted hardening curves for the three hot-stamped microstructures based on the calculated flow response for the corresponding micro-constituents (Figure 14) compared with the experimental data. The results exhibit good agreement between the predicted and measured hardening curves for all three die-quenched microstructures.
In hot stamping, the mechanical response of final components is strongly dependent on the quenching condition so that any local changes in the pre-set tooling temperature and contact pressure can significantly alter the mechanical properties of the products. In practice, variations in quenching rates are inevitable in commercial hot-stamping operations due to factors such as changes in tooling temperatures between the startup and steady-state production conditions as well as die wear altering the contact pressure. Therefore, there is a need to understand the influence of variability in quench rates on the final mechanical properties. To develop a more generalized predictive model along with this perspective, the martensite carbon contents in the reference microstructures (Table 6) were fit to an exponential function (Equation (22)) in terms of the martensite volume fraction ( V M ) with three calibration parameters of a , b , and c . Table 8 presents the obtained values for these parameters.
f ( V M ) = a exp ( b V M ) + c
Then the carbon concentrations in martensite and bainite within Ductibor® 1000-AS bainitic-martensitic microstructures with varied micro-constituent contents were calculated using the calibrated exponential function and carbon mass balance (Equation (12)), respectively (see Figure 16).
Next, the hardening response of the micro-constituents was computed using Rodriguez and Gutierrez’s model (Equation (8) [43]), and accordingly, the flow behavior of the multi-phase microstructures was predicted using the current MFH approach. Figure 17 and Figure 18 show the predicted hardening curves for the constituent phases and corresponding mixed-phase microstructures, respectively. The predictions indicate that as more martensitic phase is formed, the strength of martensite itself decreases (Figure 17a), while the relevant mixed-phase microstructure strengthens (Figure 18). These results are in line with the experimental and numerical data reported by Golling et al. [20] on bainitic-martensitic microstructures of the AlSi-coated 22MnB5 (Usibor® 1500-AS) steel. The weakening of martensite is related to an inverse correlation between its carbon concentration and quantity (Figure 16). However, the strengthening of the overall microstructure can be attributed to the stronger influence of the martensite amount, which remains the harder phase in the microstructure (as can be discerned from Figure 17). For example, martensite in a 90% bainite plus 10% martensite (90%B + 10%M) microstructure was predicted to have a carbon concentration of 0.43 wt.% and a strength level of ~2.3 GPa, while increasing the martensite amount to 100% resulted in a carbon content of 0.081 wt.% and a strength measure of ~1.2 GPa for this phase. Meanwhile, the strength of the overall microstructure was predicted to increase by around 37%.
The results also show that the strength of bainite, contrary to martensite, does not change noticeably with its volume fraction. Such a trend is attributed to the insignificant variations predicted in the carbon content of the bainitic phase compared to that in martensite (Figure 16) and is in accord with the earlier studies by Young and Bhadeshia [56] and Golling et al. [62] on bainitic-martensitic microstructures of different steels. The increase in the martensite content (or the decrease in the bainite amount) resulted in an initial drop and then a smooth, continuous increase in the bainite carbon content (Figure 16) and, consequently, its strength (Figure 17b). Young and Bhadeshia [56] also estimated a transition in bainite strength with its volume fraction in their analytical calculations but within tempered bainitic-martensitic microstructures of a high-strength steel. Another difference between the predicted hardening response for the bainitic and martensitic phases is related to the manner of their work hardening. As seen in Figure 17, martensite initially shows an extensive work-hardening rate and a rapid stress saturation afterward. However, bainite exhibits continuous work hardening to larger strains. Such predictions seem physically reasonable since martensite is a harder phase with a much larger number of dislocations and, consequently, a higher rate of dislocation recovery [43,63].
It is worth mentioning that in the current study, analogous to the study by Ramazani et al. [44,64], the micro-constituent dislocation mean free paths and recovery rates were assumed to be constant in different microstructures. In reality, these parameters change with phase quantities, sizes, and morphology. Given the good agreement between the predicted and measured data in terms of the macroscopic flow response of the hot-stamped microstructures (Figure 15), it seems that the error accompanied with such assumptions has been limited by the calibrated carbon concentrations.

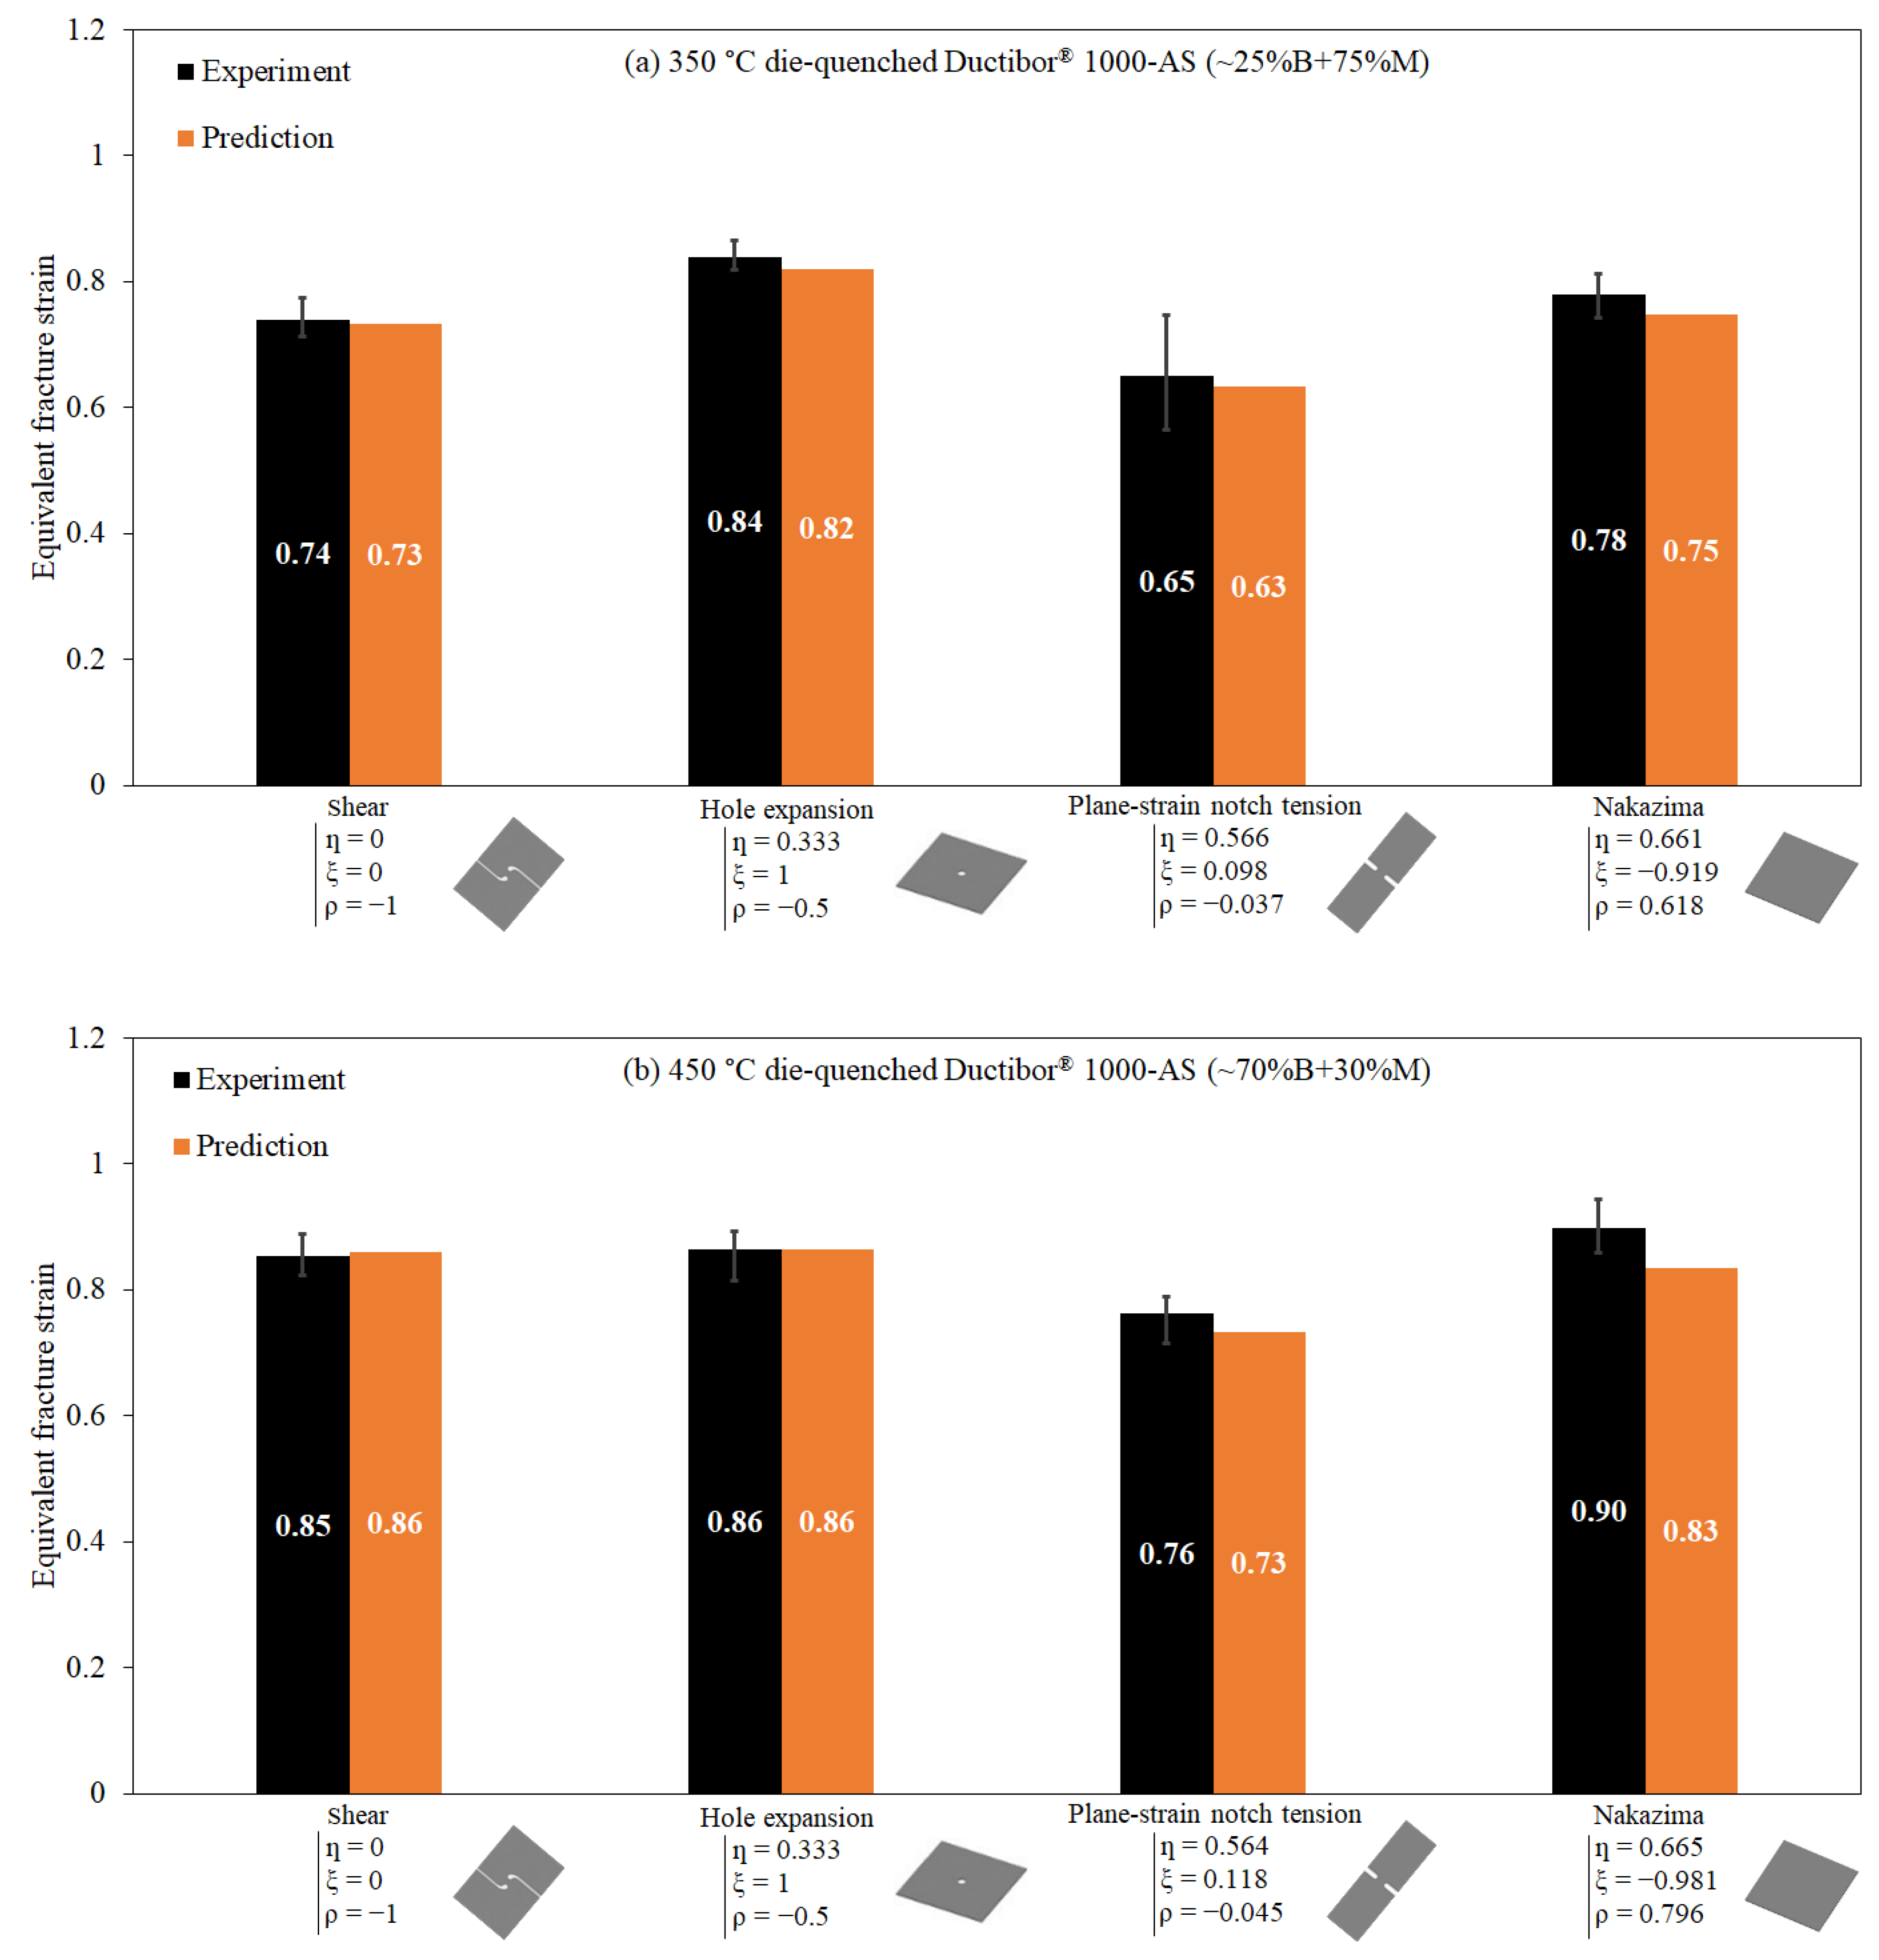
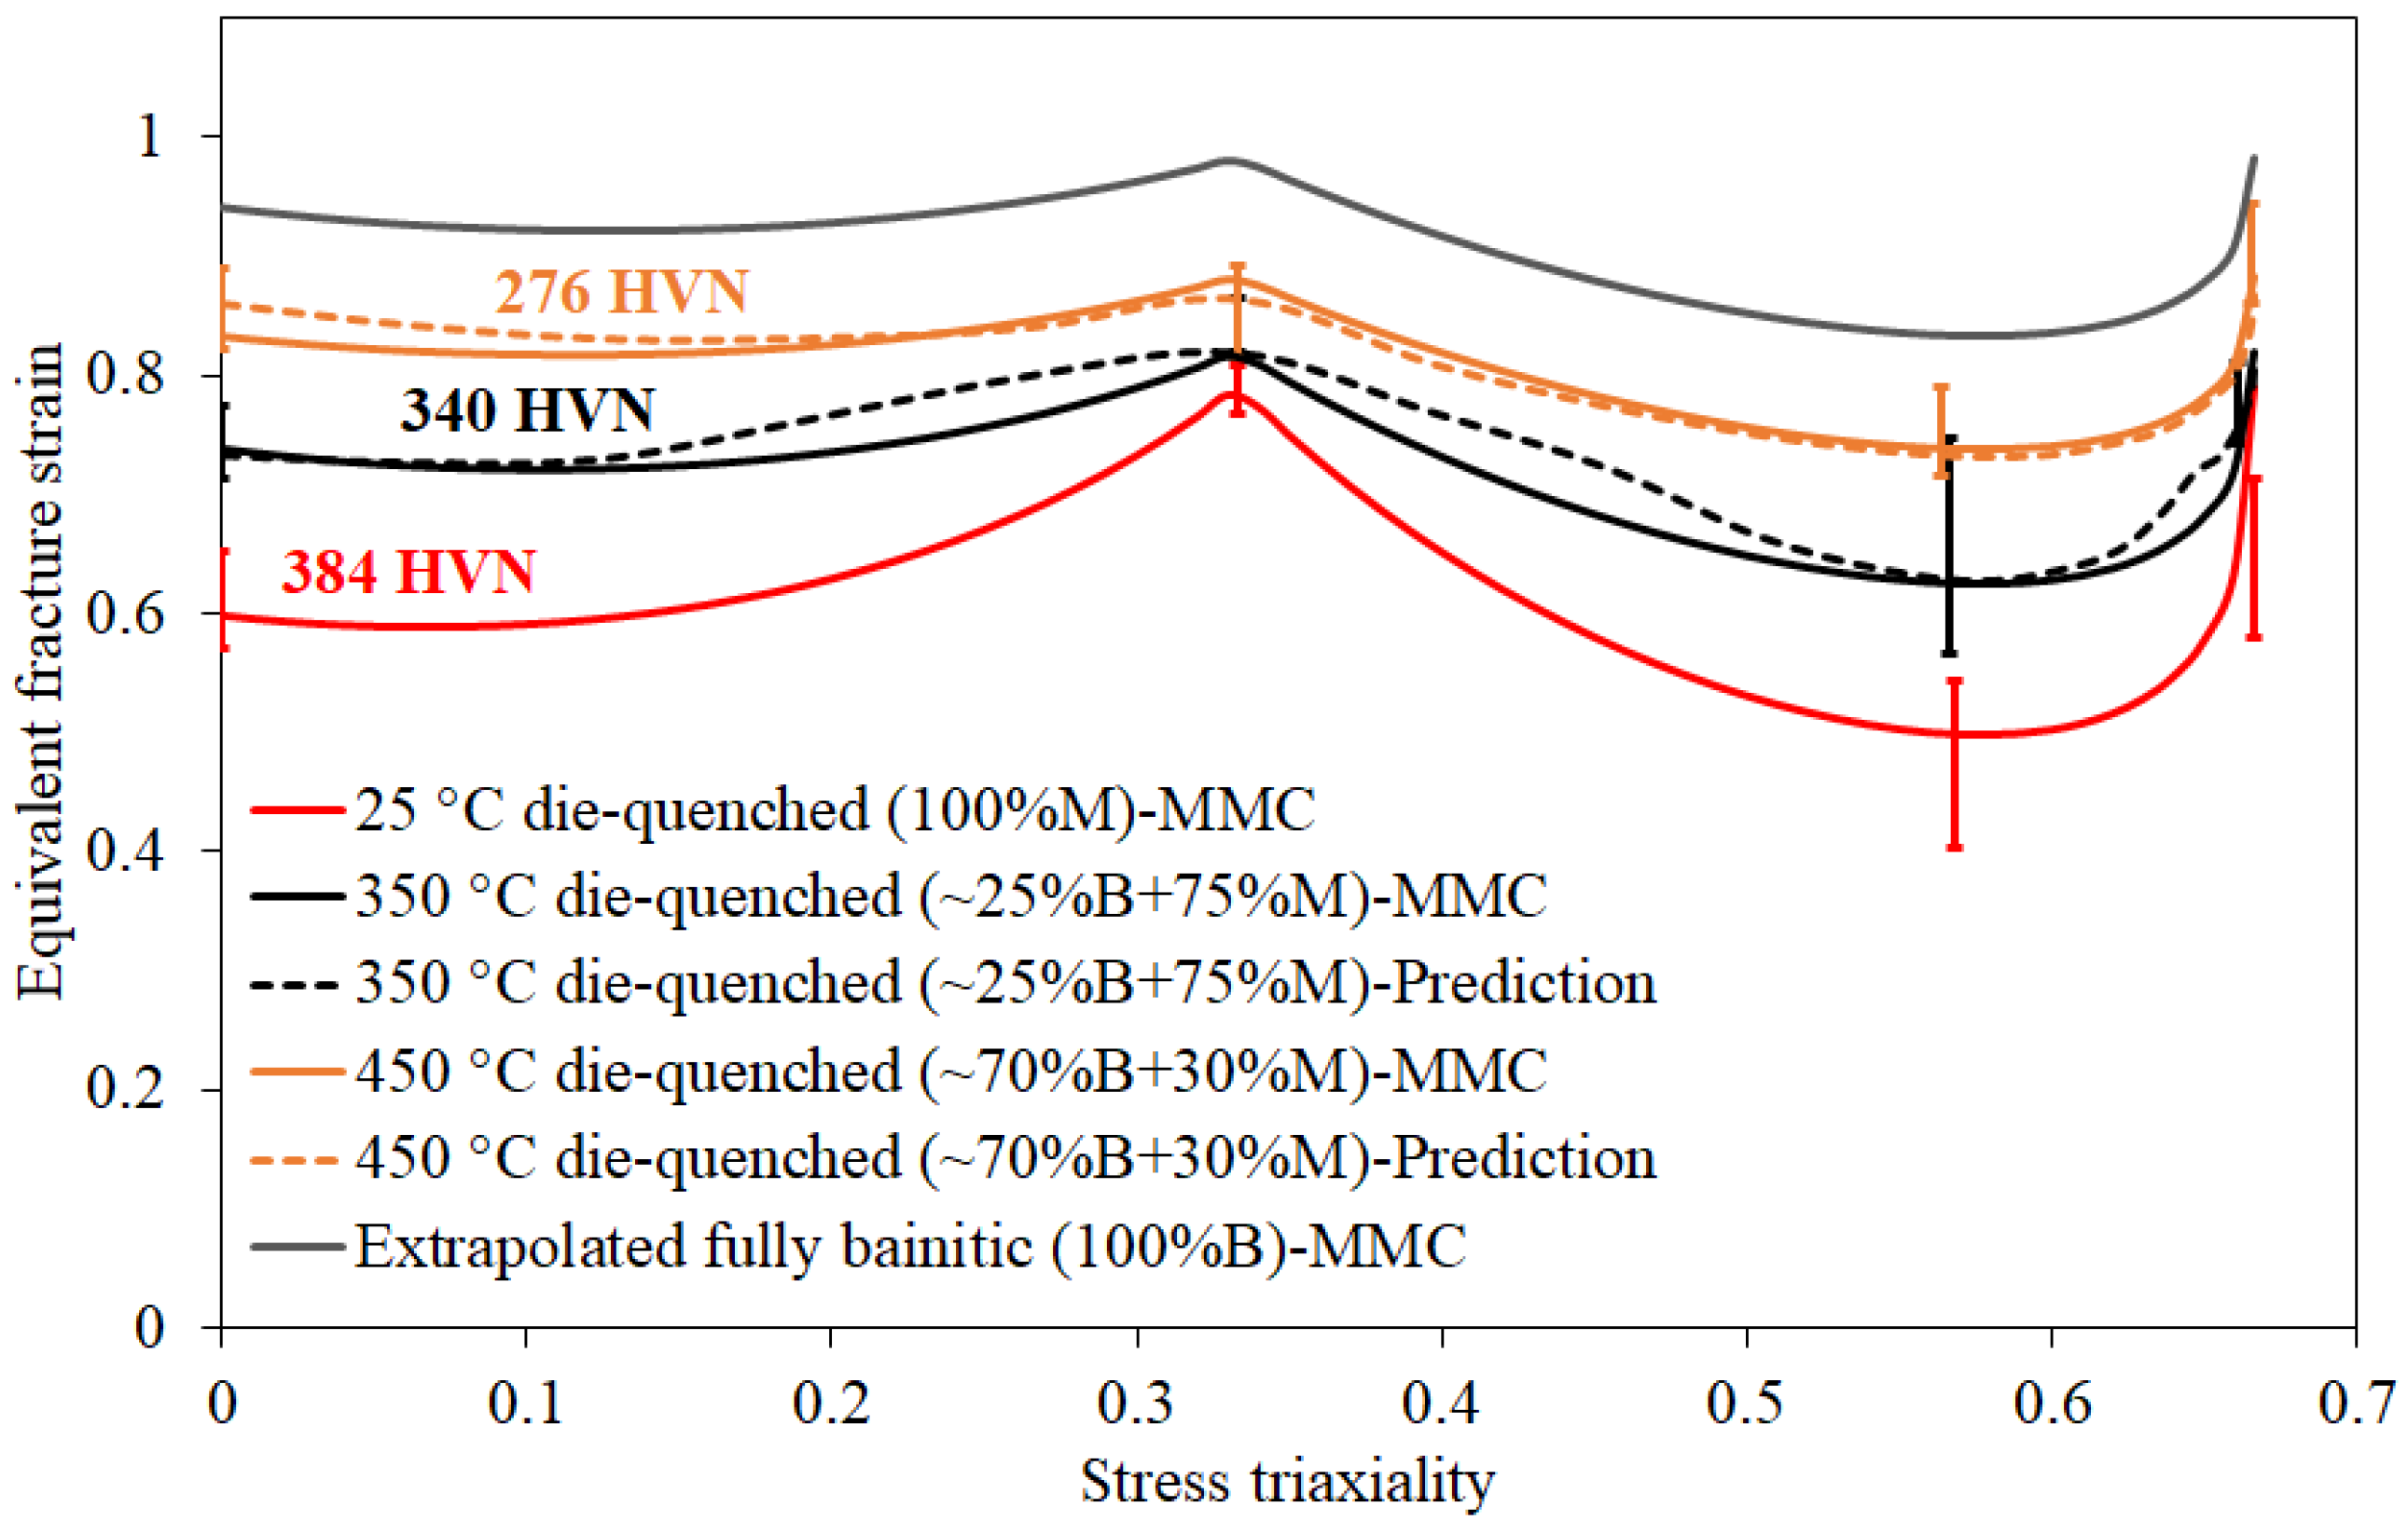
4.4.2. Predicted Fracture Response

As noted in Section 3.2, the 100%B and 100%M fracture loci were considered to be the fracture limits of bainite and martensite in the numerical modelling, respectively. Since a 100%B microstructure could not be produced for the range of the hot-stamping conditions considered in the current work, the fracture locus of this microstructure in the computations was estimated by the extrapolation of the trend in the MMC material parameters with the martensite content in the available microstructures (Figure 19). In this regard, constants of the MMC fracture model were fit to the exponential functions in the form of Equation (22), and then those for the 100%B microstructure were calculated using the calibrated interpolation functions. The values of the calibration parameters of these functions are presented in Table 8. It is noted that in the damage modelling, the optimized values of the GISSMO damage exponent (Equation (15)) for the bainitic and martensitic phases, obtained based on the 100%B and 100%M fracture loci, were 0.56 and 0.51, respectively.
Figure 20 shows the predicted fracture strains of the reference bainitic-martensitic (350 °C and 450 °C die-quenched) microstructures in each fracture test compared with the experimental data. The predicted and measured fracture strains are in good accord so that the predictions lie either within or close to the experimental ranges. It is noteworthy that the predictions revealed the onset of fracture within the bainitic phase in the hole-expansion and Nakazima tests and within the martensitic phase in the shear and plane-strain notch tension tests for the 350 °C die-quenched microstructure (~25%B + 75%M). However, fracture was predicted to occur within bainite in all of the fracture tests for the 450 °C die-quenched microstructure (~70%B + 30%M).
Figure 21 displays the fracture loci predicted for the reference multi-phase microstructures in comparison with their experimentally based MMC fracture curves. The 100%B and 100%M fracture limits are also exhibited as the upper and lower bounds, respectively. It is observed that the predicted fracture curves are in accord with the experimentally based MMC fracture loci.
Given the successful predictions of the fracture curves for the developed multi-phase microstructures, the established damage predictive tool was utilized to predict variations in the Ductibor® 1000-AS fracture locus for bainitic-martensitic microstructures with various phase quantities. The predictions presented in Figure 22 imply that more martensite content corresponds to overall reduced ductility. Such a trend is compatible with the empirical data for the developed microstructures in this study. These predictions, together with the calculated corresponding flow response (Figure 18), represent the key material data required to take account of the influence of variable cooling conditions in hot stamping on the mechanical performance of final components.

5. Conclusions

This research has contributed towards the quantification of the relationship between the microstructure and mechanical behavior in Ductibor® 1000-AS subjected to hot stamping. The following conclusions stem from this study:
(1)
The microstructure, flow, and fracture response of Ductibor® 1000-AS are quench-rate sensitive within the range of cooling rates considered during hot stamping. A decrease in the cooling rate from 243 °C/s to 21 °C/s resulted in a 70% drop in the martensite content of the microstructure, a 26% reduction in UTS, and a 40–60% increase in the fracture strain for most of the investigated loading conditions.
(2)
The established numerical scheme based upon a hybrid micromechanical and phenomenological methodology predicted the hardening and fracture response in the multi-phase microstructures of the 350 °C and 450 °C die-quenched Ductibor® 1000-AS with reasonable accuracy.
(3)
Predictions for the hardening and fracture curves of the Ductibor® 1000-AS bainitic-martensitic microstructures with varied phase quantities revealed that a higher fraction of martensite results in the strengthening of the steel but at the expense of ductility.
(4)
Microscopic predictions demonstrated that with an increased martensite content in bainitic-martensitic microstructures of Ductibor® 1000-AS, the martensitic phase weakens, while the bainitic phase exhibits a transition from weakening to strengthening at a low martensite volume fraction.

Author Contributions

Conceptualization, P.S., C.B. and M.J.W.; methodology, P.S., C.B. and M.J.W.; validation, P.S.; Formal analysis, P.S.; data curation, P.S. and A.A.; writing—original draft preparation, P.S.; writing—review and editing, P.S., C.B. and M.J.W.; supervision, C.B. and M.J.W. All authors have read and agreed to the published version of the manuscript.

Funding

This research was funded by Honda Development & Manufacturing of America, Promatek Research Centre (Cosma International), ArcelorMittal, Automotive Partnerships Canada, the Natural Sciences and Engineering Research Council, the Ontario Research Fund, the Ontario Advanced Manufacturing Consortium, the Ontario Centres of Excellence, and the Canada Research Chairs Secretariat.

Institutional Review Board Statement

Not applicable.

Informed Consent Statement

Not applicable.

Data Availability Statement

The data presented in this study are available on request from the corresponding author.

Conflicts of Interest

The authors declare no conflict of interest.

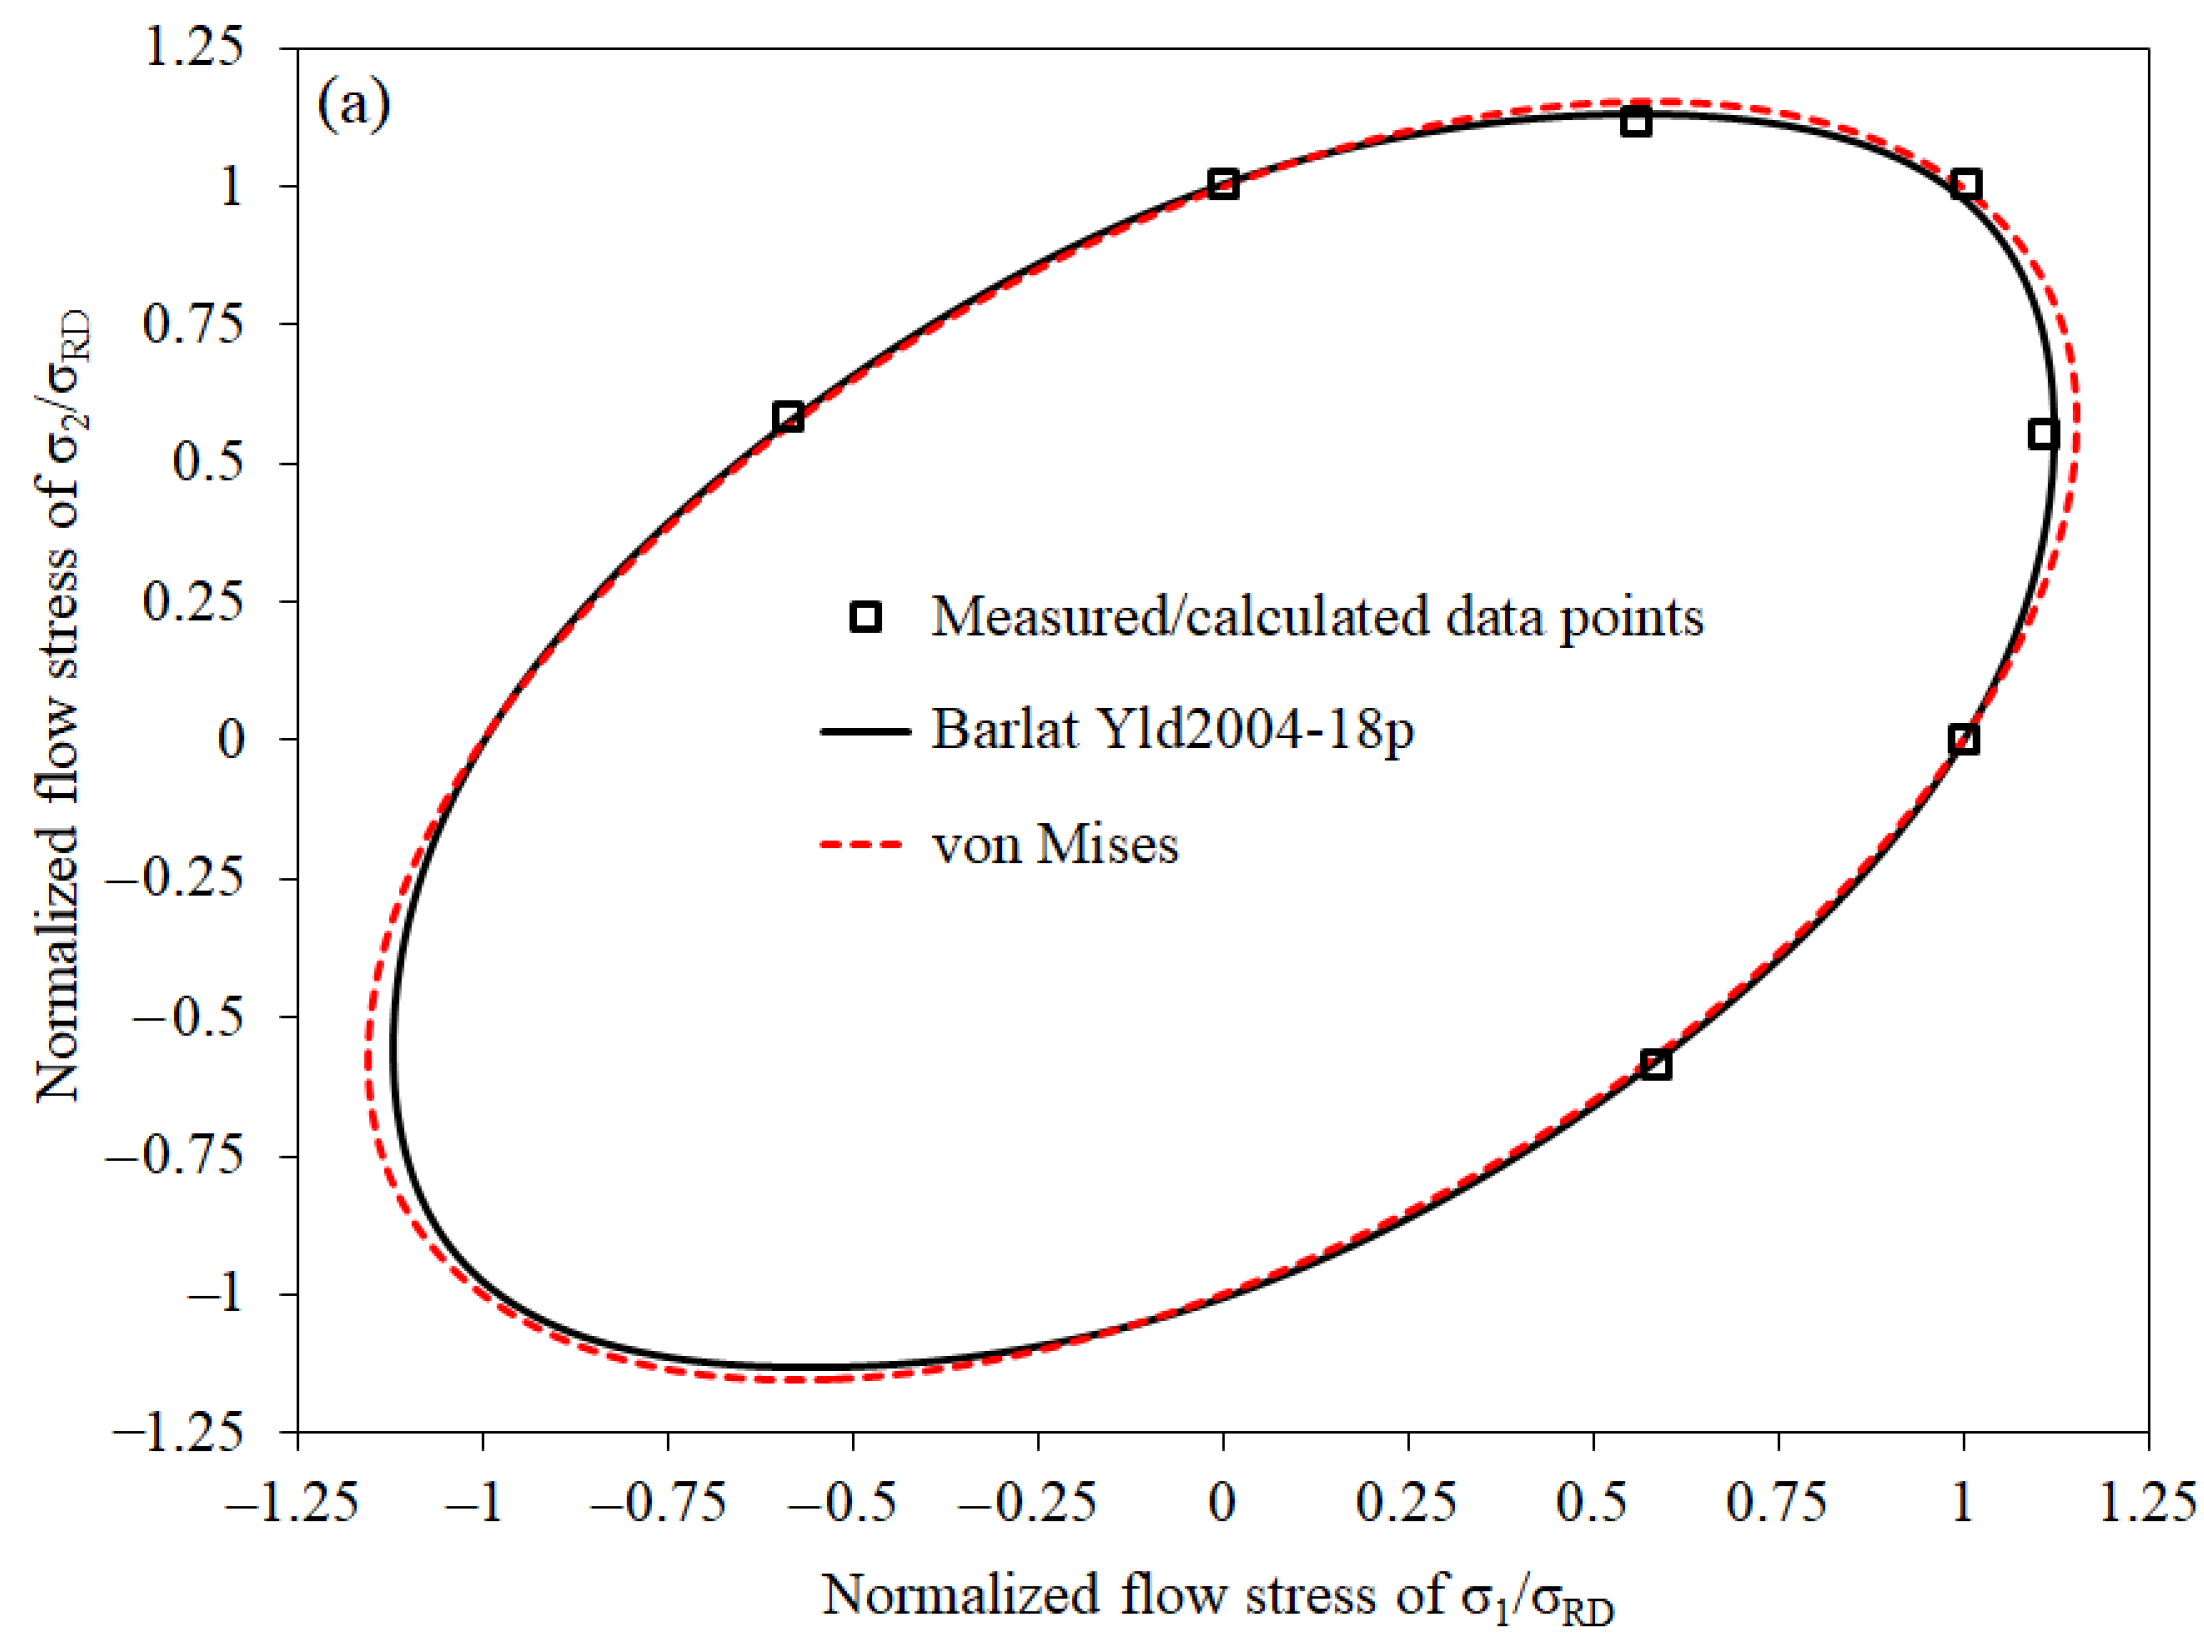
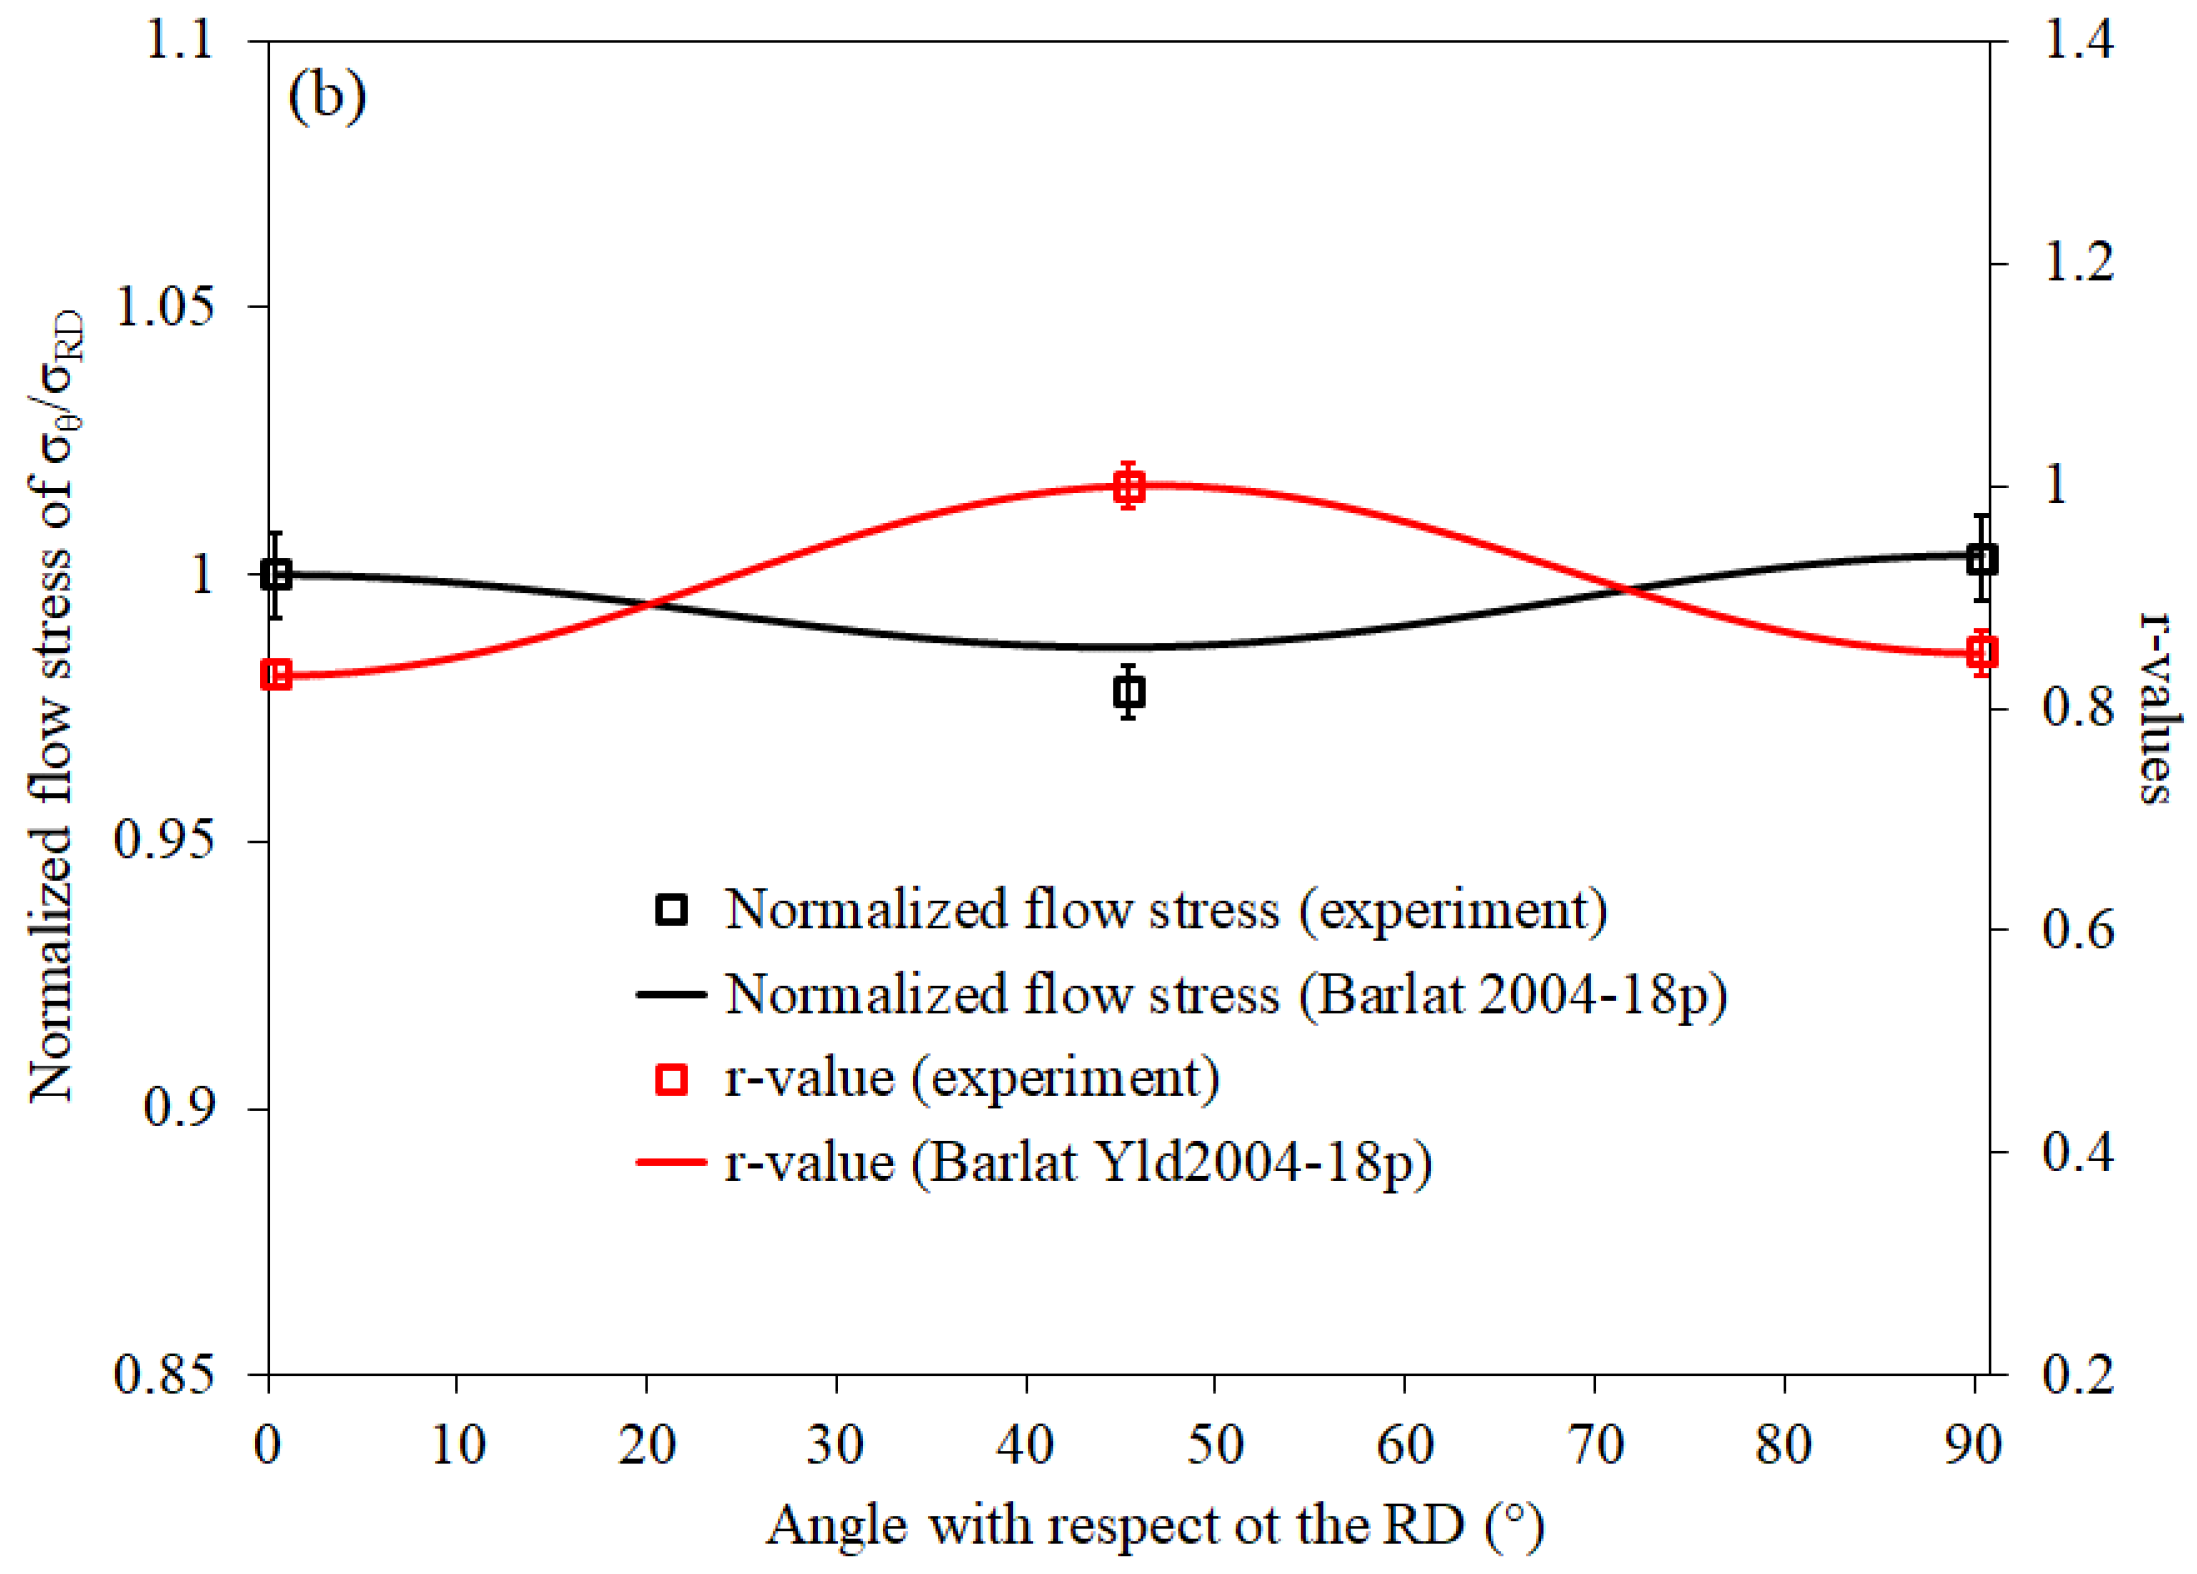
Appendix A. Material Anisotropy in Hardening Response

The anisotropy study in this work was mainly focused on the 25 °C die-quenched condition. Figure A1 compares the engineering stress-strain curves of this material condition along the sheet principal axes, and Table A1 summarizes its anisotropic properties measured by the tensile and shear testing. It is evident that the material hardening behavior in the different sheet orientations is similar. The material did not exhibit strong anisotropy in terms of the measured stresses, while the acquired r-values indicate noticeable material anisotropy along the rolling and transverse directions in terms of the measured strains.
Figure A1. The engineering stress-strain response of the 25 °C die-quenched condition of Ductibor® 1000-AS in the sheet principal directions.
Metals 12 01770 g0a1
Table A1. The anisotropic properties of the 25 °C die-cooled condition of Ductibor® 1000-AS.
DirectionStress Ratio a Lankford’s Coefficient (r-Value) b
Rolling (tensile)1.000 ± 0.008 c0.83 ± 0.01
Diagonal (tensile)0.978 ± 0.0051.00 ± 0.02
Transverse (tensile)1.003 ± 0.0080.85 ± 0.02
Transverse (shear)0.587 ± 0.006-
a: The stress ratios are averaged, normalized values relative to the tensile stress along the rolling direction (RD) corresponding to the plastic work (36.7 MJ/m3) conducted along the diagonal (weakest) direction (DD) until the UTS point; b: the calculated Lankford’s coefficients are averaged within a range of 1% elongation to the UTS (uniform) elongation; and c: the variations denote the standard deviation of the measured data.
It is worth noting that the r-values for the 350 °C and 450 °C die-quenched conditions measured only along the TD were 0.90 ± 0.00 and 0.93 ± 0.01, respectively.
Using the obtained anisotropic properties for the 25 °C die-quenched condition, the Barlat Yld2004-18p yield function ( ϕ ) [65], given by Equations (A1)–(A3), with an exponent of 6 (recommended for bcc materials) was calibrated for this material condition.
ϕ = ϕ ( Σ ) = ϕ ( S ˜ , S ˜ ) = | S ˜ 1 S ˜ 1 | a + | S ˜ 1 S ˜ 2 | a + | S ˜ 1 S ˜ 3 | a + | S ˜ 2 S ˜ 1 | a + | S ˜ 2 S ˜ 2 | a + | S ˜ 2 S ˜ 3 | a + | S ˜ 3 S ˜ 1 | a + | S ˜ 3 S ˜ 2 | a + | S ˜ 3 S ˜ 3 | a = 4 σ ¯ a
In which:
S ˜ = C S
C = [ 0 c 12 c 13 0 0 0 c 21 0 c 23 0 0 0 c 31 c 32 0 0 0 0 0 0 0 c 44 0 0 0 0 0 0 c 55 0 0 0 0 0 0 c 66 ]
S ˜ = C S
C = [ 0 c 12 c 13 0 0 0 c 21 0 c 23 0 0 0 c 31 c 32 0 0 0 0 0 0 0 c 44 0 0 0 0 0 0 c 55 0 0 0 0 0 0 c 66 ]
In the above equations, σ ¯ and a are the effective stress and yield exponent, and S ˜ i and S ˜ i are the principal values of S ˜ and S ˜ tensors that are linearly related to the deviatoric stress tensor ( S ) using transformation tensors of C and C , respectively. Tensorial components of c i j and c i j are the anisotropic coefficients that were identified through a calibration process using measured r-values and stress ratios. In the calibration process, the strain ratio in simple shear [66] and third deviatoric stress invariant in a plane-strain state [67] were constrained to be −1 and 0, respectively. The shear stress ratio for the RD was assumed to be equivalent to the value measured along the TD. The RD, DD, and TD plane-strain tension stress ratios were estimated at 1.108, 1.121, and 1.116, respectively, using the statistical model developed by Narayanan et al. [68] (Equation (A4)). Moreover, the equibiaxial tension stress ratio and r-value were also calculated at 1.005 and 0.98 based on the statistical model suggested by Abspoel et al. [69] (Equation (A5)) and the ratio of the RD and TD r-values ( r b = r R D / r T D ), respectively.
σ θ P S T σ θ U T = [ 0.983 1 + e ( 3 r θ 2.805 ) + 1.280 1 + 1 e ( 3 r θ 2.805 ) ]
σ b σ R D U T = ( σ R D U T σ R D U T + 2 σ D D U T σ R D U T + σ T D U T σ R D U T 4 ) [ 0.97 1 + e [ 3.4 × ( r R D + 2 r D D + r T D 4 ) 4.148 ] + 1.14 1 + 1 e [ 3.4 × ( r R D + 2 r D D + r T D 4 ) 4.148 ] ]
In the above equations, σ θ P S T , σ θ U T , and r θ are the plane-strain tension and uniaxial tension stresses as well as the r-value along a direction oriented at an angle of θ relative to the RD; σ R D U T , σ D D U T , and σ T D U T are the RD, DD, and TD stresses acquired in uniaxial tension loading; σ b is the stress obtained in equibiaxial tension loading; and r R D , r D D , and r T D are the RD, DD, and TD r-values, respectively.
Table A2 presents the calibrated material parameters of the Barlat Yld2004-18p yield function, and Figure A2 shows the generated yield surface, together with the predicted stress ratios and r-values as compared to the experimental values. It is discerned that the developed yield surface of the material is in line with the measured and calculated data (Figure A2a). The calculated stress ratios and r-values are all consistent with the empirical measurements (Figure A2b). The predicted stress ratios for the intermediate directions of the principal axes did not change noticeably. However, the corresponding r-values exhibited a gradual increase and decrease from the RD (0°) to the DD (45°) and the DD (45°) to the TD (90°), respectively.
Table A2. The calibrated material parameters of the Barlat Yld2004-18p yield function (Equations (A1)–(A3)) [65] with an exponent of 6 for the 25 °C die-quenched condition of Ductibor® 1000-AS.
c 12 c 13 c 21 c 23 c 31 c 32 c 44 c 55 c 66
1.10820.98911.58161.3191−0.7266−0.84811.35050.99960.9996
c 12 c 13 c 21 c 23 c 31 c 32 c 44 c 55 c 66
0.30650.80680.78311.01621.11440.82870.61070.99960.9996
Figure A2. (a) The Barlat Yld2004-18p yield surface of the 25 °C die-quenched condition of Ductibor® 1000-AS and (b) the predicted trends for the stress ratio and r-value in terms of the material orientation relative to the RD. The standard deviation of the measured data is denoted by the error bars.
Metals 12 01770 g0a2aMetals 12 01770 g0a2b

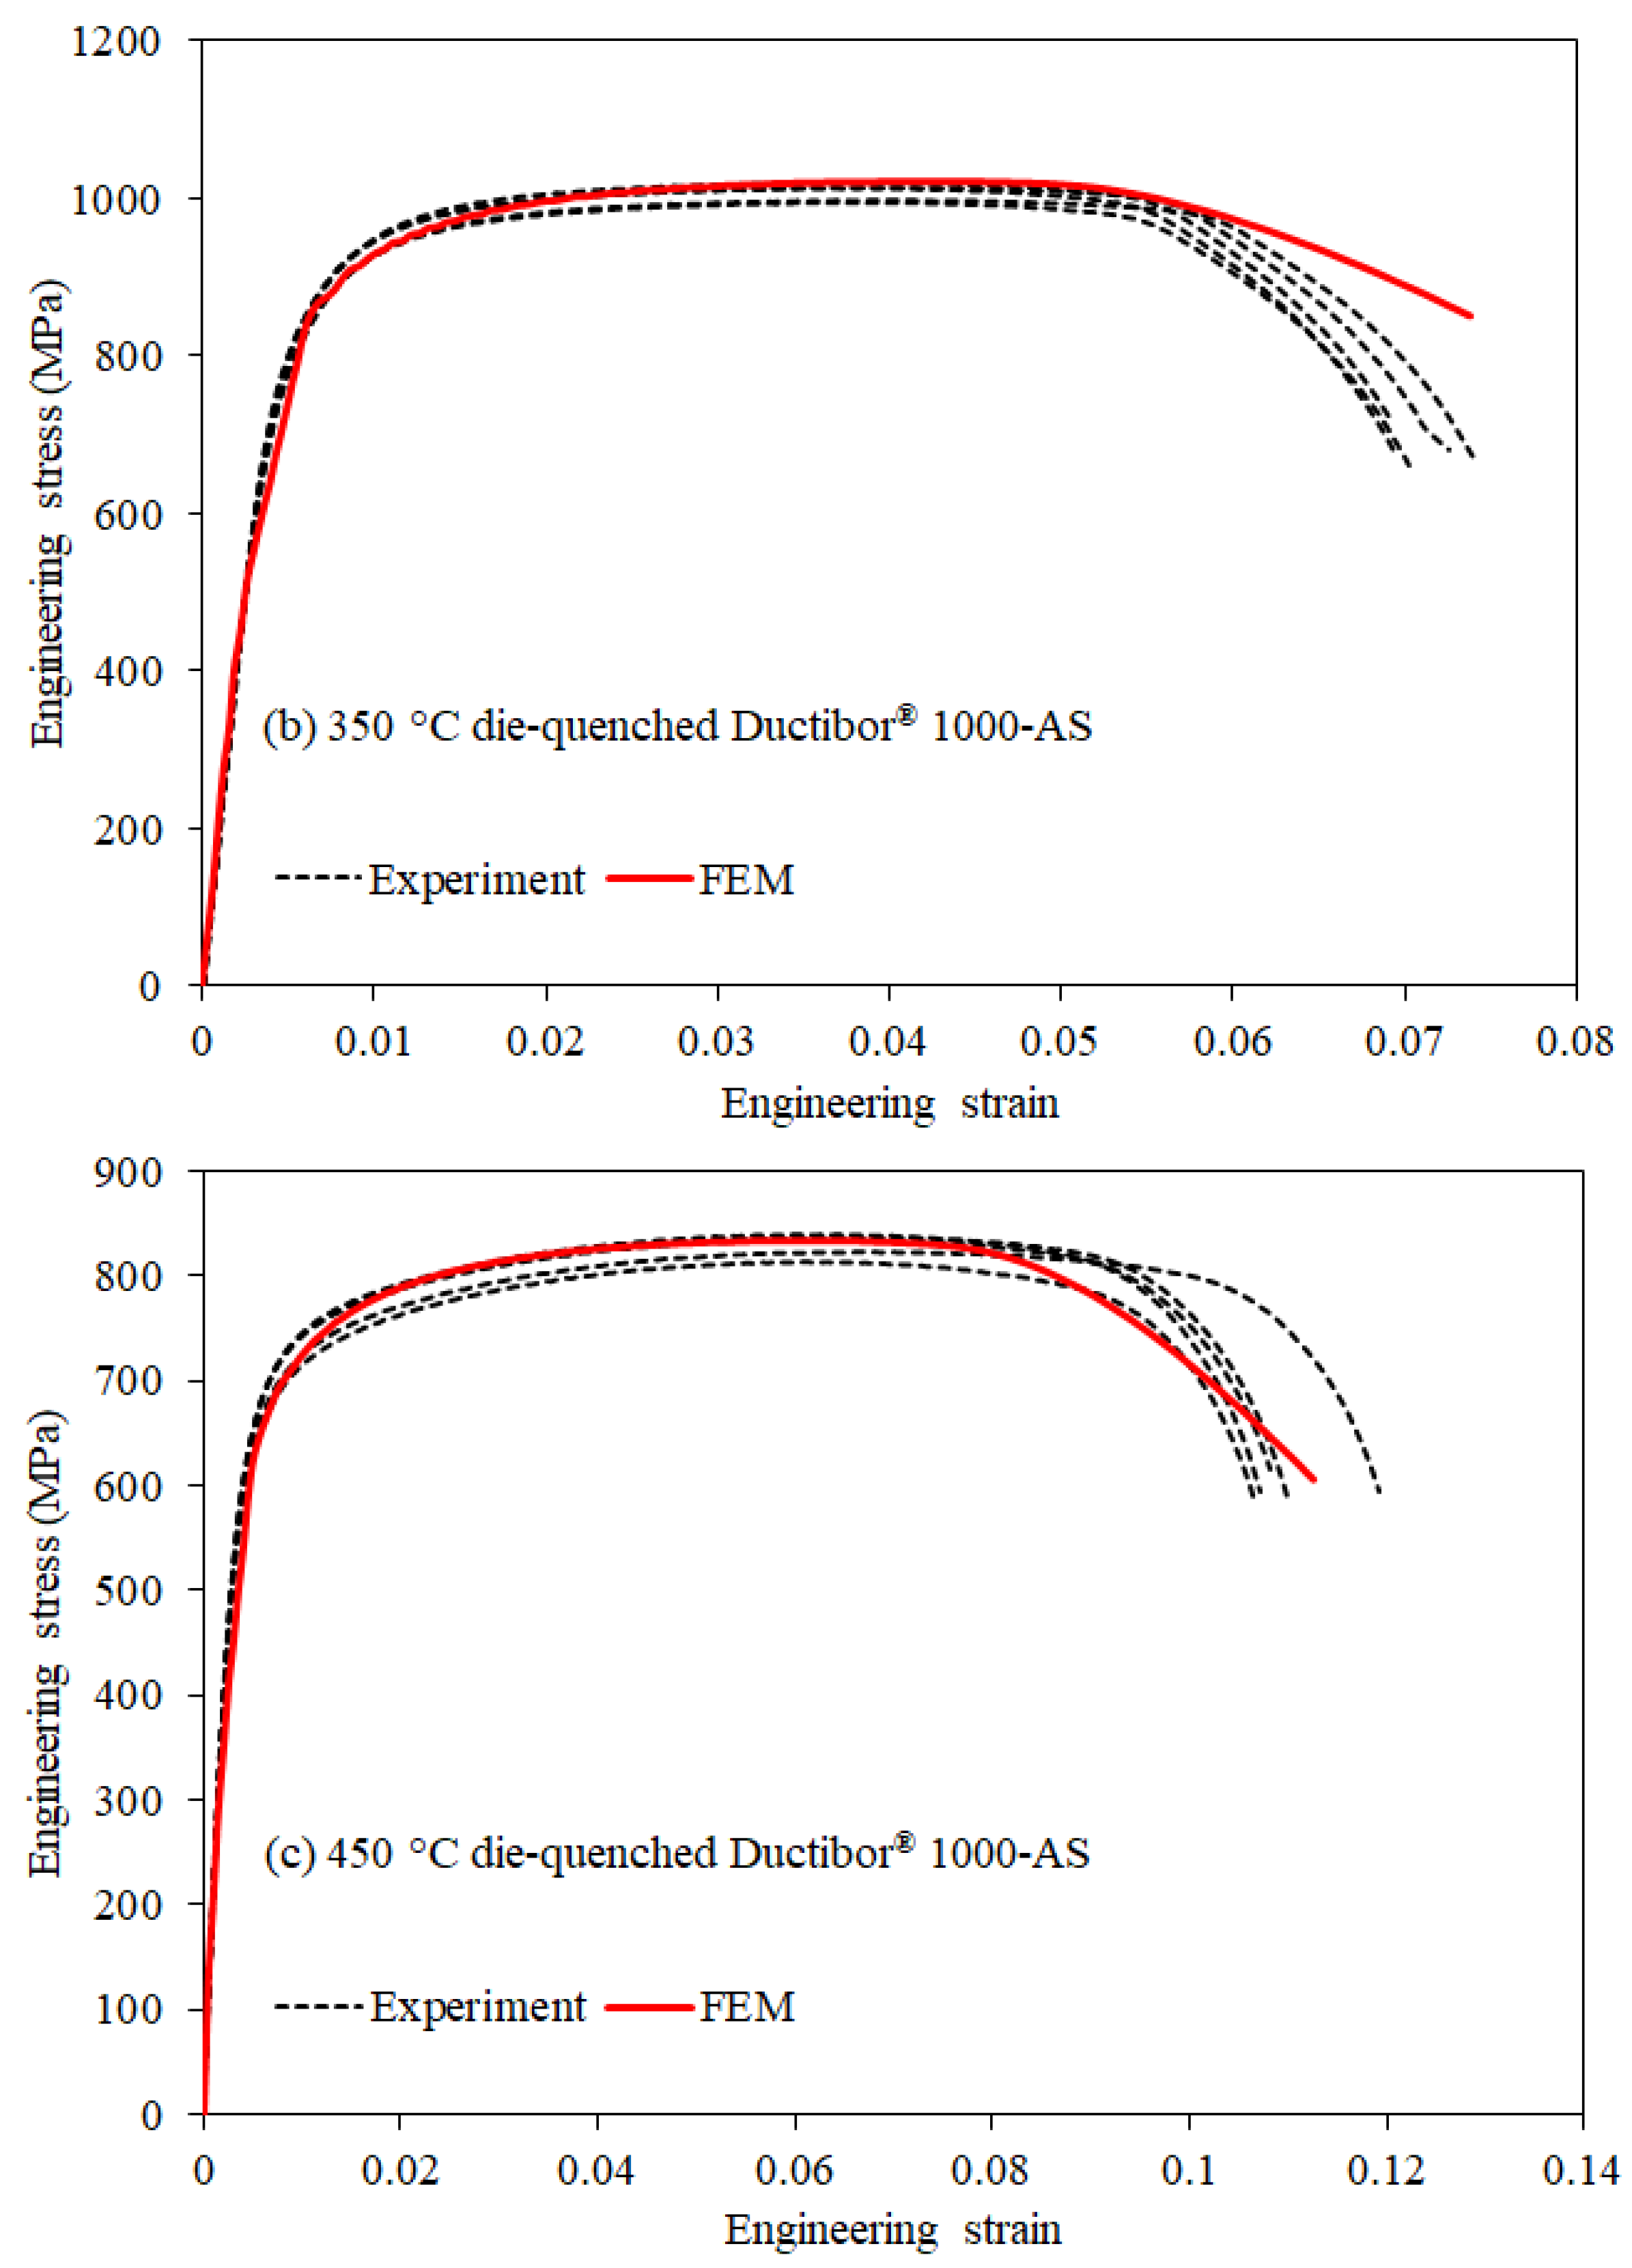
Appendix B. Validation of Hardening Curves

To evaluate the tensile-plus-converted shear flow curves (shown in Figure 8b), they were first fit to a modified Hockett-Sherby hardening model (Equation (A6) [46]) and then extended beyond the experimental ranges using the calibrated models.
σ ¯ = b ( b a ) exp ( c ( ε ¯ p ) d ) + e ε ¯ p
Material parameters of a to e in Equation (A6) were determined using a least-squares minimization algorithm, with Considère’s criterion ( d σ ¯ / d ε ¯ = σ ¯ at UTS) as an additional constraint, using MATLAB (R2020a, MathWorks, Natick, MA, USA).
Next, the tensile tests were modelled in the finite-element (FE) software of LS DYNA (R12.0.0, Livermore Software Technology Corporation (LSTC), Livermore, CA, USA) with the developed constitutive fits as input data, and the predicted engineering stress-strain response was compared with the experimental data. The simulations were performed using an explicit solver with fully integrated brick elements. Due to mirror symmetries across the length, width, and thickness directions, only one-eighth of the tensile sample was modelled. A mesh size of 0.075 mm was applied in the specimen gauge region (eight elements through half of the thickness). For the 25 °C die-quenched condition whose anisotropic properties were characterized along three principal directions of the sheet, the anisotropic yield function of Barlat Yld2004-18p [65] (calibrated in Appendix A) was used. However, for the 350 °C and 450 °C die-quenched conditions with the anisotropic properties obtained only for the TD, the von Mises yield criterion was utilized.
Table A3 presents the calibrated material parameters of the modified Hockett-Sherby model for the three hot-stamped conditions, and Figure A3 displays the corresponding stress-strain fits. It is evident that the experimental tensile and converted shear data were well captured by the modified Hockett-Sherby model.
Table A3. The calibrated material parameters of the modified Hockett-Sherby model for various die-quenched conditions of Ductibor® 1000-AS.
Material Condition a (MPa) b (MPa) c d e (MPa) R-Squared
25 °C die-quenched415.391183.0618.080.4959.660.9946
350 °C die-quenched471.701079.4011.930.4149.270.9896
450 °C die-quenched325.93895.258.320.38106.540.9962
Figure A3. The extrapolated hardening curves corresponding to the modified Hockett-Sherby model based upon the tensile and converted shear data for various die-quenched conditions of Ductibor® 1000-AS. The tensile and shear results correspond to the tests with the TD-oriented major principal stress.
Metals 12 01770 g0a3
Figure A4 displays the predicted engineering stress-strain response of the three hot-stamped conditions along the TD in the FE simulations. The predictions are consistent with the measured data for all material conditions. Such agreement serves to validate the obtained hardening curves.
Figure A4. Comparisons of the predicted engineering stress-strain response in various material conditions of Ductibor® 1000-AS with the experimental data; (a) 25 °C (b) 350 °C, and (c) 450 °C die-quenched conditions.
Metals 12 01770 g0a4aMetals 12 01770 g0a4b

References

  1. Karbasian, H.; Tekkaya, A. A review on hot stamping. J. Mater. Process. Technol. 2010, 210, 2103–2118. [Google Scholar] [CrossRef]
  2. Samadian, P.; Parsa, M.H.; Shakeri, A. Determination of Proper Austenitization Temperatures for Hot Stamping of AISI 4140 Steel. J. Mater. Eng. Perform. 2014, 23, 1138–1145. [Google Scholar] [CrossRef]
  3. Samadian, P.; Parsa, M.H.; Mirzadeh, H. Prediction of Proper Temperatures for the Hot Stamping Process Based on the Kinetics Models. J. Mater. Eng. Perform. 2014, 24, 572–585. [Google Scholar] [CrossRef]
  4. Merklein, M.; Wieland, M.; Lechner, M.; Bruschi, S.; Ghiotti, A. Hot stamping of boron steel sheets with tailored properties: A review. J. Mater. Process. Technol. 2015, 228, 11–24. [Google Scholar] [CrossRef]
  5. Merklein, M.; Johannes, M.; Lechner, M.; Kuppert, A. A review on tailored blanks—Production, applications and evaluation. J. Mater. Process. Technol. 2013, 214, 151–164. [Google Scholar] [CrossRef]
  6. ArcelorMittal. Steels for Hot Stamping; Technical Report; ArcelorMittal: Luxembourg City, Luxembourg, 2008. [Google Scholar]
  7. ArcelorMittal. Steels for Hot Stamping—Usibor®; Technical Report; ArcelorMittal: Luxembourg City, Luxembourg, 2016. [Google Scholar]
  8. Samadian, P.; Butcher, C.; Worswick, M.J. Microstructures and Flow Behavior of Ductibor® 500-AS Steel for a Range of As-Quenched Conditions. J. Mater. Eng. Perform. 2020, 29, 7153–7169. [Google Scholar] [CrossRef]
  9. Naderi, M.; Uthaisangsuk, V.; Prahl, U.; Bleck, W. A Numerical and Experimental Investigation into Hot Stamping of Boron Alloyed Heat Treated Steels. Steel Res. 2008, 79, 77–84. [Google Scholar] [CrossRef]
  10. Bardelcik, A.; Vowles, C.J.; Worswick, M.J. A Mechanical, Microstructural, and Damage Study of Various Tailor Hot Stamped Material Conditions Consisting of Martensite, Bainite, Ferrite, and Pearlite. Met. Mater. Trans. A 2018, 49, 1102–1120. [Google Scholar] [CrossRef]
  11. Eller, T.; Greve, L.; Andres, M.; Medricky, M.; Hatscher, A.; Meinders, V.; Boogaard, A.V.D. Plasticity and fracture modeling of quench-hardenable boron steel with tailored properties. J. Mater. Process. Technol. 2014, 214, 1211–1227. [Google Scholar] [CrossRef]
  12. Turetta, A.; Bruschi, S.; Ghiotti, A. Investigation of 22MnB5 formability in hot stamping operations. J. Mater. Process. Technol. 2006, 177, 396–400. [Google Scholar] [CrossRef]
  13. Barcellona, A.; Palmeri, D. Effect of Plastic Hot Deformation on the Hardness and Continuous Cooling Transformations of 22MnB5 Microalloyed Boron Steel. Met. Mater. Trans. A 2009, 40, 1160–1174. [Google Scholar] [CrossRef]
  14. Taylor, T.; Fourlaris, G.; Evans, P.; Bright, G. New generation ultrahigh strength boron steel for automotive hot stamping technologies. Mater. Sci. Technol. 2013, 30, 818–826. [Google Scholar] [CrossRef]
  15. Mohr, D.; Ebnoether, F. Plasticity and fracture of martensitic boron steel under plane stress conditions. Int. J. Solids Struct. 2009, 46, 3535–3547. [Google Scholar] [CrossRef] [Green Version]
  16. Abdollahpoor, A.; Chen, X.; Pereira, M.P.; Xiao, N.; Rolfe, B.F. Sensitivity of the final properties of tailored hot stamping components to the process and material parameters. J. Mater. Process. Technol. 2016, 228, 125–136. [Google Scholar] [CrossRef]
  17. Hagenah, H.; Merklein, M.; Lechner, M.; Schaub, A.; Lutz, S. Determination of the Mechanical Properties of Hot Stamped Parts from Numerical Simulations. Procedia CIRP 2015, 33, 167–172. [Google Scholar] [CrossRef] [Green Version]
  18. Srithananan, P.; Kaewtatip, P.; Uthaisangsuk, V. Micromechanics-based modeling of stress–strain and fracture behavior of heat-treated boron steels for hot stamping process. Mater. Sci. Eng. A 2016, 667, 61–76. [Google Scholar] [CrossRef]
  19. Östlund, R.; Golling, S.; Oldenburg, M. Microstructure based modeling of ductile fracture initiation in press-hardened sheet metal structures. Comput. Methods Appl. Mech. Eng. 2016, 302, 90–108. [Google Scholar] [CrossRef]
  20. Golling, S.; Östlund, R.; Oldenburg, M. Characterization of ductile fracture properties of quench-hardenable boron steel: Influence of microstructure and processing conditions. Mater. Sci. Eng. A 2016, 658, 472–483. [Google Scholar] [CrossRef] [Green Version]
  21. Golling, S.; Östlund, R.; Oldenburg, M. A stress-based fracture criteria validated on mixed microstructures of ferrite and bainite over a range of stress triaxialities. Mater. Sci. Eng. A 2016, 674, 232–241. [Google Scholar] [CrossRef] [Green Version]
  22. Mishra, K. Effects of Microstructure and Strain Rate on Deformation Behavior in Advanced High Strength Steels. Master’s Thesis, Georgia Institute of Technology, Atlanta, GA, USA, 2017. [Google Scholar]
  23. Samadian, P.; Butcher, C.; Worswick, M.J. A mean-field homogenization approach to predict fracture in as-quenched microstructures of Ductibor® 500-AS steel: Characterization and modelling. Int. J. Solids Struct. 2021, 229, 111137. [Google Scholar] [CrossRef]
  24. Güner, A.; Sonntag, M.; Philippot, C.; Bittendiebel, J.; Sarre, B.; Dormegny, L.; Reihani, A.; Heibel, S. Assuring Final Product Properties in BIW Applications Using Ductibor ® 1000 AS. In Proceedings of the 16th Erlanger Workshop Warmblechumformung, Erlangen, Germany, 9 November 2021. [Google Scholar]
  25. Sarkar, S.; Drillet, P.; Beauvais, M.; Ramisetti, N.; Dormegny, L. Ductibor® 1000 AlSi: A New PHS Development for a Crash Ductility Optimization. In Proceedings of the 6th International Conference—Hot Sheet Metal Forming of High-Performance Steel, Atlanta, GA, USA, 4 June 2017; pp. 591–600. [Google Scholar]
  26. Lee, S.H.; Peister, C.; Abedini, A.; Imbert, J.; Butcher, C.; Worswick, M.; Soldaat, R.; Bernert, W.; Famchon, E.; Penner, P.; et al. Dynamic Axial Crush Response of Ductibor® 1000-AS—Effect of Fold Initiator Pattern on Performance. In Proceedings of the 7th International Conference—Hot Sheet Metal Forming of High-Performance Steel, Luleå, Sweden, 2–5 June 2019. [Google Scholar]
  27. Mohamadizadeh, A.; Biro, E.; Worswick, M. Novel Double-Half Spot Weld Testing Technique For Damage Progress And Failure Analysis Using Digital Image Correlation Techniques. Exp. Mech. 2021, 61, 1405–1418. [Google Scholar] [CrossRef]
  28. Caron, E.J.; Daun, K.J.; Wells, M.A. Experimental heat transfer coefficient measurements during hot forming die quenching of boron steel at high temperatures. Int. J. Heat Mass Transf. 2014, 71, 396–404. [Google Scholar] [CrossRef]
  29. Omer, K.; Butcher, C.; Worswick, M. Characterization of heat transfer coefficient for non-isothermal elevated temperature forming of metal alloys. Int. J. Mater. Form. 2019, 13, 177–201. [Google Scholar] [CrossRef]
  30. ASTM E562-11; Standard Test Method for Determining Volume Fraction by Systematic Manual Point Count. ASTM: West Conshohocken, PA, USA, 2011; pp. 1–7. [CrossRef]
  31. Sulamet-Ariobimo, R.D.; Soedarsono, J.W.; Sukarnoto, T.; Rustandi, A.; Mujalis, Y.; Prayitno, D. Tensile properties analysis of AA1100 aluminium and SS400 steel using different JIS tensile standard specimen. J. Appl. Res. Technol. 2016, 14, 148–153. [Google Scholar] [CrossRef] [Green Version]
  32. Peirs, J.; Verleysen, P.; Degrieck, J. Novel Technique for Static and Dynamic Shear Testing of Ti6Al4V Sheet. Exp. Mech. 2011, 52, 729–741. [Google Scholar] [CrossRef] [Green Version]
  33. ISO 16630:2017(E); Metallic Materials—Sheet and Strip—Hole Expanding Test. ISO: London, UK, 2017.
  34. Abedini, A.; Butcher, C.; Worswick, M. Influence of Strain Rate on Fracture Behaviour of Ultra-High Strength Steel Sheet; DYMAT: Stresa, Italy, 2019. [Google Scholar]
  35. Nakazima, K.; Kikuma, T.; Hasaku, K. Study on the formability of steel sheets. Yawata Tech. Rep. 1971, 284, 678–680. [Google Scholar]
  36. Rahmaan, T.; Abedini, A.; Butcher, C.; Pathak, N.; Worswick, M.J. Investigation into the shear stress, localization and fracture behaviour of DP600 and AA5182-O sheet metal, alloys under elevated strain rates. Int. J. Impact Eng. 2017, 108, 303–321. [Google Scholar] [CrossRef]
  37. Huang, G.; Tihay, K.; Sriram, S.; Weber, B.; Dietsch, P.; Cornette, D. Fracture characterization of AHSS using two different experimental methods. IOP Conf. Series Mater. Sci. Eng. 2018, 418, 012080. [Google Scholar] [CrossRef] [Green Version]
  38. Gorji, M.; Berisha, B.; Hora, P.; Barlat, F. Modeling of localization and fracture phenomena in strain and stress space for sheet metal forming. Int. J. Mater. Form. 2015, 9, 573–584. [Google Scholar] [CrossRef]
  39. Samadian, P.; Kortenaar, L.T.; Omer, K.; Butcher, C.; Worswick, M.J. Fracture characterization of tailored Usibor® 1500-AS and damage modelling based on a coupled-micromechanical-phenomenological strategy. Eng. Fract. Mech. 2019, 223, 106785. [Google Scholar] [CrossRef]
  40. Samadian, P.; Butcher, C.; Worswick, M.J. New mean-field homogenization schemes for the constitutive modelling of the elastic and elastoplastic deformation behavior of multi-phase materials. Mater. Today Commun. 2019, 24, 100707. [Google Scholar] [CrossRef]
  41. Lielens, G.; Pirotte, P.; Couniot, A.; Dupret, F.; Keunings, R. Prediction of thermo-mechanical properties for compression moulded composites. Compos. Part A Appl. Sci. Manuf. 1998, 29, 63–70. [Google Scholar] [CrossRef]
  42. Weng, G. The overall elastoplastic stress-strain relations of dual-phase metals. J. Mech. Phys. Solids 1990, 38, 419–441. [Google Scholar] [CrossRef]
  43. Rodriguez, R.-M.; Gutiérrez, I. Unified Formulation to Predict the Tensile Curves of Steels with Different Microstructures. Mater. Sci. Forum 2003, 426–432, 4525–4530. [Google Scholar] [CrossRef]
  44. Ramazani, A.; Mukherjee, K.; Abdurakhmanov, A.; Prahl, U.; Schleser, M.; Reisgen, U.; Bleck, W. Micro–macro-characterisation and modelling of mechanical properties of gas metal arc welded (GMAW) DP600 steel. Mater. Sci. Eng. A 2014, 589, 1–14. [Google Scholar] [CrossRef]
  45. Simo, J.C.; Hughes, T.J.R. Computational Inelasticity; Springer: Berlin/Heidelberg, Germany, 1998. [Google Scholar] [CrossRef]
  46. Noder, J.; Butcher, C. A comparative investigation into the influence of the constitutive model on the prediction of in-plane formability for Nakazima and Marciniak tests. Int. J. Mech. Sci. 2019, 163, 105138. [Google Scholar] [CrossRef]
  47. Butcher, C.; Abedini, A. Shear confusion: Identification of the appropriate equivalent strain in simple shear using the logarithmic strain measure. Int. J. Mech. Sci. 2017, 134, 273–283. [Google Scholar] [CrossRef]
  48. Neukamm, F.; Feucht, M.; Haufe, A.; Ag, D. Considering damage history in crashworthiness simulations. In Proceedings of the 7th European LS-DYNA Conference, Salzburg, Austria, 14–15 May 2009. [Google Scholar]
  49. Bai, Y.; Wierzbicki, T. Application of extended Mohr–Coulomb criterion to ductile fracture. Int. J. Fract. 2009, 161, 1–20. [Google Scholar] [CrossRef]
  50. Abadie, J.; Carpentier, J. Generalization of the Wolfe Reduced Gradient Method to the Case of Nonlinear Constraints; Fletcher, R., Ed.; Academic Press: London, UK, 1969; pp. 37–47. [Google Scholar]
  51. Andrews, K.W. Empirical Formulae for the Calculation of Some Transformation Temperatures. J. Iron. Steel Inst. 1965, 203, 721–727. [Google Scholar]
  52. Krauss, G. Martensite in steel: Strength and structure. Mater. Sci. Eng. A 1999, 273–275, 40–57. [Google Scholar] [CrossRef]
  53. Morsdorf, L.; Tasan, C.; Ponge, D.; Raabe, D. 3D structural and atomic-scale analysis of lath martensite: Effect of the transformation sequence. Acta Mater. 2015, 95, 366–377. [Google Scholar] [CrossRef]
  54. VDA 238-100; Plate Bending Test for Metallic Materials. VDA: Eisenach, Germany, 2010; pp. 1–13.
  55. Samadian, P.; O’Keeffe, C.; Butcher, C.; Worswick, M.J. Fracture Response in Hot-Stamped Tailor-Welded Blanks of Ductibor® 500-AS and Usibor® 1500-AS: Experiments and Modelling. Eng. Fract. Mech. 2021, 253, 107864. [Google Scholar] [CrossRef]
  56. Young, C.H.; Bhadeshia, H.K.D.H. Strength of mixtures of bainite and martensite. Mater. Sci. Technol. 1994, 10, 209–214. [Google Scholar] [CrossRef]
  57. Seol, J.-B.; Raabe, D.; Choi, P.-P.; Im, Y.-R.; Park, C.-G. Atomic scale effects of alloying, partitioning, solute drag and austempering on the mechanical properties of high-carbon bainitic–austenitic TRIP steels. Acta Mater. 2012, 60, 6183–6199. [Google Scholar] [CrossRef]
  58. Clarke, A.J.; Speer, J.G.; Miller, M.K.; Hackenberg, R.E.; Edmonds, D.V.; Matlock, D.K.; Rizzo, F.C.; Clarke, K.D.; De Moor, E. Carbon partitioning to austenite from martensite or bainite during the quench and partition (Q&P) process: A critical assessment. Acta Mater. 2008, 56, 16–22. [Google Scholar] [CrossRef]
  59. Timokhina, I.B.; Liss, K.D.; Raabe, D.; Rakha, K.; Beladi, H.; Xiong, X.Y.; Hodgson, P.D. Growth of bainitic ferrite and carbon partitioning during the early stages of bainite transformation in a 2 mass% silicon steel studied by in situ neutron diffraction, TEM and APT. J. Appl. Crystallogr. 2016, 49, 399–414. [Google Scholar] [CrossRef] [Green Version]
  60. Bhadeshia, H.K.D.H.; Christian, J.W. Bainite in steels. Metall. Trans. A 1990, 21, 767–797. [Google Scholar] [CrossRef]
  61. Ramazani, A.; Chang, Y.; Prahl, U. Characterization and Modeling of Failure Initiation in Bainite-Aided DP Steel. Adv. Eng. Mater. 2014, 16, 1370–1380. [Google Scholar] [CrossRef] [Green Version]
  62. Golling, S.; Östlund, R.; Oldenburg, M. A study on homogenization methods for steels with varying content of ferrite, bainite and martensite. J. Mater. Process. Technol. 2016, 228, 88–97. [Google Scholar] [CrossRef] [Green Version]
  63. Davoudi, K.M.; Vlassak, J.J. Dislocation evolution during plastic deformation: Equations vs. discrete dislocation dynamics study. J. Appl. Phys. 2018, 123, 085302. [Google Scholar] [CrossRef]
  64. Ramazani, A.; Pinard, P.; Richter, S.; Schwedt, A.; Prahl, U. Characterisation of microstructure and modelling of flow behaviour of bainite-aided dual-phase steel. Comput. Mater. Sci. 2013, 80, 134–141. [Google Scholar] [CrossRef]
  65. Barlat, F.; Aretz, H.; Yoon, J.; Karabin, M.; Brem, J.; Dick, R. Linear transfomation-based anisotropic yield functions. Int. J. Plast. 2005, 21, 1009–1039. [Google Scholar] [CrossRef]
  66. Abedini, A.; Butcher, C.; Rahmaan, T.; Worswick, M. Evaluation and calibration of anisotropic yield criteria in shear Loading: Constraints to eliminate numerical artefacts. Int. J. Solids Struct. 2018, 151, 118–134. [Google Scholar] [CrossRef] [Green Version]
  67. Butcher, C.; Abedini, A. On anisotropic plasticity models using linear transformations on the deviatoric stress: Physical constraints on plastic flow in generalized plane strain. Int. J. Mech. Sci. 2019, 161–162, 105044. [Google Scholar] [CrossRef]
  68. Narayanan, A.; Bourque, C.; Fast-Irvine, C.; Abedini, A.; Anderson, D.; Butcher, C. Identification of the Plane Strain Yield Strength of Anisotropic Sheet Metals Using Inverse Analysis of Notch Tests; SAE: Warrendale, PA, USA, 2022. [Google Scholar] [CrossRef]
  69. Abspoel, M.; Scholting, M.E.; Lansbergen, M.; An, Y.; Vegter, H. A new method for predicting advanced yield criteria input parameters from mechanical properties. J. Mater. Process. Technol. 2017, 248, 161–177. [Google Scholar] [CrossRef]
Figure 1. Specimen geometries for the tensile [31], shear [32], hole-expansion [33], plane-strain notch tension [34], and Nakazima [35] tests (note: dimensions are in millimeters).
Metals 12 01770 g001
Figure 2. Thickness measurements for the (a) plane-strain notch tension (350 °C die-quenched) and (b) Nakazima (450 °C die-quenched) samples of Ductibor® 1000-AS.
Metals 12 01770 g002
Figure 3. (a) LOM and (b) SEM images from the as-received microstructure of Ductibor® 1000-AS (F: ferrite and M: martensite).
Metals 12 01770 g003
Figure 4. (a) LOM and (b) SEM images from the 25 °C die-quenched microstructure of Ductibor® 1000-AS (M: martensite).
Metals 12 01770 g004
Figure 5. (a) LOM and (b) SEM images from the 350 °C die-quenched microstructure of Ductibor® 1000-AS (B: bainite and M: martensite).
Metals 12 01770 g005
Figure 6. (a) LOM and (b) SEM images from the 450 °C die-quenched microstructure of Ductibor® 1000-AS (F: ferrite, B: bainite, and M: martensite).
Metals 12 01770 g006
Figure 7. The measured stress-strain response in various die-quenched conditions of Ductibor® 1000-AS; (a) tensile and (b) shear-test data. The scatter of the measured data is denoted by the error bars.
Metals 12 01770 g007
Figure 8. (a) The shear-to-tensile stress ratios vs. plastic work up to the UTS points and (b) the hardening curves extrapolated using the shear-conversion approach for various die-quenched conditions of Ductibor® 1000-AS.
Metals 12 01770 g008
Figure 9. The flow curves of Ductibor® 500-AS [8], Ductibor® 1000-AS, and Usibor® 1500-AS in the cold die-quenched condition. Note that all hardening curves were obtained based on the tensile and shear test data (shear-conversion technique [36]).
Metals 12 01770 g009
Figure 10. Major principal strain DIC contour plots at one frame prior to fracture for the (a) shear (350 °C die-quenched condition), (b) hole-expansion (25 °C die-quenched condition), (c) plane-strain notch tension (450 °C die-quenched condition), and (d) Nakazima (25 °C die-quenched condition) specimens of Ductibor® 1000-AS.
Metals 12 01770 g010
Figure 11. The measured strain paths at the fracture points of fracture-test samples of various die-quenched conditions of Ductibor® 1000-AS during deformation. The DIC and thickness measurement-based fracture points are denoted by the “o” and “×” symbols, respectively, and the scatter of the measured data is displayed by the error bars.
Metals 12 01770 g011
Figure 12. The equivalent fracture strains of various die-quenched conditions of Ductibor® 1000-AS for each fracture test. The scatter of the measured data is denoted by the error bars.
Metals 12 01770 g012
Figure 13. (a) Fracture loci for various die-quenched conditions of Ductibor® 1000-AS and (b) a comparison between the fracture loci of Ductibor® 500-AS [55], Ductibor® 1000-AS, and Usibor® 1500-AS in the cold die-quenched condition [55]. The markers denote the experimental data.
Metals 12 01770 g013
Figure 14. The calculated flow curves for (a) martensite and (b) bainite in various die-quenched microstructures of Ductibor® 1000-AS using Rodriguez and Gutierrez’s model (Equation (8) [43]). The computed equivalent stress-strain data for bainite in a fully bainitic microstructure is also displayed for comparison.
Metals 12 01770 g014
Figure 15. The predicted flow stress-strain response of various die-quenched microstructures of Ductibor® 1000-AS using the established numerical scheme compared with the experimental tensile-plus-converted shear flow data.
Metals 12 01770 g015
Figure 16. The calculated carbon concentrations in martensite and bainite within Ductibor® 1000-AS bainitic-martensitic microstructures with various phase amounts (%v). The solid lines represent the model predictions, and the markers denote the values for the reference microstructures.
Metals 12 01770 g016
Figure 17. The calculated hardening curves for (a) martensite and (b) bainite in Ductibor® 1000-AS bainitic-martensitic microstructures with various phase amounts (%v) using Rodriguez and Gutierrez’s model (Equation (8) [43]).
Metals 12 01770 g017
Figure 18. The predicted hardening curves for Ductibor® 1000-AS bainitic-martensitic microstructures with various phase amounts (%v) using the established numerical scheme. The 100%B and 100%M hardening curves are also displayed for the reference.
Metals 12 01770 g018
Figure 19. Variations in the MMC material parameters with the martensite content (%v) in various die-quenched microstructures of Ductibor® 1000-AS. The solid lines represent the interpolated data, and the dotted lines denote the extrapolated data. The symbols display the data points for the reference microstructures.
Metals 12 01770 g019
Figure 20. The predicted equivalent fracture strains of the (a) 350 °C and (b) 450 °C die-quenched microstructures of Ductibor® 1000-AS in each fracture test using the established numerical scheme. The scatter of the measured data is denoted by the error bars.
Metals 12 01770 g020
Figure 21. The predicted fracture loci of the reference multi-phase microstructures of Ductibor® 1000-AS using the established numerical scheme compared with their MMC fracture curves. The 100%B and 100%M fracture loci are also shown for comparison purposes. The scatter of the measured data is denoted by the error bars.
Metals 12 01770 g021
Figure 22. The predicted fracture loci for Ductibor® 1000-AS bainitic-martensitic microstructures with various phase amounts (%v) using the established numerical scheme. The 100%B and 100%M fracture loci are also displayed for the reference.
Metals 12 01770 g022
Table 1. The Ductibor® 1000-AS chemical composition (unit: wt.%).
CMnTiNbCrSiPSBFe
0.0811.6430.0150.0550.0730.3620.0110.0010.003balance
Table 2. The measured hardness and micro-constituent volume fractions (%v) for the studied microstructures of Ductibor® 1000-AS.
Material ConditionF (%v)B (%v)M (%v)Hardness (HVN)
As-received88.0 ± 2.1 *-12.0 ± 2.1226 ± 2
25 °C die-quenched--100384 ± 4
350 °C die-quenched-24.9 ± 3.475.1 ± 3.4340 ± 5
450 °C die-quenched3.0 ± 0.4 67.4 ± 5.329.6 ± 5.5276 ± 10
* The variations denote the standard deviation.
Table 3. The measured tensile properties for different Ductibor® 1000-AS die-quenched conditions.
Material ConditionUTS (MPa)Uniform Elongation (%) Elongation to Fracture (%)
25 °C die-quenched1122 ± 9 *4.3 ± 0.17.0 ± 0.4
350 °C die-quenched1009 ± 93.9 ± 0.17.1 ± 0.2
450 °C die-quenched833 ± 136.1 ± 0.410.8 ± 0.6
* The variations denote the standard deviation.
Table 4. The averaged stress triaxiality ( η ), Lode parameters ( ξ ), and strain ratios ( ρ ) at the fracture locations of fracture-test samples of various die-quenched conditions of Ductibor® 1000-AS.
Material ConditionShearHole ExpansionPlane-Strain Notch TensionNakazima
25 °C die-quenched η = 0 ξ = 0 ρ = 1 η = 0.333 ξ = 1 ρ = 0.5 η = 0.568 ξ = 0.084 ρ = 0.032 η = 0.666 ξ = 0.995 ρ = 0.887
350 °C die-quenched η = 0 ξ = 0 ρ = 1 η = 0.333 ξ = 1 ρ = 0.5 η = 0.566 ξ = 0.098 ρ = 0.037 η = 0.661 ξ = 0.919 ρ = 0.618
450 °C die-quenched η = 0 ξ = 0 ρ = 1 η = 0.333 ξ = 1 ρ = 0.5 η = 0.564 ξ = 0.118 ρ = 0.045 η = 0.665 ξ = 0.981 ρ = 0.796
Table 5. The MMC material parameters calibrated for various die-quenched conditions of Ductibor® 1000-AS.
Material Condition A B C
25 °C die-quenched1.17420.1196−3.1888
350 °C die-quenched1.17350.1883−1.8950
450 °C die-quenched1.15730.2042−1.2428
Table 6. The carbon concentrations of the bainitic and martensitic phases in various material conditions/microstructures of Ductibor® 1000-AS.
Material Condition/MicrostructureCarbon in Bainite (wt.%)Carbon in Martensite (wt.%)
25 °C die-quenched (100%M)-0.081 ≈ total steel carbon
350 °C die-quenched (~25%B + 75%M)0.063 (from Equation (12))0.087 (from calibration)
450 °C die-quenched (~70%B + 30%M)0.035 (from Equation (12))0.189 (from calibration)
Fully bainitic (100%B)0.081 ≈ total steel carbon-
Table 7. The calibrated values of dislocation mean free paths and recovery rates for bainite and martensite in the as-quenched microstructures of Ductibor® 1000-AS used in Rodriguez and Gutierrez’s model (Equation (8) [43]).
Micro-ConstituentDislocation Mean Free Path (m)Recovery Rate
Bainite1.80 × 10−64.30
Martensite4.40 × 10−845.73
Table 8. The values of calibration parameters ( a , b , and c ) of Equation (22) for the martensite carbon content ( % C M ) and MMC material parameters ( A , B , and C ).
Parameter a b c
% C M (wt.%)0.63915.87130.0792
A −0.12026.49221.1744
B −0.0001−6.51470.2051
C −0.0430−3.8798−1.1050
Publisher’s Note: MDPI stays neutral with regard to jurisdictional claims in published maps and institutional affiliations.

