Article

Enhancing the Antibacterial Properties and Biocompatibility of Ti-Cu Alloy by Roughening and Anodic Oxidation

1
Northern Theater General Hospital, Shenyang 110016, China
2
Key Laboratory for Anisotropy and Texture of Materials, School of Materials Science and Engineering, Key Education Ministry of China, Northeastern University, Shenyang 110819, China
*
Authors to whom correspondence should be addressed.
Metals 2022, 12(10), 1726; https://doi.org/10.3390/met12101726
Submission received: 8 August 2022 / Revised: 30 September 2022 / Accepted: 10 October 2022 / Published: 14 October 2022

Abstract

:
Although Ti-Cu alloys have been shown to possess good antibacterial properties, they are still biologically inert. In this study, sandblasting and acid etching combined with anodic oxidation were applied to roughen the surface as well as to form a TiO2/CuO/Cu2O composite film, which would benefit both the antibacterial properties and the biocompatibility. The surface morphology, the phase composition, and the physicochemical properties were characterized by scanning electron microscopy (SEM), X-ray diffraction (XRD) and X-ray photoelectron spectroscopy (XPS). Electrochemical testing and inductively coupled plasma spectrometry (ICP) were used to determine the corrosion resistance and Cu ion release, the plate counting method was used to evaluate the antibacterial performance, and the CCK-8 method was used to evaluate the cytocompatibility. It was revealed that a rough surface with densely porous double layer composed of TiO2/CuO/Cu2O was produced on Ti-Cu alloy surface after the combined surface modification, which enhanced the corrosion resistance significantly. The plate counting results demonstrated that the modified sample had strong long-term antibacterial performance (antibacterial rate > 99%), which was attributed to the formation of TiO2/CuO/Cu2O composite film. The cell compatibility evaluation results indicated that the surface modification improved the cytocompatibility. It was demonstrated that the combined modification provided very strong antibacterial ability and good cytocompatiblity, potentially making it a good candidate surface modification technique for Ti-Cu alloy for biomedical applications.

1. Introduction

Biomedical titanium alloys are widely used as implant materials in clinical treatment [1]. However, titanium alloys are still bioinert. As a result, mechanical interlocking, rather than stable biochemical bonding, normally forms at the bone/implant interface, which can lead to serious inflammatory reactions or implant loosening [2]. Therefore, it is necessary and important to reduce inflammation and enhance the surface bonding strength of titanium implants.
One of the effective measures for reducing inflammation is the development of antibacterial titanium alloys. Ag and Cu are two of the most widely used antibacterial alloying elements [3,4,5,6,7,8]. Compared with Ag, Cu also has strong broad-spectrum antibacterial activity at a lower price. Cu element is also an essential trace element for the human body. Therefore, using Cu is undoubtedly an ideal choice for endowing materials with antibacterial activity. Recently, copper-containing titanium alloys have been reported to exhibit very good antibacterial ability against Staphylococcus aureus (S. aureus), Escherichia coli (E. coli) and Pseudomonas aeruginosa (P. aeruginosa) [4,5,9,10,11,12,13]. However, it is still necessary to improve the surface bioactivity, although no cell toxicity has been reported so far.
More recently, Zhang et al. prepared a micron/submicron coating on Ti-Cu, which showed good biocompatibility and osteogenic ability [14]. Hu et al. prepared a porous oxidation film on Ti-Cu by micro-arc oxidation (MAO), which exhibited strong long-term antibacterial properties and significantly improved the early adhesion of osteoblasts [15]. Zhang et al. prepared a nanoscale TiO2/Cu2O/CuO composite coating on Ti-Cu alloy using alkali heat treatment, which significantly enhanced antibacterial performance and effectively promoted the proliferation, mineralization and related gene expression of osteoblasts [16]. Tao et al. proved that the antibacterial rate of porous Ti-3Cu alloy against S. aureus and E. coli could reach 100% [17]. Lu et al. proved that the selective etching treatment significantly improved the antibacterial properties of Ti-3Cu alloy, and resulted in no cytotoxicity on MC3T3 cells, but it also had no effect on surface roughness [9].
Surface roughness is an important factor affecting the fusion ability of implant and bone. Rough surfaces can form a larger mechanical lock with the bone, promoting the contact and combination of the bone tissue and the implant surface, thus speeding up the recovery of the affected area. In clinical practice, it has been proved that rough surfaces can accelerate cell adhesion and enhance bone interface bonding strength. Ren et al. prepared a rough microstructure on a titanium surface using sandblasting and acid etching (SLA). Compared with the polished sample, the as-treated sample had higher cell proliferation rate, stronger alkaline phosphatase activity, and enhanced mineralization, which obviously improved the cell sensitivity and promoted cell differentiation [18]. Nedir et al. found that the rough surface after SLA was more favorable for osteoblast adhesion compared to the acid-etched surface [19]. Kaluderovic et al. performed SLA treatment on titanium and titanium zirconium (Ti-Zr) alloy surfaces, and the results showed that SLA treatment significantly promoted osteogenic differentiation, the formation of bone nodules, and cell mineralization, thus accelerating the process of bone fusion on both Ti and Ti-Zr samples [20].
On the other hand, the rough surface also accelerates bacterial adhesion and the formation of biofilm, which might ultimately lead to infection [21]. Therefore, it is necessary to modify the surface using a chemical reaction in order to resist the adhesion of bacteria. Anodic oxidation (AO) is a surface modification method commonly used to produce corrosion-resistant oxide layers or functional nanotubes on the surface. Selimin et al. prepared a porous oxide film on titanium by means of AO in acetic acid electrolyte, and found that the surface roughness increased with increasing oxidation voltage and oxidation current density, and the porous and rough surface provided more sites for the formation of hydroxyapatite [22]. Ou et al. prepared porous oxide films containing Ca and P on Ti-30Nb-1Fe-1Hf alloy by anodic oxidation and hydrothermal treatment, accelerating the cell adhesion rate on the surface [23]. Previous studies on the oxidation of Ti-Cu have proven than the formation of CuO/Cu can effectively kill bacteria that come into contact with the surface [14,15,16].
Based on the above considerations, the sandblasting acid etching method was used in this paper to produce a rough surface on Ti-Cu samples in order to accelerate the adhesion of the cell, and the anodic oxidation process was used to produce a CuO/Cu2O-containing film on the rough surface to provide resistance against the adhesion of bacteria. The results demonstrated that the as-treated Ti-3Cu alloy exhibited very strong long-term antibacterial properties and good cell cytocompatibility due to the formation of the rough TiO2/CuO/Cu2O surface. These research results suggest that the roughening and anodic oxidation process might be a candidate for the surface modification of Ti-Cu samples for biomedical applications.

2. Experimental

2.1. Surface Modification

Samples with dimensions of ɸ15 mm × 2 mm were sliced from Ti-3 wt% Cu bar, and successively polished with 80#, 400#, 800# and 1200# SiC abrasive paper (Shenzhen Nanos Precision Machinery Technology, Shenzhen, China). After ultrasonic cleaning with acetone (Tianjin Fuyu Fine Chemicals, Tianjin, China), ultrapure water and absolute ethanol (Tianjin Fuyu Fine Chemicals, China), the samples were vacuum treated at a temperature of 900 °C for 5 h and quenched in water, referred to as the T4 sample. Then, the samples were vacuum heated at 600 °C for 24 h, denoted the T6 sample. After this, Ti-3Cu(T6) samples were sandblasted with 120-mesh Al2O3 at a pressure of 0.4 MPa for 3–5 min (LZBP-VⅠ, Wuhan Golden Light Medical Technology, Wuhan, China), then etched using a mixed acid solution of HCl, H2SO4 and H2O with a volume ratio of 1:1:20 (Sinopharm Chemical Reagent, Shenyang, China) at 60 °C for 15 min to obtain micron/submicron pores and remove the residual Al2O3 particles, referred to as Ti-Cu-S. The samples were then anodically oxidized in 0.1 mol/L phosphoric acid (Sinopharm Chemical Reagent, Shenyang, China) at a voltage of 60 V for 10 min at room temperature, denoted as Ti-Cu-SA.

2.2. Surface Characterization

2.2.1. Surface Physical and Chemical Properties

The surface microstructure was observed using scanning electron microscopy (SEM) with energy dispersive spectroscopy (EDS, ULTRA PLUS, Zeiss group, Oberkochen, Germany) at an acceleration voltage of 15–20 kV, and the morphology of the bacteria was observed at 10 kV. The cross-sectional microstructure was analyzed by line-scanning. The chemical state of the Ti and Cu elements was detected using X-ray photoelectron spectroscopy (XPS, Thermo Scientific Escalab 250Xi, Thermo Fisher, Waltham, MA, USA). Phase identification of the samples was performed via X-ray diffraction (XRD, Smart Lab, Rigaku, Japan).

2.2.2. Surface Roughness and Hydrophilicity

The three-dimensional topography of the samples was observed using a confocal laser scanning microscope (OLS4100, Olympus, Tokyo, Japan), and the roughness was tested by LEXT (SRa). The contact angle of the surface water was used to evaluate the hydrophilicity of the samples. Water contact angle was measured using dynamic and static contact goniometers (SL200B, KONO, Seattle, WA, USA). The hanging drop method and the circle fitting method were adopted to test the water contact angle.

2.3. Electrochemical Test and Cu Ion Release

The corrosion resistance of the sample was determined using a VersaSTAT V3-400 workstation (Ametek, Philadelphia, PA, USA). A three-electrode system was adopted in which the sample was fixed in the mold and a copper wire was connected with the working electrode, the platinum electrode was used as the counter electrode, the calomel electrode was used as the reference electrode, and the simulated body fluid (SBF: NaCl: 8 g/L; KCL: 0.4 g/L; NaHCO3: 0.35 g/L; CaCl2: 0.14 g/L; MgSO4: 0.2 g/L; Na2HPO4: 0.12 g/L; KH2PO4: 0.06 g/L) was used as the electrolyte.
The Cu release of the samples was measured using an extraction method in accordance with GB/T16886.12-2005. The extract solution was prepared in normal saline at 37 °C at an extract ratio of 1.25 cm2/mL. The Cu2+ concentration was determined using inductively coupled plasma spectrometry (ICP, Optima 5300 DV, Perkin Elmer, Waltham, MA, USA).

2.4. Antibacterial Properties

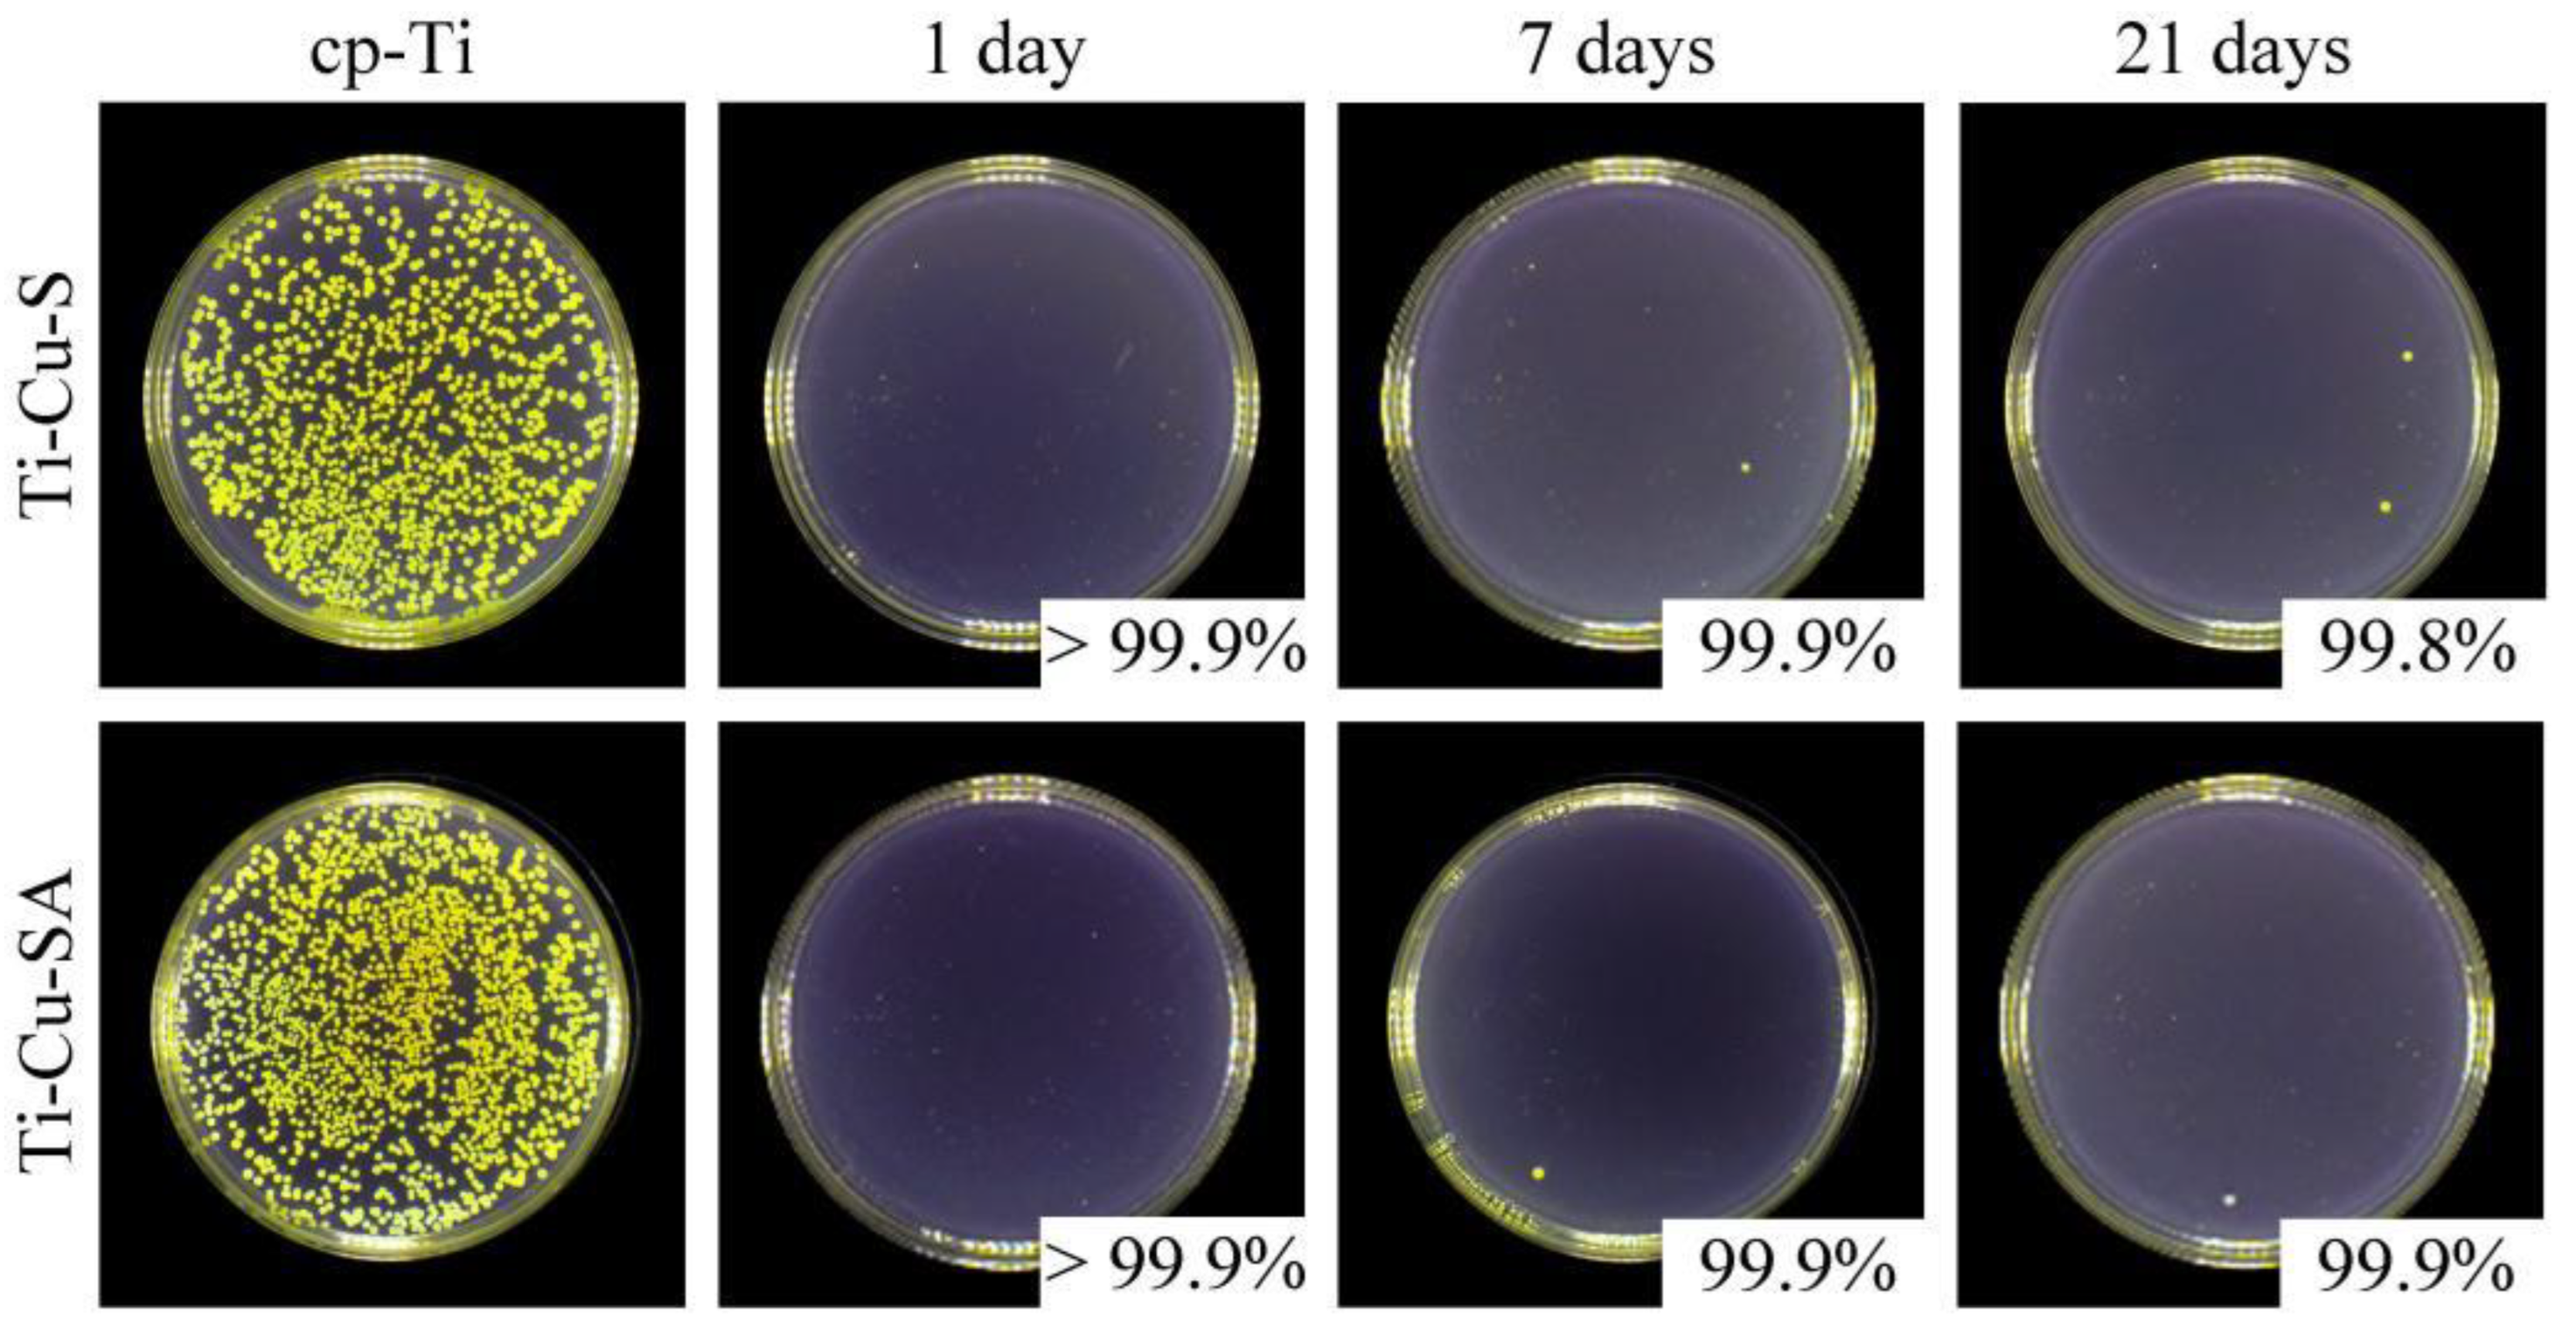
2.4.1. Antibacterial Rate

Staphylococcus aureus (S. aureus, ATCC6538) was used to test the antibacterial properties of the samples. The test was carried out according to GB/T 21510 (equivalent to ISO 22196-2011), commercial pure titanium (cp-Ti) was chosen as the negative control group, and the surface-modified samples were used as the experimental groups. At least three samples were prepared in parallel for each group.
After sterilization, the samples were placed in a 12-well plate with one well per sample; then, 80 μL of bacterial suspension (104 cfu/mL) was seeded on the surface of each sample. The bacteria were incubated with the samples at 37 °C in 90% relative humidity for 24 h. Then, the sample was thoroughly rinsed with 2 mL saline solution, and then 100 μL of the rinse solution was evenly spread on a solid nutrient agar plate and incubated for 24 h. The antibacterial rate was obtained using the following formula:
a n t i b a c t e r i a l r a t e ( R , % ) = ( N c o n t r o l N e x p e r i m e n t ) / N c o n t r o l × 100 %
where Ncontrol and Nexperiment represent the average colony numbers on cp-Ti and the samples, respectively. An antibacterial rate (R) ≥ 90% is regarded as possessing antibacterial effect, while R ≥ 99% can be regarded as possessing a strong antibacterial effect.

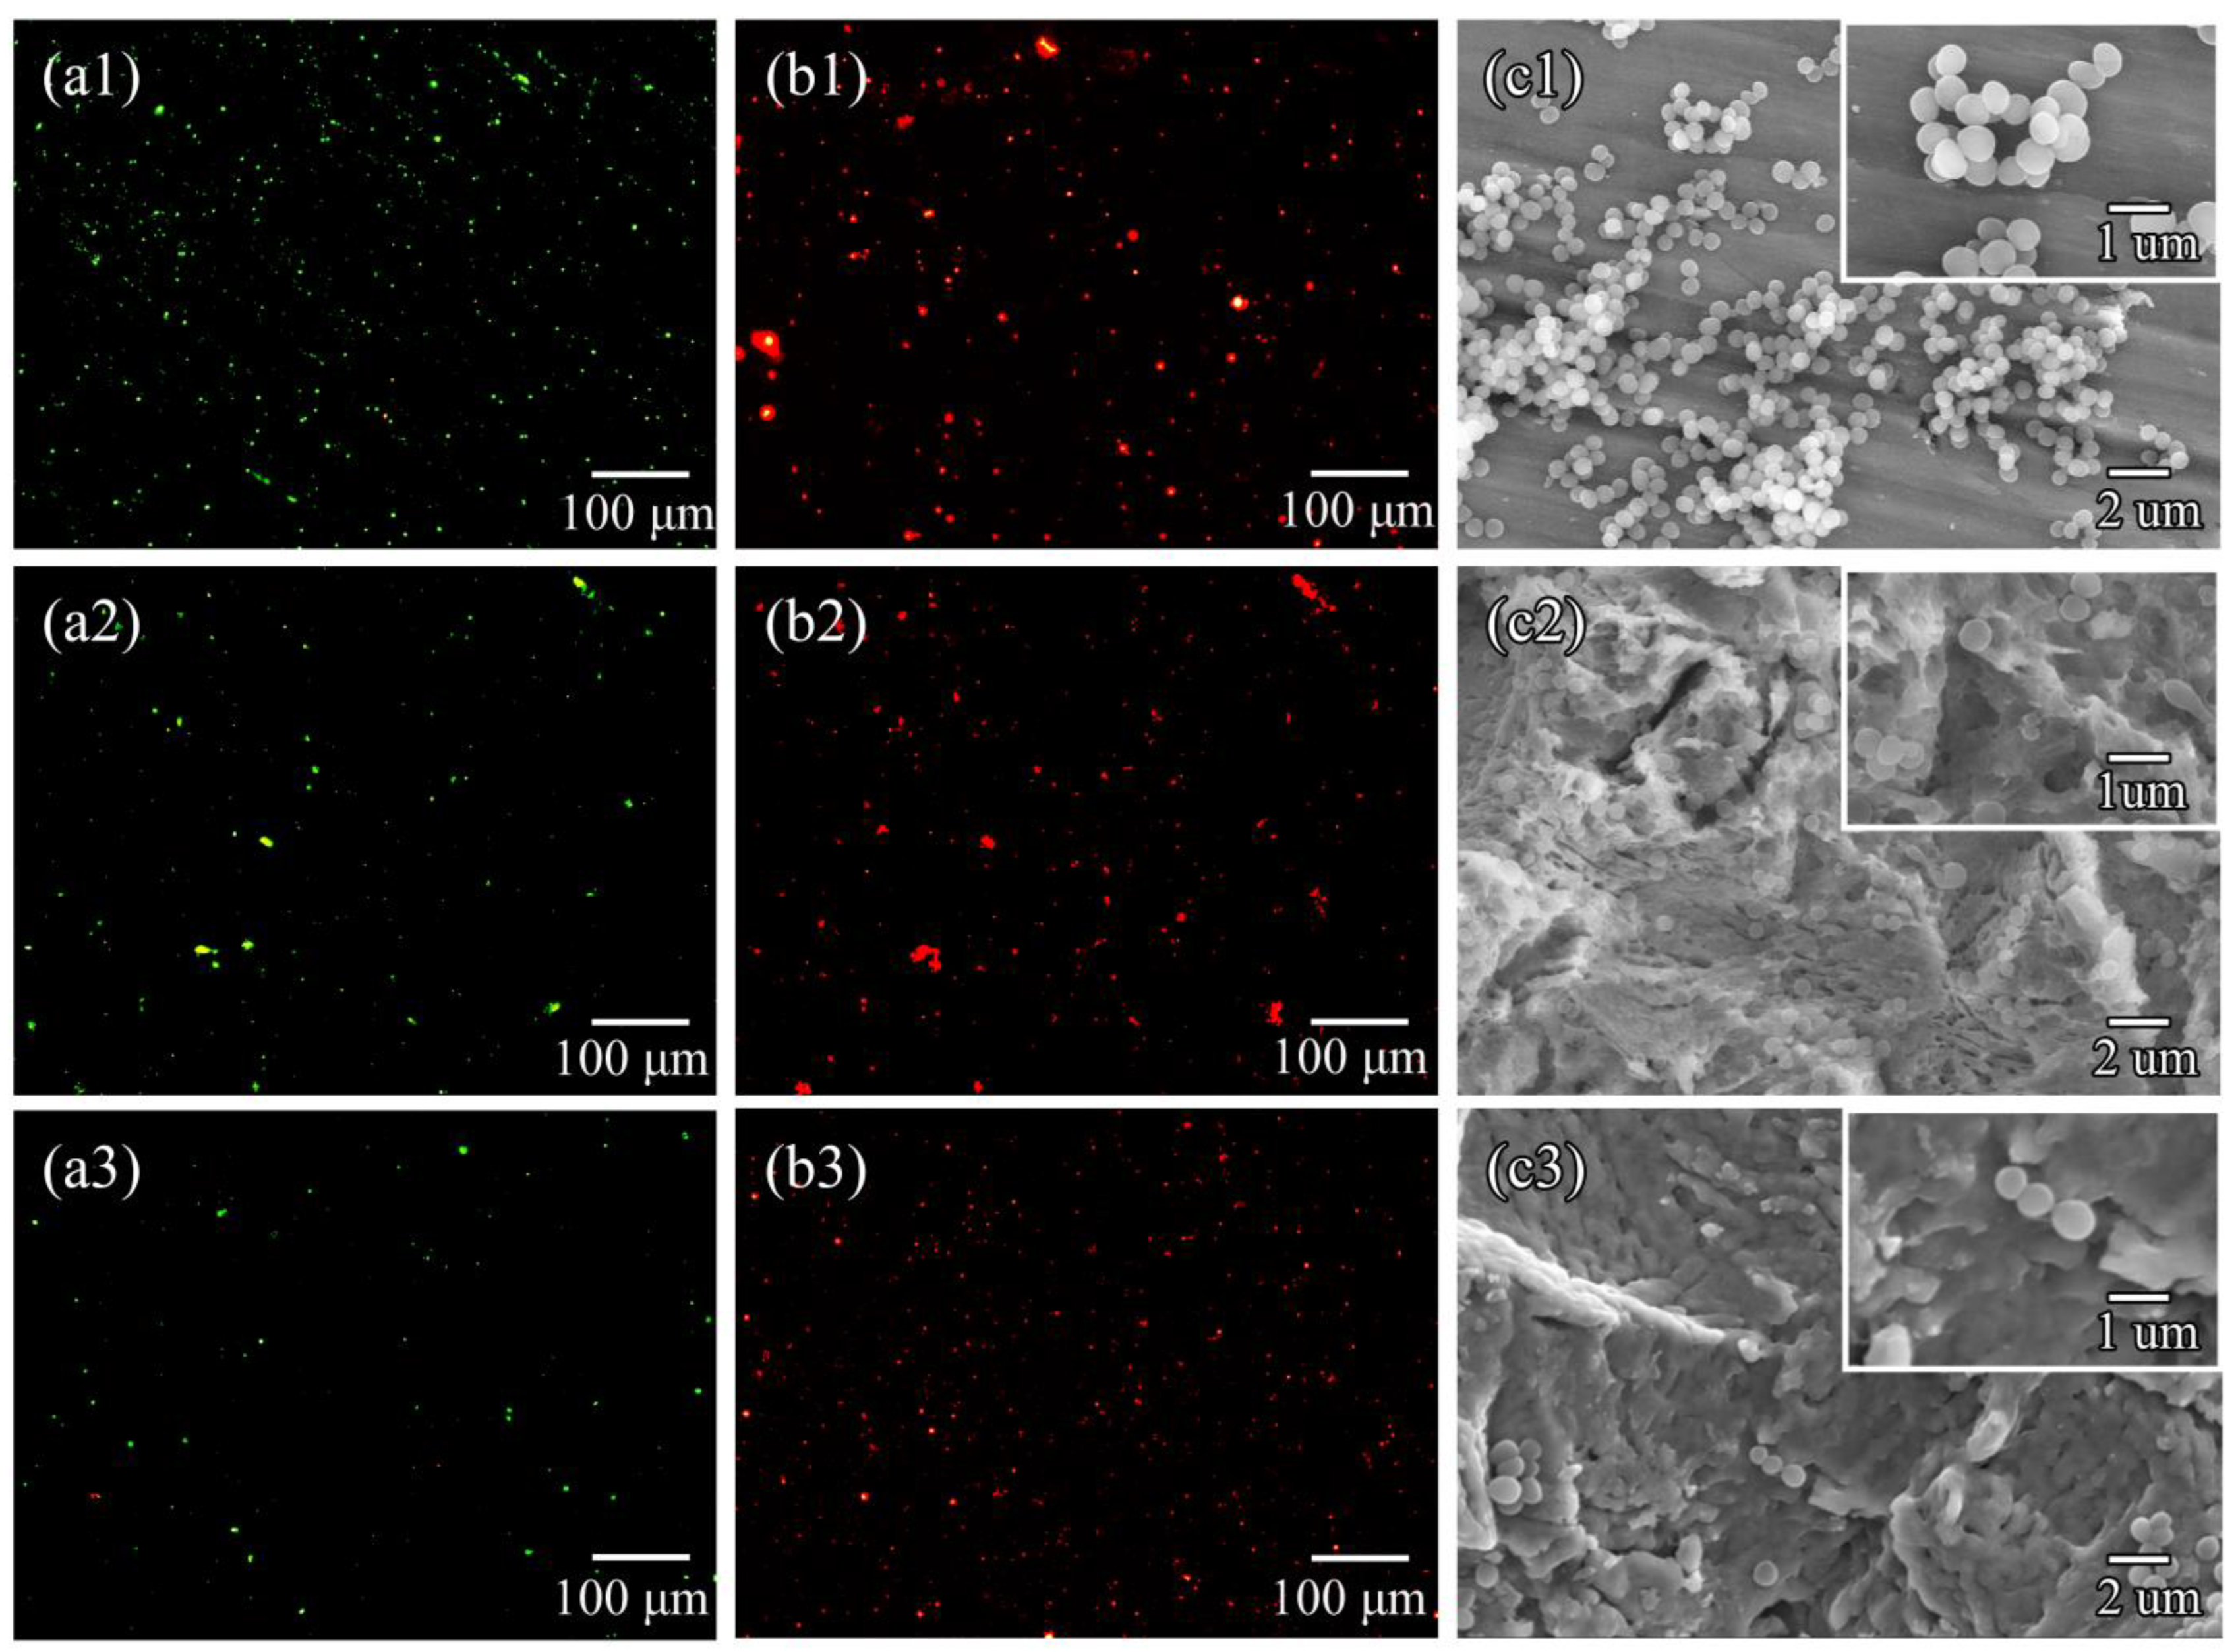
2.4.2. Live/Dead Staining

The Live/Dead BacLightTM kit (Thermo Fisher, Waltham, MA, USA) was adopted to stain the bacteria. After 24 h incubation, the samples with bacteria were stained in darkness for 15 min and observed using a fluorescence microscope (BX51, Olympus, Dongjing, Japan). The living bacteria appeared green, while the dead bacteria appeared red.

2.4.3. Bacteria Morphology

After 24 h incubation, the bacteria were fixed with 2.5% glutaraldehyde solution (Sinopharm Chemical Reagent, Shenyang, China) at 4 °C for at least 2 h. Then, the bacteria were dehydrated using ethanol with volume fractions of 30%, 50%, 75%, 90%, 95% and 100% in succession. Prior to observation, the surface was fully dried in air and sprayed with gold.

2.5. Cell Compatibility

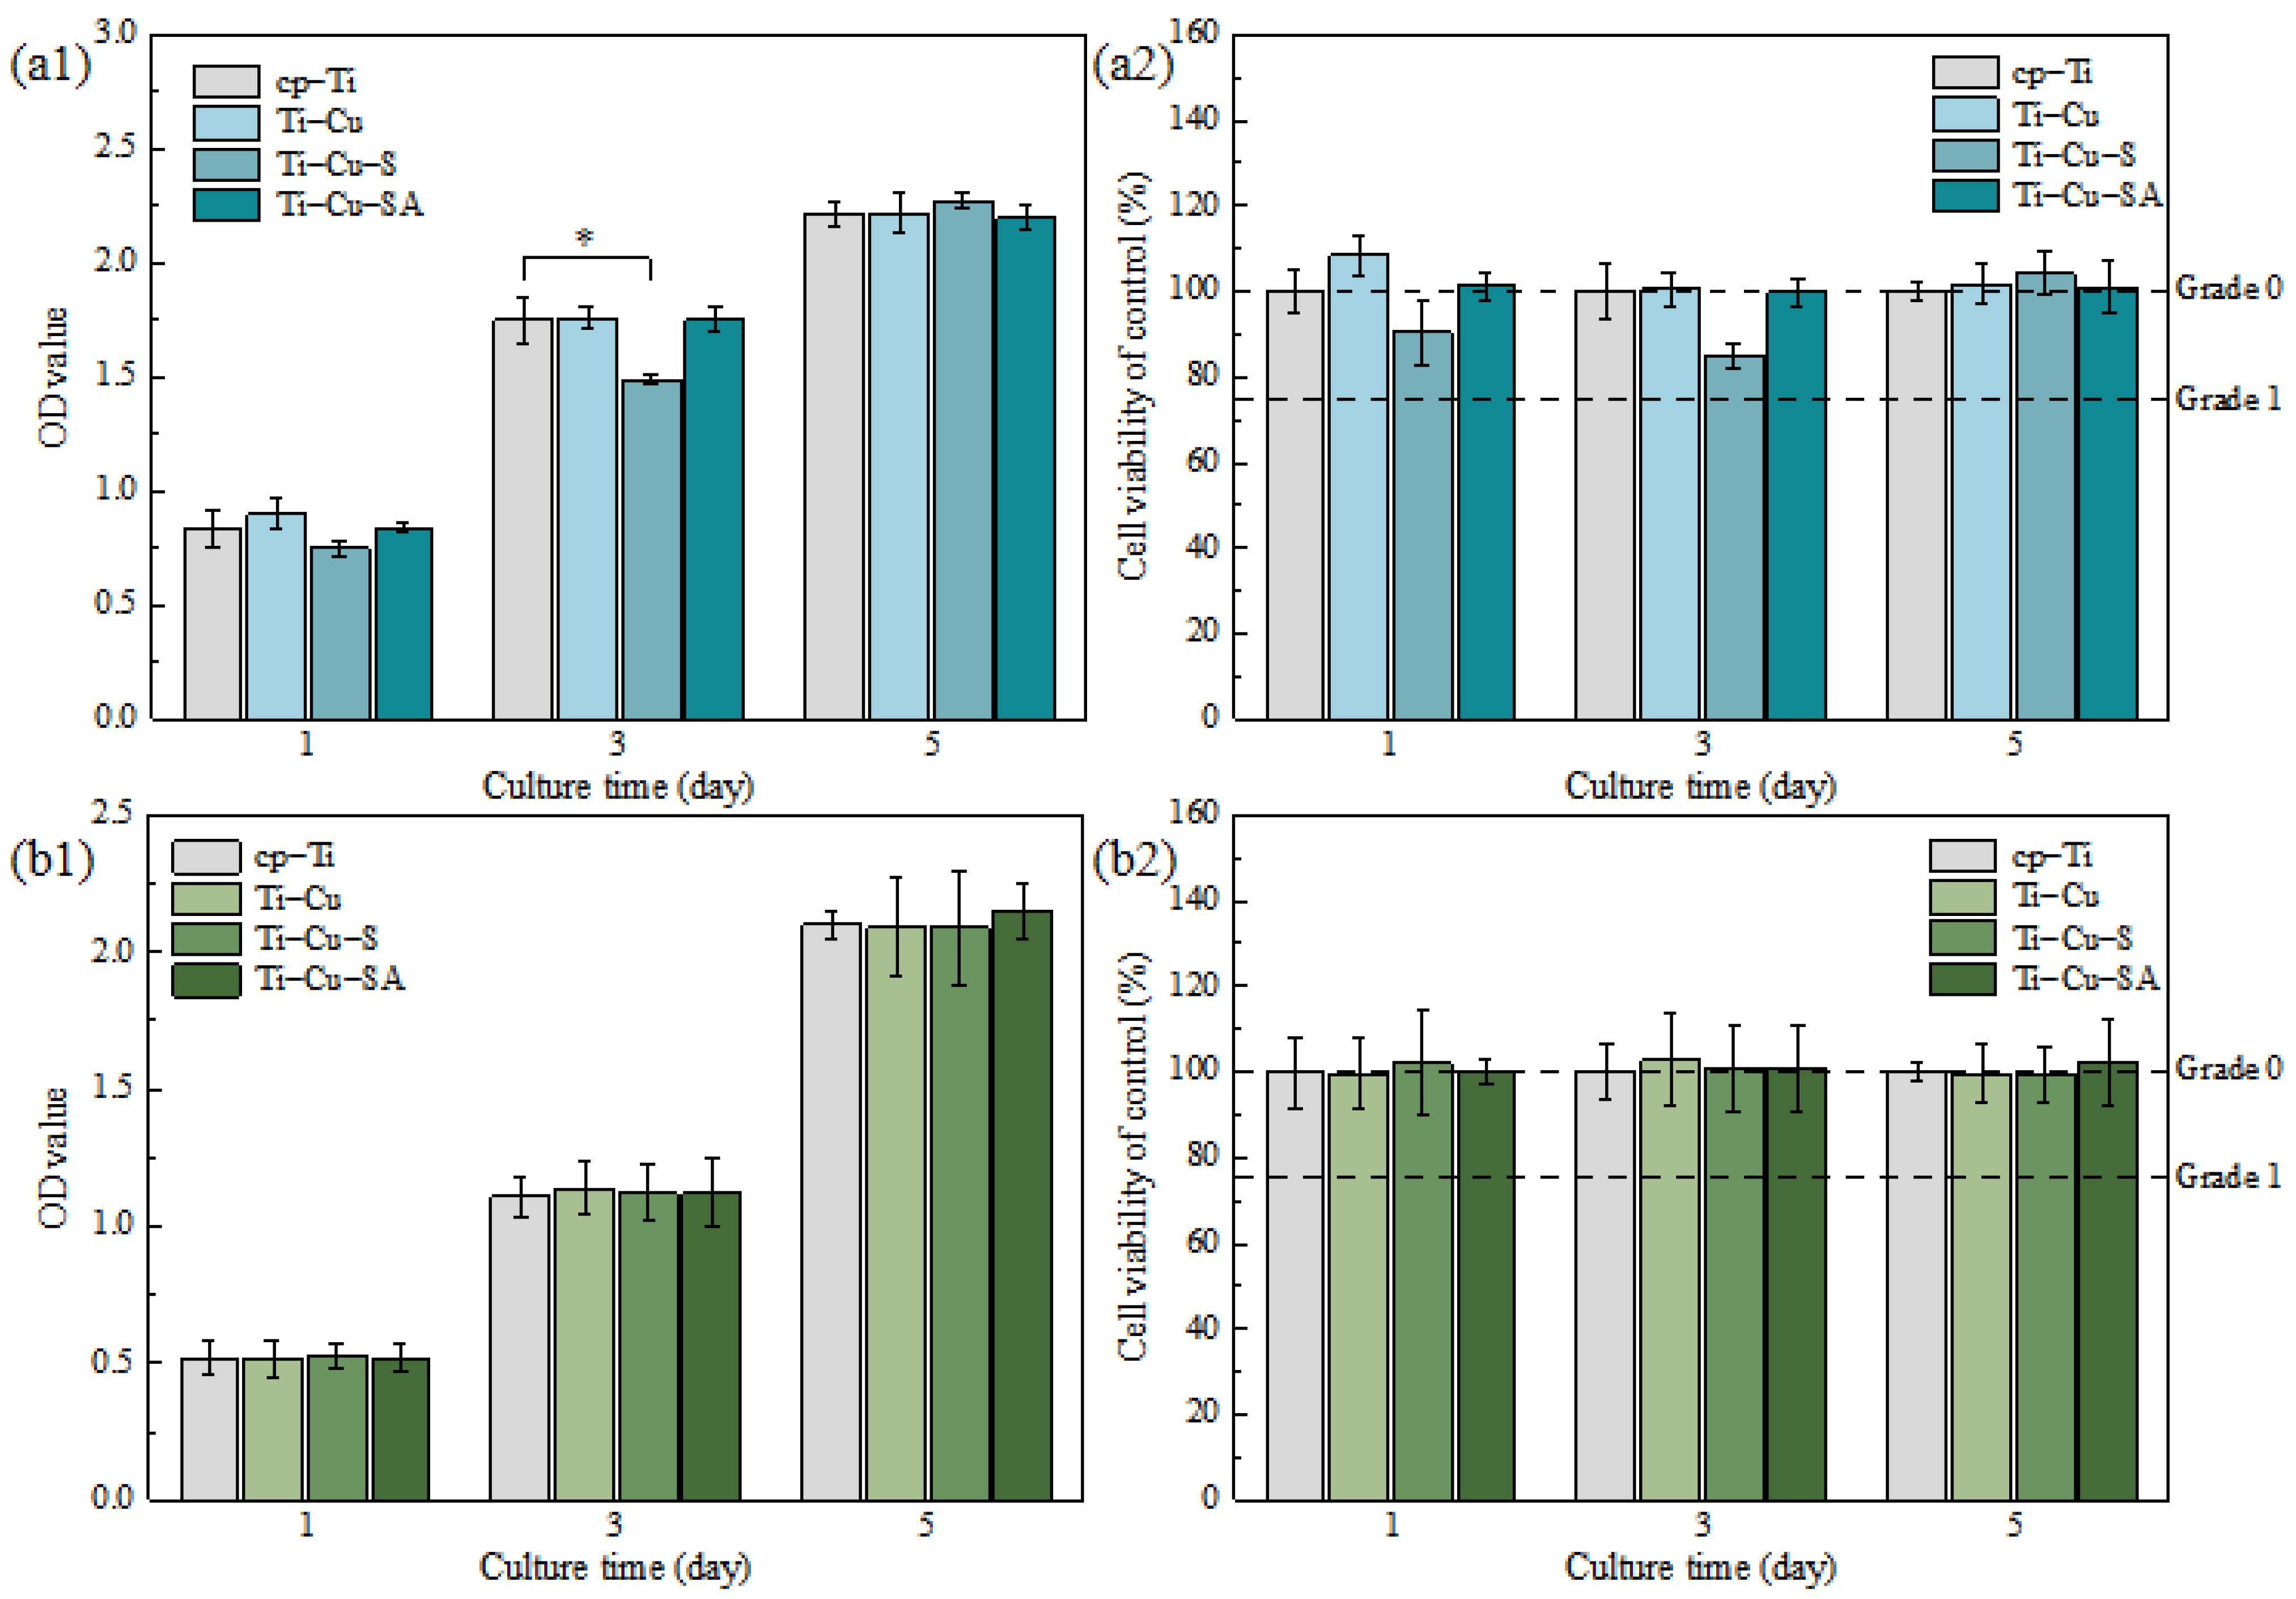
2.5.1. Extract Toxicity

MC3T3-E1 cells (provided by Shanghai Institutes of Biological Science, Shanghai, China) and cell counting kit-8 (cck-8, Shanghai Biyuntian Co., Ltd., Shanghai, China) were used to measure the cytotoxicity of the samples. An extract toxicity test was performed to evaluate the toxicity of the released ions. In the experiment, cp-Ti was selected as the control group, and surface-modified samples were used as the experimental groups. The extract was prepared in medium consisting of MEM Alpha Modification (α-MEM, Thermo Fisher, Waltham, MA, USA), 10% fetal bovine serum (FBS, Thermo Fisher, Waltham, MA, USA) and 1% penicillin (Thermo Fisher, Waltham, MA, USA) at a temperature of 37 °C and an extract ratio of 1.25 cm2/mL, in accordance with GB/T16886.12-2005. After sterilization, 100 μL cell suspension with 3 × 10³ cells was incubated in each well of a 96-well plate in an incubator at 37 °C with 5% CO2 for 1 h. Then, the culture medium was replaced with the extract. After 1, 3 and 5 days of incubation, 10% cck-8 was added to each well, and the optical density (OD) value was determined using a microplate reader (Bio-rad, imark, Bio-Rad, Hercules, CA, USA) at 450 nm. The relative growth rate (RGR) was calculated using the following formula, and the cytotoxicity of the materials was evaluated:
r e l a t i v e g r o w t h r a t e ( R G R , % ) = ( O D e x p e r i m e n t O D b l a n k ) / ( O D c o n t r o l O D b l a n k ) × 100 %
where ODexperiment, ODblank and ODcontrol are the OD values of the experimental group, the blank, and the control group (cp-Ti), respectively. A relative growth rate (RGR) ≥ 75% was considered to be non-cytotoxic, while RGR (%) in the range of 75–100% was considered to be Grade 1, and RGR (%) ≥ 100% was considered to be Grade 0.

2.5.2. Direct Contact Toxicity

A direct contact toxicity test was also performed to evaluate the comprehensive toxicity of the samples, including the surface morphology as well as the released ions. After sterilization, the samples were placed into a 24-well plate and 500 μL of cell suspension with 1.5 × 10⁴ cells was added into each well. After 1, 3 and 5 days, 10% cck-8 was added into each well, and the OD value was measured. Then, the RGR was calculated, and the cytotoxicity of the materials was evaluated as described above.

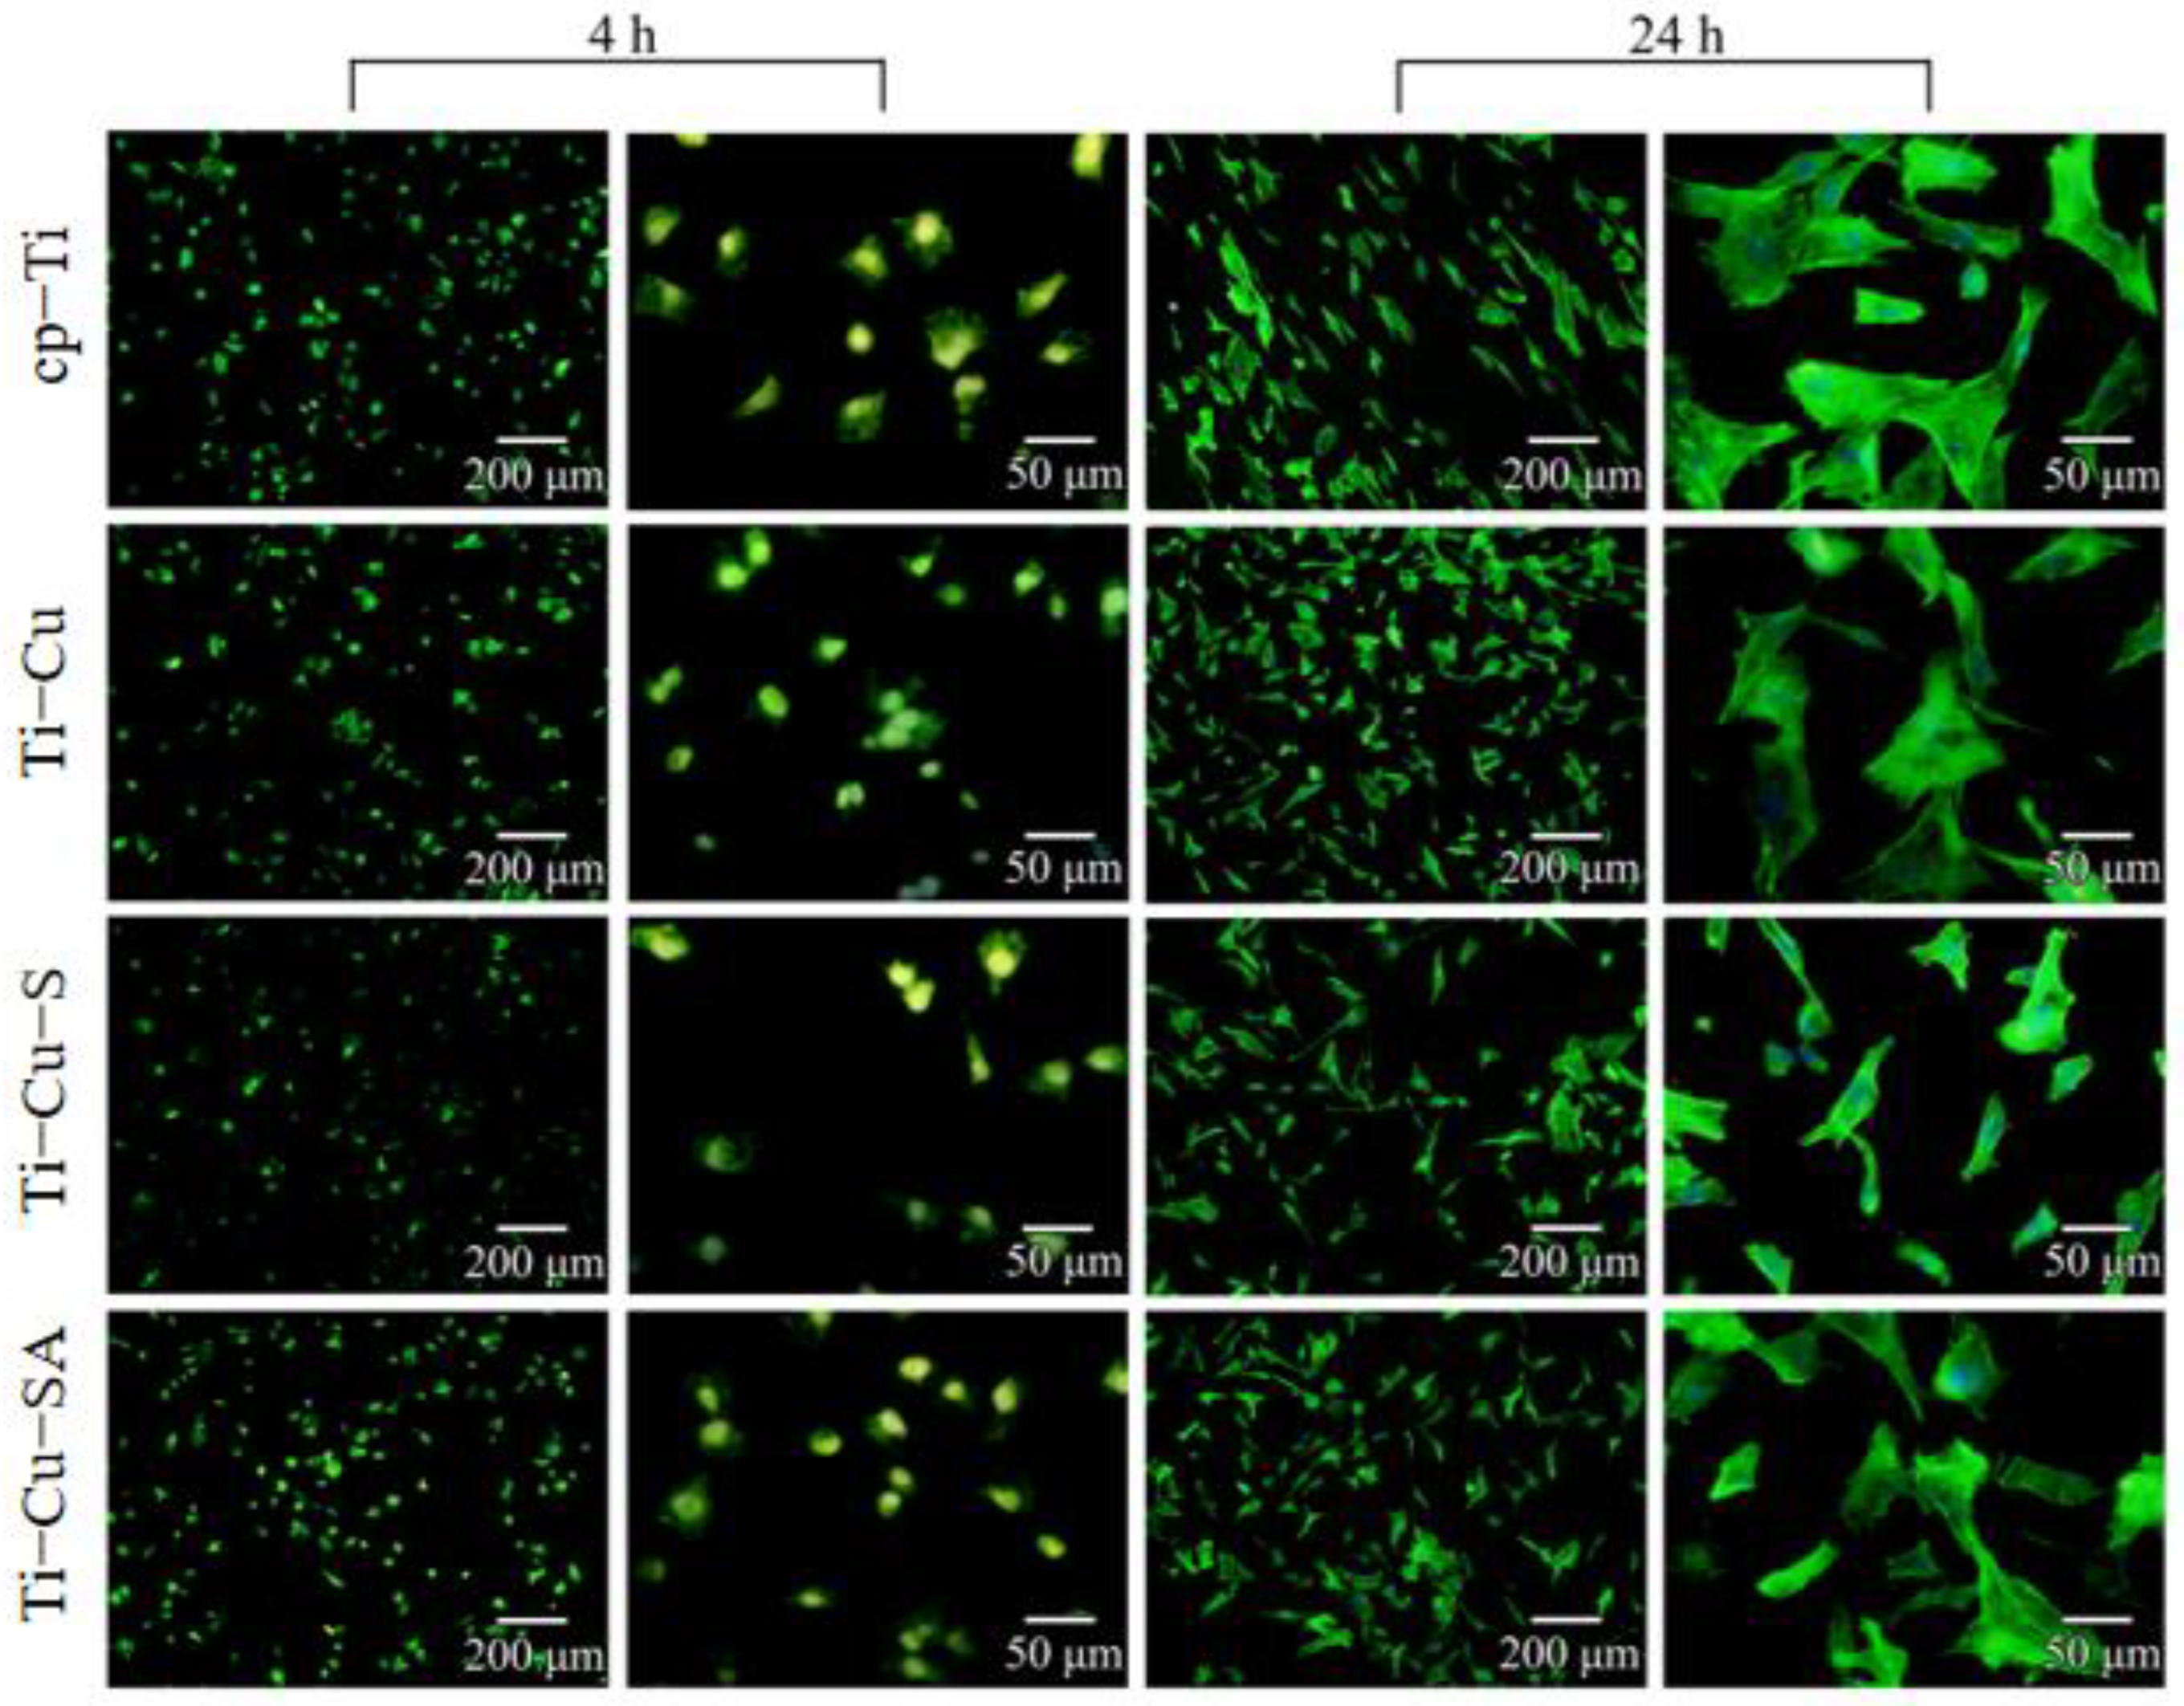
2.5.3. Cytoskeleton Staining

After 4 h and 24 h incubation, the samples were rinsed with phosphate buffer saline (PBS, Thermo Fisher, Waltham, MA, USA). Then, 4% paraformaldehyde (PFA, Ranjek Technology Co., Ltd., Beijing, China) and 0.5% Triton x-100 were used to fix the cells and eliminate cell permeability. Actin-Tracker Green (Shanghai Biyuntian Co., Ltd., Shanghai, China) and DAPI (Shanghai Biyuntian Co., Ltd., Shanghai, China) were then used to stain the cytoplasm with green and the nucleus with blue. The cytoskeleton was observed using a fluorescence microscope (Olympus BX51, Tokyo, Japan).

2.6. Statistical Analysis

The data were acquired at least three times, and the results are presented as mean ± standard deviation. p < 0.05 was considered to be statistically significant.

3. Results

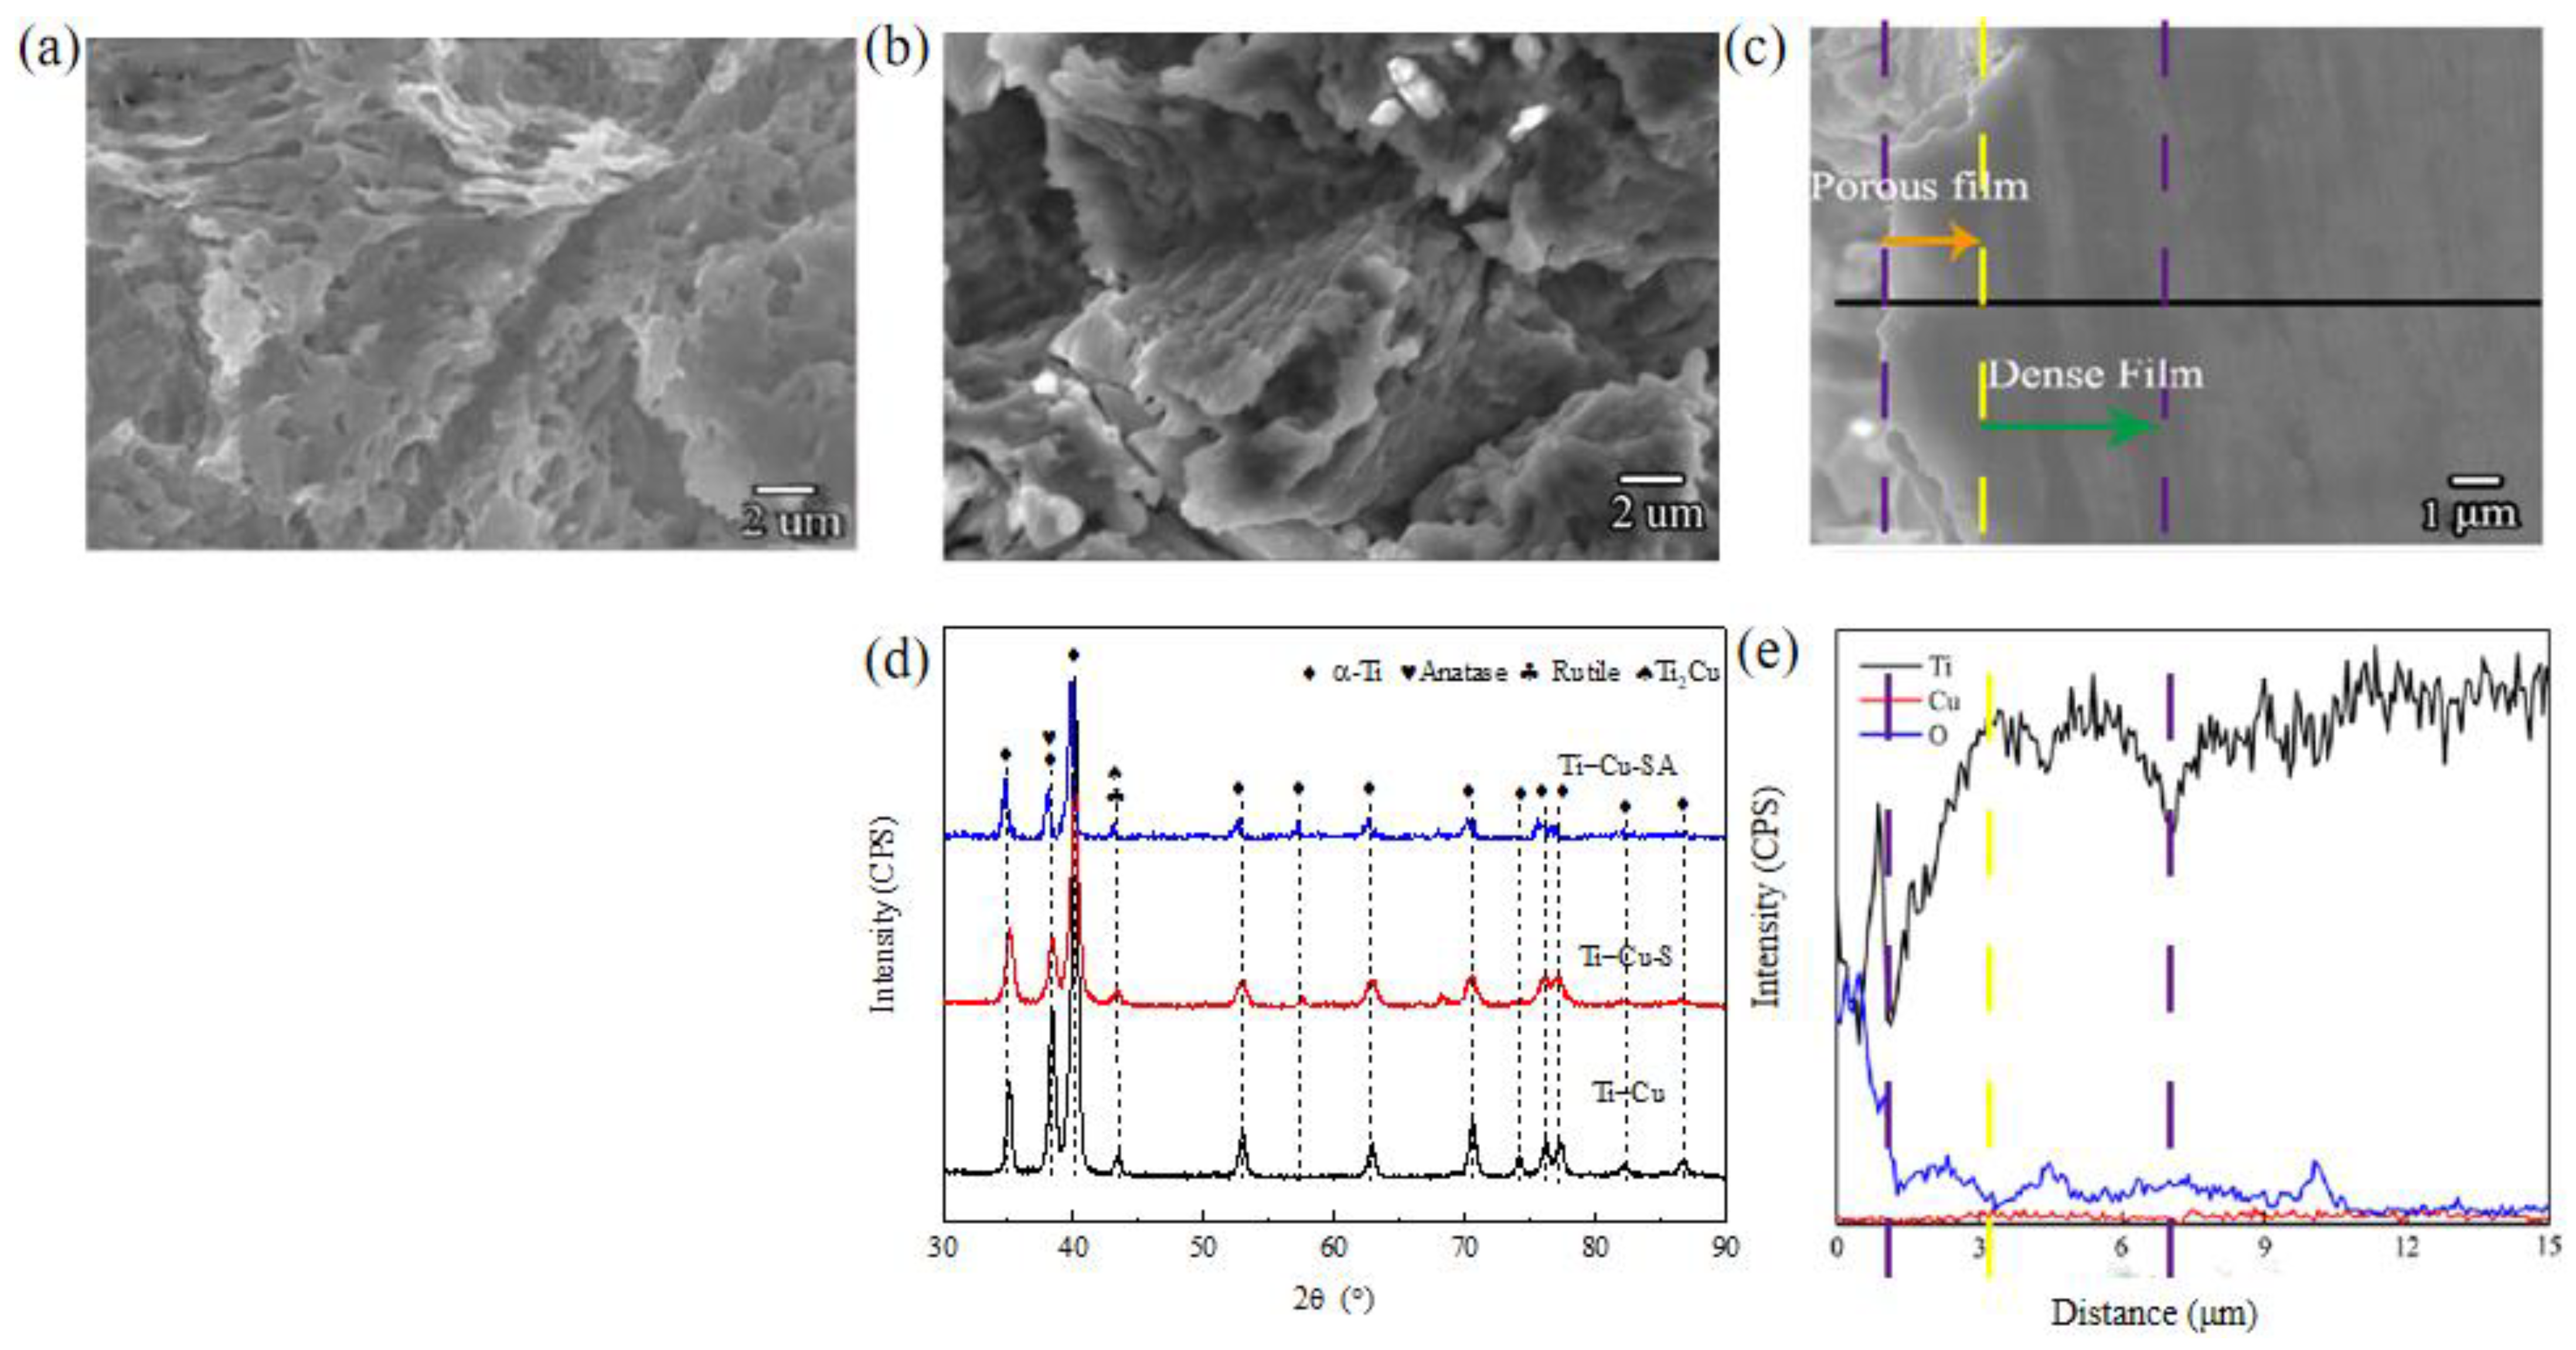
3.1. Microstructure and Surface Characterization

Figure 1a shows the surface topography of the Ti-3Cu samples. After the roughening process, a porous surface with sharp edge and a large number of small holes was formed on the surface, and the surface of the holes was very smooth. After anodic oxidation, as shown in Figure 1b, a similar surface morphology was observed, but the edge became round and the sharp edges disappeared. The cross-section microstructure of the Ti-Cu-SA sample is shown in Figure 1c,e. A double-layer film composed of an outer porous layer and an inner dense layer was formed on the surface. From the SEM image, it can be seen that there was no obvious difference between the two, but from the line scanning results (Figure 1e), it can be seen that the Ti content gradually increased and the O content gradually decreased in the porous layer, the porous layer had a thickness of about 2 μm and the dense layer had a thickness of about 3–4 μm. The introduction of a large amount of O as a result of anodic oxidation significantly reduced the Cu content in the film.
XRD patterns of the samples are shown in Figure 1d. A large amount of α-Ti phase and Ti2Cu phase were detected in the Ti-Cu sample. Following the roughening process and the anodic oxidation, a large amount of α-Ti could still be detected on the samples, indicating that Ti was still the main phase on the surface. There was a coincidence peak between α-Ti and anatase type TiO2 at about 38°, and a coincidence peak between Ti2Cu and rutile TiO2 at about 44°. It was difficult to determine the presence of TiO2 on the basis of XRD patterns. On the other hand, the oxide film might be too thin to be detected by XRD.

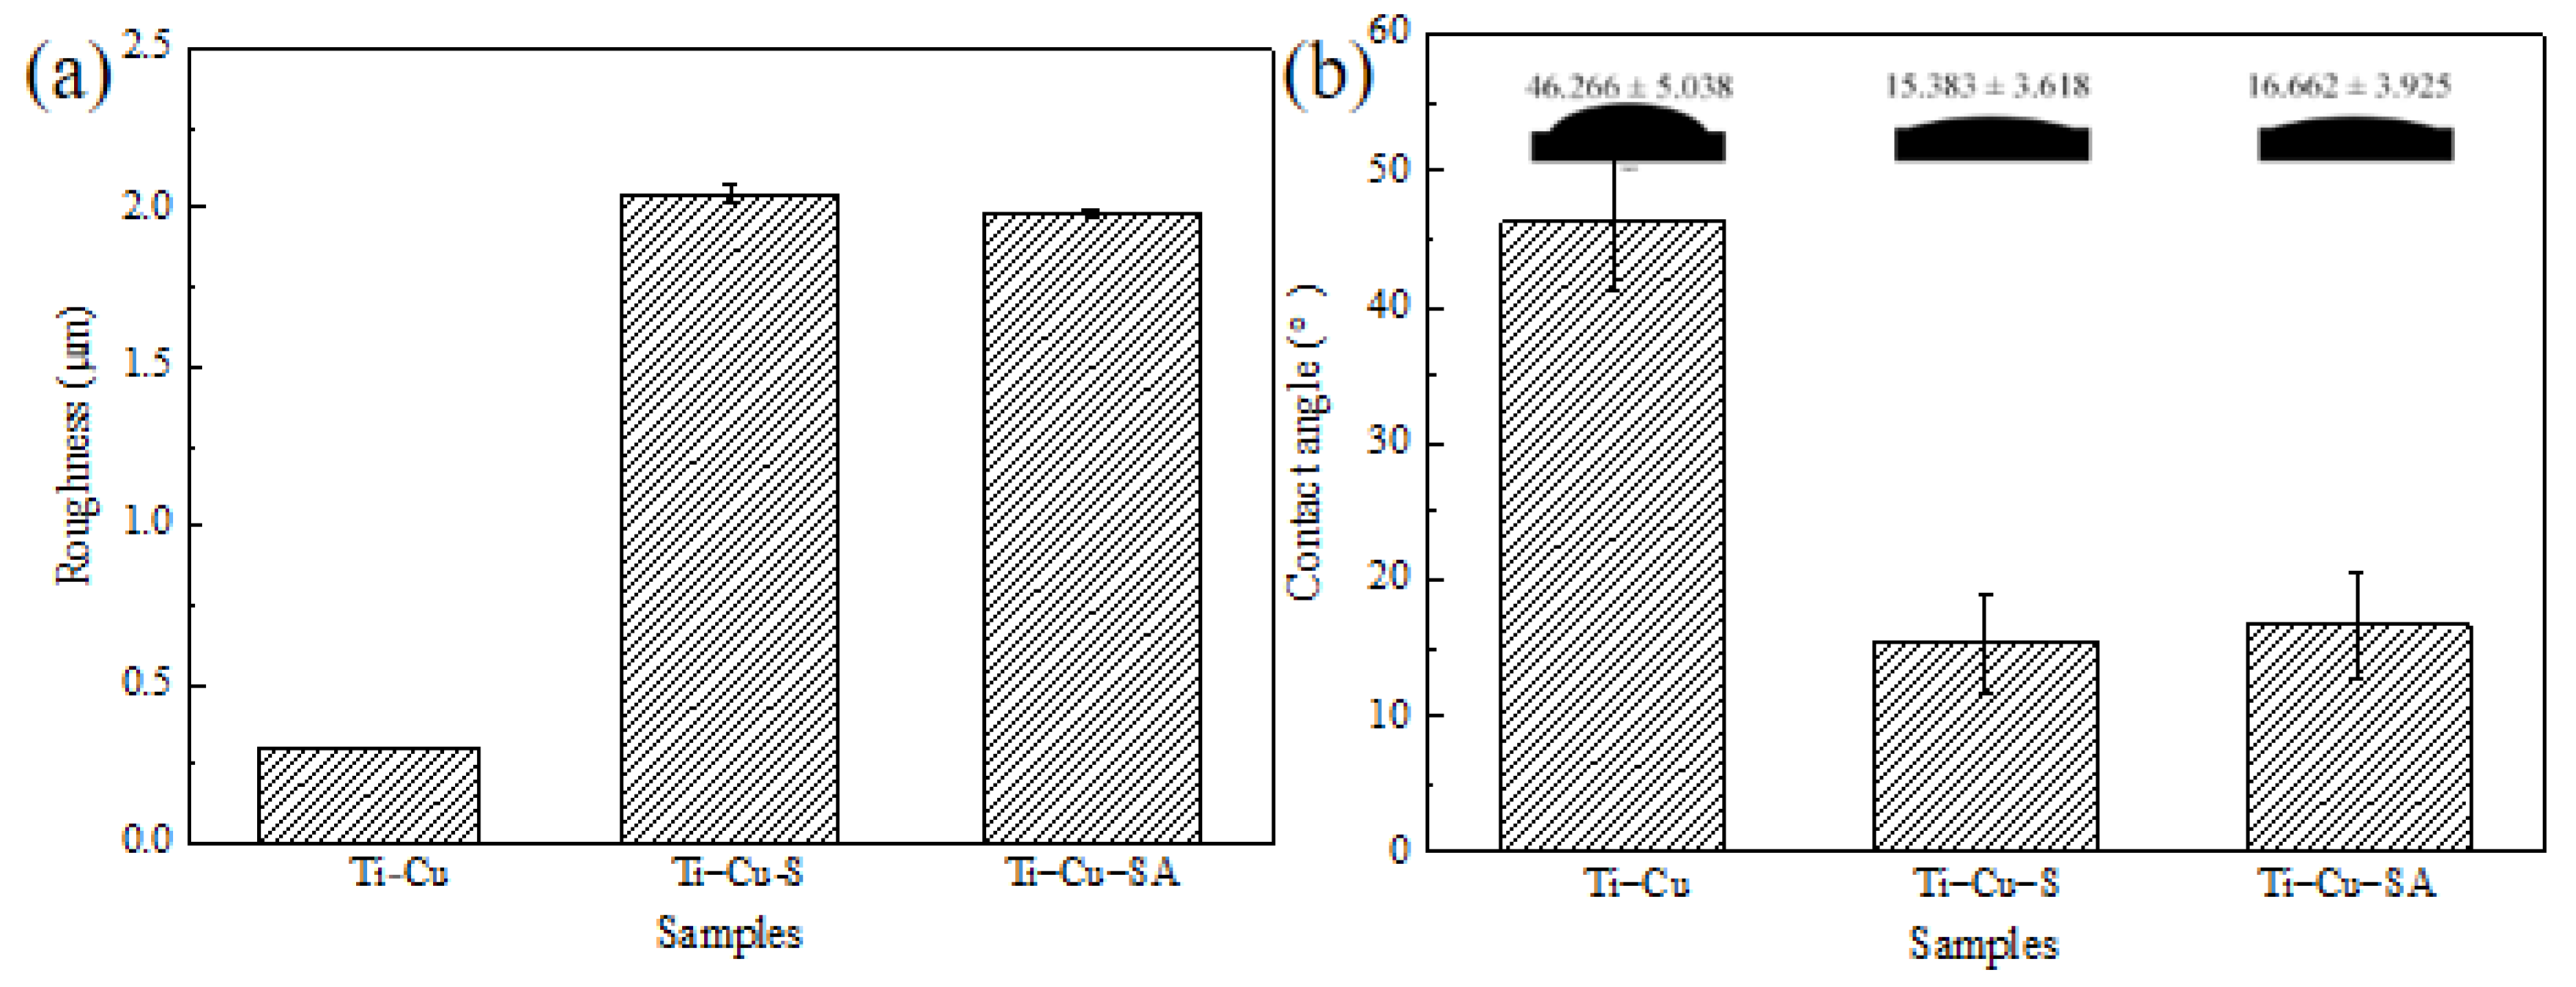
3.2. Hydrophilicity and Roughness

The water contact angle and the roughness of the samples are shown in Figure 2. Before the treatment, the roughness was about 0.25 μm. The sandblasting and acid etching process significantly increased the roughness to 2.0 μm, and the anodic oxidation did not change the roughness anymore, indicating that the surface treatment significantly roughened the sample surface. It can also be seen that sandblasting and acid etching dramatically decreased the water contact angle of the Ti-Cu sample from 46° to 15°, and anodic oxidation did not change the water contact angle anymore, indicating that the hydrophilicity of the sample was improved by the roughening process and anodic oxidation.

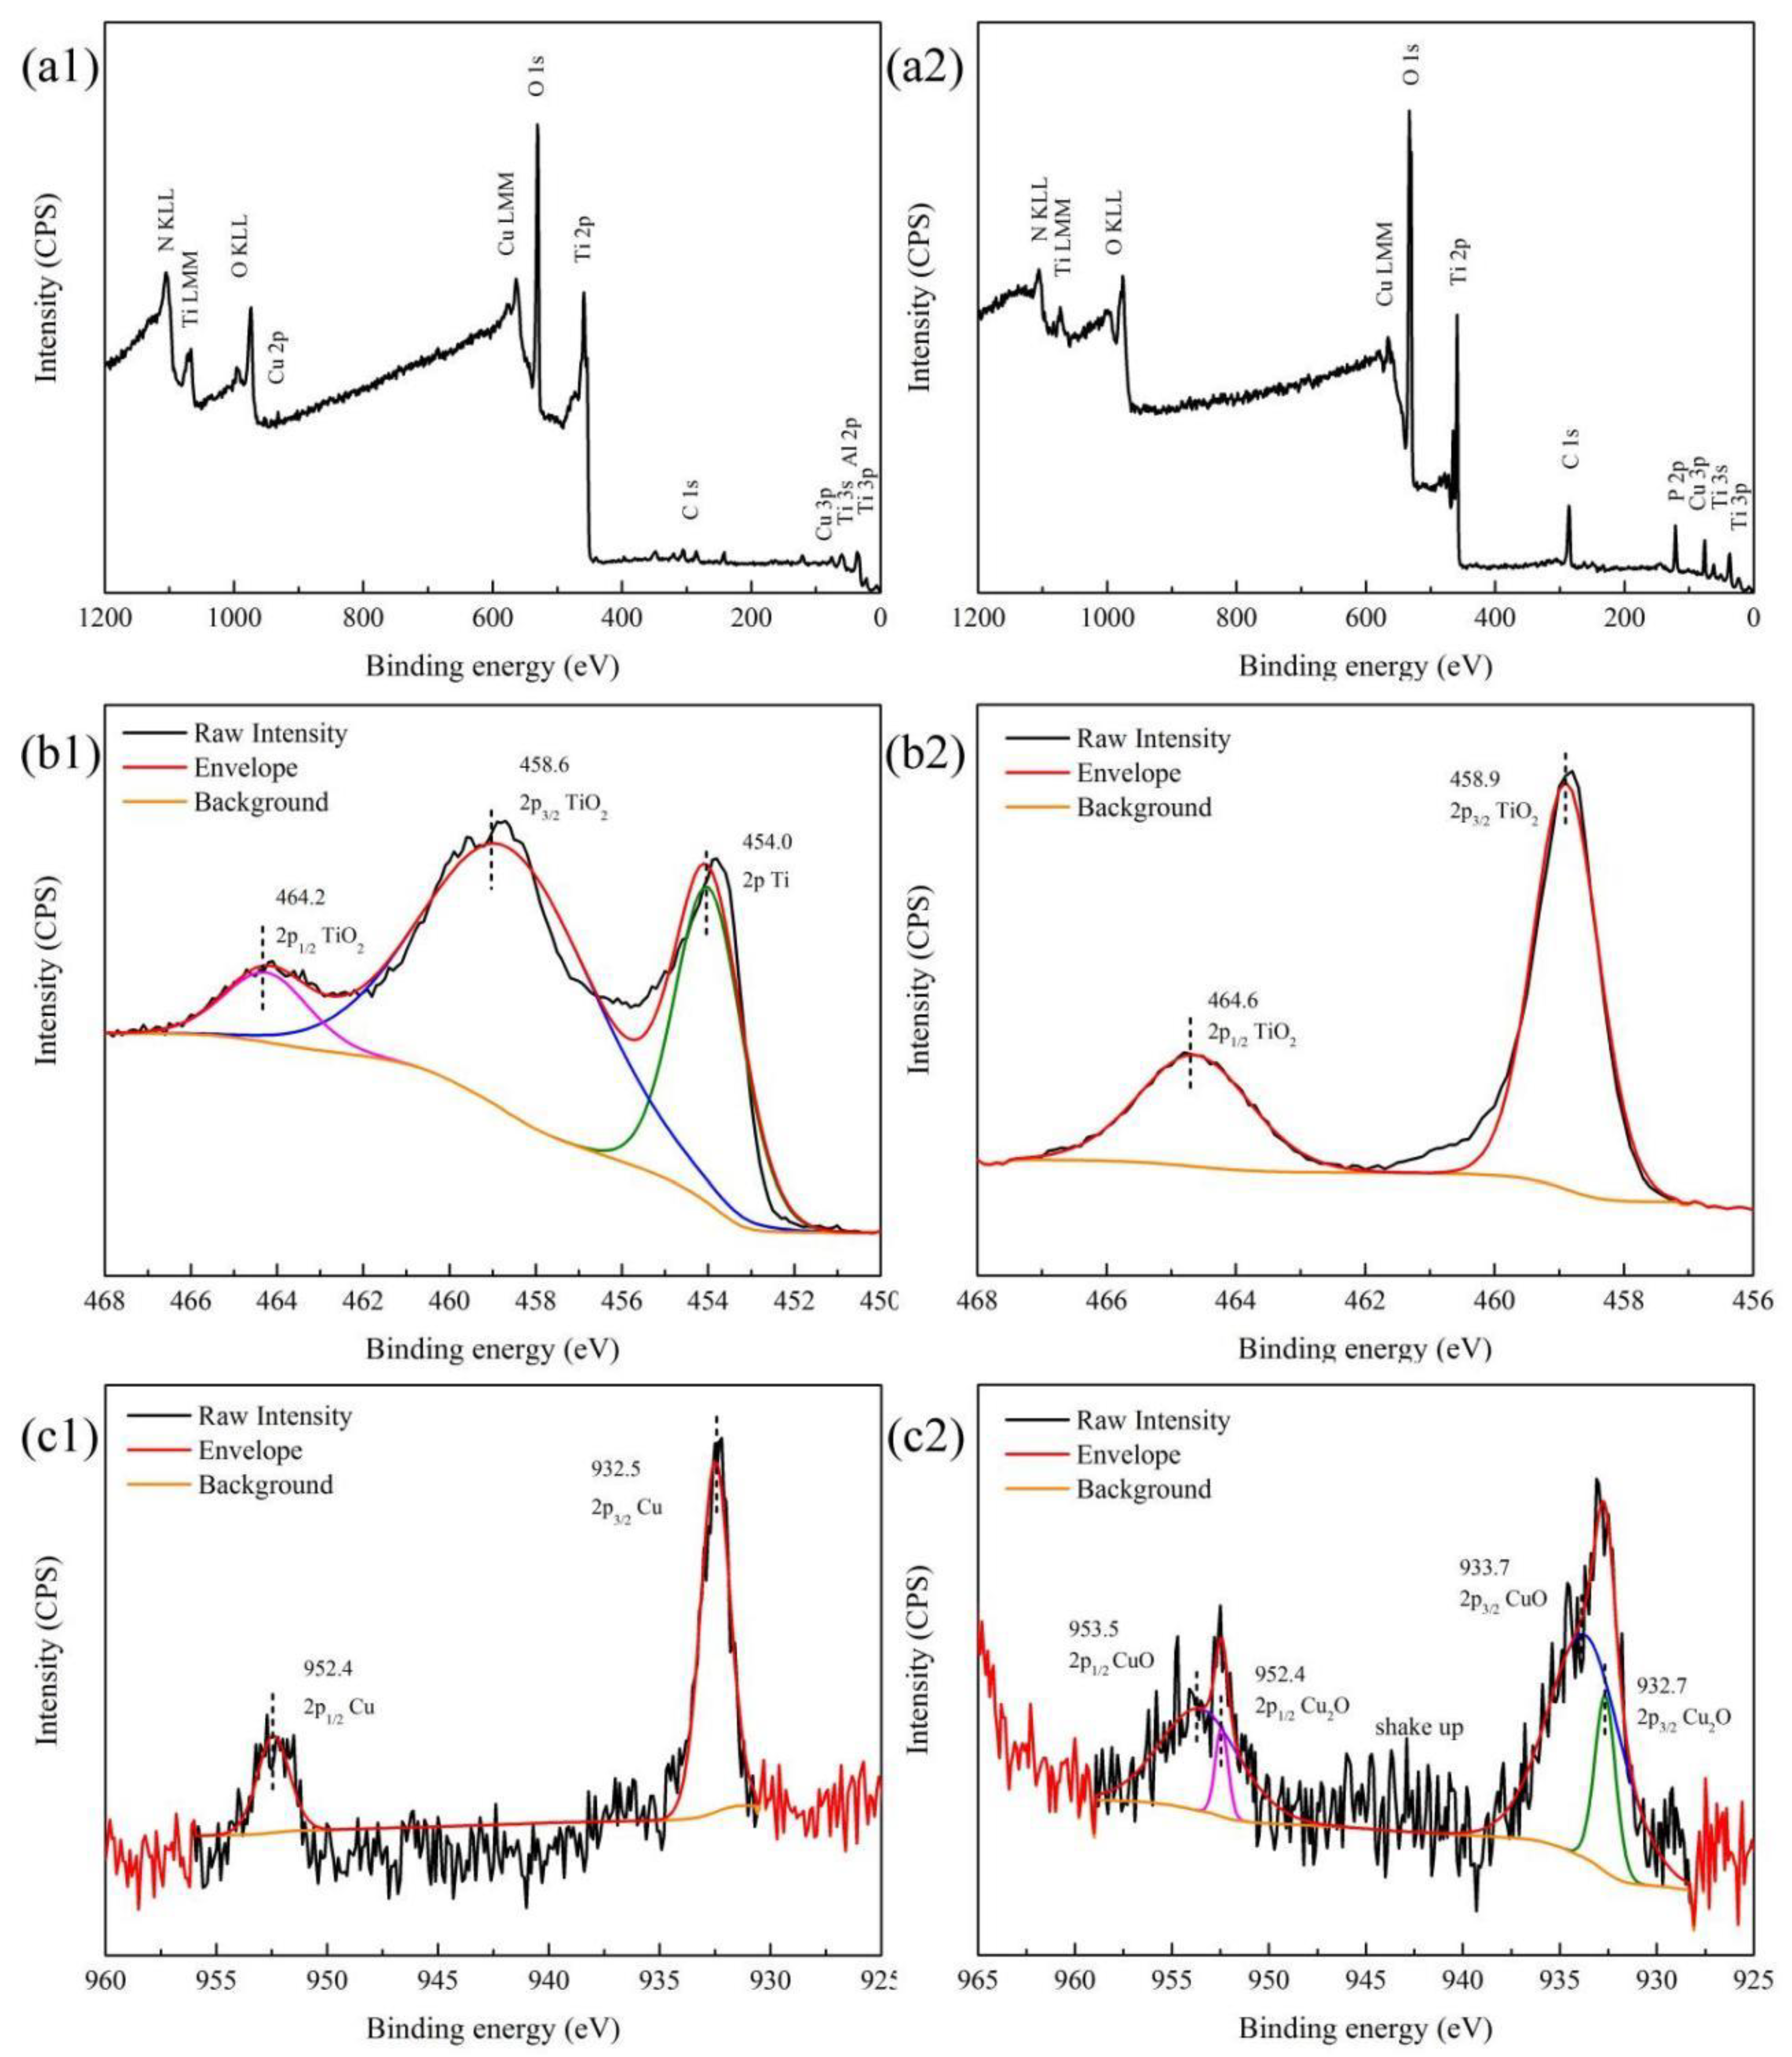
3.3. Chemical Composition

As shown in Figure 3, XPS analysis was performed on Ti-Cu-S and Ti-Cu-SA samples. It can be seen from the full spectrum in Figure 3a1 that Ti, Cu, O, Al, C and N elements were present on the Ti-Cu-S surface, among which the Al element came from the residual sand particles, and the C and N elements were from the surface adsorption. In the full spectrum in Figure 3a2, there were elements of Ti, Cu, O, P, C and N on the Ti-Cu-SA sample, among which P element was introduced by electrolyte.
Figure 3b1 shows the high-resolution spectrum of Ti on Ti-Cu-S. It can be seen that there were three peaks of Ti at the positions 464.2eV, 458.6eV and 454.0eV. The first two peaks represent Ti4+ 2p1/2 and Ti4+ 2p3/2, respectively, and the third one represents Ti0. This indicates that after the surface process, part of the Ti on the sample surface was present in the form of TiO2, and the other part was present in the form of Ti. In Figure 3b2, there were two peaks of Ti at 464.6eV and 458.9eV, corresponding to Ti4+ 2p1/2 and Ti4+ 2p3/2, indicating that Ti on the surface existed mainly in the form of TiO2.
Figure 3c1 shows the high-resolution spectrum of Cu on Ti-Cu-S. A Cu1+ 2p1/2 peak at 952.4 eV and a Cu1+ 2p2/3 peak at 932.5 eV, corresponding to the Cu-O bond in Cu2O, and a Cu2+ 2p3/2 peak at 933.7 eV and a Cu2+ 2p1/2 peak at 953.5 eV, corresponding to the Cu-O bond in CuO [24], were observed, while the shake-up satellites at 934 eV confirmed the presence of the Cu2+ oxidation state [25]. In the Cu high-resolution spectrum on the Ti-Cu-SA sample in Figure 3c2, the intensity of the Cu spectrum was very low, indicating that the content of the Cu element was very low. The coexistence of +1 and +2 valence Cu confirmed the presence of Cu2O and CuO.

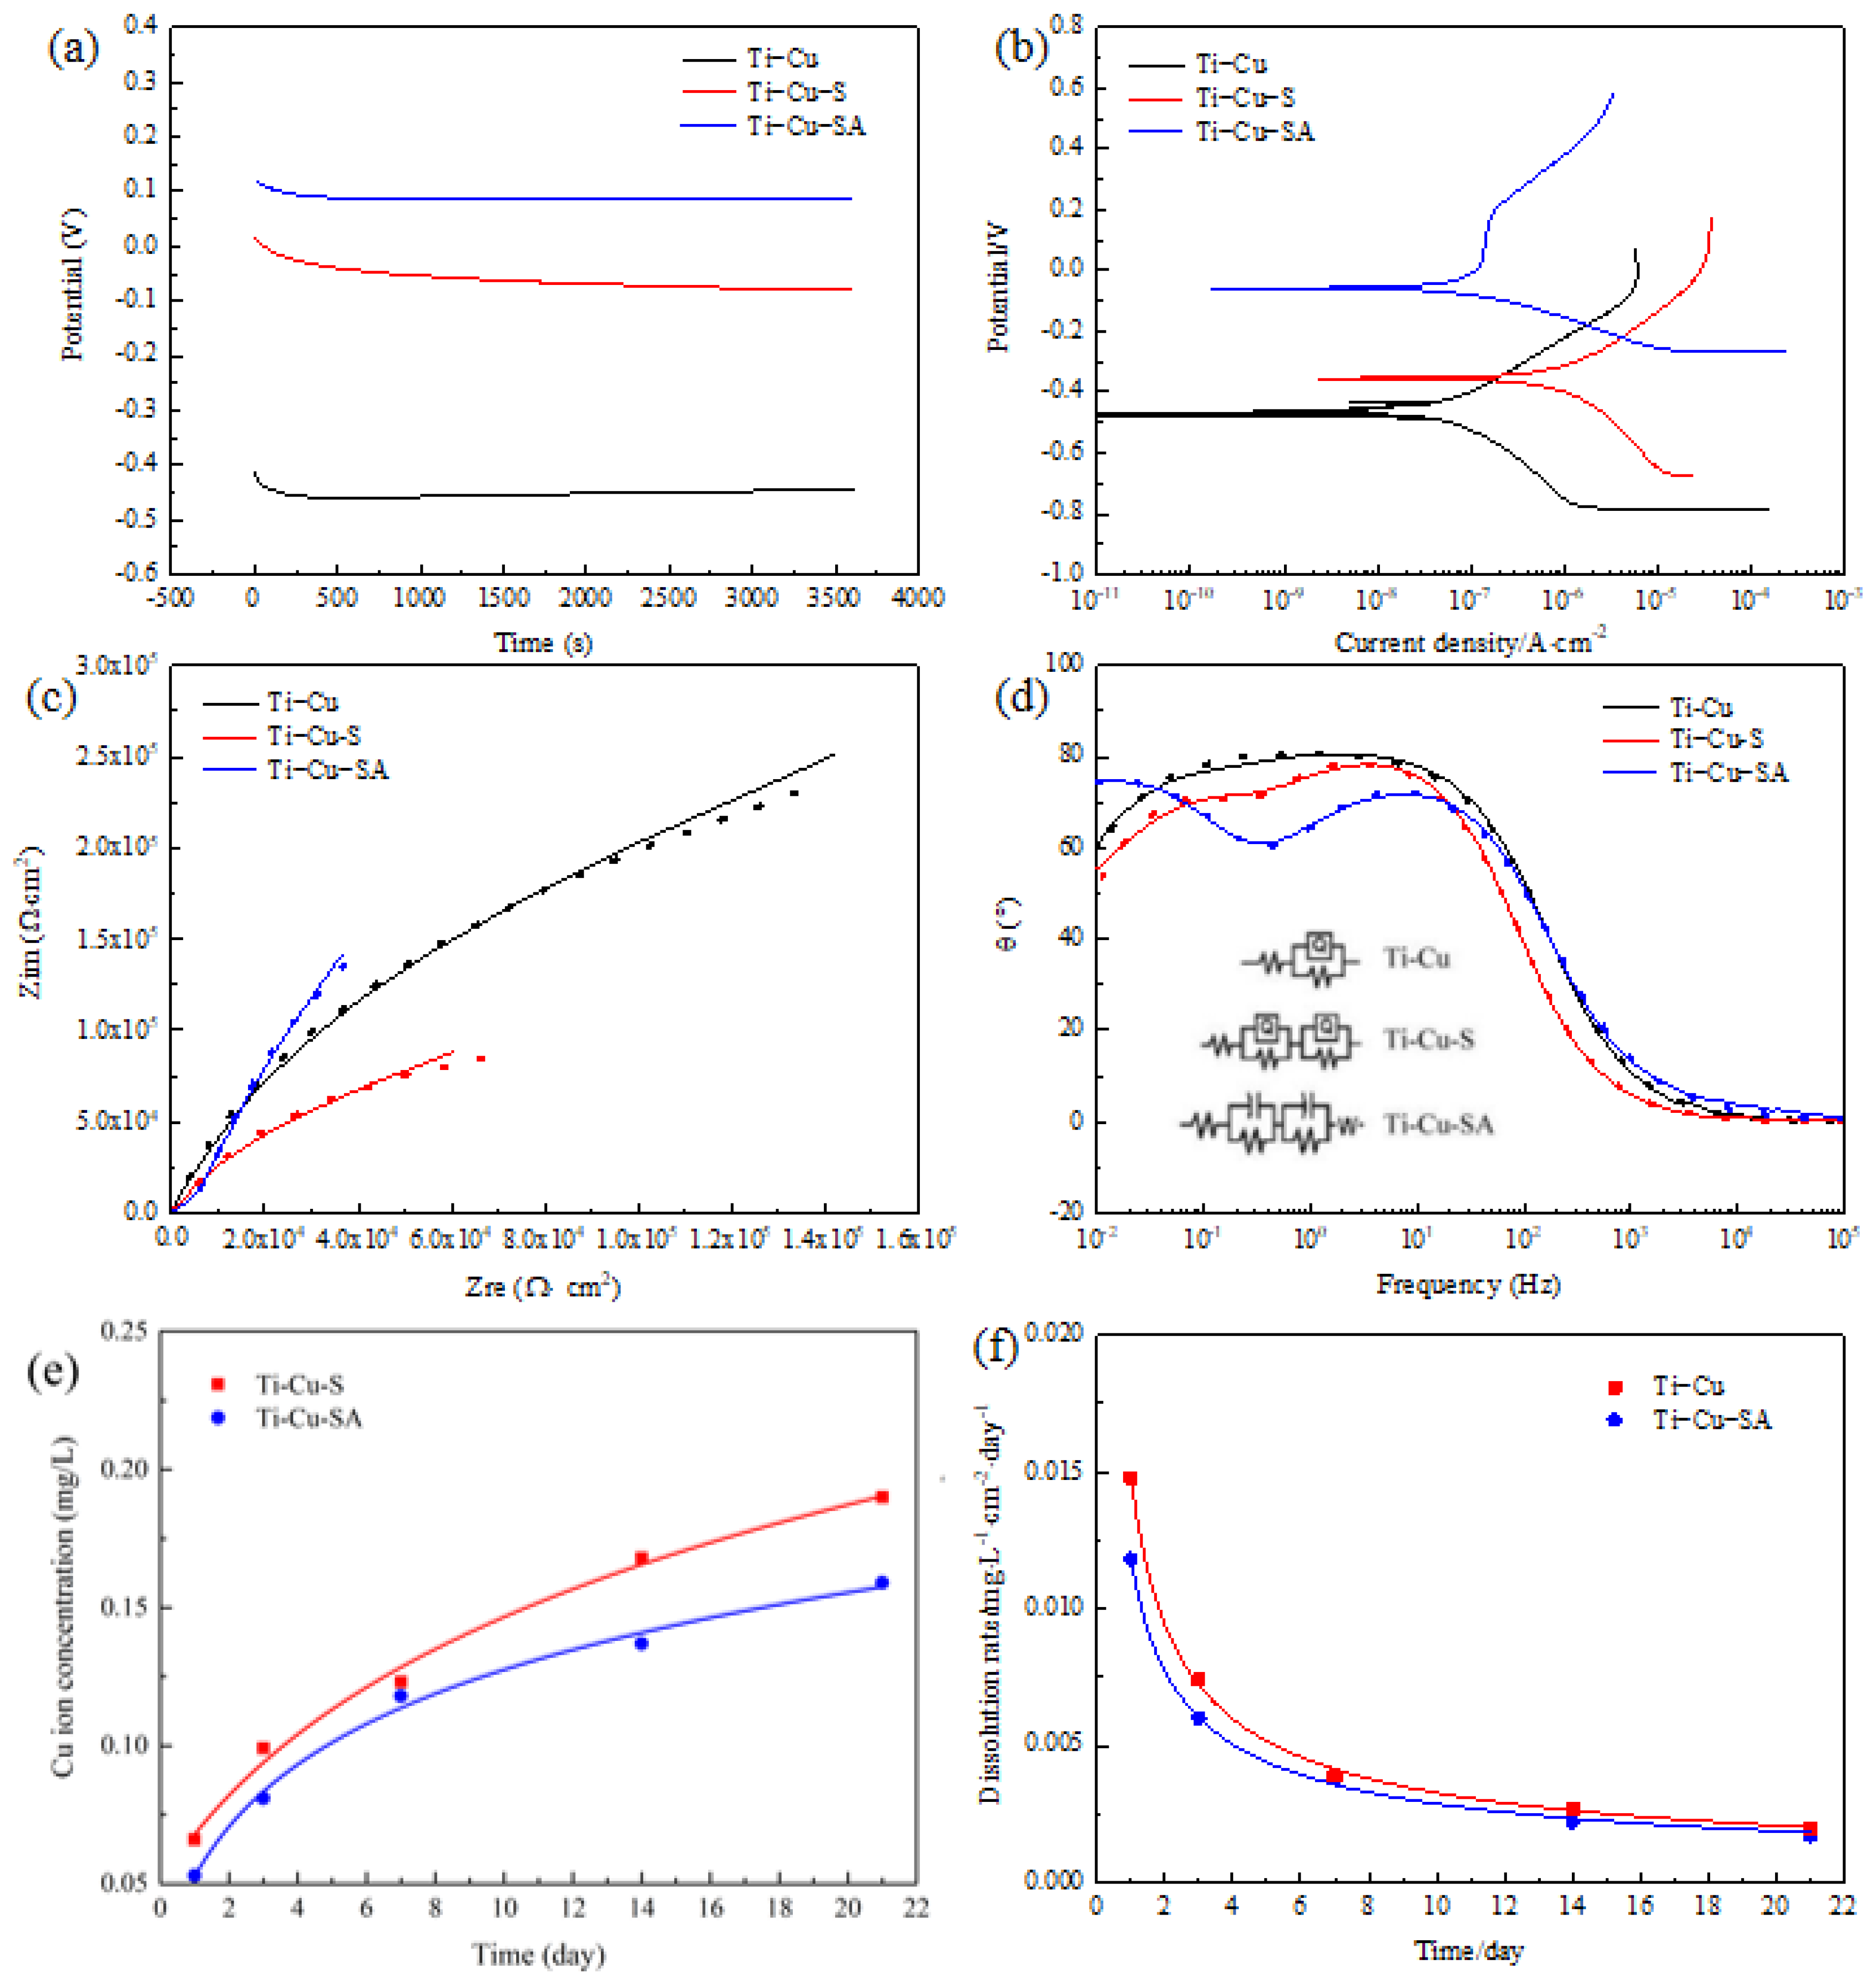
3.4. Electrochemical Test

The open circuit potential (OCP) and Tafel curves of the Ti-Cu, Ti-Cu-S and Ti-Cu-SA samples are shown in Figure 4a,b, and the electrochemical data are listed in Table 1. The OCP curves of the three samples all reached a relatively stable state at 3600s. Compared with that of Ti-Cu, the OCP of the Ti-Cu-S and Ti-Cu-SA samples shifted positively, reaching −0.081 V and 0.085 V, and the self-corrosion potential (Ecorr) increased to −0.291 V and −0.056 V, respectively. Meanwhile, the self-corrosion current density (icorr) increased to 57.5 × 10⁻⁸ A/cm2 and 5.1 × 10⁻⁸ A/cm2, indicating that the sandblasting and etching process reduced the corrosion resistance significantly, while the anodic oxidation improved the corrosion resistance significantly.
The EIS curve and the equivalent circuit diagram of the samples are shown in Figure 4c,d, and the relevant data are listed in Table 2. It can be seen from the Nyquist curve that Ti-Cu-SA had the largest impedance arc radius, indicating that the corrosion resistance was much better than that of the Ti-Cu-S and Ti-Cu samples. As can be observed from the phase angle–frequency curve, Ti-Cu-SA has a significantly wider peak than the Ti-Cu and Ti-Cu-S samples, in which the high frequency band reflected the outer film, and the low frequency band reflected the inner film. It can be seen that the inner layer was the main reason for the enhanced corrosion resistance. On the basis of the information obtained from the EIS curves, it can be concluded that the corrosion resistance was degraded by the sandblasting and etching process, but improved significantly by the anodic oxidation treatment.
The Cu ion dissolution behavior of the samples is shown in Figure 4e,f. For both the Ti-Cu-S and Ti-Cu-SA samples, the accumulative concentration of Cu ions increased with the prolongation of soaking time, while the dissolution rate decreased rapidly during the first 14 days. The Cu ion accumulative concentration and the dissolution rate of Ti-Cu-SA were lower than those of Ti-Cu-S at all time intervals, indicating that the anodic oxidation had reduced the release of Cu ions.

3.5. Antibacterial Properties

The two samples were immersed in 0.9% NaCl solution for different lengths of time to test their long-term antibacterial properties. The typical colony counting photos are shown in Figure 5. There were a large number of colonies on the cp-Ti samples at all time intervals, while nearly no bacterial colonies survived on both the Ti-Cu-S and the Ti-Cu-SA samples, even after immersion for 21 days. The calculated antibacterial rates of the two samples were >99.9% at all time intervals, showing strong antibacterial activity as well as long-term antibacterial activity.
The live/dead staining images and SEM images of S. aureus on the samples are shown in Figure 6, in which the living bacteria are green in color and the dead bacteria are red in color. There were a large number of living and dead bacteria on the surface of cp-Ti. As shown in Figure 6c1, a large number of bacteria adhered on the surface of cp-Ti and presented obvious clusters, similar to grape clusters. On the Ti-Cu-S and Ti-Cu-SA samples, there were a small number of green bacteria, but a large amount of red bacteria all over the surface. On the basis of the SEM morphologies presented in Figure 6c2,d2, it was found that some bacteria on the samples were in poor shape, exhibiting cell wall rupture, cell membrane dissolution, and cytoplasm outflow. All these results confirm that cp-Ti did not have antibacterial ability, and demonstrate that both the Ti-Cu-S and Ti-Cu-SA samples had very strong antibacterial ability, which is consistent with the plate count results shown in Figure 5.

3.6. Cell Cytotoxicity

The cell toxicity of the samples, determined using the direct contact method and the extract method, is shown in Figure 7. In both tests, the OD values of all samples increased with the extension of culture time, indicating that the cells proliferating on the sample surface were in a healthy condition. In the direct contact test, a low OD value was found on the Ti-Cu-S sample, but no significant difference was found among any of the samples on day 1. At day 3, the OD values of the Ti-Cu-S samples were significantly lower than those of the other samples, indicating their inhibitory effect on proliferation, while the OD values of the Ti-Cu-SA samples were much higher than those of Ti-Cu-S, suggesting that anodic oxidation improved the surface biocompatibility. On day 5, there was no significant difference among any of the samples. The calculated cell viability of all of the samples at all time intervals was higher than 84%, indicating that all samples exhibited Grade 1 or Grade 0 toxicity with respect to cp-Ti.
In the tests for extract toxicity, as shown in Figure 7b1,b2, none of the samples showed any differences in OD values at any of the time intervals, and cell viability was higher than 100%, corresponding to Grade 0 cell toxicity in comparison with the extract of cp-Ti.

3.7. Cell Adhesion Properties

Cytoskeleton staining images of the cells cultured on the sample surface for 4 h and 24 h are shown in Figure 8, in which the nucleus is stained blue and the cytoplasm is stained green. Under low magnification, no differences in the cell number were found among the different samples. However, under the high magnification, it can be seen that most of the cells were polygonal, stuck to a wall and started spreading. On the surface of the Ti-Cu-S samples, some cells were well diffused while some cells were hardly diffused. Only the nucleus and a small amount of cytoplasm could be clearly observed. The spreading status of single cells on the surface of Ti-Cu-S sample were worse, and the connection between cells was not very close, which suggests that the cell adhesion spreading ability of the samples surface were poor.
As can be seen from Figure 8, there was almost no difference in the cell morphology between Ti-Cu-S and Ti-Cu-SA at 4 h and 24 h of culture. The cells were round or polygonal, indicating that cells adhered to the wall and began to spread out. Compared with 4 h, the cell morphology was fusiform, and the spreading area greatly increased at 24 h. A large number of filamentous pseudopodia were extended, and the cells were closely connected. It can be concluded that Ti-Cu-SA has almost no effect on cell adhesion and diffusion, and the anodic oxidation treatment can effectively improve the cell compatibility of Ti-Cu-S samples.

4. Discussion

4.1. Surface Morphology and Chemical Composition

The surface roughness and the chemical composition significantly influence the hydrophilicity, cell response and interface bonding strength at the implant and the surrounding tissue. For example, in order to improve the interface bonding strength of the dental implant and bone tissue, a rough surface was produced on the surface of the dental implant by means of SLA [26], the selective etching process [9], etc. It was reported the surface roughness should be 1.5 μm to 2.5 μm in order to obtain satisfactory bonding strength [27,28]. It has also been shown that titanium oxide (TiO2) films grown spontaneously on the surface of titanium alloys are bioinert, often leading to inadequate bone integration [29,30,31]. However, in recent years, TiO2 coatings with controllable nanostructures have been prepared on Ti surfacse by anodic oxidation that show good biological activity [32,33]. Although Ti-Cu alloys have shown strong antibacterial ability, the surface was still bioinert. Therefore, surface roughening and surface oxide film might be a prefect method for improving their biological activity.
After the roughening process, sandblasting, and acid etching treatment, a rough surface with a surface roughness of about 2 μm was prepared on the Ti-Cu sample, as shown in Figure 1. In addition, a micro-porous structure with widely distributed Ti2Cu particles was observed on the surface. The XRD and XPS results indicated the surface was mainly composed of α-Ti matrix and Ti2Cu phase as well as a few TiO2 and a small amount of residual Al2O3. The hydrophilicity was greatly improved by the roughening process.
Following the anodic oxidation, the rough surface could still be observed on the Ti-Cu-SA sample, but the micro-porous structure on the surface of the Ti-Cu-S sample was sealed and covered, and the roughness was slightly reduced. During anodic oxidation, O2- combined with alloying elements to form oxide films. At the initial stage of oxidation, a thin passivation layer was formed on the surface of the alloy. At this time, due to the large potential gradient of O2-, the membrane could not prevent O2- from further binding with the Ti matrix, so the thickness of the film continued to increase, and the blocking effect on O2- increased until the thickness of the film was great enough that O2- could not penetrate under the action of the electric field applied. At the same time, in the reaction process, the outer film and O2 were generated, forming a porous and loose film. SEM cross-microstructure showed that the inner layer of the bilayer was a dense TiO2 passivation layer, and XPS results showed that Cu2O, CuO and TiO2 were synthesized on the outer surface of the bilayer.
In previous studies on anodic oxidation coating on Ti-Cu alloy surfaces, it has been found that the surface roughness increased to 0.35 μm by the anodic oxidation, and correspondingly the hydrophilicity was increased in comparison with the grounded sample. In this experiment, the surface roughness increased to about 2 μm after the roughening process and after the anodic oxidation process, indicating that the anodic oxidation did not change the surface roughness in this process. It has been shown that the increase in the surface roughness enhanced hydrophilicity [34,35]. In this experiment, two kinds of samples had similar degrees of surface roughness, but different surface morphologies, and their hydrophilicity was also similar, indicating that roughness was the main factor affecting hydrophilicity.

4.2. Corrosion Properties

In biomedical applications, good corrosion properties are always desirable. Previous studies have demonstrated that Ti-3Cu alloy exhibits good corrosion resistance as good as cp-Ti in biological environments. In this study, following the surface roughening process, icorr increased by an order of magnitude compared to Ti-3Cu alloy. On the one hand, the surface area of Ti-Cu-S sample was significantly increased by the roughening treatment. On the other hand, more Ti2Cu particles were present on the Ti-Cu-S surface, accelerating the galvanic corrosion between Ti-Ti2Cu. Following anodic oxidation, the icorr of Ti-Cu-SA sample was one order of magnitude lower than that of Ti-Cu-S, while the two samples had the same roughness, demonstrating that anodic oxidation significantly improved corrosion resistance. When observing the cross-section microstructure of Ti-Cu-SA sample, a double-layer oxide film with a dense inner layer was formed on the surface that was able to resist the ion exchange between the solution and the matrix, as well as block the formation of galvanic couples of Ti-Ti2Cu particles, in turn greatly reducing galvanic corrosion. Even though the Ti-Cu-SA sample had a larger contact area with the solution than the Ti-Cu sample, the icorr was still on the same order of magnitude as that of the Ti-Cu sample, with the Ti-Cu-SA sample thus demonstrating the best resistance properties.
The EIS results also indicated that the Ti-Cu-SA sample had a higher corrosion resistance (Rc) than the Ti-Cu-S and Ti-Cu samples, indicating that the product of the reaction on the Ti-Cu-SA sample was able to provide good protection against corrosion attack. In other words, the oxide film formed by anodic oxidation was able to form a dense protective layer to resist corrosion and protect the sample.
In this experiment, following sandblasting and acid etching, the dissolution amount of Cu ions increased, while the dissolution rate slowed down with time. Following anodic oxidation treatment, the dissolution trend of Cu ions remained unchanged, but the dissolution amount was reduced significantly, indicating that the oxide film offered resistance against Cu ion release. It is speculated that the dissolution rate of copper ion in 0.9% NaCl solution would decrease significantly with the extension of immersion time. However, Cu ion release was detected even after immersion for 21 days.

4.3. Antibacterial Properties

Ti-3Cu has shown very good antibacterial activity against both S. aureus and E.coli in previous studies [9,36,37]. After the roughening process and the anodic oxidation, the roughness was significantly increased, and the hydrophilicity was significantly improved, as shown in Figure 2. The high hydrophilicity accelerates cell/bacteria adhesion and spreads according to other research results [21]. In addition, the oxide film formed by anodic oxidation covers the sample and separates Ti-3Cu from coming into contact with bacteria. As a result, the film reduces the antibacterial function of the Ti-Cu sample significantly. However, the antibacterial test results in Figure 5 clearly demonstrated that both Ti-Cu-S and Ti-Cu-SA samples had very strong antibacterial ability even after 21 days soaking in 0.9% NaCl solution, with an antibacterial rate as high as ≥99.9%, indicating that both the roughening process and anodic oxidation significantly improved the antibacterial properties and the long-term antibacterial properties.
The antibacterial properties of Ti-Cu alloy mainly come from two aspects, the first is the dissolution of Cu ions [7,38], the other is the exposure of the second phase (Ti2Cu phase) on the surface [39], for which the Ti2Cu phase plays the main role in antibacterial performance. Following the surface roughening process, the roughness and the hydrophilicity were improved as described above, but more Ti2Cu particles appeared on the surface due to the etching reaction, which contributed to the strong antibacterial ability due to the micro-area potential difference (MAPD) function [40]. In addition, Cu ion release was also enhanced by the surface roughening process. However, after immersion for 21 days, the Cu ion release was very low, as shown in Figure 4. The good antibacterial rate in Figure 5 suggests that the contact antibacterial activity of the second antibacterial phase Ti2Cu due to MAPD should be the main mechanism of the good long-term antibacterial effect of Ti-Cu alloy.
Following anodic oxidation, Cu in the Ti2Cu phase on the surface of the sample was oxidized to Cu2O and CuO, while Ti was present in the form of TiO2. At this time, the sample was covered in an oxide layer, as shown in Figure 1, separating the Ti2Cu phase from bacteria and significantly reducing the antibacterial function of Ti2Cu. However, Cu2O and CuO were detected, as shown in Figure 3. Some studies have shown that the formation of copper oxides on the surface of samples such as Cu2O and CuO can provide them with considerable antibacterial properties. Cu2O had strong antibacterial ability, and its antibacterial effect was closely related to size and concentration [41,42], 1 μg/mL Cu2O produced strong antibacterial ability with respect to S. aureus. A large number of scholars have also reported the excellent antibacterial effect of CuO [43,44,45,46] against S.aureus, E. coli, pseudomonas aeruginosa, and more than a dozen other strains. Cu2O and CuO also exerted antibacterial activities by means of contact. First, they caused the destruction of the bacterial cell wall, leading to structural changes, thus affecting the bacterial form and function. Then, they further resulted in the destruction of the structure of the membrane, changing its permeability, and finally killing the bacteria [16,45,47].

4.4. Biocompatibility

Noncytotoxicity is a basic requirement for biomedical materials. Ti-Cu alloys have been reported to have the same good biocompatibility as cp-Ti [21]. Both the direct contact test and the extract test showed that the Ti-Cu-S and Ti-Cu-SA samples had no cytotoxicity (Grade 0 or Grade 1), but the Ti-Cu-S sample had a slight inhibitory effect on the initial proliferation of osteoblasts in the direct test, as shown in Figure 7a1,a2.
Cell adhesion is greatly affected by the surface properties of the materials, including surface morphology, surface chemical composition, hydrophilicity, and surface energy. In the case of the Ti-Cu-S sample, the extract test did show any inhibition on the proliferation of osteoblasts in contrast to the direct contact results, suggesting that the inhibition was mainly caused by the surface morphology or surface roughness rather than Cu ion release. In this experiment, the effects of both the rough surface and the Cu ion leaching on cytotoxicity were integrated. After the roughening process, the specific surface area of the sample increased greatly, providing more alternative sites for cell adhesion, but even with an increase in surface area, different morphologies will have either a good or bad effect on the growth of cells on the sample. Different cell types have been reported to have different biological responses to surface roughness, elongation and formation of osteoblasts, with continuous layers of cells preferring rough surfaces over smooth surfaces [47]. Amselme et al. found that MC3T3-E1 cells adhered more easily to the smooth Ti-6Al-4V surface. The porous surface with a complex chemical composition produced by ultrasonic micro-arc oxidation reduced the contact angle and improved the surface hydrophilicity to a certain extent [48]. In this experiment, the surface roughening process produced a large rough surface, and the anodic oxidation process prepared an oxide film on the surface. The surface of the Ti-Cu-S sample was rough, sharp and had a micro-porous structure, making it difficult for cells to adhere to the surface, which may be an important reason for the difference in toxicity levels.
Copper ions have been reported to be beneficial to cell proliferation when the copper ion concentration is less than the lethal amount of cells [49,50]. Zhang et al. proposed that Cu+ and Cu2+ could significantly promote the proliferation, differentiation and migration of osteoblasts [51]. Cu2+ can promote angiogenesis and wound healing in vitro [52]. The researchers also demonstrated that copper ions significantly promote the proliferation and differentiation of mouse osteoblasts at concentrations of (0.06–63.5) μg/L [51]. The Cu ion release was accelerated by the roughening process, although the subsequent anodic oxidation significantly reduced the Cu ion release in this work, with amounts of 0.0019 mg/L/cm2 and 0.0016 mg/L/cm2 being released from Ti-Cu-S and Ti-Cu-SA samples, respectively. The extract cell test in Figure 7b clearly showed that the extracts of Ti-Cu-S and Ti-Cu-SA did not exhibit toxicity to the cell line, but no promotion effect on the proliferation was found for both extracts, indicating that the Cu ion concentration in the extracts could not bring about influence on the cell proliferation. On the basis of the results of the ion leaching test, the concentration of Cu ions dissolved in the Ti-Cu-SA sample at 24 h was roughly estimated to be about 0.05 mg/L, which can be converted to an order of magnitude 10−9. All the dissolved Cu ions can be regarded as Cu+ or Cu2+, and neither Cu+ nor Cu2+ were sufficient to produce cytotoxicity at this concentration.
It can be observed in Figure 7a that the Ti-Cu-SA sample exhibited better cell viability than the Ti-Cu-S sample at Day 1 and Day 3, demonstrating that anodic oxidation promoted the cell compatibility of the Ti-Cu-S sample. In comparison with the Ti-Cu-S sample, Ti-Cu-SA had a similar surface roughness and hydrophilicity, but the surface morphology was found to be different. After the anodic oxidation treatment, the micropores on the surface were sealed using oxide film, and the sharp edges produced during the roughening process became rounded edges due to the oxidation reaction.
The most important difference between Ti-Cu-S and Ti-Cu-SA was the surface chemical composition. After the anodic oxidation, a mixture of TiO2, Cu2O, and a small amount of CuO was formed on the surface. Many studies have shown porous titanium oxide films with a certain roughness can improve the biological activity of implants and promote the adsorption and diffusion of osteoblasts on their surfaces. For example, anodized films effectively enhanced the biological activity of titanium [53,54].

5. Conclusions

In this paper, a sandblasting and etching process was used to roughen the surface, and anodic oxidation was applied to improve the corrosion properties and antibacterial properties. The formation of a rough and double-layer oxide film composed of composite TiO2/CuO/Cu2O on Ti-Cu alloy improved the corrosion resistance and reduced Cu ion release due to the formation of an inner TiO2 layer, while also providing very good long-term antibacterial ability due to the formation of CuO/Cu2O, and improving the cellular compatibility due the rough surface.

Author Contributions

Conceptualization, E.Z. and H.Y.; methodology, Y.X.; software, M.L. and X.M.; validation, E.Z. and H.Y.; formal analysis, Y.X.; investigation, X.M.; resources, M.L.; data curation, Y.X. and M.L.; writing—original draft preparation, X.M.; writing—review and editing, E.Z.; visualization, E.Z. and H.Y.; supervision, H.Y.; project administration, Y.X.; funding acquisition, E.Z. All authors have read and agreed to the published version of the manuscript.

Funding

This research was funded by Joint plan of key R&D projects in Liaoning Province (2020JH2/10300157), Shenyang Science and Technology Plan (20-205-4-023).

Institutional Review Board Statement

Not applicable.

Informed Consent Statement

Not applicable.

Data Availability Statement

Not applicable.

Conflicts of Interest

The authors declare no conflict of interest.

References

  1. Liu, X.; Chu, P.K.; Ding, C. Surface modification of titanium, titanium alloys, and related materials for biomedical applications. Mater. Sci. Eng. R: Rep. 2004, 47, 49–121. [Google Scholar] [CrossRef] [Green Version]
  2. Gerić, M.; Gajski, G.; Mihaljević, B.; Miljanić, S.; Domijan, A.-M.; Garaj-Vrhovac, V. Radioprotective properties of food colorant sodium copper chlorophyllin on human peripheral blood cells in vitro. Mutat. Res. Genet. Toxicol. Environ. Mutagen. 2019, 845, 403027. [Google Scholar] [CrossRef]
  3. Cao, S.; Zhang, Z.-M.; Zhang, J.-Q.; Wang, R.-X.; Wang, X.-Y.; Yang, L.; Chen, D.-F.; Qin, G.-W.; Zhang, E.-L. Improvement in antibacterial ability and cell cytotoxicity of Ti–Cu alloy by anodic oxidation. Rare Met. 2022, 41, 594–609. [Google Scholar] [CrossRef]
  4. Liu, R.; Tang, Y.; Zeng, L.; Zhao, Y.; Ma, Z.; Sun, Z.; Xiang, L.; Ren, L.; Yang, K. In vitro and in vivo studies of anti-bacterial copper-bearing titanium alloy for dental application. Dent. Mater. 2018, 34, 1112–1126. [Google Scholar] [CrossRef]
  5. Wang, X.; Dong, H.; Liu, J.; Qin, G.; Chen, D.; Zhang, E. In vivo antibacterial property of Ti-Cu sintered alloy implant. Mater. Sci. Eng. C 2019, 100, 38–47. [Google Scholar] [CrossRef]
  6. Zhang, E.; Zheng, L.; Liu, J.; Bai, B.; Liu, C. Influence of Cu content on the cell biocompatibility of Ti–Cu sintered alloys. Mater. Sci. Eng. C 2015, 46, 148–157. [Google Scholar] [CrossRef]
  7. Zhang, E.; Li, F.; Wang, H.; Liu, J.; Wang, C.; Li, M.; Yang, K. A new antibacterial titanium–copper sintered alloy: Preparation and antibacterial property. Mater. Sci. Eng. C 2013, 33, 4280–4287. [Google Scholar] [CrossRef]
  8. Liu, G.; Li, Y.; Yan, M.; Feng, J.; Cao, J.; Lei, M.; Liu, Q.; Hu, X.; Wang, W.; Li, X. Vacuum wetting of Ag/TA2 to develop a novel micron porous Ti with significant biocompatibility and antibacterial activity. J. Mater. Sci. Technol. 2022, 116, 180–191. [Google Scholar] [CrossRef]
  9. Lu, M.; Zhang, Z.; Zhang, J.; Wang, X.; Qin, G.; Zhang, E. Enhanced antibacterial activity of Ti-Cu alloy by selective acid etching. Surf. Coat. Technol. 2021, 421, 127478. [Google Scholar] [CrossRef]
  10. Liu, J.; Li, F.; Liu, C.; Wang, H.; Ren, B.; Yang, K.; Zhang, E. Effect of Cu content on the antibacterial activity of titanium–copper sintered alloys. Mater. Sci. Eng. C 2014, 35, 392–400. [Google Scholar] [CrossRef]
  11. Ma, Z.; Ren, L.; Liu, R.; Yang, K.; Zhang, Y.; Liao, Z.; Liu, W.; Qi, M.; Misra, R.D.K. Effect of Heat Treatment on Cu Distribution, Antibacterial Performance and Cytotoxicity of Ti–6Al–4V–5Cu Alloy. J. Mater. Sci. Technol. 2015, 31, 723–732. [Google Scholar] [CrossRef]
  12. Ren, L.; Ma, Z.; Li, M.; Zhang, Y.; Liu, W.; Liao, Z.; Yang, K. Antibacterial Properties of Ti–6Al–4V–xCu Alloys. J. Mater. Sci. Technol. 2014, 30, 699–705. [Google Scholar] [CrossRef]
  13. Mao, X.; Shi, A.; Wang, R.; Nie, J.; Qin, G.; Chen, D.; Zhang, E. The Influence of Copper Content on the Elastic Modulus and Antibacterial Properties of Ti-13Nb-13Zr-xCu Alloy. Metals 2022, 12, 1132. [Google Scholar] [CrossRef]
  14. Zhang, W.; Zhang, S.; Liu, H.; Ren, L.; Wang, Q.; Zhang, Y. Effects of surface roughening on antibacterial and osteogenic properties of Ti-Cu alloys with different Cu contents. J. Mater. Sci. Technol. 2021, 88, 158–167. [Google Scholar] [CrossRef]
  15. Hu, J.; Li, H.; Wang, X.; Yang, L.; Chen, M.; Wang, R.; Qin, G.; Chen, D.-F.; Zhang, E. Effect of ultrasonic micro-arc oxidation on the antibacterial properties and cell biocompatibility of Ti-Cu alloy for biomedical application. Mater. Sci. Eng. C 2020, 115, 110921. [Google Scholar] [CrossRef] [PubMed]
  16. Zhang, Y.; Fu, S.; Yang, L.; Qin, G.; Zhang, E. A nano-structured TiO2/CuO/Cu2O coating on Ti-Cu alloy with dual function of antibacterial ability and osteogenic activity. J. Mater. Sci. Technol. 2022, 97, 201–212. [Google Scholar] [CrossRef]
  17. Tao, S.C.; Xu, J.L.; Yuan, L.; Luo, J.M.; Zheng, Y.F. Microstructure, mechanical properties and antibacterial properties of the microwave sintered porous Ti–3Cu alloys. J. Alloys Compd. 2020, 812, 152142. [Google Scholar] [CrossRef]
  18. Ren, B.; Wan, Y.; Liu, C.; Wang, H.; Yu, M.; Zhang, X.; Huang, Y. Improved osseointegration of 3D printed Ti-6Al-4V implant with a hierarchical micro/nano surface topography: An in vitro and in vivo study. Mater. Sci. Eng. C 2021, 118, 111505. [Google Scholar] [CrossRef]
  19. Goldberg, V.M.; Stevenson, S.; Feighan, J.; Davy, D.J.C.O.; Research, R. Biology of grit-blasted titanium alloy implants. Clin. Orthop. Relat. Res. 1995, 319, 122–129. [Google Scholar] [CrossRef]
  20. Milena, K.E.; Tamara, K.; Danijela, M.I.; Hans-Ludwig, G.; Sanja, M.J.C. Ti-SLActive and TiZr-SLActive Dental Implant Surfaces Promote Fast Osteoblast Differentiation. Coatings 2017, 7, 102. [Google Scholar]
  21. Yang, K.; Shi, J.; Wang, L.; Chen, Y.; Liang, C.; Yang, L.; Wang, L.-N. Bacterial anti-adhesion surface design: Surface patterning, roughness and wettability: A review. J. Mater. Sci. Technol. 2022, 99, 82–100. [Google Scholar] [CrossRef]
  22. Selimin, M.A.; Idris, M.I.; Abdullah, H.Z.J. Anodic Oxidation of Titanium in Acetic Acid for Biomedical Application. Adv. Mater. Res. 2015, 1125, 455–459. [Google Scholar] [CrossRef] [Green Version]
  23. Ou, S.-F.; Lin, C.-S.; Pan, Y.-N. Formation of hydroxyapatite on low Young’s modulus Ti–30Nb–1Fe–1Hf alloy via anodic oxidation and hydrothermal treatment. Mater. Sci. Eng. C 2009, 29, 2346–2354. [Google Scholar] [CrossRef]
  24. Cheng, Y.; Zhu, Z.; Zhang, Q.; Zhuang, X.; Cheng, Y. Plasma electrolytic oxidation of brass. Surf. Coat. Technol. 2020, 385, 125366. [Google Scholar] [CrossRef]
  25. Shaikh, J.S.; Pawar, R.C.; Moholkar, A.V.; Kim, J.H.; Patil, P.S. CuO–PAA hybrid films: Chemical synthesis and supercapacitor behavior. Appl. Surf. Sci. 2011, 257, 4389–4397. [Google Scholar] [CrossRef]
  26. Liu, H.; Liu, R.; Ullah, I.; Zhang, S.; Sun, Z.; Ren, L.; Yang, K. Rough surface of copper-bearing titanium alloy with multifunctions of osteogenic ability and antibacterial activity. J. Mater. Sci. Technol. 2020, 48, 130–139. [Google Scholar] [CrossRef]
  27. Rack, H.J.; Petruzelka, J.; Dluhos, L.; Hrusak, D.; Sochova, J.J.A.E.M. Nanostructured Titanium for Biomedical Applications. Adv. Eng. Mater. 2010, 10, B15–B17. [Google Scholar]
  28. Xie, Y.; Lu, M.; Cui, S.; Yu, H.; Wang, L.; Ke, H.; Zhang, E. Construction of a Rough Surface with Submicron Ti2Cu Particle on Ti-Cu Alloy and Its Effect on the Antibacterial Properties and Cell Biocompatibility. Metals 2022, 12, 1008. [Google Scholar] [CrossRef]
  29. Li, B.; Li, J.; Liang, C.; Li, H.; Guo, L.; Liu, S.; Wang, H. Surface Roughness and Hydrophilicity of Titanium after Anodic Oxidation. Rare Met. Mater. Eng. 2016, 45, 858–862. [Google Scholar] [CrossRef] [Green Version]
  30. Sun, X.; Lin, H.; Zhang, C.; Liu, Y.; Jin, J.; Di, S. A biomimetic hierarchical structure on selective laser melting titanium with enhanced hydrophilic/hydrophobic surface. J. Alloys Compd. 2022, 895, 162585. [Google Scholar] [CrossRef]
  31. Durdu, S.; Cihan, G.; Yalcin, E.; Altinkok, A. Characterization and mechanical properties of TiO2 nanotubes formed on titanium by anodic oxidation. Ceram. Int. 2021, 47, 10972–10979. [Google Scholar] [CrossRef]
  32. Guo, T.; Oztug, N.A.K.; Han, P.; Ivanovski, S.; Gulati, K. Influence of sterilization on the performance of anodized nanoporous titanium implants. Mater. Sci. Eng. C 2021, 130, 112429. [Google Scholar] [CrossRef]
  33. Vilardell, A.M.; Cinca, N.; Garcia-Giralt, N.; Müller, C.; Dosta, S.; Sarret, M.; Cano, I.G.; Nogués, X.; Guilemany, J.M. In-vitro study of hierarchical structures: Anodic oxidation and alkaline treatments onto highly rough titanium cold gas spray coatings for biomedical applications. Mater. Sci. Eng. C 2018, 91, 589–596. [Google Scholar] [CrossRef] [PubMed]
  34. Nguyen, H.N.G.; Zhao, C.-F.; Millet, O.; Selvadurai, A.P.S. Effects of surface roughness on liquid bridge capillarity and droplet wetting. Powder Technol. 2021, 378, 487–496. [Google Scholar] [CrossRef]
  35. Du, Q.; Zhou, P.; Pan, Y.; Qu, X.; Liu, L.; Yu, H.; Hou, J. Influence of hydrophobicity and roughness on the wetting and flow resistance of water droplets on solid surface: A many-body dissipative particle dynamics study. Chem. Eng. Sci. 2022, 249, 117327. [Google Scholar] [CrossRef]
  36. Zhang, Z.; Zheng, G.; Li, H.; Yang, L.; Wang, X.; Qin, G.; Zhang, E. Anti-bacterium influenced corrosion effect of antibacterial Ti-3Cu alloy in Staphylococcus aureus suspension for biomedical application. Mater. Sci. Eng. C 2019, 94, 376–384. [Google Scholar] [CrossRef] [PubMed]
  37. Siddiqui, M.A.; Ullah, I.; Liu, H.; Zhang, S.; Ren, L.; Yang, K. Preliminary study of adsorption behavior of bovine serum albumin (BSA) protein and its effect on antibacterial and corrosion property of Ti-3Cu alloy. J. Mater. Sci. Technol. 2021, 80, 117–127. [Google Scholar] [CrossRef]
  38. Lüthen, F.; Bergemann, C.; Bulnheim, U.; Prinz, C.; Rychly, J. A Dual Role of Copper on the Surface of Bone Implants. Mater. Sci. Forum 2010, 638–642, 600–605. [Google Scholar] [CrossRef]
  39. Jie, L.; Zhang, X.; Wang, H.; Li, F.; Li, M.; Ke, Y.; Zhang, E. The antibacterial properties and biocompatibility of a Ti–Cu sintered alloy for biomedical application. Biomed. Mater. 2014, 9, 025013. [Google Scholar]
  40. Fu, S.; Zhang, Y.; Yang, Y.; Liu, X.; Zhang, X.; Yang, L.; Xu, D.; Wang, F.; Qin, G.; Zhang, E. An antibacterial mechanism of titanium alloy based on micro-area potential difference induced reactive oxygen species. J. Mater. Sci. Technol. 2022, 119, 75–86. [Google Scholar] [CrossRef]
  41. He, X.; Zhang, G.; Wang, X.; Hang, R.; Huang, X.; Qin, L.; Tang, B.; Zhang, X. Biocompatibility, corrosion resistance and antibacterial activity of TiO2/CuO coating on titanium. Ceram. Int. 2017, 43, 16185–16195. [Google Scholar] [CrossRef]
  42. Athinarayanan, J.; Periasamy, V.S.; Krishnamoorthy, R.; Alshatwi, A.A. Evaluation of antibacterial and cytotoxic properties of green synthesized Cu2O/Graphene nanosheets. Mater. Sci. Eng. C 2018, 93, 242–253. [Google Scholar] [CrossRef] [PubMed]
  43. Wang, S.; Li, Q.; Chen, F.; Ke, J.; Chen, R. HEPES-mediated controllable synthesis of hierarchical CuO nanostructures and their analogous photo-Fenton and antibacterial performance. Adv. Powder Technol. 2017, 28, 1332–1339. [Google Scholar] [CrossRef]
  44. Bolaina-Lorenzo, E.; Puente-Urbina, B.A.; Espinosa-Neira, R.; Ledezma, A.; Rodríguez-Fernández, O.; Betancourt-Galindo, R. A simple method to improve antibacterial properties in commercial face masks via incorporation of ZnO and CuO nanoparticles through chitosan matrix. Mater. Chem. Phys. 2022, 287, 126299. [Google Scholar] [CrossRef]
  45. Han, L.; Zhan, W.; Liang, X.; Zhang, W.; Huang, R.; Chen, R.; Ni, H. In-situ generation Cu2O/CuO core-shell heterostructure based on copper oxide nanowires with enhanced visible-light photocatalytic antibacterial activity. Ceram. Int. 2022, 48, 22059–22071. [Google Scholar] [CrossRef]
  46. Imani, M.M.; Kiani, M.; Rezaei, F.; Souri, R.; Safaei, M. Optimized synthesis of novel hydroxyapatite/CuO/TiO2 nanocomposite with high antibacterial activity against oral pathogen Streptococcus mutans. Ceram. Int. 2021, 47, 33398–33404. [Google Scholar] [CrossRef]
  47. Liu, S.; Zhang, Z.; Zhang, J.; Qin, G.; Zhang, E. Construction of a TiO2/Cu2O multifunctional coating on Ti-Cu alloy and its influence on the cell compatibility and antibacterial properties. Surf. Coat. Technol. 2021, 421, 127438. [Google Scholar] [CrossRef]
  48. Anselme, K.; Linez, P.; Bigerelle, M.; Le Maguer, D.; Le Maguer, A.; Hardouin, P.; Hildebrand, H.F.; Iost, A.; Leroy, J.M. The relative influence of the topography and chemistry of TiAl6V4 surfaces on osteoblastic cell behaviour. Biomaterials 2000, 21, 1567–1577. [Google Scholar] [CrossRef]
  49. Zhang, J.; Huang, J.; Xu, S.; Wang, K.; Yu, S. Effects of Cu2+ and pH on osteoclastic bone resorption in vitro. Prog. Nat. Sci. 2003, 13, 266–270. [Google Scholar] [CrossRef]
  50. Ren, Q.; Qin, L.; Jing, F.; Cheng, D.; Wang, Y.; Yang, M.; Xie, D.; Leng, Y.; Akhavan, B.; Huang, N. Reactive magnetron co-sputtering of Ti-xCuO coatings: Multifunctional interfaces for blood-contacting devices. Mater. Sci. Eng. C 2020, 116, 111198. [Google Scholar] [CrossRef]
  51. Kim, H.Y.; Hashimoto, S.; Kim, J.I.; Hosoda, H.; Miyazaki, S. Mechanical Properties and Shape Memory Behavior of Ti-Nb Alloys. Mater. Trans. 2004, 45, 2443–2448. [Google Scholar] [CrossRef] [Green Version]
  52. Bai, L.; Chen, P.; Zhao, Y.; Hang, R.; Yao, X.; Tang, B.; Liu, C.; Xiao, Y.; Hang, R. A micro/nano-biomimetic coating on titanium orchestrates osteo/angio-genesis and osteoimmunomodulation for advanced osseointegration. Biomaterials 2021, 278, 121162. [Google Scholar] [CrossRef] [PubMed]
  53. Yang, B.; Uchida, M.; Kim, H.-M.; Zhang, X.; Kokubo, T. Preparation of bioactive titanium metal via anodic oxidation treatment. Biomaterials 2004, 25, 1003–1010. [Google Scholar] [CrossRef]
  54. Dey, T.; Roy, P.; Fabry, B.; Schmuki, P. Anodic mesoporous TiO2 layer on Ti for enhanced formation of biomimetic hydroxyapatite. Acta Biomater. 2011, 7, 1873–1879. [Google Scholar] [CrossRef]
Figure 1. SEM morphology, film thickness and phase composition of surface-modified samples (a) SEM morphology of Ti-Cu-S after 15 min of acid etching at a voltage of 60 V; (b) SEM morphology of Ti-Cu-SA after 10 min at an oxidation voltage of 60 V; (c) SEM morphology of Ti-Cu-SA; (d) XRD patterns; (e) cross-sectional microstructure of Ti-Cu-SA.
Metals 12 01726 g001
Figure 2. Roughness and water contact angle of the Ti-Cu alloys (a) roughness; (b) water contact angle.
Metals 12 01726 g002
Figure 3. XPS analysis of Ti-Cu-S and Ti-Cu-SA samples (a1) Full spectrum of Ti-Cu-S alloy; (a2) Full spectrum of Ti-Cu-SA alloy; (b1)Ti 2p of Ti-Cu-S alloy; (b2) Ti 2p of Ti-Cu-SA alloy; (c1) Cu 2p of Ti-Cu-S alloy; (c2) Cu 2p of Ti-Cu-SA alloy.
Metals 12 01726 g003
Figure 4. Electrochemical test results and Cu ion release of Ti-Cu samples: (a) OCP; (b) Tafel; (c) Nyquist; (d) Bode; (e) Cu ion accumulated concentration; and (f) Cu ion release rate.
Metals 12 01726 g004
Figure 5. Typical bacterial colonies and antibacterial rates of the samples against S. aureus for different lengths of time.
Metals 12 01726 g005
Figure 6. Live/dead staining and SEM morphology of S. aureus after 24 h incubation. (a1) Live bacteria on the surface of cp-Ti samples; (b1) Dead bacteria on the surface of cp-Ti samples; (c1) The SEM morphology of cp-Ti samples; (a2) Live bacteria on the surface of Ti-Cu-S samples; (b2) Dead bacteria on the surface of Ti-Cu-S samples; (c2) The SEM morphology of Ti-Cu-S samples; (a3) Live bacteria on the surface of Ti-Cu-SA samples; (b3) Dead bacteria on the surface of Ti-Cu-SA samples; (c3) The SEM morphology of Ti-Cu-SA samples.
Metals 12 01726 g006
Figure 7. Cell toxicity of samples against MC3T3-E1 (* p < 0.05) (a1) OD values of alloys determined by direct contact method; (a2) OD values of alloys determined by extract toxicity; (b1) Cell viability of alloys determined by direct contact method; (b2) Cell viability of alloys determined by extract toxicity.
Metals 12 01726 g007
Figure 8. Cytoskeleton staining of MC3T3-E1 on the samples at different time intervals.
Metals 12 01726 g008
Table 1. Electrochemical data obtained from OCP and Tafel curves.
SampleEOCP/VSCE(V)Ecorr/VSCE(V)icorr × 10−8/(A/cm2)
Ti-Cu−0.444 ± 0.003−0.474 ± 0.0073.9 ± 0.5
Ti-Cu-S−0.081 ± 0.022−0.291 ± 0.01657.5 ± 10.1
Ti-Cu-SA0.085 ± 0.017−0.056 ± 0.0155.1 ± 0.7
Table 2. Electrochemical data obtained from EIS.
SampleRs
(ohm·cm2)
Rc/×104
(ohm·cm2)
Qc/×105
(S·secn·cm−2)
ncRct/×104
(ohm·cm2)
Qdl/×105
(S·secn·cm−2)
ndlW/×10−4
(S·sec5·cm−2)
Ti-Cu45.25 ± 0.1971.30 ± 2.423.94 ± 0.020.90 ± 0.00----
Ti-Cu-S45.49 ± 0.1821.97 ± 0.799.15 ± 0.220.90 ± 0.010.23 ± 0.0520.27 ± 1.150.97 ± 0.03-
Ti-Cu-SA47.92 ± 0.26198.20 ± 6.859.04 ± 0.170.89 ± 0.010.43 ± 0.037.25 ± 0.200.89 ± 0.0129.57 ± 3.69
Publisher’s Note: MDPI stays neutral with regard to jurisdictional claims in published maps and institutional affiliations.

