
The Effect of Hydrogen on Failure of Complex Phase Steel under Different Multiaxial Stress States

Abstract
:1. Introduction
2. Materials and Methods
2.1. Metallographic Methods
2.2. Material
2.3. Hydrogen Charging and Measuring
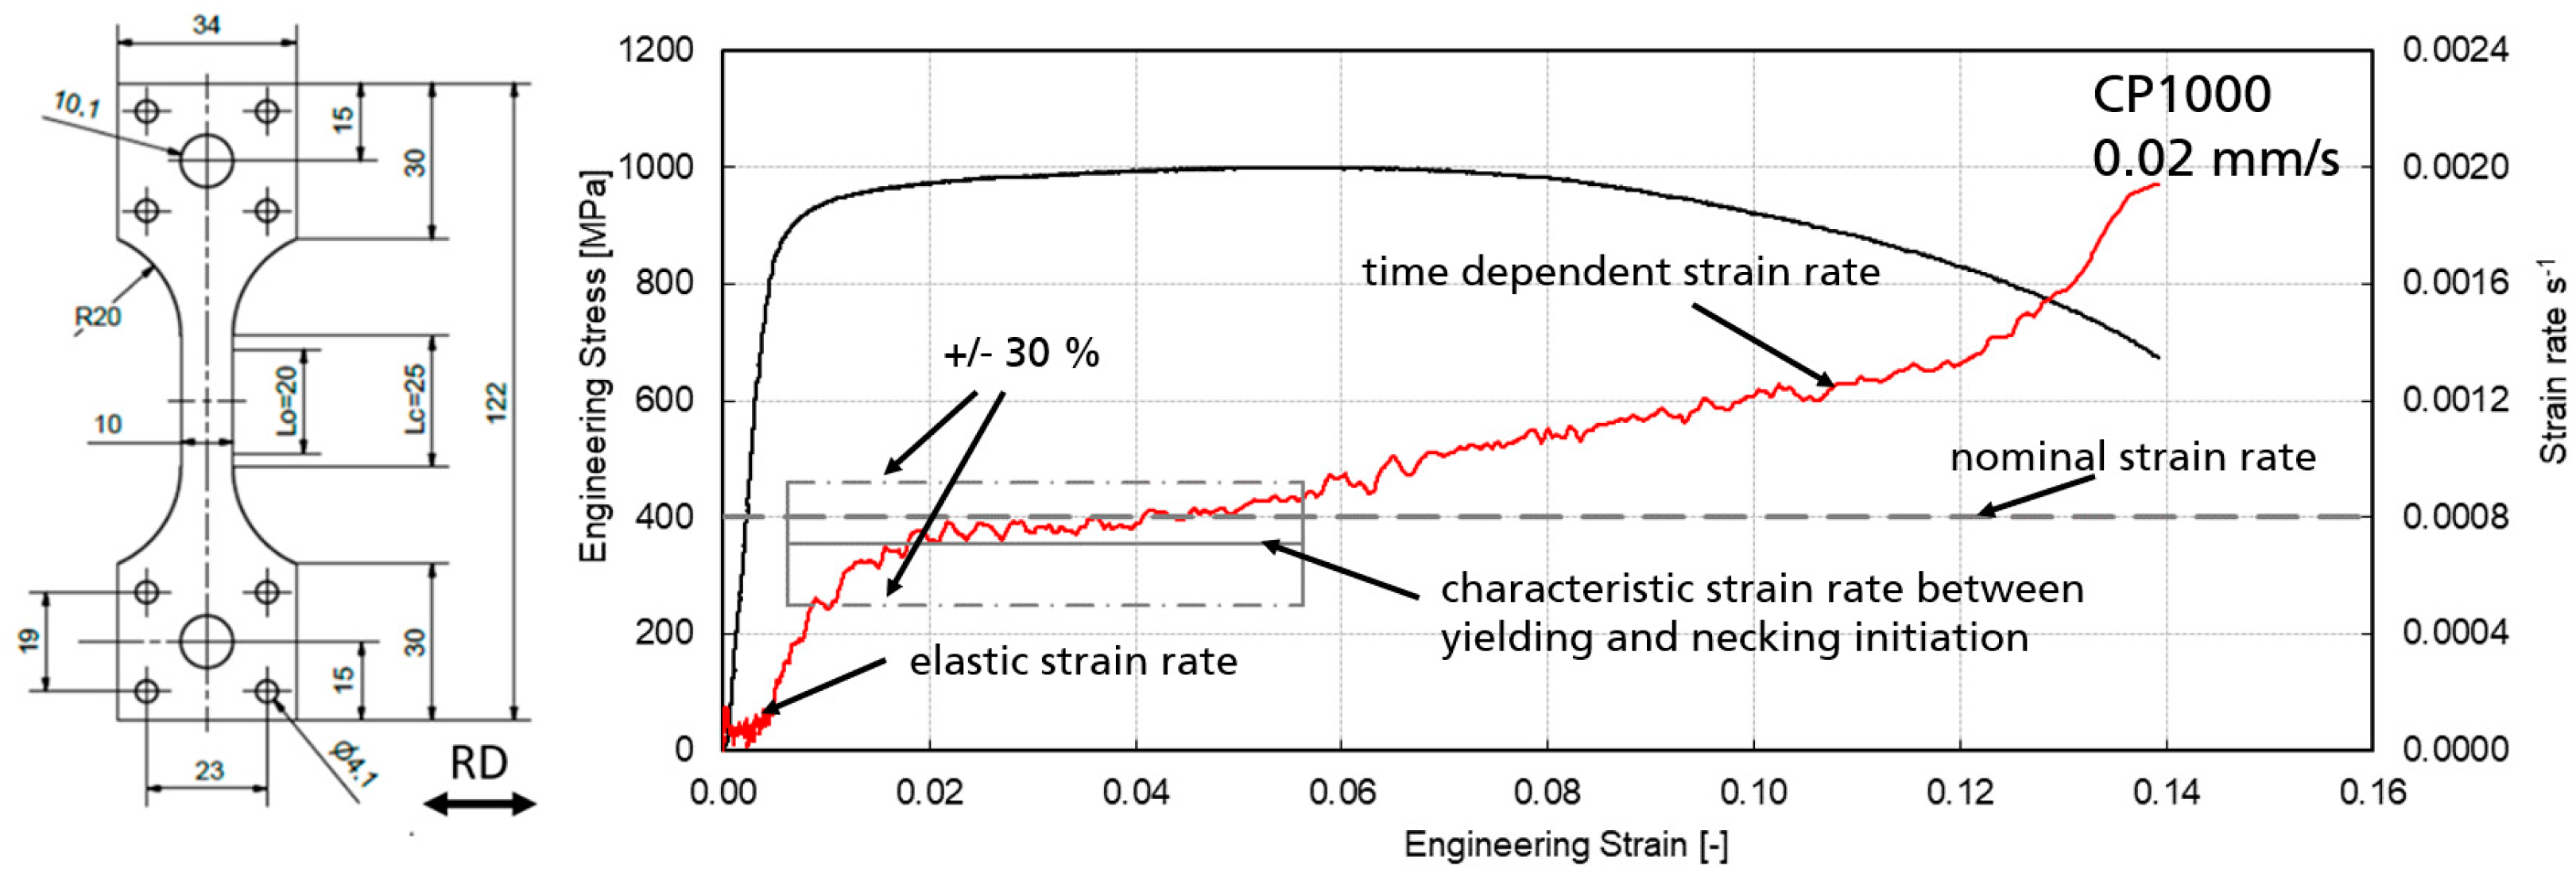
2.4. Tensile Tests
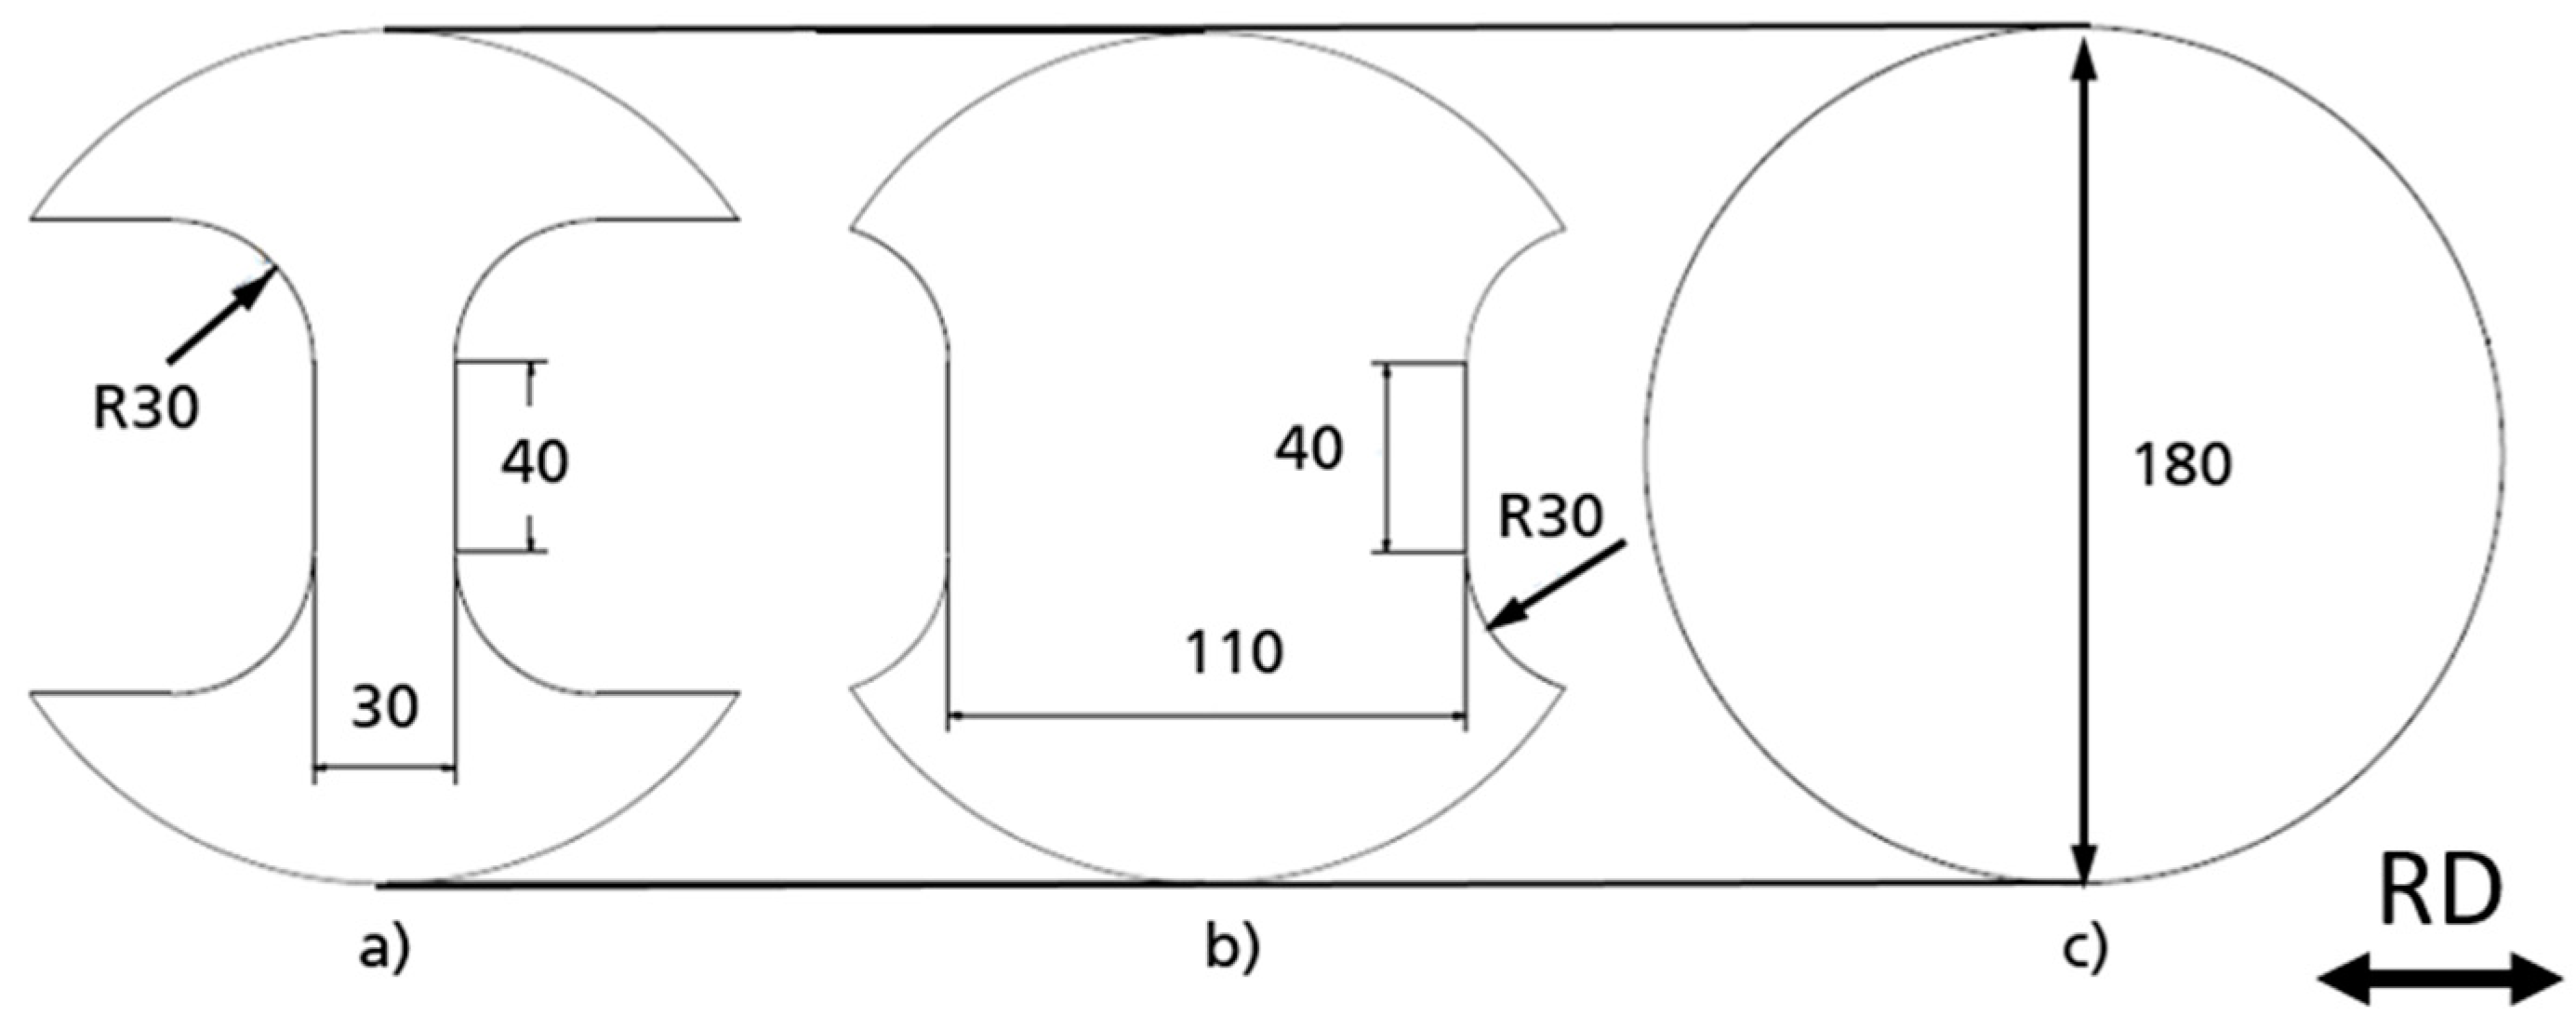
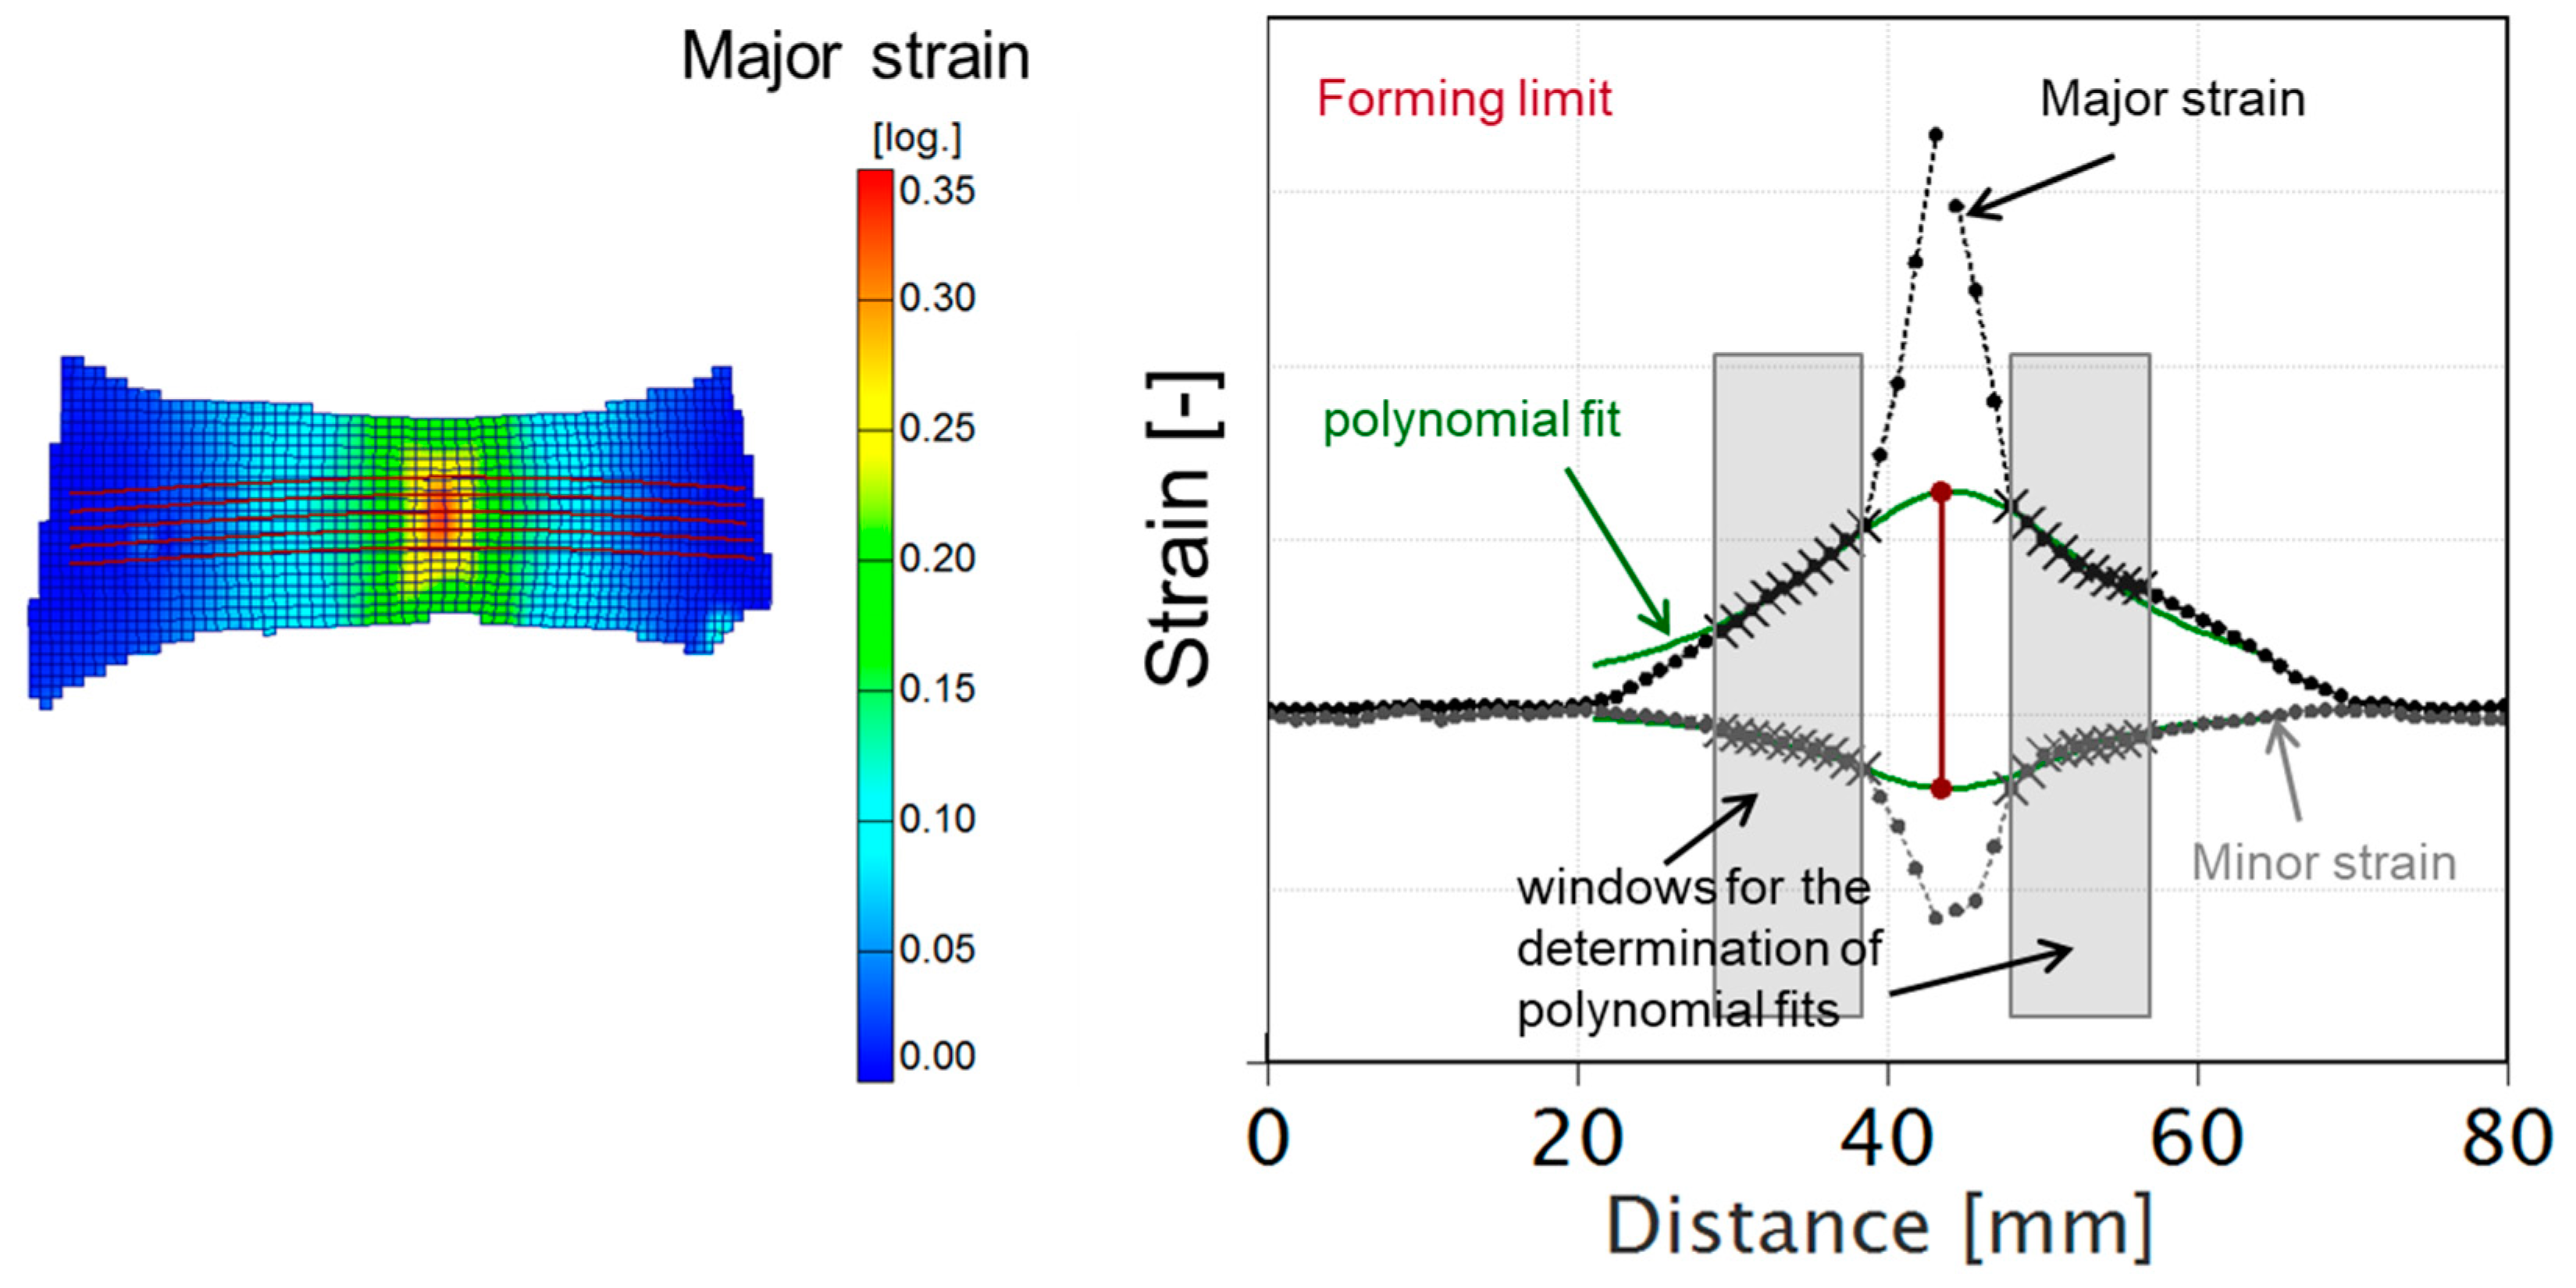
2.5. Nakajima Tests
3. Results
4. Discussion
5. Summary
- (1)
- The tensile tests on non-charged and electrochemically precharged specimens showed that hydrogen embrittlement is effectively independent of the strain rate in the investigated range from 0.00004 s−1 up to a forming relevant strain rate of 0.01 s−1.
- (2)
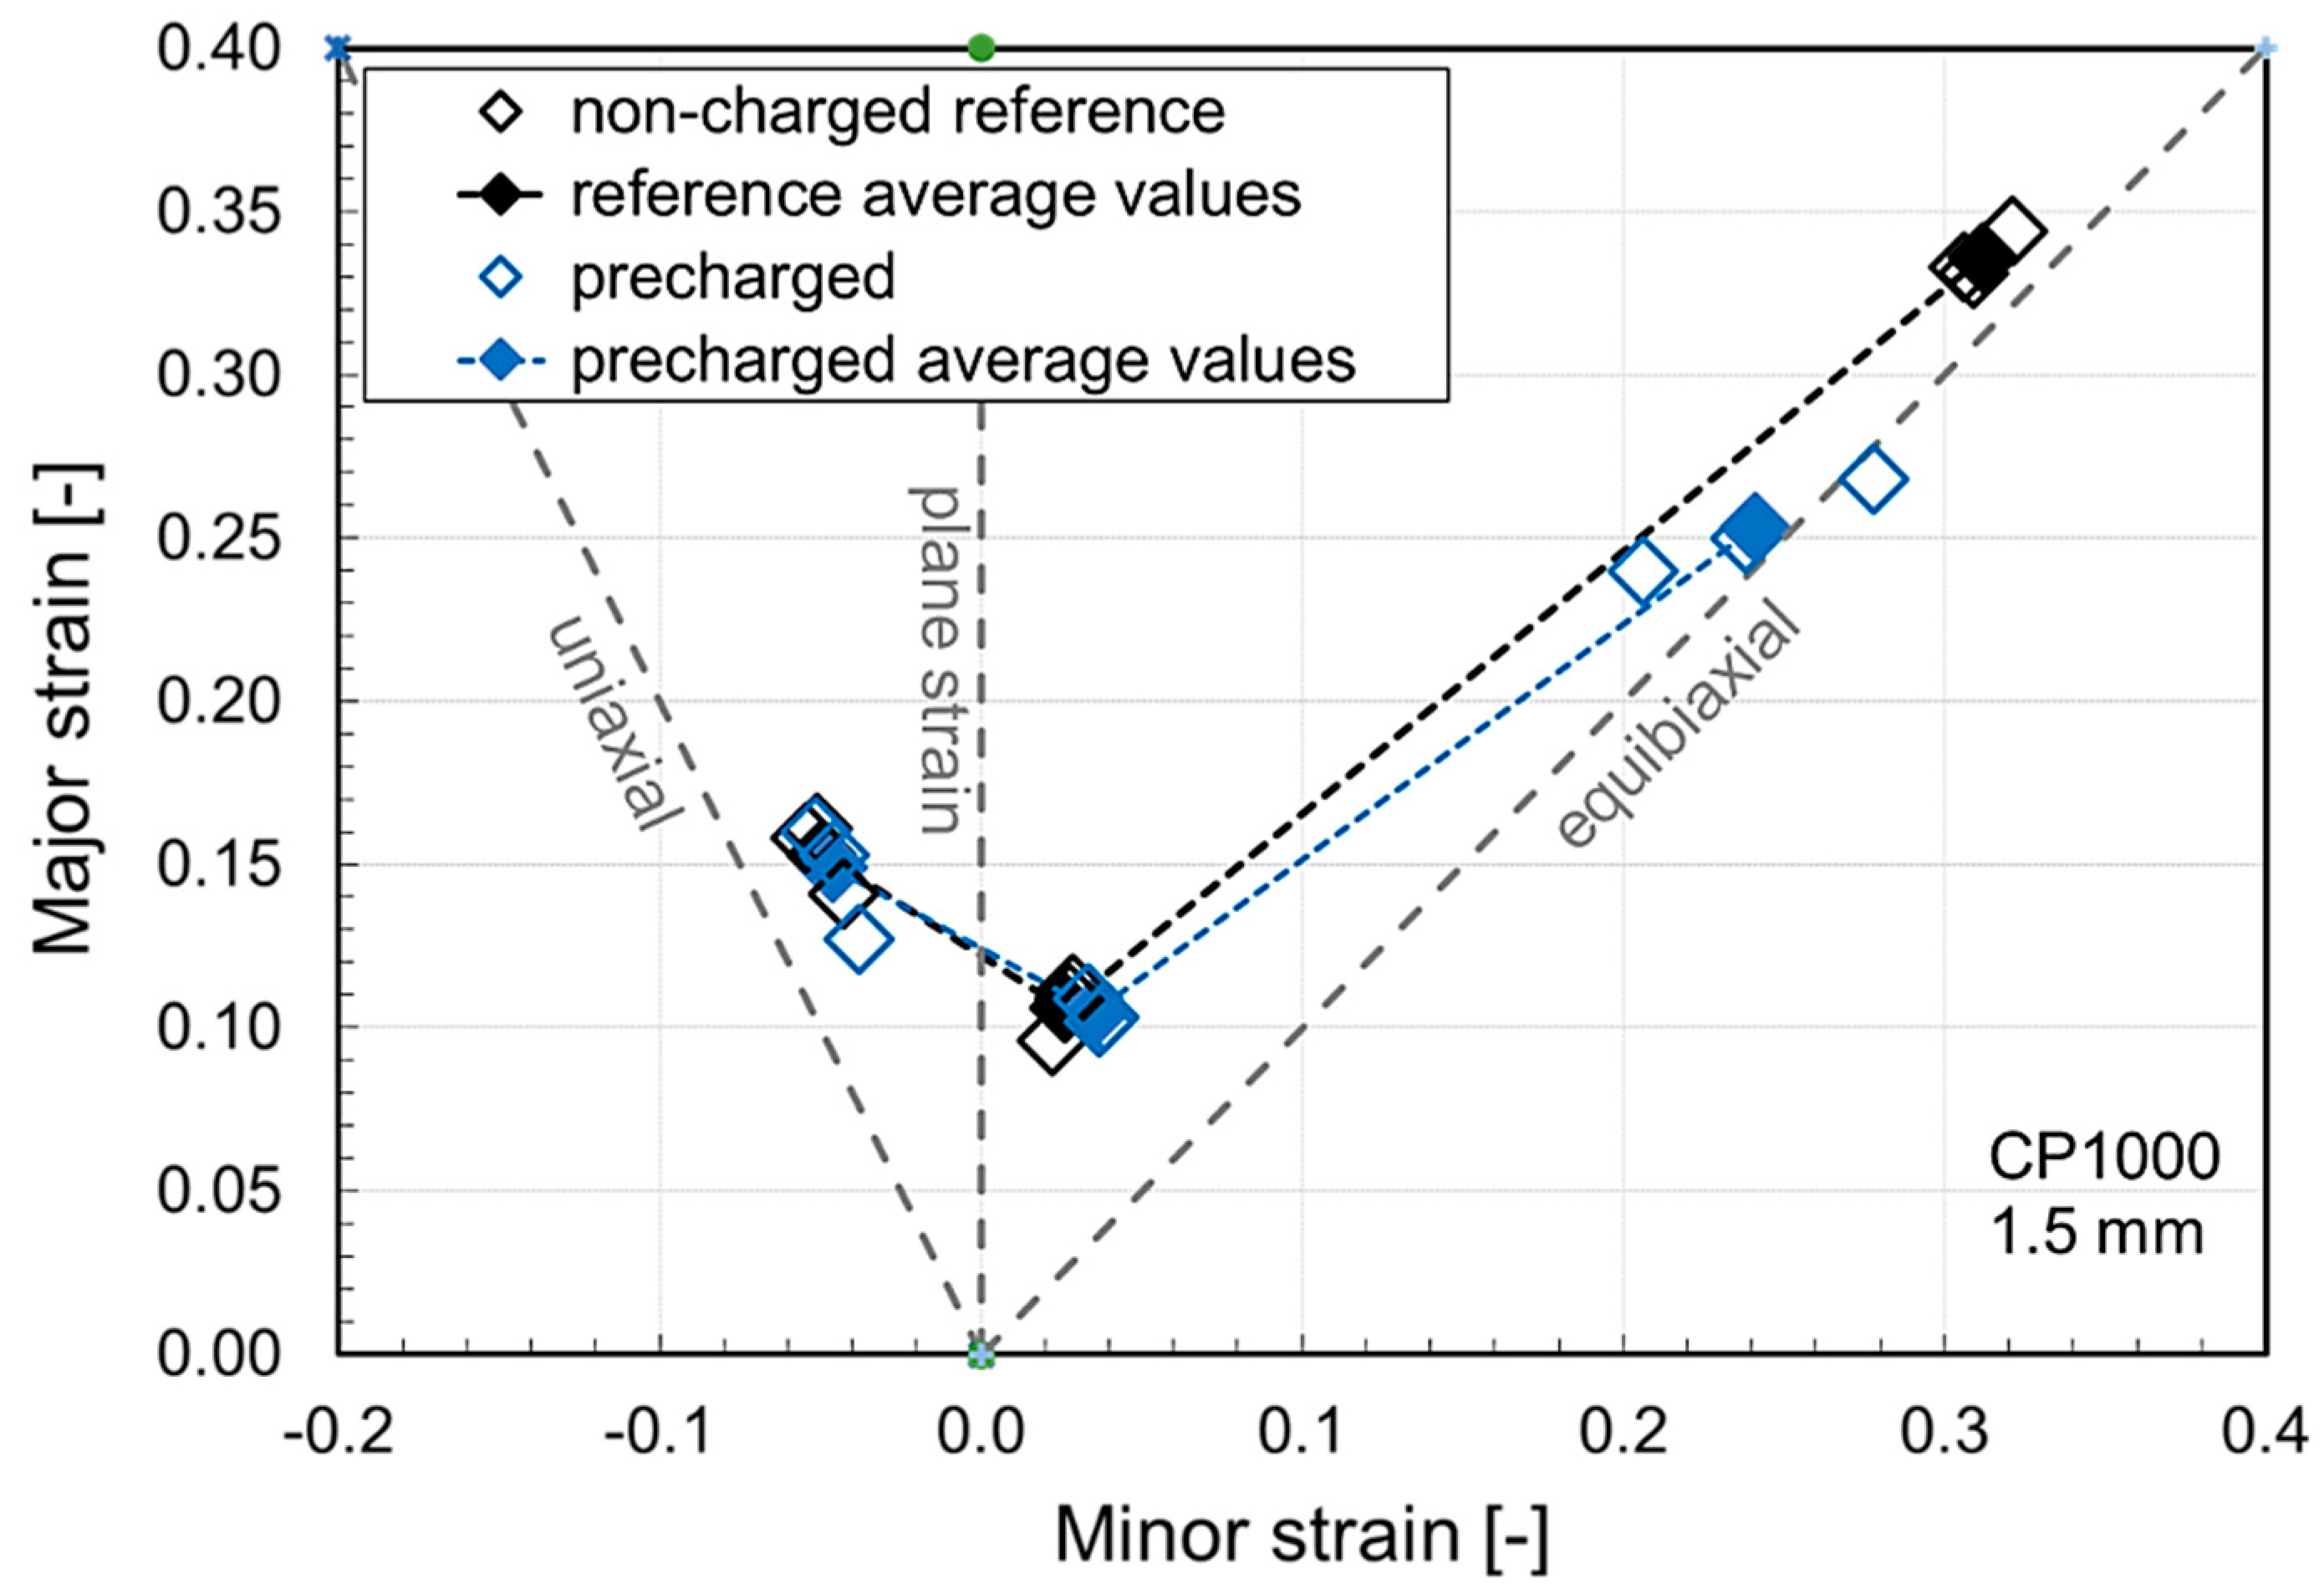
- The Nakajima tests showed that the influence of hydrogen on the beginning of localized necking strongly depends on the stress state. For the equibiaxial stress state, localization of necking starts earlier for the precharged specimens than for the non-charged specimens. Critically, the local failure strain was reduced for all the Nakajima specimens tested with hydrogen precharging.
- (3)
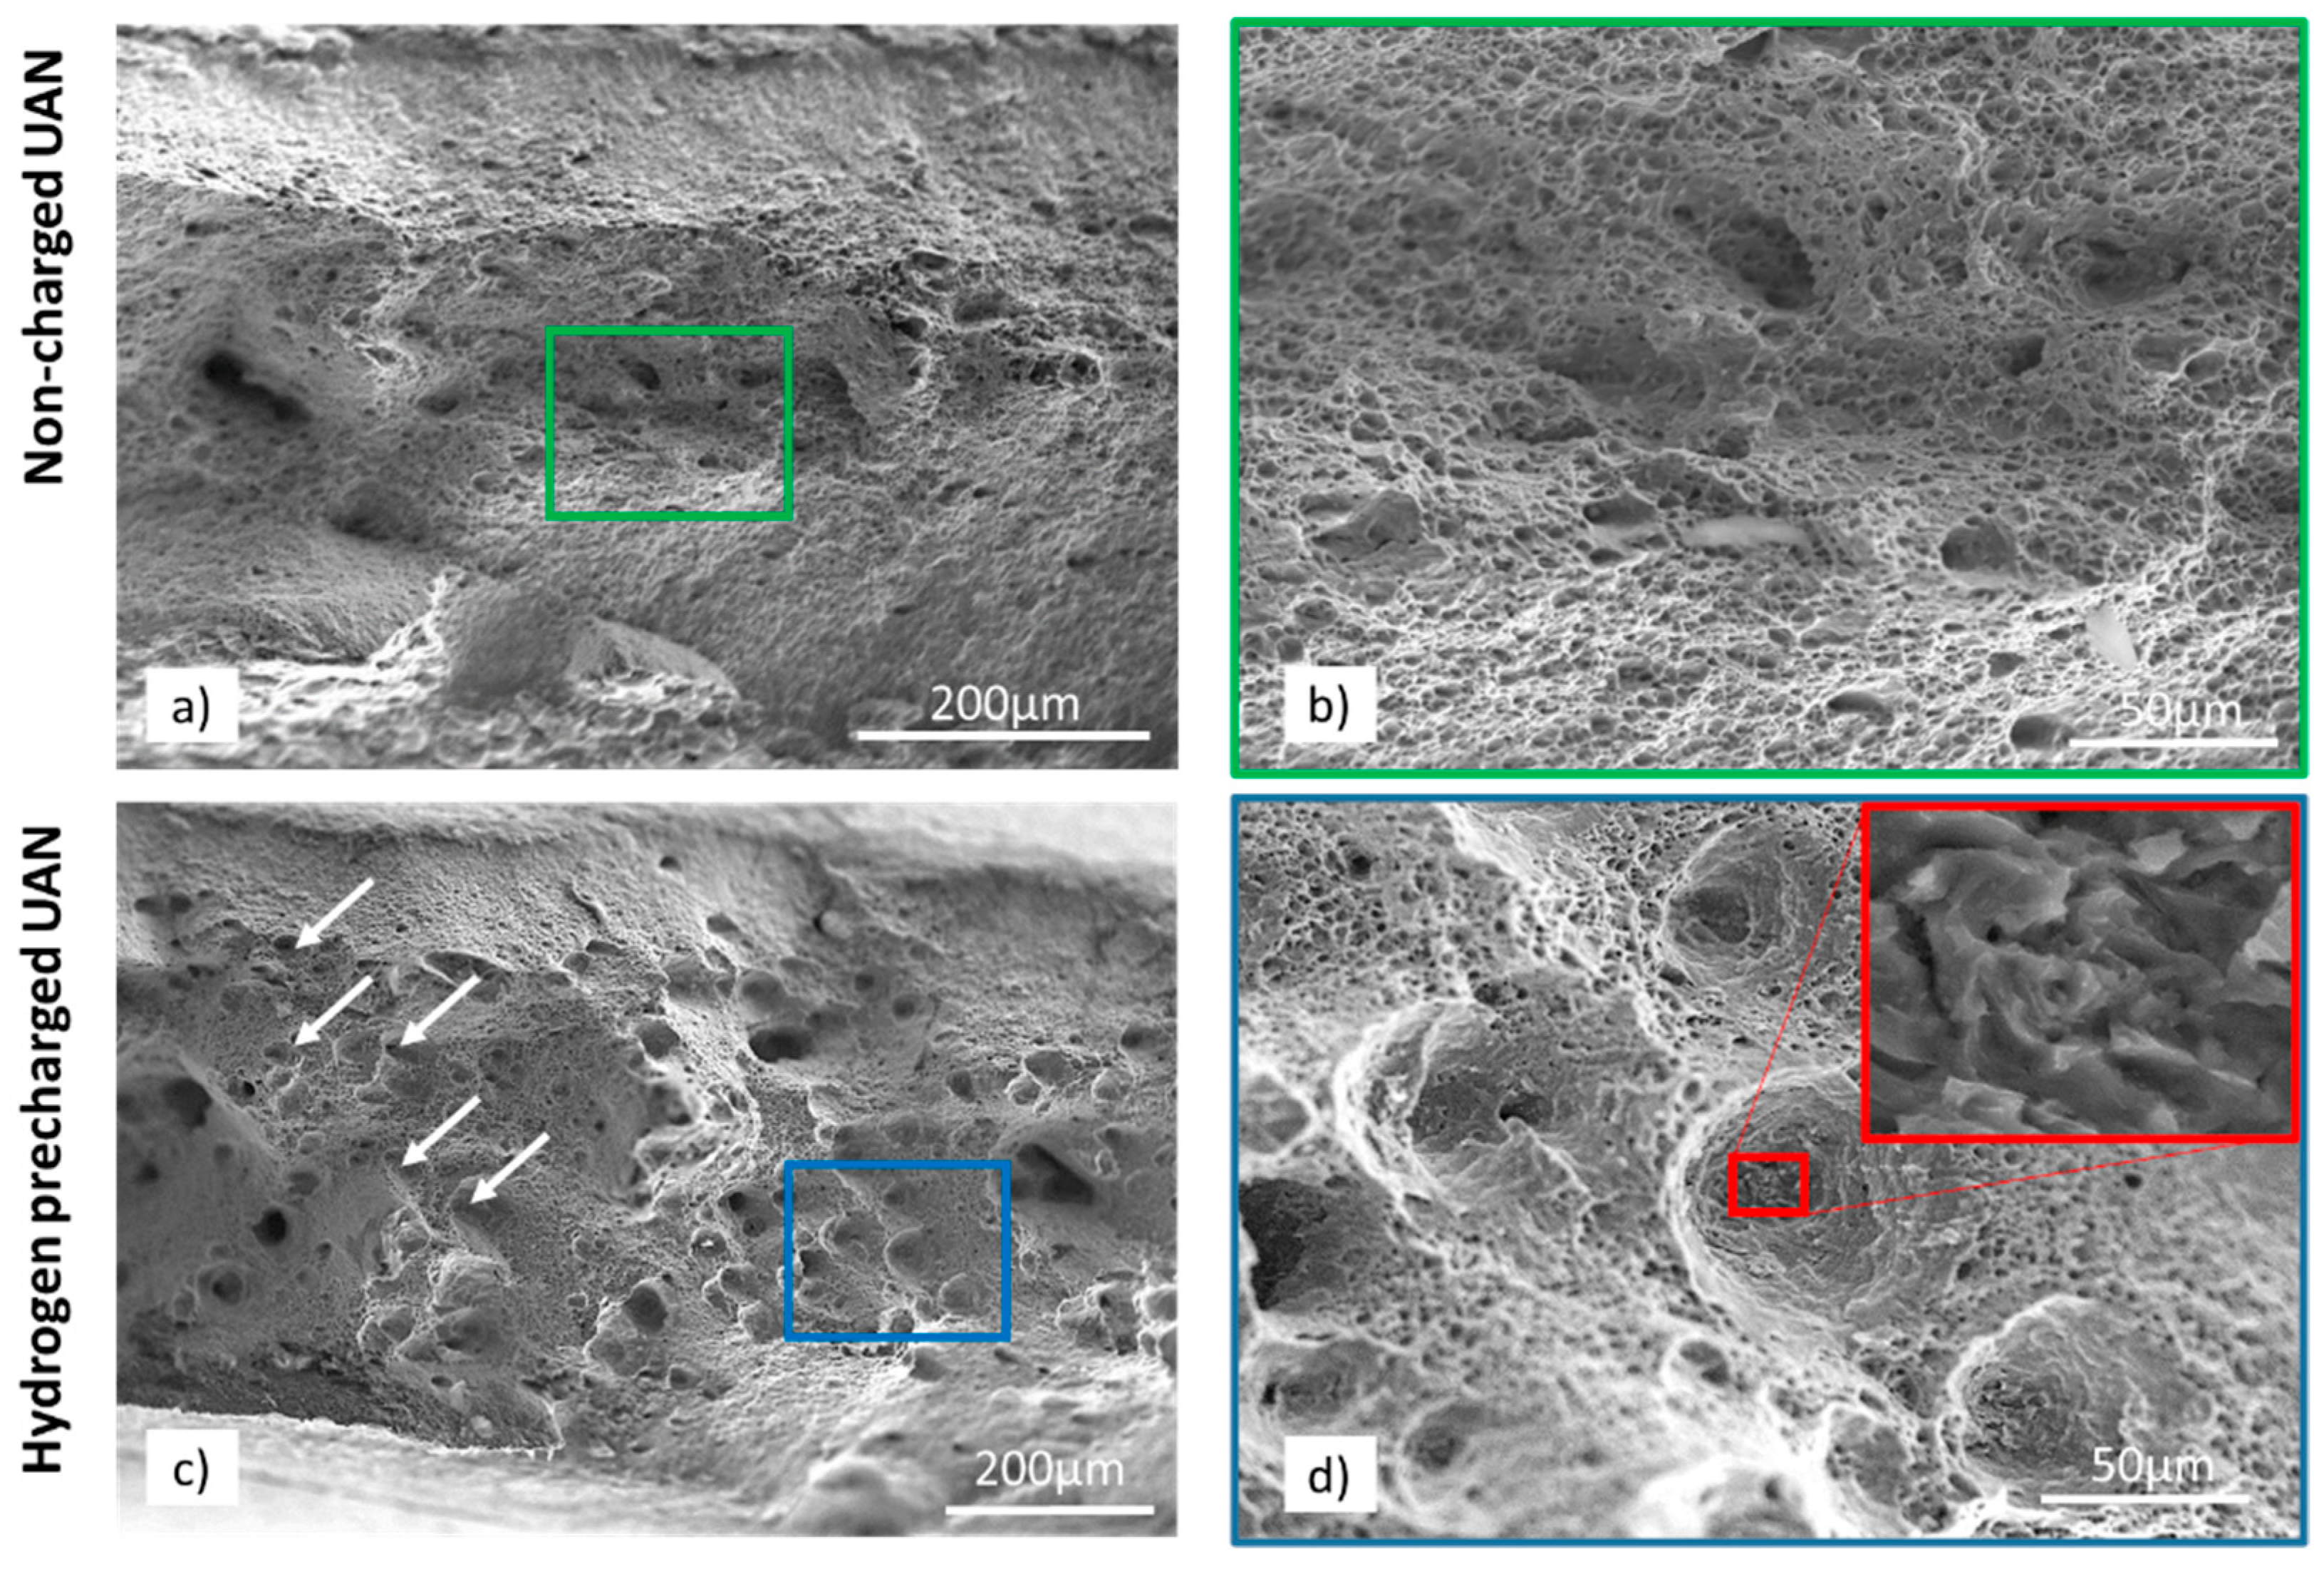
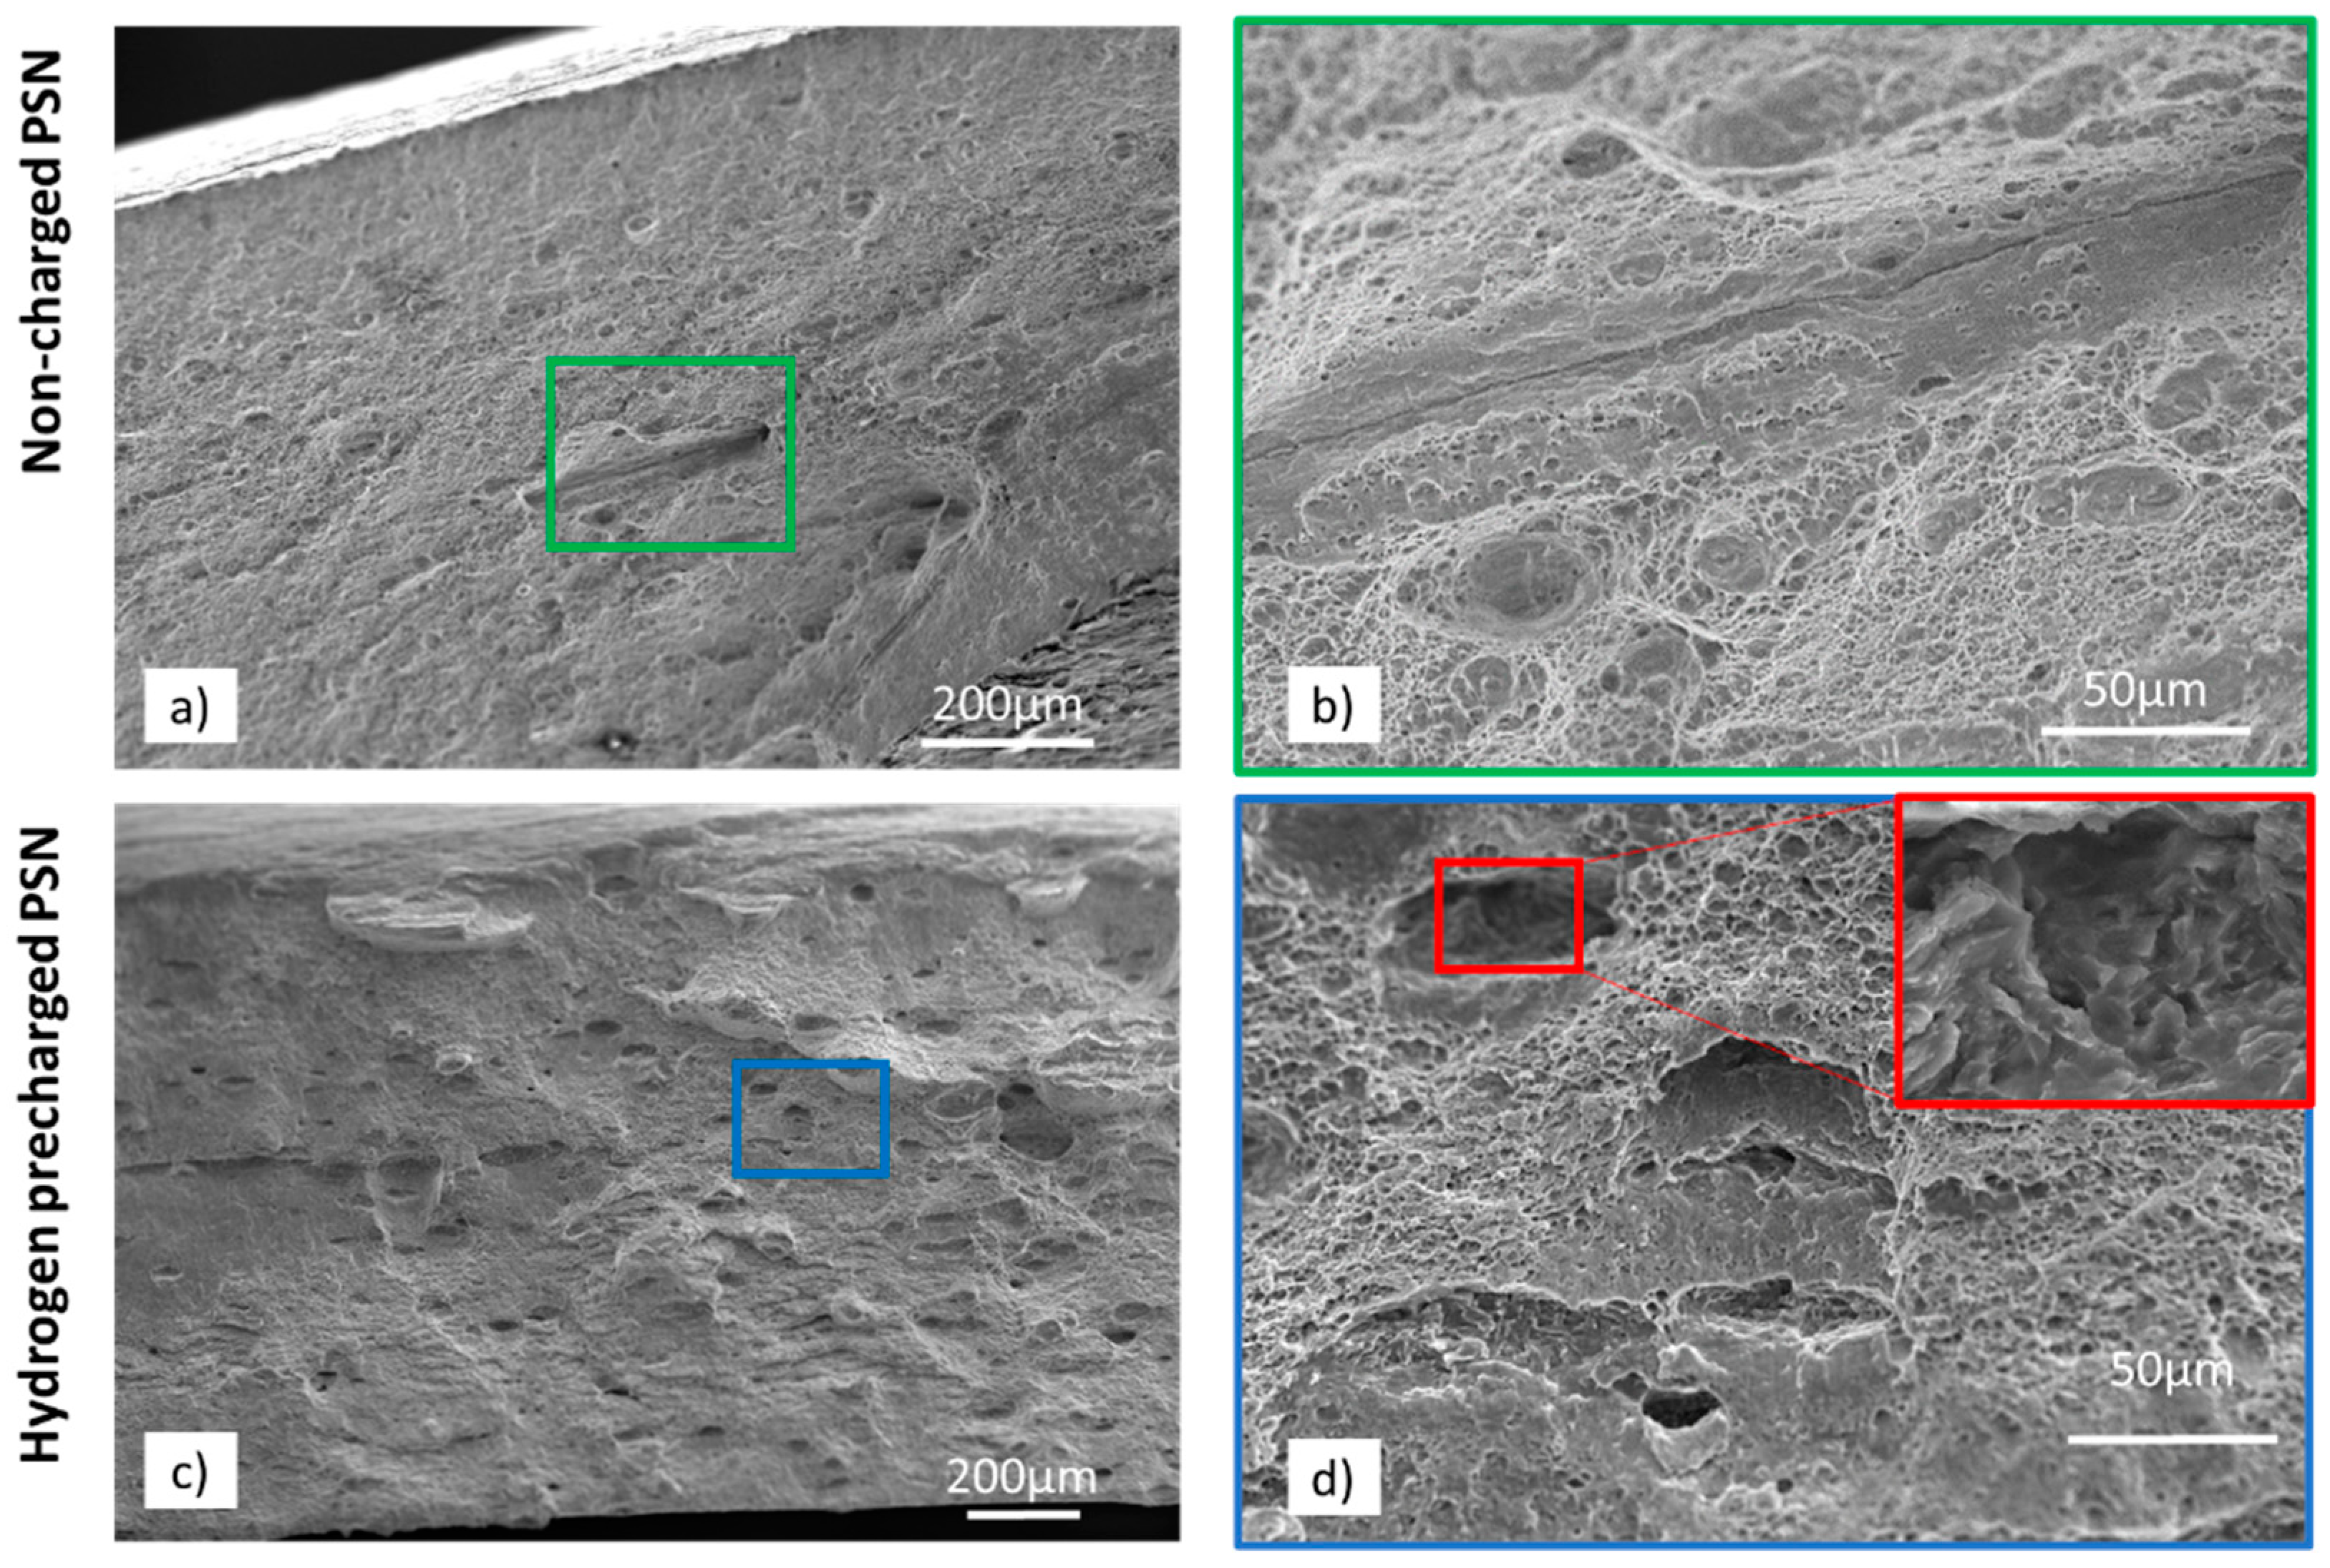
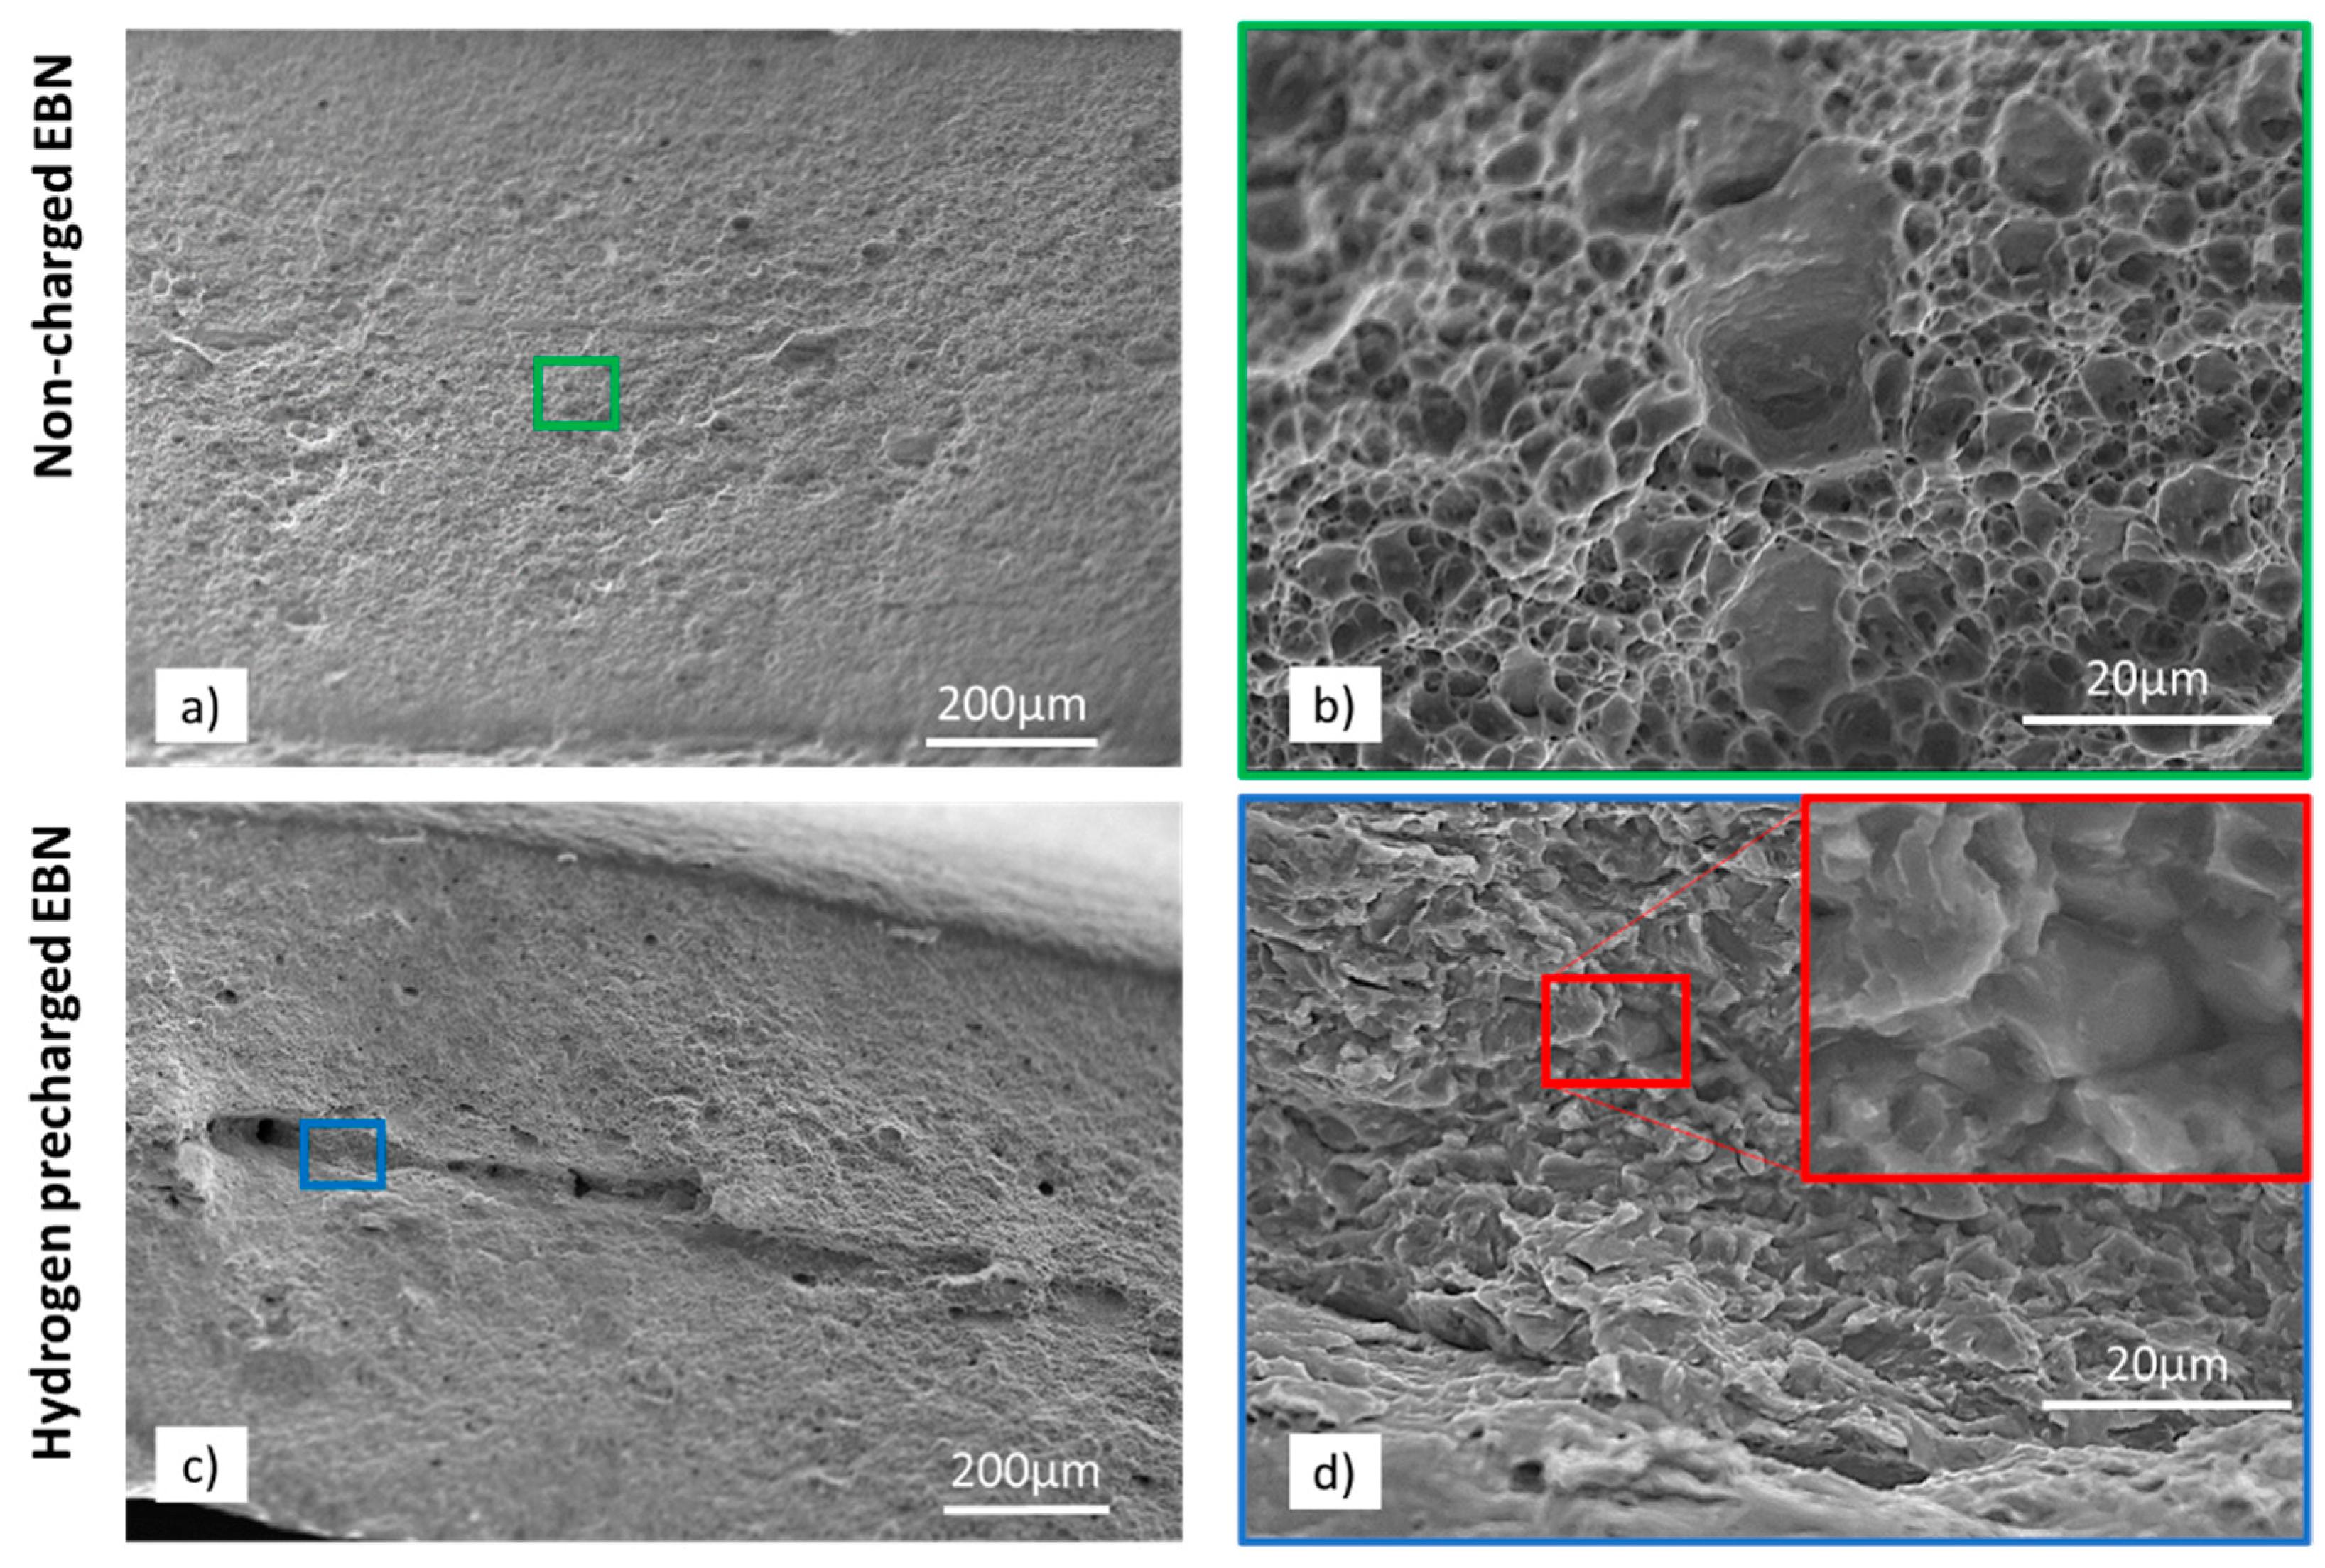
- The subsequent evaluation of fracture surfaces showed an observable increase in the occurrence of local brittle fracture initiation for the precharged specimens.
Author Contributions
Funding
Data Availability Statement
Acknowledgments
Conflicts of Interest
References
- Ferrin, P.; Kandoi, S.; Nilekar, A.U.; Mavrikakis, M. Hydrogen Adsorption, Absorption and Diffusion on and in Transition Metal Surfaces: A DFT Study. Surf. Sci. 2012, 606, 679–689. [Google Scholar] [CrossRef]
- Pundt, A.; Kirchheim, R. Hydrogen in Metals: Microstructural Aspects. Annu. Rev. Mater. Res. 2006, 36, 555–608. [Google Scholar] [CrossRef]
- Hans Jürgen Grabke, E.R. Absorption and Diffusion of Hydrogen in Steels. Mater. Tehnol. 2000, 34, 331. [Google Scholar]
- Troiano, A.R. The Role of Hydrogen and Other Interstitials in the Mechanical Behavior of Metals. Am. Soc. Met. 1960, 5, 557–569. [Google Scholar] [CrossRef]
- Jiang, D.E.; Carter, E.A. First Principles Assessment of Ideal Fracture Energies of Materials with Mobile Impurities: Implications for Hydrogen Embrittlement of Metals. Acta Mater. 2004, 52, 4801–4807. [Google Scholar] [CrossRef]
- Birnbaum, H.K.; Sofronis, P. Hydrogen-Enhanced Localized Plasticity—A Mechanism for Hydrogen-Related Fracture. Mater. Sci. Eng. A 1994, 176, 191–202. [Google Scholar] [CrossRef]
- Sofronis, P.; Birnbaum, H.K. Mechanics of the Hydrogen-Dislocation-Impurity Interactions-I. Increasing Shear Modulus. J. Mech. Phys. Solids 1995, 43, 49–90. [Google Scholar] [CrossRef]
- Ferreira, P.J.; Robertson, I.M.; Birnbaum, H.K. Hydrogen Effects on the Interaction between Dislocations. Acta Mater. 1998, 46, 1749–1757. [Google Scholar] [CrossRef] [Green Version]
- Lynch, S. Hydrogen Embrittlement Phenomena and Mechanisms. Corros. Rev. 2012, 30, 105–123. [Google Scholar] [CrossRef]
- Djukic, M.B.; Bakic, G.M.; Sijacki Zeravcic, V.; Sedmak, A.; Rajicic, B. The Synergistic Action and Interplay of Hydrogen Embrittlement Mechanisms in Steels and Iron: Localized Plasticity and Decohesion. Eng. Fract. Mech. 2019, 216, 26–31. [Google Scholar] [CrossRef]
- Marchi, C.S.; Somerday, B.P.; Robinson, S.L. Permeability, Solubility and Diffusivity of Hydrogen Isotopes in Stainless Steels at High Gas Pressures. Int. J. Hydrogen Energy 2007, 32, 100–116. [Google Scholar] [CrossRef]
- Lovicu, G.; Bottazzi, M.; D’aiuto, F.; De Sanctis, M.; Dimatteo, A.; Santus, C.; Valentini, R. Hydrogen Embrittlement of Automotive Advanced High-Strength Steels. Metall. Mater. Trans. A Phys. Metall. Mater. Sci. 2012, 43, 4075–4087. [Google Scholar] [CrossRef]
- Scharf, R.; Muhr, A.; Luckeneder, G.; Larour, P.; Mraczek, K.; Rehrl, J.; Leomann, F.; Stellnberger, K.H.; Faderl, J.; Mori, G. Hydrogen Embrittlement of DP-1000 Flat Steel Sheet: Influence of Mechanical Properties, Specimen Geometry, Pre-Damaging and Electrolytically Zinc Galvanizing. Mater. Corros. 2016, 67, 239–250. [Google Scholar] [CrossRef]
- Rehrl, J.; Mraczek, K.; Pichler, A.; Werner, E. Mechanical Properties and Fracture Behavior of Hydrogen Charged AHSS/UHSS Grades at High- and Low Strain Rate Tests. Mater. Sci. Eng. A 2014, 590, 360–367. [Google Scholar] [CrossRef]
- Koyama, M.; Tasan, C.C.; Akiyama, E.; Tsuzaki, K.; Raabe, D. Hydrogen-Assisted Decohesion and Localized Plasticity in Dual-Phase Steel. Acta Mater. 2014, 70, 174–187. [Google Scholar] [CrossRef]
- Depover, T.; Pérez Escobar, D.; Wallaert, E.; Zermout, Z.; Verbeken, K. Effect of Hydrogen Charging on the Mechanical Properties of Advanced High Strength Steels. Int. J. Hydrogen Energy 2014, 39, 4647–4656. [Google Scholar] [CrossRef]
- Gao, Q.; Han, F.; Wortberg, D.; Bleck, W.; Liewald, M. Influence of Hydrogen on Formability and Bendability of DP1180 Steel for Car Body Application. IOP Conf. Ser. Mater. Sci. Eng. 2016, 159, 012010. [Google Scholar] [CrossRef]
- Drexler, A.; Bergmann, C.; Manke, G.; Kokotin, V.; Mraczek, K.; Leitner, S.; Pohl, M.; Ecker, W. Local Hydrogen Accumulation after Cold Forming and Heat Treatment in Punched Advanced High Strength Steel Sheets. J. Alloys Compd. 2021, 856, 158226. [Google Scholar] [CrossRef]
- DIN EN ISO 12004-2:2021; Metallische Werkstoffe—Bleche und Bänder—Bestimmung der Grenzformänderungskurve. Beuth Verlag GmbH: Berlin, Germany, 2021.
- Nakazima, K.; Kikuma, T.; Hasuka, K. Study of the Formability of Steel Sheets. Yamata Tech Rep. 1968, 264, 8517–8530. [Google Scholar]
- Huberth, F.; Klitschke, S.; Trondl, A. Dehnratenabhängiges Verformungs- und Versagensverhalten von dünnen Blechen unter Scherbelastung. FAT-Schriftenreihe 2019, 319. [Google Scholar] [CrossRef]
- Heibel, S.; Dettinger, T.; Nester, W.; Clausmeyer, T.; Tekkaya, A. Damage Mechanisms and Mechanical Properties of High-Strength Multiphase Steels. Materials 2018, 11, 761. [Google Scholar] [CrossRef] [PubMed] [Green Version]
- Data sheet complex phase steels. Voestalpine Steel Div. 2018, HCT980C. Available online: https://www.voestalpine.com/stahl/content/download/4522/file/Complexphasen-Sta%CC%88hle-voestalpine-DE-141021.pdf (accessed on 4 October 2022).
- ISO 26203-2:2011; Metallic Materials—Tensile Testing at High Strain Rates—Part 2: Servo-Hydraulic and Other Test Systems. ISO: Geneve, Switzerland, 2011.
- Böhme, W. FAT-Richtlinie “Dynamische Werkstoffkennwerte Für Die Crashsimulation”. Mater. Test. 2008, 50, 199–205. [Google Scholar] [CrossRef]
- Trondl, A.; Klitschke, S.; Böhme, W.; Sun, D.-Z. Verformungs- und Versagensverhalten von Stählen für den Automobilbau unter crashartiger Belastung. FAT-Schriftenreihe 2015, 283, 105. [Google Scholar]
- Klitschke, S.; Böhme, W. Deformation and Damage Behavior of Lightweight Steels at High Rate Multiaxial Loading. Mater. Test. 2016, 58, 173–181. [Google Scholar] [CrossRef]
- Klitschke, S.; Ebling, F.; Discher, D.; Preußner, J.; Wackermann, K. Effect of Hydrogen on the Formability and Fracture Behaviour of High Strength Multiphase Steels under Multiaxial Loading. In Proceedings of the Conference on SCT2022, Steels Cars Truck, Milano, Italy, 19–23 June 2022. [Google Scholar]
- ARAMIS Benutzerhandbuch—Software, ARAMIS v6.1 und höher; Carl Zeiss GOM Metrology GmbH: Braunschweig, Germany, 2009.
- Keeler, S.; Backofen, W. Plastic Instability and Fracture in Sheets Streched over Rigid Punches. Trans. Am. Soc. Met. 1963, 56, 25–48. [Google Scholar]
- ASTM G129-00(2013); Standard Practice for Slow Strain Rate Testing to Evaluate the Susceptibility of Metallic Materials to Environmentally Assisted Cracking. ASTM International: West Conshohocken, PA USA, 2013. [CrossRef]
- Jia, H.; Zhang, X.; Xu, J.; Sun, Y.; Li, J. Effect of Hydrogen Content and Strain Rate on Hydrogen-Induced Delay Cracking for Hot-Stamped Steel. Metals 2019, 9, 798. [Google Scholar] [CrossRef] [Green Version]
- Bal, B.; Koyama, M.; Gerstein, G.; Maier, H.J.; Tsuzaki, K. Effect of Strain Rate on Hydrogen Embrittlement Susceptibility of Twinning-Induced Plasticity Steel Pre-Charged with High-Pressure Hydrogen Gas. Int. J. Hydrogen Energy 2016, 41, 15362–15372. [Google Scholar] [CrossRef] [Green Version]
- Hojo, T.; Kikuchi, R.; Waki, H.; Nishimura, F.; Ukai, Y.; Akiyama, E. Effect of Strain Rate on the Hydrogen Embrittlement Property of Ultra High-Strength Low-Alloy Trip-Aided Steel. Tetsu-to-Hagane/J. Iron Steel Inst. Jpn. 2019, 105, 33–41. [Google Scholar] [CrossRef]
- Michler, T.; Lindner, M.; Eberle, U.; Meusinger, J. Assessing Hydrogen Embrittlement in Automotive Hydrogen Tanks. In Gaseous Hydrogen Embrittlement of Materials in Energy Technologie, The Problem, its Characterisation and Effects on Particular Alloy Classes; Woodhead Publishing: Cambridge, UK, 2012; pp. 94–125. [Google Scholar] [CrossRef]
- Depover, T.; Elmahdy, A.; Vercruysse, F.; Verleysen, P.; Verbeken, K. Effect of Strain Rate on the Hydrogen Embrittlement of a DP Steel. In EPJ Web of Conferences; EDP Sciences: Les Ulis, France, 2018; Volume 183, pp. 1–6. [Google Scholar] [CrossRef]
- Hora, P.; Tong, L.; Reissner, J. A Prediction Method for Ductile Sheet Metal Failure in Fe-Simulation. In Proceedings of the NUMISHEET, Dearborn, MI, USA, 29 September–3 October 1996; Volume 11, pp. 252–256. [Google Scholar]
- Asadipoor, M.; Kadkhodapour, J.; Pourkamali Anaraki, A.; Sharifi, S.M.H.; Darabi, A.C.; Barnoush, A. Experimental and Numerical Investigation of Hydrogen Embrittlement Effect on Microdamage Evolution of Advanced High-Strength Dual-Phase Steel. Met. Mater. Int. 2021, 27, 2276–2291. [Google Scholar] [CrossRef]


| Fe | C | Si | Mn | P | S | Cr | Mo | Ni |
|---|---|---|---|---|---|---|---|---|
| bal. | 0.30 | 0.32 | 2.34 | 0.028 | 0.030 | 0.22 | 0.02 | 0.02 |
| Al | Co | Cu | Nb | Ti | V | W | Pb | |
| 1.45 | 0.02 | 0.03 | 0.03 | 0.07 | 0.02 | 0.09 | 0.03 |
| Solution | Current Density [mA/cm²] | Time [h] |
|---|---|---|
| 0.1 mol NaOH + 1 g/L CH4N2S | 1 | 5 |
| Condition | Crosshead Speed [mm/s] | Rp0,2 [MPa] | Rm [MPa] | εf [%] | RA [%] |
|---|---|---|---|---|---|
| Non-charged | 0.001 | 906 | 998 | 13.7 | 55.5 |
| Non-charged | 0.02 | 894 | 1002 | 13.7 | 53.0 |
| Non-charged | 0.25 | 912 | 1005 | 12.6 | 55.1 |
| Precharged | 0.001 | 939 | 1020 | 9.6 | 42.9 |
| Precharged | 0.02 | 940 | 1019 | 9.0 | 43.6 |
| Precharged | 0.25 | 942 | 1024 | 8.4 | 39.1 |
Publisher’s Note: MDPI stays neutral with regard to jurisdictional claims in published maps and institutional affiliations. |
© 2022 by the authors. Licensee MDPI, Basel, Switzerland. This article is an open access article distributed under the terms and conditions of the Creative Commons Attribution (CC BY) license (https://creativecommons.org/licenses/by/4.0/).
Share and Cite
Ebling, F.; Klitschke, S.; Wackermann, K.; Preußner, J. The Effect of Hydrogen on Failure of Complex Phase Steel under Different Multiaxial Stress States. Metals 2022, 12, 1705. https://doi.org/10.3390/met12101705
Ebling F, Klitschke S, Wackermann K, Preußner J. The Effect of Hydrogen on Failure of Complex Phase Steel under Different Multiaxial Stress States. Metals. 2022; 12(10):1705. https://doi.org/10.3390/met12101705
Chicago/Turabian StyleEbling, Fabien, Silke Klitschke, Ken Wackermann, and Johannes Preußner. 2022. "The Effect of Hydrogen on Failure of Complex Phase Steel under Different Multiaxial Stress States" Metals 12, no. 10: 1705. https://doi.org/10.3390/met12101705