Article

Application of Transformation Treatment to Commercial Low-Grade Electrical Steels under Different Processing Conditions

1
School of Materials Science and Engineering, University of Science and Technology Beijing, Beijing 100083, China
2
Angang Group, Iron and Steel Research Institute, Anshan 114000, China
*
Author to whom correspondence should be addressed.
Metals 2022, 12(10), 1628; https://doi.org/10.3390/met12101628
Submission received: 18 August 2022 / Revised: 23 September 2022 / Accepted: 25 September 2022 / Published: 28 September 2022

Abstract

:
In this paper, two low-grade electrical steels are used to inspect the effect of initial columnar grains and final transformation treatment on the microstructure and textures. Results show that the Al and P elements, besides causing the surface oxidation or segregation, increase the critical transformation temperatures of steels, thus restricting the formation of strong {100} texture. Two-layer grain structure of typical surface-effect-induced transformation is developed in the steels without Al. The transformation textures in both steels are nearly random, which are much better than the {111} recrystallization texture or the memory type of transformation texture. The steel with initial columnar grained structure produces more {110}-oriented grains in finally transformed sheets, whereas the initial hot-rolled structure induces more {100}-oriented grains. In addition, high cold rolling reduction produces a one-layer grain structure in the final transformed sheets. It is confirmed again that the increase in final heating temperature leads to a transition from the memory type of transformation texture to surface-effect-induced transformation texture. For commercial steels containing harmful Al and P, the change in processing parameters during transformation treatment does not influence transformed structure and texture. Finally, the combined control of three stages of transformation during casting, hot rolling and final annealing is discussed.

1. Introduction

Low-grade electrical steels have the features of low cost, high production quantity and low profits compared with high-grade ones. It is generally recognized that they can be easily produced with less tendency to strip breakage and edge cracking, thus they are less dependent on production equipment and no special technique is needed. However, due to the presence of solid transformation between austenite and ferrite, the microstructure evolution is complicated and the interaction among deformation, recrystallization and phase transformation is strong during the hot rolling process. According to the knowledge of the transformation in electrical steels, it is normally accepted that the transformation to ferrite during hot rolling leads to grain refinement which is not preferred because it leads to high core loss and stronger {111} texture [1]. Thus, the final annealing temperature is below critical transformation points and during hot rolling, the transformation between austenite and ferrite is controlled to be fully complete after finishing rolling [1]. Some methods are used to increase the grain sizes before cold rolling [2,3,4,5,6], such as the increase in finish rolling temperature, the increase in coiling temperature, or annealing at a low temperature; in turn, the magnetic properties are improved to some extents. It is noted that all of these methods are not related to the control of transformation texture.
For low-grade electrical steels, there are three stages related to the transformation between austenite and ferrite, namely during continuous casting, during the heating of slabs and hot rolling, and during the final annealing of cold rolled sheets. The commercial products are subjected only to recrystallization annealing in the third stage. Based on our previous quasi-in situ observation of the coarse columnar grains structure in cast slabs, it is confirmed that many columnar grains are retained δ ferrite and the transformation from δ ferrite to austenite is delayed or even suppressed in low-grade electrical steels, showing morphological and texture memory effects of {100} columnar grain structure [1,7,8]. We then suggest a new way of increasing {100} texture in hot-rolled bands to improve magnetic properties of final products, namely the so-called metastable ferrite hot rolling method [7]. By making use of this feature of columnar grain structure during transformation, the slabs can be heated quickly to a high temperature of austenite single-phase region, but before pronounced transformation to austenite takes place, hot rolling is conducted on ferrite, thus initial {100} texture can be retained to some extent without the detrimental influence of grain refinement by the transformation to ferrite. This means that the transformation delay or even transformation suppression of columnar grains can be deeply related to or interacted with hot rolling and much work is needed to optimize this process. Our work [1] indicated that hot-rolled bands indeed show various microstructures depending on heating temperature. Our early work on the surface-effect-induced transformation to ferrite which is applied to laboratory-prepared electrical steels containing 0–1.37%Si revealed the good control of the third stage of transformation to ferrite in the final annealing stage and strong {100} texture could be produced successively with the typical two layers of columnar grains [9,10,11,12]. The magnetic properties are much improved. These results are consistent with the works of Sung et al. [13,14,15]. Recent works of Xie et al. [16,17] on Fe-0.5%Mn laboratory-prepared electrical steels with initial columnar grained structure indicate that the direct cold rolling of columnar grains and the cold rolling of hot-rolled sheets similarly show two layers of columnar grained microstructures and {100} textures after final transformation treatment. In addition, they observed that coarse recrystallized grain size and fine transformed grain size were produced at the low rolling reduction of 50%, whereas the high rolling reduction of 90% resulted in a contrary situation. As low-grade electrical steels contain different levels of Si, Al, Mn and P, thus possess various critical transformation temperatures, both composition and processing parameters should influence the effect of surface-effect-induced transformation to ferrite and this work reports the results of applying transformation treatment to two low-grade electrical steels. Finally, the suitability of transformation treatment on commercial steels during final annealing is discussed.

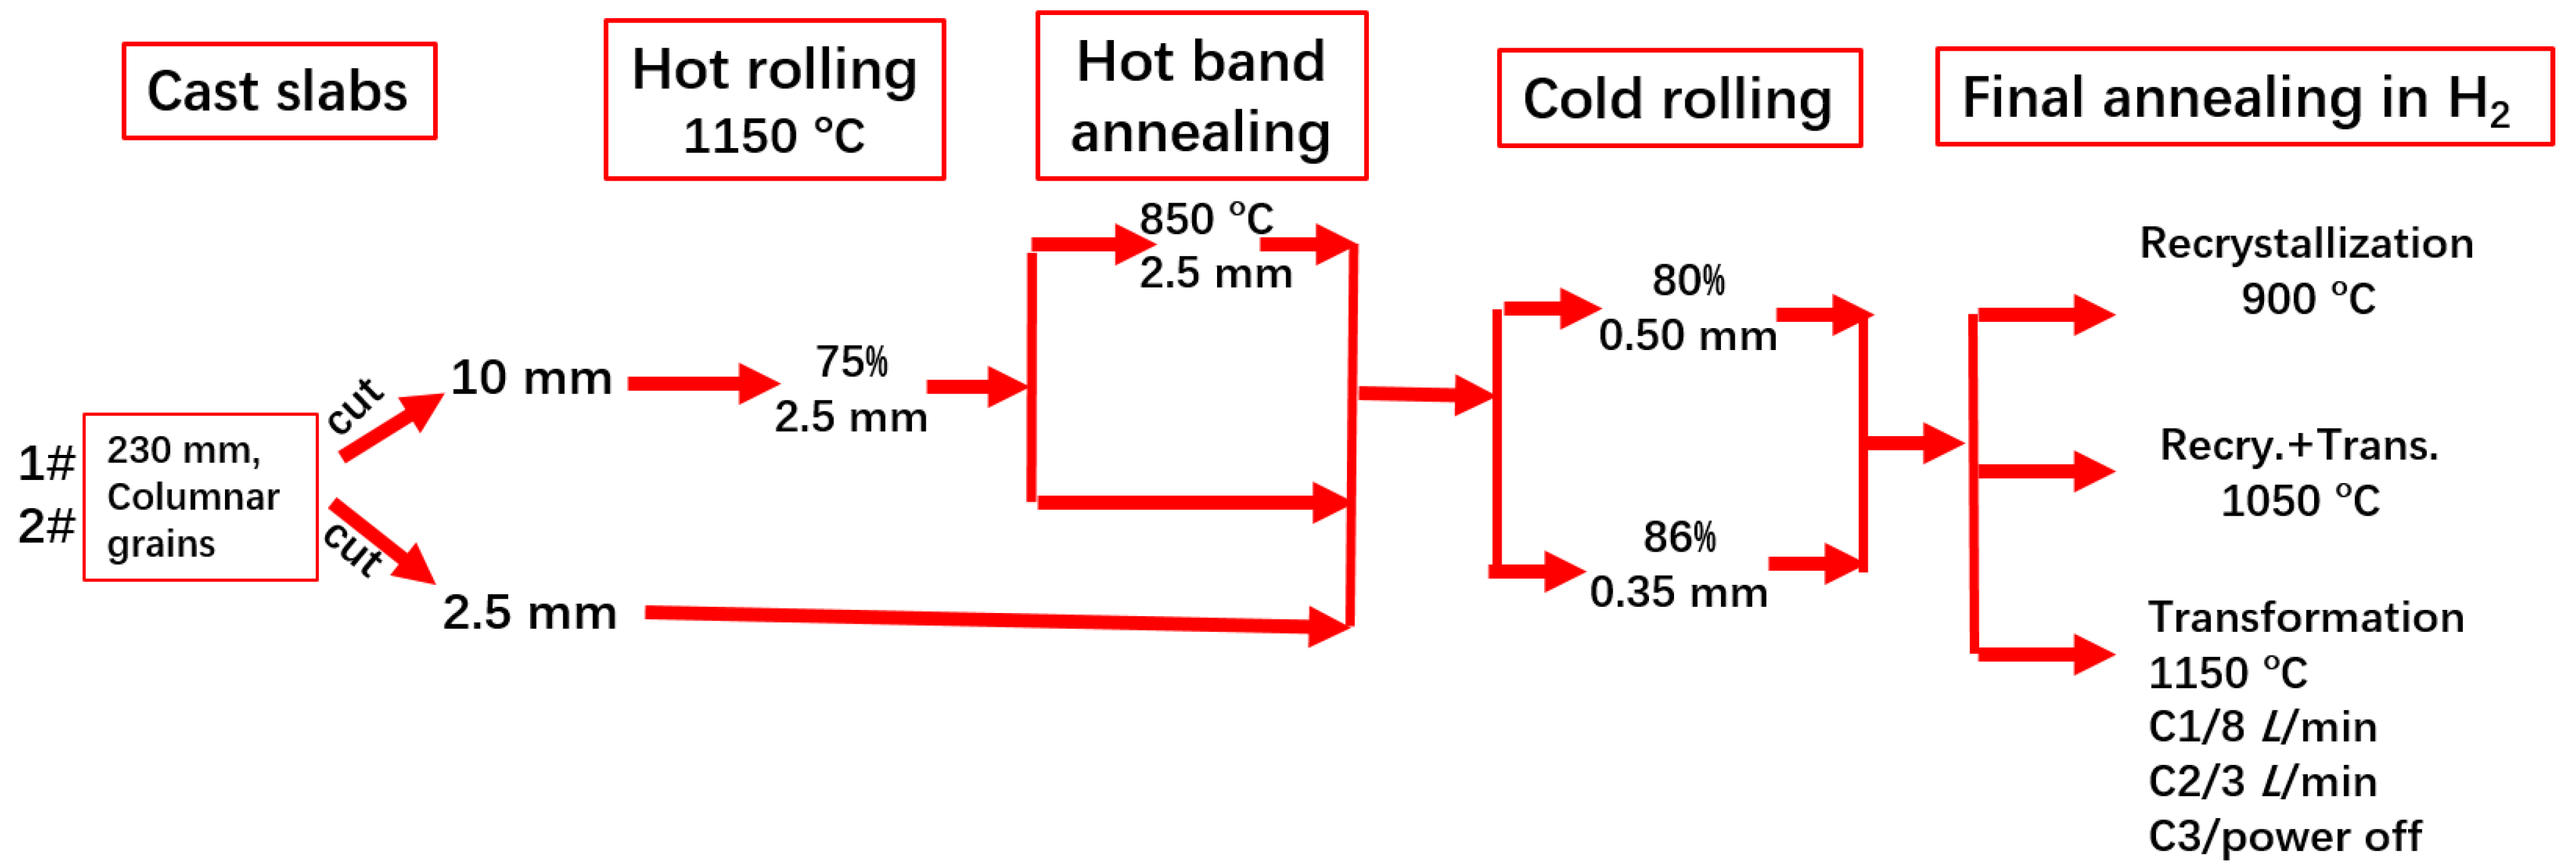
2. Materials and Methods

Two commercial low-grade electrical steels are used. They are provided as cast slabs of 230 mm thick revealing mainly columnar grains mixed with small transformed grains, they are named as 1# and 2# samples, respectively. Table 1 lists their compositions and measured transformation temperatures by dilatometry method under a heating/cooling rate of 10 °C/min. 1# sample contains higher Si content of 1% in weight percent and shows higher transformation temperatures than 2# sample with lower Si content of 0.72%. A schematic diagram of processing steps is shown in Figure 1. Firstly, 2.5 mm thick plates are cut from cast slabs with columnar grain axes (nearly <100> crystallographic direction) parallel to the ND (normal direction) of the plate, they are used as one kind of initial microstructure. Secondly, 10 mm thick plates are cut from cast slabs for hot rolling. These plates are heated to 1150 °C for 30 min and then hot rolled to 2.5 mm (75% hot rolling reduction) by three passes. These hot-rolled bands are served as the samples with the second initial microstructure. Cold rolling reductions are set to be 80%, resulting in 0.50 mm final thickness and 86% in 0.35 mm final thickness, respectively. For comparison purposes, the 1# and 2# hot-rolled sheets are annealed at 850 °C for 5 min to obtain an average grain size of 65 μm. These normalized samples are cold rolled and annealed at 900 °C to obtain recrystallized structure and texture for comparison with the transformation-treated microstructure and texture.
The transformation treatment parameters are listed in Table 2. Among three processing routines the first and second ones aim to compare the influence of H2 flow rates, and the first and the third ones aim to compare the influence of cooling rates. The C3 condition corresponds to a higher cooling rate where electricity power is shut down during cooling (roughly 10 min is needed to reach 900 °C from 1150 °C, whereas C1 and C2 routines need 50 min to cool from 1150 °C to 900 °C). The high heating temperature of 1150 °C is adopted to avoid a memory type of transformation texture at low heating temperature to obtain a surface-effect-induced transformation texture as summarized in [18]. The 1100 °C heating temperature by transformation treatment in the low-grade commercial electrical steel containing 0.35%Si is regarded as too low, leading to memory type of transformation texture [1].
A Zeiss Supra-55 SEM and EBSD Channel-5 system from Oxford Instruments (Abingdon, UK) are used to determine microstructure and grain orientations. To compare the influence of alloying elements Al, Mn and P on critical transformation temperatures, Thermo-Calc software is used to calculate phase diagrams of related steels in the condition of para-equilibrium, for both the steels in this study and those of laboratory-prepared steels without the addition of Al and P [9,11,12].

3. Results

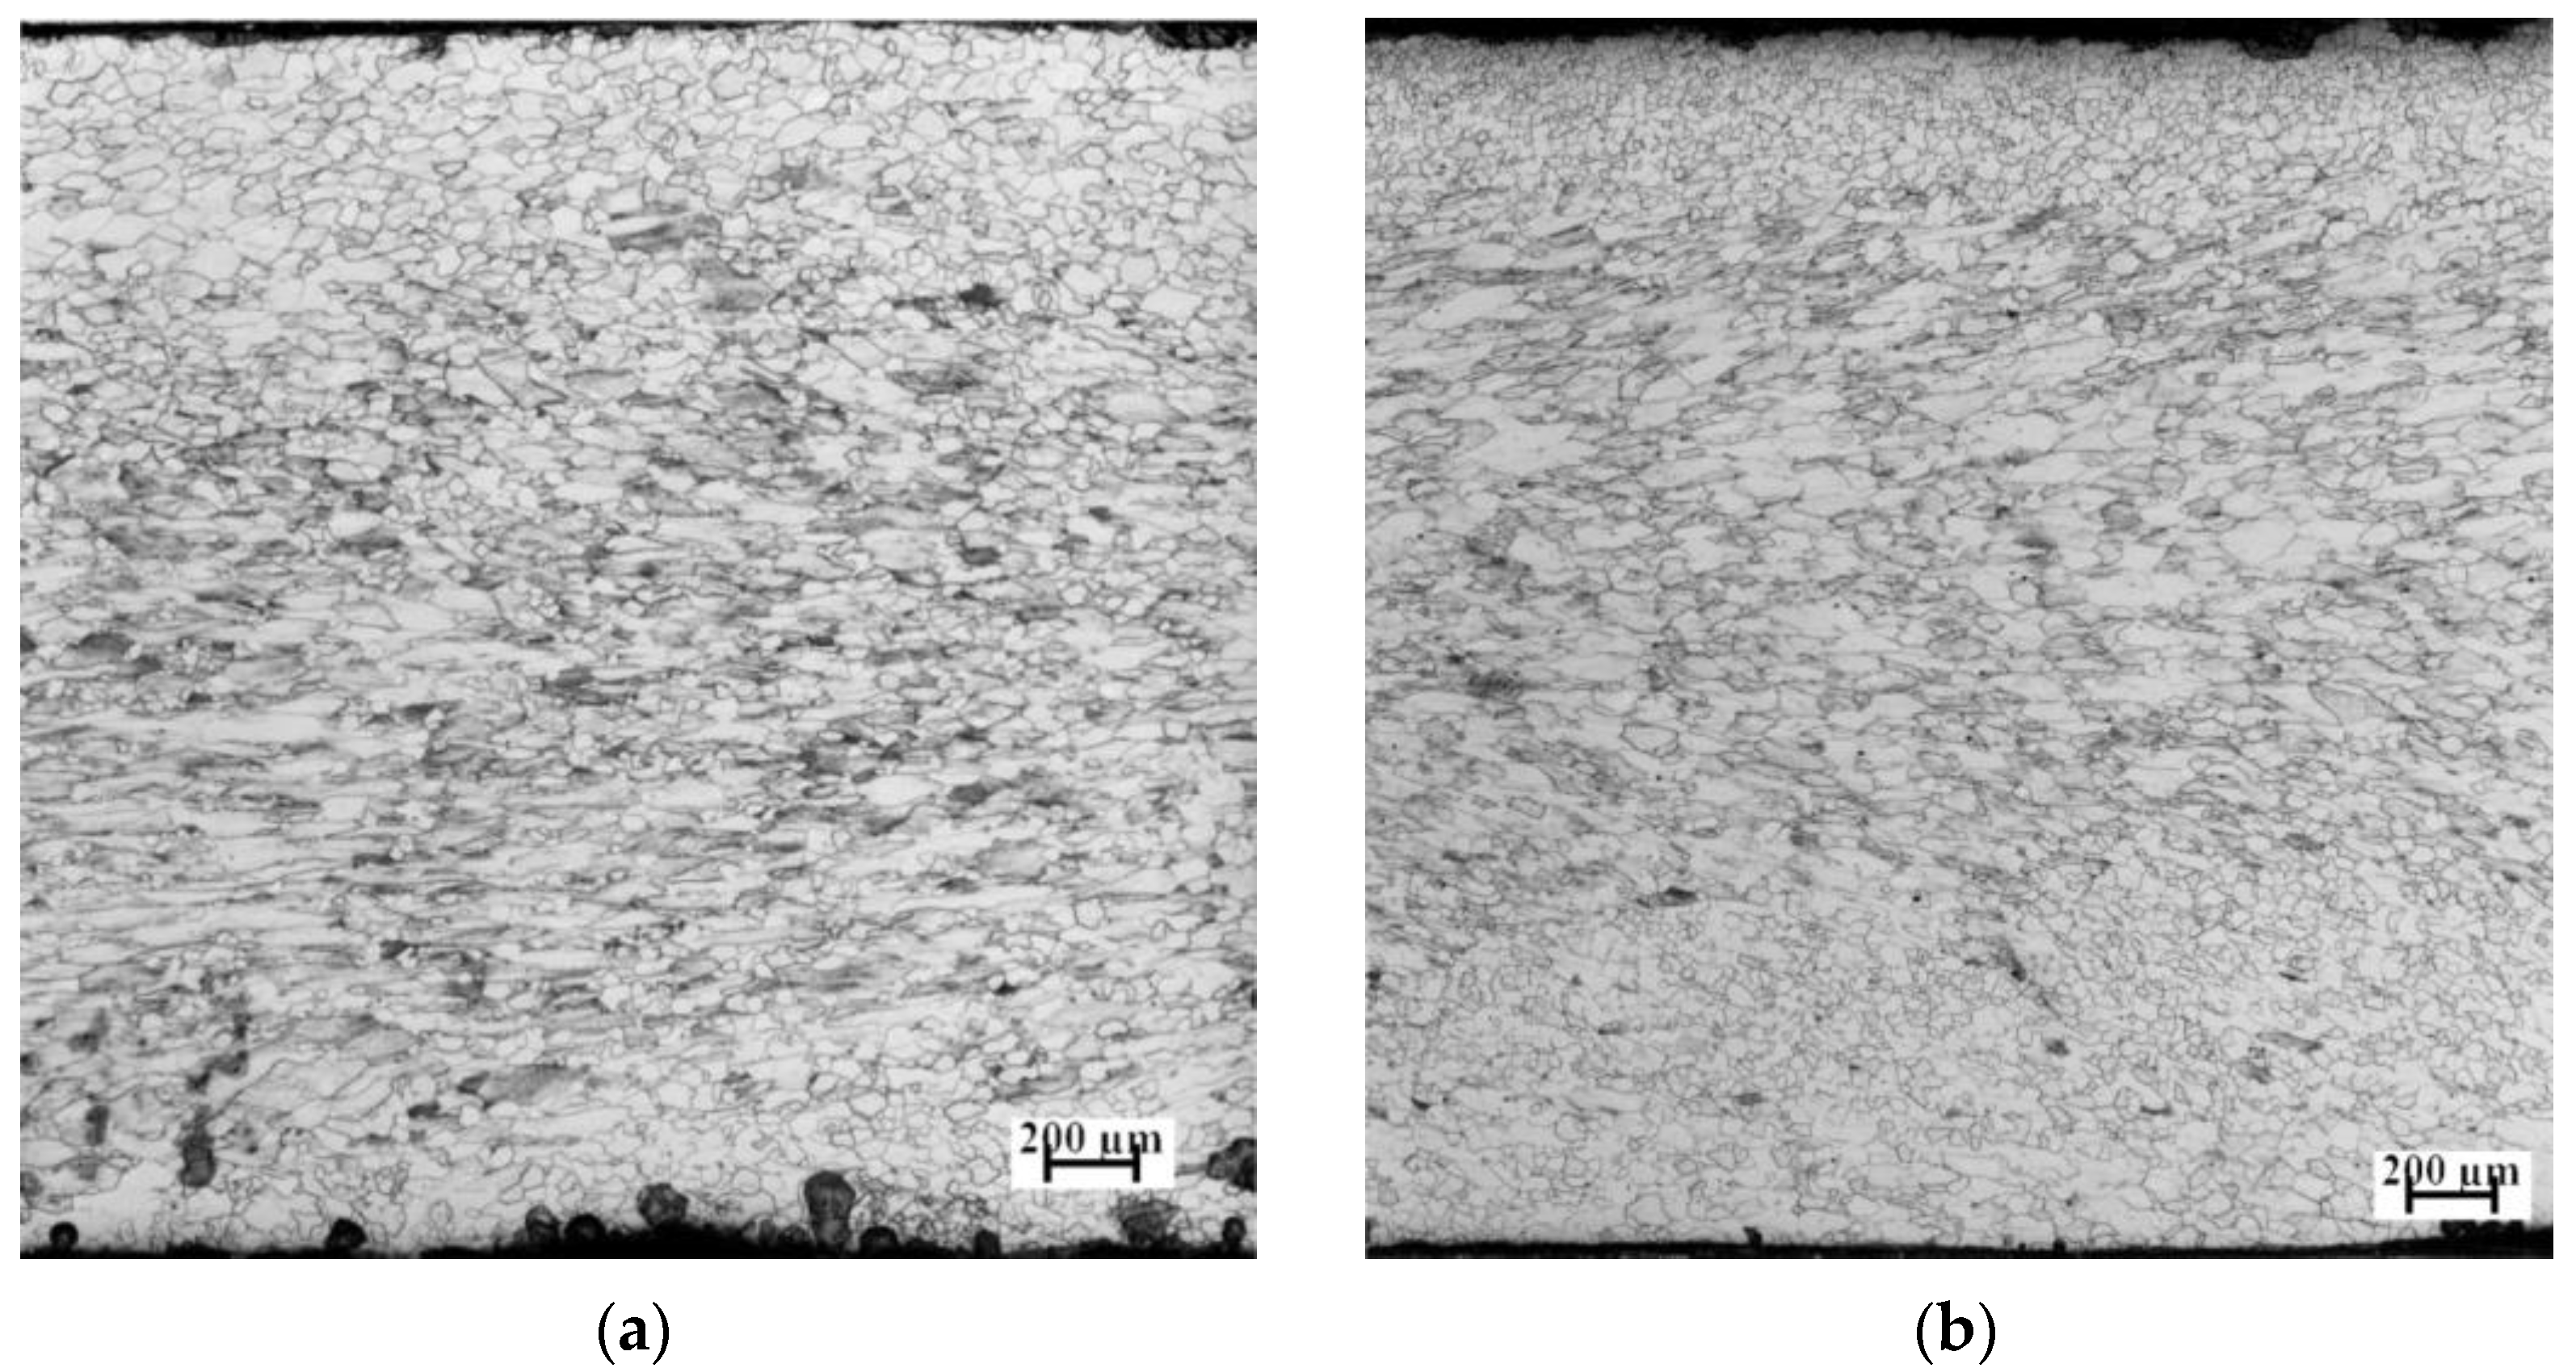
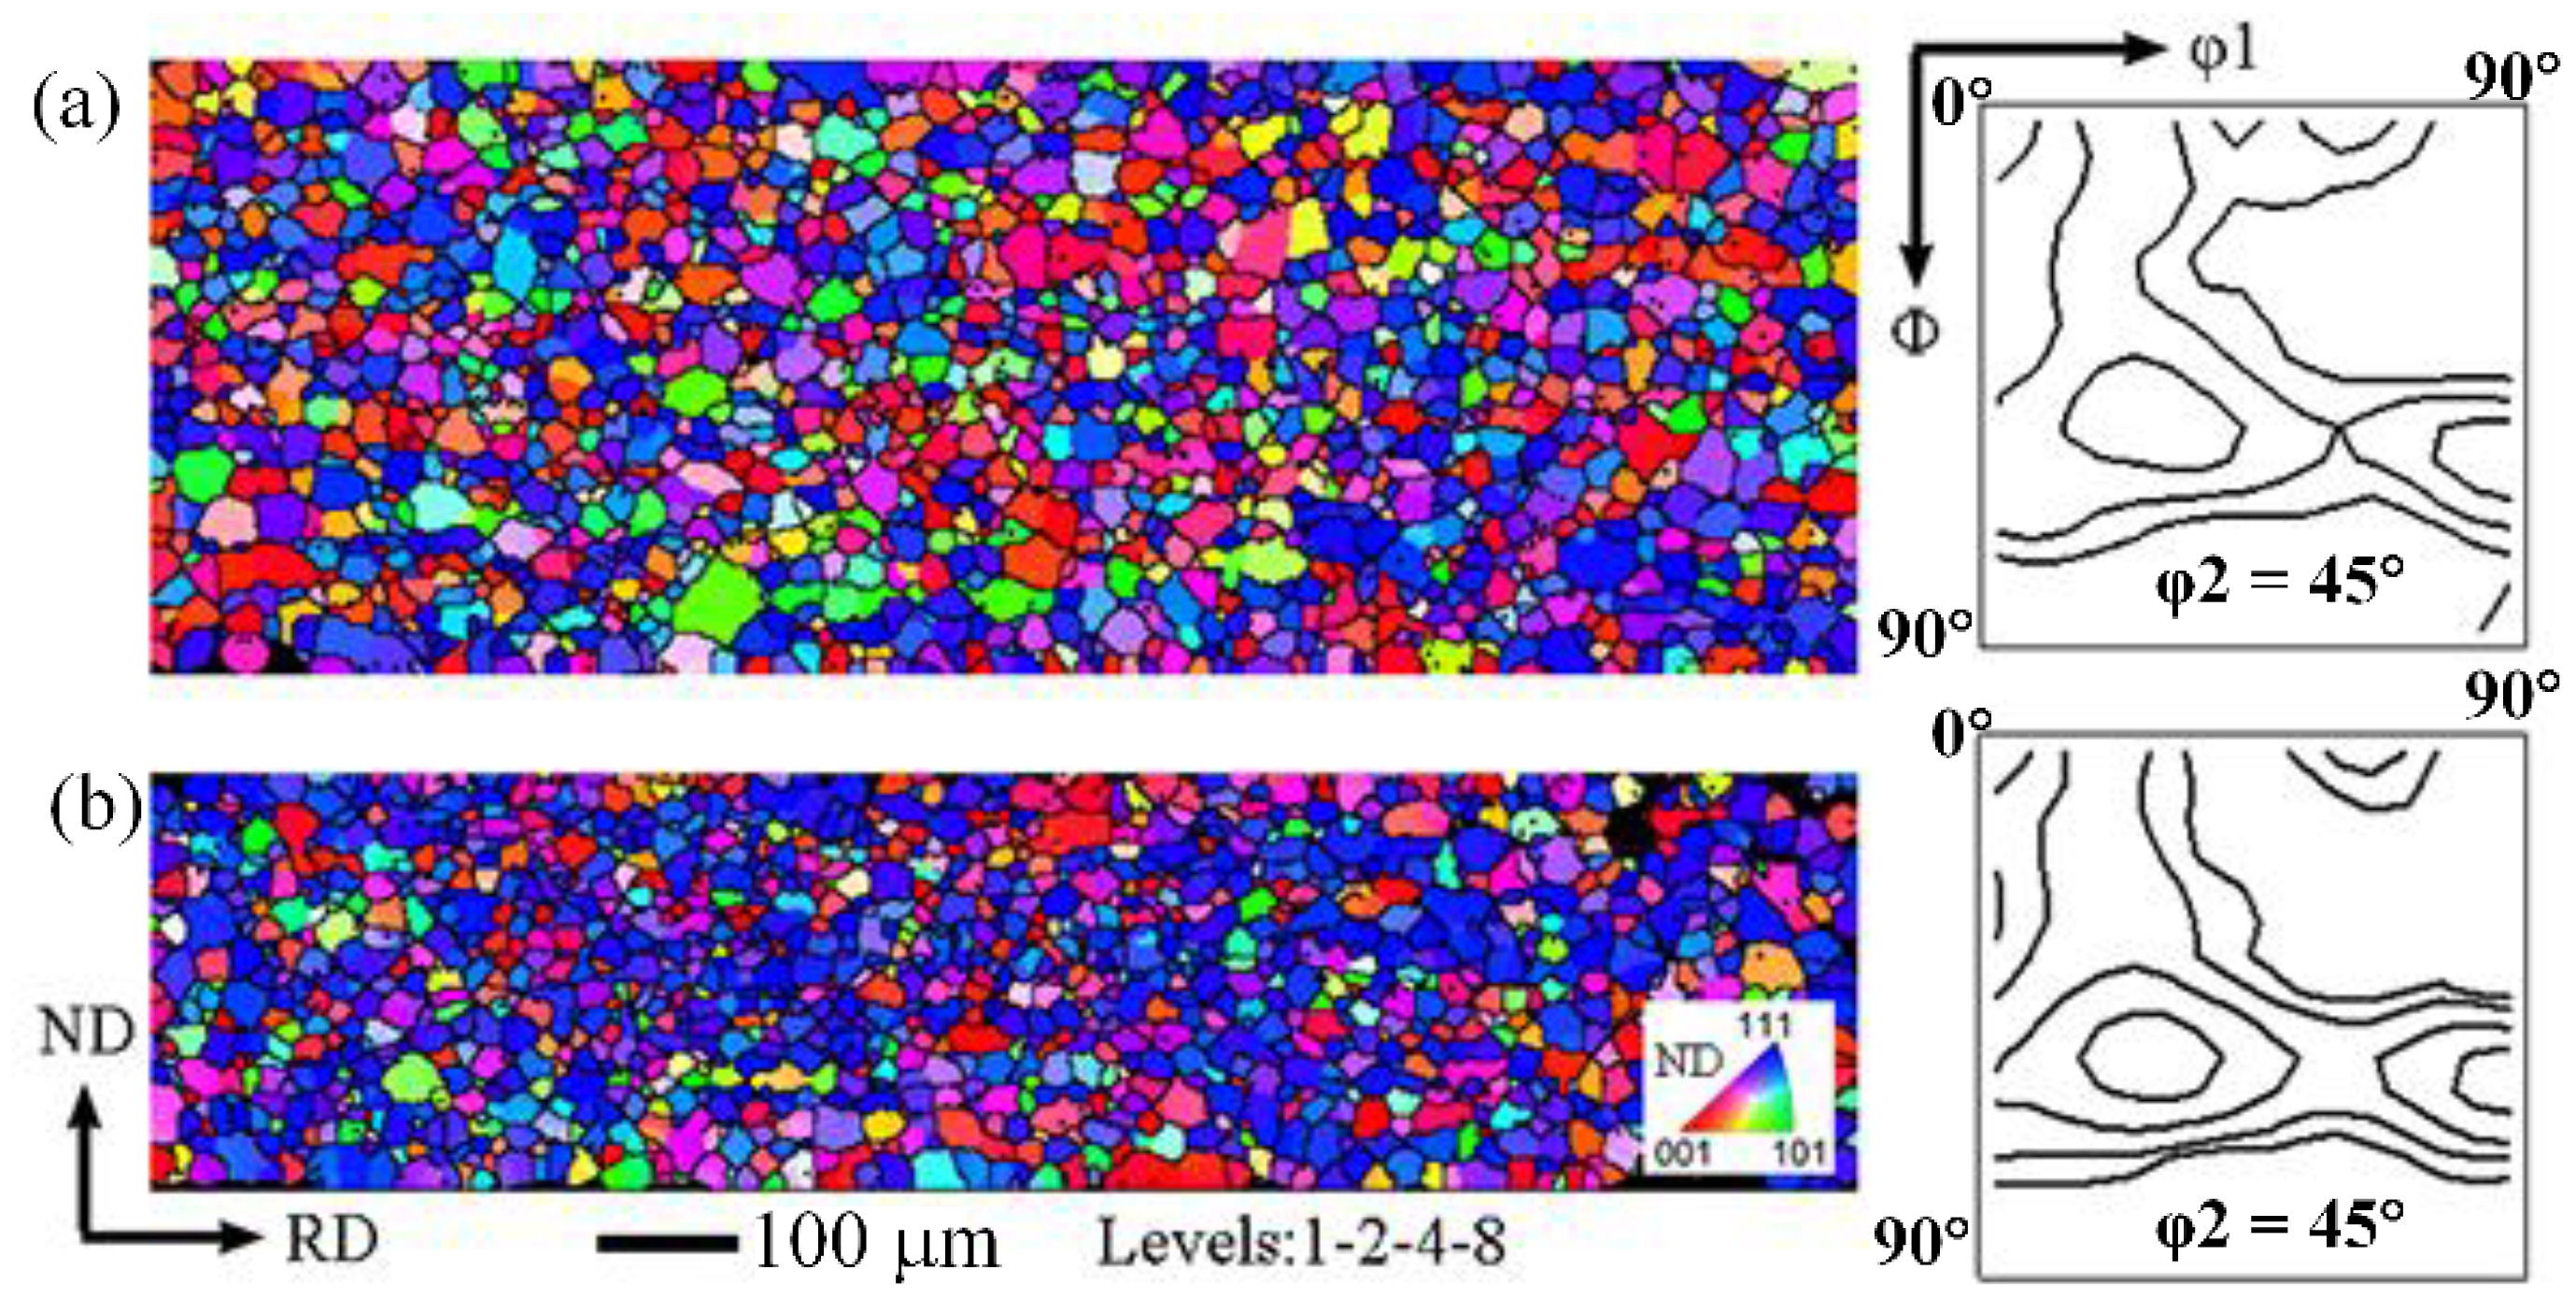
3.1. Initial Cast Slab Structures and Recrystallized Microstructures after Cold Rolling

Figure 2 shows the EBSD maps of initial cast slab structures of samples 1# (1%Si) and 2# (0.72%Si). The silicon contents of these two steels are higher than that of 0.65%Si in the low-grade electrical steel [8]. It is seen that many {100}-oriented columnar grains (red color) exist. Theoretically twice transformation of δ → γ → α should occur during continuous casting and equiaxed grain structure should be resulted. However, it is confirmed by quasi-in situ EBSD mapping [7,8] that transformation delay and suppression occur, leading to many untransformed regions in columnar grains. In contrast, small equiaxed grains with normally {111} orientations (blue color) are transformed grains. According to the distribution of grain boundary types, it is seen that some red lines of Σ3 boundaries exist around small grains indicating that K-S OR (Orientation Relationship) is obeyed during the transformation to ferrite. It is noted further that some small {100}-oriented subgrains exist inside coarse columnar grains, as shown with red arrows. They are also transformed variants with {100} orientations, therefore, not all {100} regions are untransformed δ-ferrite. To summarize, commercial electrical steels containing 0.35–1%Si all show some untransformed columnar grain structure.
Figure 3 shows the hot-rolled microstructures of samples 1# and 2# by heating to 1150 °C and hot rolling to 2.5 mm (75% rolling reduction). Typical hot rolling features are seen with fine equiaxed, dynamically recrystallized grains at surface regions due to the friction shear stress, and elongated and near equiaxed grains in the center layer. The transformation to ferrite occurs during hot rolling. It is further observed that 1# hot-rolled sheet possesses thinner surface shear regions, larger grain size and stronger deformation in the center layer than 2# hot-rolled sheet. This is because sample 2# has a lower critical transformation temperature, lower strength of steel and higher superheating temperature (i.e., T-A3) than those in sample 1#. Therefore, dynamic recrystallization and phase transformation between austenite and ferrite are more likely to occur during hot rolling.
As a hot-rolled microstructure is rather inhomogeneous along the thickness direction, hot band annealing at 850 °C for 5 min is conducted on 2# hot bands (Figure 3b). An average grain size of 65 μm is achieved. Then, the normalized sheet is cold rolled to 0.50 mm (80% reduction) and 0.35 mm (86% reduction) and finally annealed at 900 °C by quick heating within 1 min. Figure 4 shows the recrystallized microstructures of two sheets of 2# samples by EBSD mapping. It is seen that normalization annealing can obtain relative more {100}- and {114}<481>-oriented grains by 80% rolling reduction (Figure 4a). However, further rolling to 86% leads to a stronger {111}<112> texture as well as finer grain sizes, see Figure 4b.
Figure 5 shows the EBSD map of a final sheet with a total hot rolling reduction of nearly 98.9% for a commercial 800-grade electrical steel. It is seen that without normalization annealing, final sheet exhibits a stronger {111} texture rather than that in Figure 4a for a low hot rolling reduction in the laboratory. The average grain size in the commercial final sheet is about 40 μm. This feature of strong {111} texture and fine grain size is similar to that in the low-grade electrical steel containing 0.35%Si [1], thus the corresponding magnetic properties should be poor.

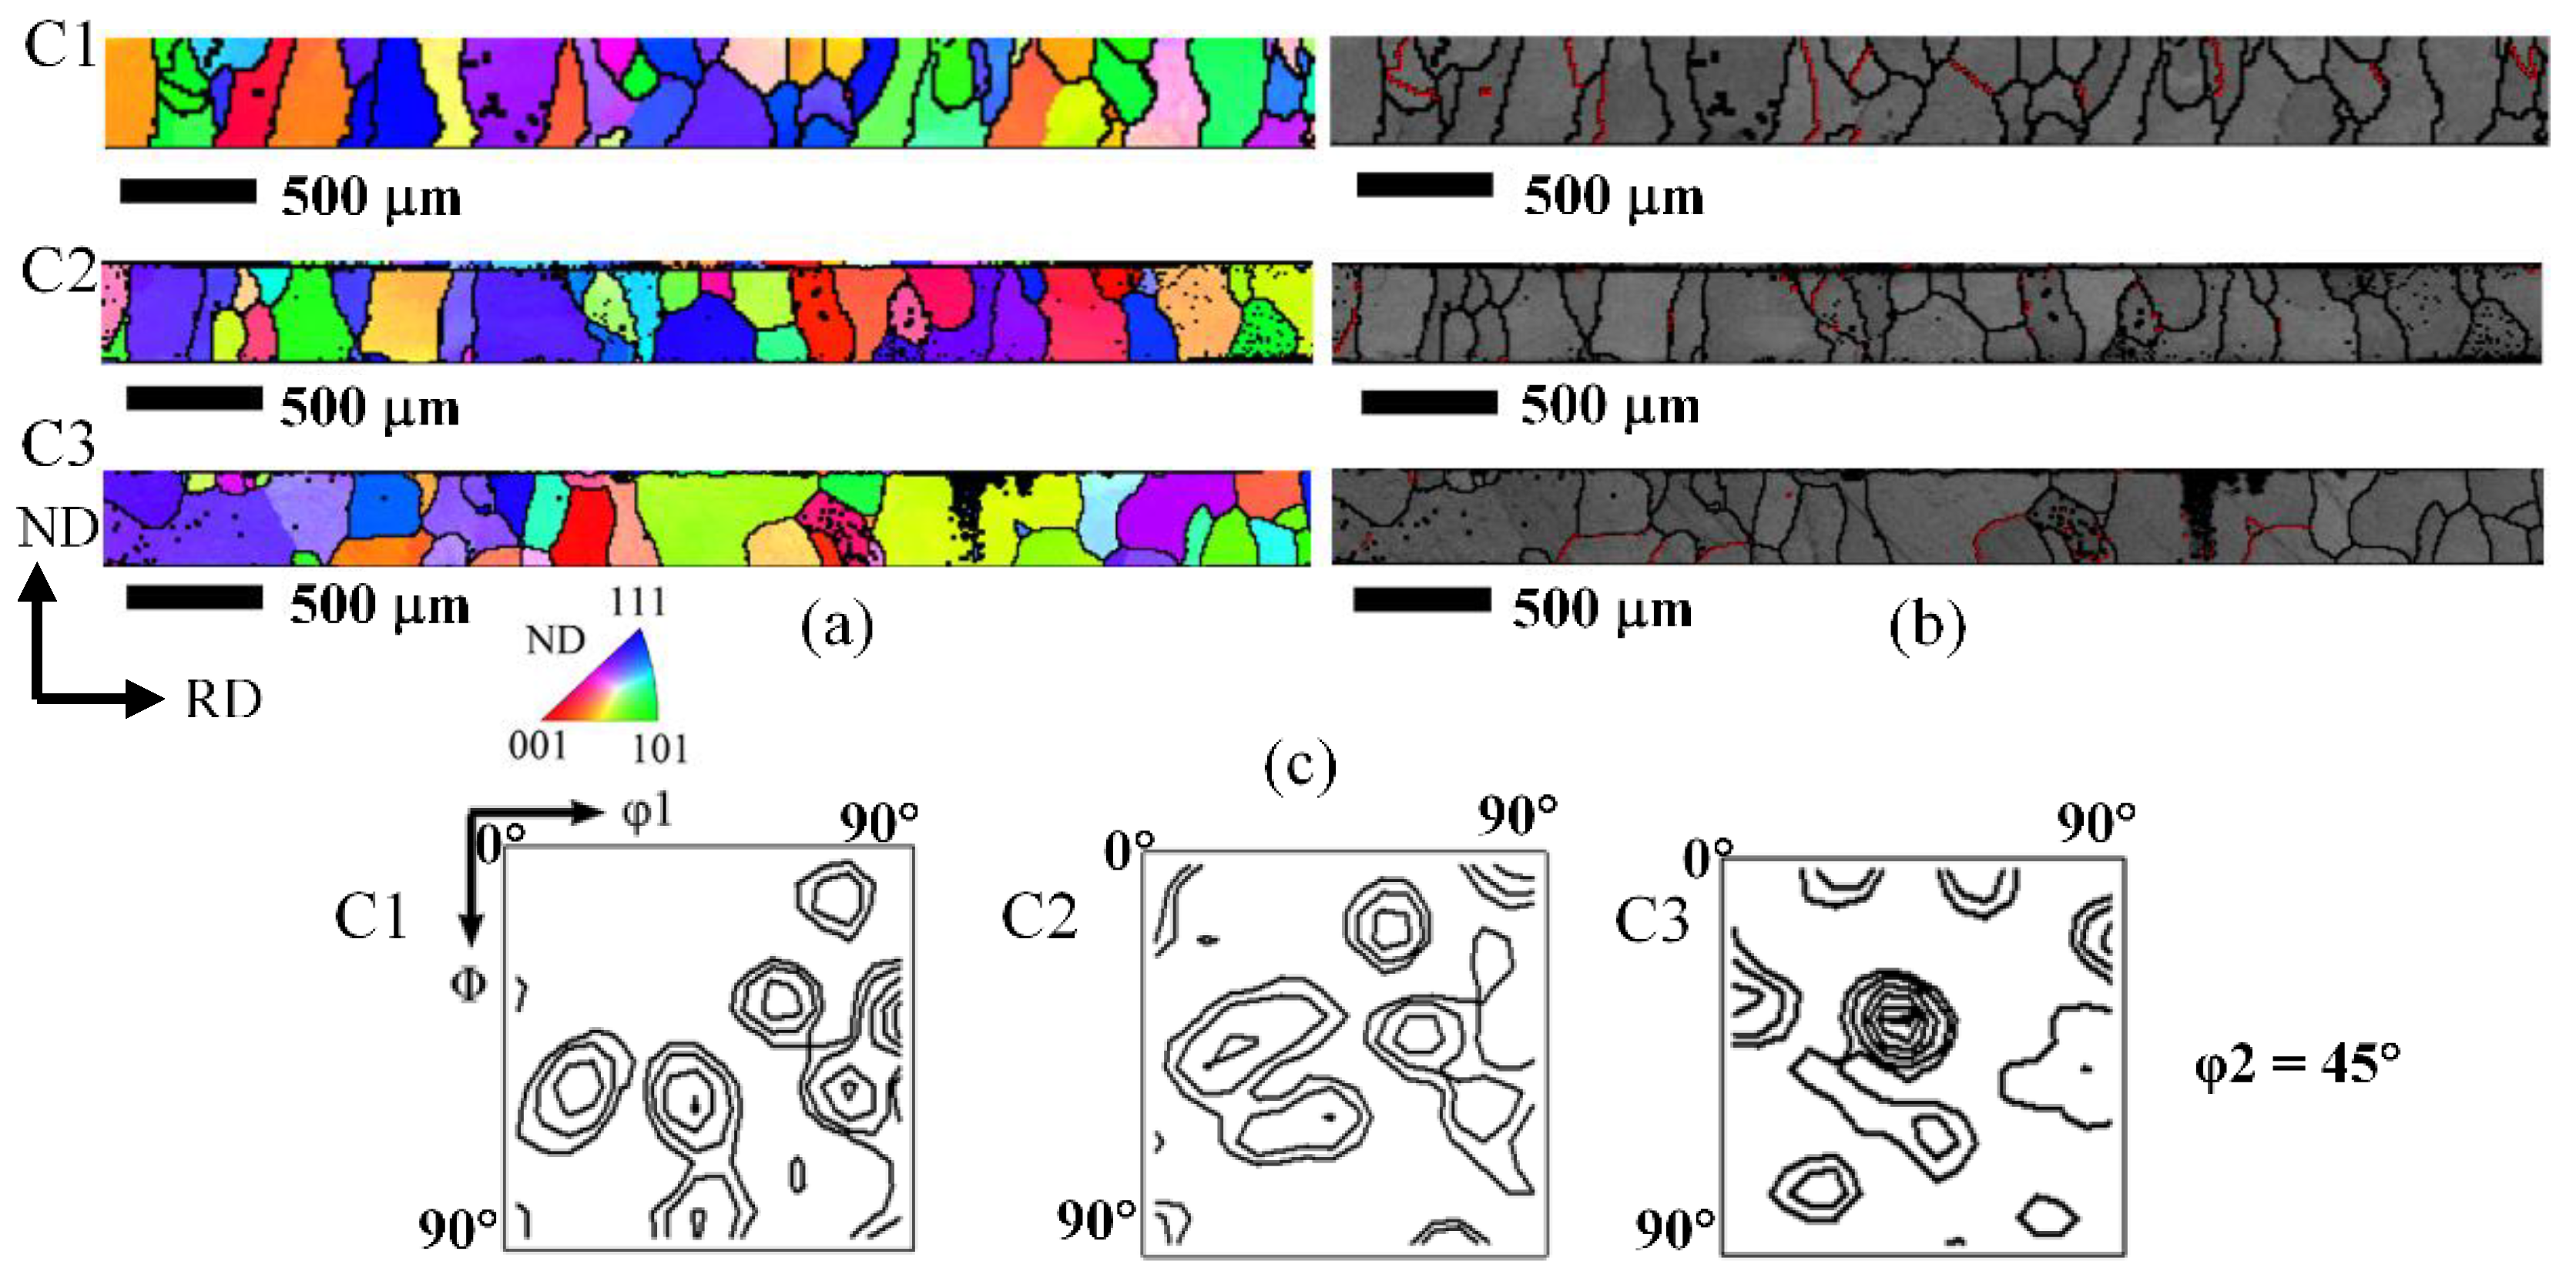
3.2. The Evolution of Microstructure and Texture during Transformation Treatment

Sample 2# is selected to examine the change from recrystallization microstructure and texture to those which are a result of transformation from austenite to ferrite. The heating temperature is set to be 1050 °C (the A3 of 2# sample is calculated to be 995 °C), namely 100 °C lower than the 1150 °C used for most sheets as shown later. The cold rolled sheets are quickly heated to 1050 °C and held for 0 s, 10 s, 20 s followed by water quenching to maintain the microstructure and texture at that time. Other sheets are held at 1050 °C for 1 min, 5 min, 10 min followed by 5 °C/min cooling rate under H2 of 4 L/min flow rate to 920 °C (the A1 of 2# is calculated to be 925 °C) to observe the development of transformation texture.
Figure 6 shows the EBSD maps of 2# sample in such series of processing from hot-rolled bands. It is seen that within 0 s to 10 s, the sheets show recrystallization texture of strong {111} and fine grain sizes. The sheets held for 20 s to 5 min show mixed recrystallization texture and transformation texture. When observed from transverse direction, there is a tendency for grains grow to large sizes and transit to the morphology of two layers of grains. In this time, reverse transformation of ferrite to austenite should be complete, but the texture mainly shows a partial memory effect of recrystallization texture at low heating temperature. Finally, the sheets held for 10 min show a typical feature of two layers of grains and a change in texture. It is clear that {100}- and {110}-oriented grains become more or larger. This demonstrates that transformation treatment can improve both grain size and texture, leading to an improvement in magnetic properties. However, in comparison with our previous laboratory-prepared electrical steels without Al and P [9,10,11,12], such transformation textures in this work are far from satisfactory.

3.3. Microstructure and Grain Orientations after Transformation Treatment on Directly Cold Rolled Columnar Grained Samples

Figure 7 shows the EBSD maps of finally transformation-treated sample 1# by 1150 °C after direct cold rolling of columnar grains to 0.50 mm (80%). It is seen that under 3 different processing parameters (C1 to C3), there is no obvious two layers of columnar grain structure with {100} texture, which is related with surface-effect-induced transformation to ferrite, is formed as observed in our previous works [9,10,11,12]. The microstructure is rather inhomogeneous and some grains grow, penetrating the sheet thickness to even 1 mm in size. Grain orientations seem to be random. In comparison with the 0.35%Si electrical steel processed at relatively low temperature of 1100 °C [1], two differences can be concluded. Firstly, the transformation texture in the 0.35%Si steels is similar to recrystallization texture, where that in 1# sample is nearly random, and no memory effect has been observed. This means that the heating temperature may play some role. Secondly, the grain sizes in 1# sheets are larger than those in the 0.35%Si steel [1], which is also influenced by higher heating temperature. More {110}- and {100}-oriented grains are present, which is similar to the case in [1] and they are related with the nucleation at shear bands and the retained {100}-oriented grains. Moreover, the {111}-oriented grains are less. In addition, Σ3 grain boundaries are observed, which indicates the K-S OR formed during the transformation to ferrite. More {100}-oriented grains are present in C2 and C3 processed sheets though too few grains are counted.
Figure 8 shows the similarly processed 1# sheets of 0.35 mm (86% rolling reduction). It is seen that the texture is also random. More {100}-oriented grains are seen in C2 and C3 processed sheets. More grains grow and contact with sheet surface because of thinner thickness. Under C3 condition of a high cooling rate, grains become smaller, whereas C2 under low cooling rate produces larger and pancaked grain morphology indicating grains grow smoothly along the rolling plane. In addition, more Σ3 grain boundaries are present in C3 processed sheets indicating obeying K-S OR.
Figure 9 shows the EBSD maps of 2# samples after final transformation treatment by 1150 °C following direct rolling of columnar grained sheets by 80% reduction to 0.50 mm. It is seen that the grain sizes are smaller than those in 1# sheets. Roughly two layers of grains are formed during the transformation to ferrite and more {110}-oriented grains are present which should be due to recrystallization nucleation at shear bands in cold rolled sheets. In addition, some Σ3 grain boundaries are seen to indicate the K-S OR during the transformation to ferrite. As sample 2# possesses low critical transformation temperature (the A1 and A3 of 2# sample are calculated to be 925 °C and 995 °C, respectively), the superheating temperature is 105 °C and is suitable for surface-effect-induced transformation to ferrite, the resulting microstructure is confirmed, and the texture is completely different to recrystallization texture. As a result of the presence of harmful Al and P, the surface effect is restricted leading to random, rather than {100} transformation texture.
Figure 10 shows the EBSD maps of 2# sample cold rolled to 0.35 mm (86% reduction) and transformation treated at 1150 °C. It is seen that the grain sizes are small in comparison with those of 1# sample in Figure 8. Some grains grow to penetrate sheet thickness. No apparent grain growth along the rolling plane is observed as in Figure 8 of C2 condition. The transformation texture is roughly random.
In the comparison of 1# and 2# sheets prepared by direct cold rolling of columnar grains, the main differences between 1# and 2# samples are their grain sizes and grain morphologies. Sample 2# sheets show small grain sizes and typical two-layer grain structure of surface-effect-induced transformation to ferrite. It is noted that the one-layer grain structure as seen in 1# sheets can also be induced by surface effects in the condition of coarse austenite grain sizes by either high rolling reduction, high H2 flow rate or high heating temperature, as observed in Fe-0.5Mn [9]. The processing parameters C1-C3 do not show a strong effect.

3.4. Transformation Microstructure and Grain Orientations Prepared from Hot-Rolled Sheets

Figure 11 shows the EBSD maps of 1# sheets after final transformation treatment at 1150 °C following cold rolling of hot bands to 0.50 mm. According to Figure 3, the initial grain sizes in hot-rolled sheets before cold rolling are much finer in comparison with cast columnar grains despite the structure and texture gradients along thickness direction. It is seen from Figure 11 that grain sizes are large and inhomogeneous, similar to the results from initial columnar grained structure as shown in Figure 7. The texture is nearly random, and no difference for three kinds of processing conditions was observed. As the initial grain sizes are much smaller, the recrystallized grain sizes during transformation treatment by quick heating should be also small, thus the coarse grain sizes after the transformation to ferrite should be due to the slow transformation rate, rather than initial coarse grain sizes. Or in other words, the processing parameters may not be optimized. In addition, the presence of Σ3 boundaries indicates the prevailing K-S OR during the transformation to ferrite and transformation strain can be used to rationalize the surface effect.
Figure 12 shows the EBSD maps of 1# sheets after final transformation treatment on cold-rolled 0.35 mm sheets prepared from hot-rolled sheets. It is seen that grains can grow easily along the rolling plane into pancaked shape in all three cases. This is different from the case shown in Figure 8. According to the research [16,17] on Fe-0.5Mn steel, higher rolling reduction and higher heating temperature lead to pancaked grain morphology. Moreover, less {110}-oriented grains can be observed due to higher rolling reduction and fine initial grain sizes. Σ3 boundaries are still present.
Figure 13 shows EBSD maps of sample 2# sheets after final transformation treatment on cold-rolled sheets prepared from hot-rolled sheets to 0.50 mm (80% reduction). It is seen that the surface effect apparently occurs and two layers of grains are formed. The textures seem to be random. Less Σ3 boundaries are seen. Again, smaller grain sizes are observed in 2# sample in comparison with 1# samples in Figure 11. As the critical transformation temperature of 2# is lower than 1# sample. The austenite grain sizes should be larger in sample 2# than 1# at the same heating temperature of 1150 °C, thus it is assumed that higher heating temperature and fine initial grain structure are better.
Figure 14 shows EBSD maps of 2# sheets after final transformation treatment on cold-rolled 0.35 mm (86% reduction) sheets by heating to 1150 °C based on the hot-rolled sheets. The higher rolling reduction and thinner sheet thickness lead to grain growth penetrating the sheet thickness and no two layers of grains can be formed except a small region in C3-processed sheet as indicated by red arrow in Figure 14a. The textures show similarity to recrystallization textures of {100} and {111}, which is a memory type of transformation texture. Σ3 boundaries are occasionally observed. As 2# samples show similar behaviors as seen in Figure 10, it means that initial columnar grains or hot-rolled fine grains do not make large difference to the final transformed structure.
In comparison of the transformation-treated 1# and 2# sheets processed by direct rolling of initial columnar grains with those prepared from hot-rolled structure, similar differences between them are also observed. Namely, the grain sizes in 2# sheets are small and typical two layers of grains are developed due to surface effect. In addition, more {100}-oriented grains are seen in hot-rolled sheets (Figure 13) than in columnar grained sheets (Figure 9). The latter contains more {110}-oriented grains related to the nucleation at shear bands during recrystallization. In addition, it is seen that transformation processing parameters did not show influence on two kinds of samples. As for the influence of heating temperature, it is seen that the 2# sheets treated at 1050 °C in Figure 6 (the one held for 5 min) did not produce two-layer grain structure, but it did at 1150 °C. This confirms again that low heating temperature promotes the memory type transformation to ferrite, whereas high heating temperature favors the surface-effect-induced transformation to ferrite. It is noted that the two-layer grain structure can be produced when held at 1050 °C for 10 min. The reason for the difference of 1# and 2# should be mainly due to their composition or equilibrium transformation temperature. The 2# sample with low transformation temperature did not contain Al, but contained a low level of detrimental 0.082%P, whereas 1# sheet with high transformation temperature contains a high level of 0.26%Al, which can probably lead to sheet surface oxidation.

4. Discussion

The objectives of this study are to find out whether the two low-grade electrical steels containing 1%Si and 0.72%Si are suitable for transformation treatment with {100} texture. We need to make three comparisons. The first is to compare which of these two steels shows a better surface-effect-induced transformation to ferrite. The second is to compare the steels in this study using 1150 °C high heating temperature with the 0.35%Si steels using 1100 °C low heating temperature [1]. The third is to compare commercial electrical steels with laboratory-prepared steels without Al and P. As the first comparison is made in Section 3 already, we will discuss the next two in the following. In addition, since the transformation between austenite and ferrite takes place during casting, during hot rolling and/or during final annealing, attention to the effect of preceding one on the subsequent one in the microstructure and texture should be made, and this will be also discussed.

4.1. The Reason Why the Effect of Transformation Treatment on Commercial Electrical Steels Is Less Pronounced Than the Laboratory-Prepared Electrical Steels

Table 3 summarizes critical temperatures and contents of several steels with different compositions. When we compare the two industrial low-grade electrical steels used in this study 1#–2# with the 3 laboratory-prepared steels, namely, Fe-0.46%Mn, Fe-0.43%Si-0.50%Mn and Fe-0.82%Si-1.37%Mn [9,10,11,12], it is seen that the latter group shows much stronger {100} texture and the typical two layers of columnar grains in final sheets than the former group. The reasons lie in two folds. One is that the presence of Al, P elements in commercial steels leads to their surface oxidation at sheet surface or segregation besides oxidation of Si, thus preventing the early nucleation of ferrite grains at sheet surface and the relaxation of transformation strain as analyzed in [1,9,18]. The second is that they increase equilibrium transformation temperatures of A1, A3 and expand two-phase temperature regions. Thus, the diffusion of different alloying elements is needed and the transformation strain is easily relieved during the transformation to ferrite preventing the formation of {100}-oriented grains. The addition of more Si is also harmful to the formation of {100} transformation texture because it also leads to surface oxidation, but Si is the most important alloying element in silicon steels and thus cannot be eliminated. Thus, Al and P should be used as little as possible. Present industrial production does not consider the new method of transformation treatment. It mainly considers the decrease in core loss by Al addition and the increase in mechanical strength by P addition. In spite of such unsuitable composition in commercial electrical steels for transformation treatment, it is still possible to prepare typical transformation grain structure and texture in commercial electrical steels in 2# sheets, see Figure 6, Figure 9 and Figure 13, namely the surface-effect-induced transformation to ferrite occurs in commercial steels. Both the increase in grain sizes and a better texture are obtained, comparing Figure 4 and Figure 5 and Figure 6, Figure 9 and Figure 13. Moreover, it is seen that initial microstructure, rolling reduction, final heating temperature and cooling rate also show their effect and needed to be further optimized. Furthermore, although the silicon content in [1] is as low as 0.35%, much lower than those in this study (0.72–1%Si), according to Thermo-Calc calculation, the addition of high 0.14%P increases its A1-A3 to a higher value than the steels containing 0.64%Si [8] and 2# sheets in this study.
Figure 15a,b show the calculated phase diagrams for laboratory-prepared steels Fe-0.46%Mn, Fe-0.43%Si-0.50%Mn and Fe-0.82%Si-1.37%Mn, respectively [9,10,11,12]. Important critical temperatures and silicon contents are listed in Table 3. It is seen that without Si addition, the A1–A3 of Fe-0.5Mn alloy are as low as 855 °C–890 °C. The addition of 0.5%Si to this alloy increases the A1–A3 to 875 °C–925 °C, showing the low transformation temperatures, see Table 3 and Figure 15a. For Fe-0.82%Si-1.37%Mn alloy, due to the high Mn content of 1.37%, the 0.82%Si alloy shows low A1–A3 of 820 °C–900 °C, but a large two-phase temperature region of 80 °C, see Table 3 and Figure 15b. Thus the {100} texture is stronger in former two steels than the latter one. In contrast, the 2# commercial steel containing 0.72%Si shows the A1–A3 temperatures of 925 °C–995 °C (Figure 15d), and 1# commercial steel containing 1%Si shows the higher A1–A3 temperatures of 970 °C–1050 °C (Figure 15c), which should promote the memory type of transformation texture.

4.2. Assessment of the Suitability of Commercial Electrical Steels by Transformation Treatment

We noticed in [18] that transformation texture can be either a memory-type texture which is similar to recrystallization texture when treated at low heating temperature, or a surface-effect-induced {100} texture at high heating temperature. For the low-grade steel [1] with 0.35%Si, 0.18%Al and 0.14%P, we selected the heating temperature of 1100 °C and mainly obtained the memory type of transformation texture due to the high equilibrium transformation temperature of A3 = 1070 °C. In this study, we raised the heating temperature to 1150 °C for steels containing 1%Si (A3 = 1050 °C) and 0.72%Si (A3 = 995 °C). Since two layers of thin columnar grains, two layers of pancaked grains and one layer of pancaked grains are all typical surface-effect-induced grain structures, see [9,16,17] of Fe-0.5Mn alloy; therefore, the surface-effect-induced transformation to ferrite with coarse grain sizes and better texture rather than memory texture can be prepared in commercial electrical steels, in particular, in steels 2#. Although no typical {100} texture is achieved, near random texture can be regarded as another version of degenerated {100} texture due to the detrimental Al and P elements.
Two kinds of initial textures, i.e., columnar grains in cast slabs and hot-rolled fine grains, possess different features. Columnar grain structure shows strong {100} texture, inhomogeneous grain size distribution and free from deformation, whereas hot-rolled bands show strong α fiber texture, fine grain size distribution and deformed grain structure. Since direct cold rolling of columnar grain structure cannot be performed in production lines, the evolution of microstructure and texture only serves to investigate the tendency of influencing factors.
For the low-grade electrical steel containing 0.35%Si in [1,7] treated at 1100 °C with 30 °C superheating degree, the transformation texture of direct cold rolling of columnar grain structure is better than that of initial hot-rolled bands. In contrast, the difference in the two kinds of initial structures in this study as analyzed in Section 3.2 and Section 3.3 is not seen. The reasons may be three folds. One is the initial {100} texture in the 0.35%Si steel is stronger than that in this study of 0.72%Si and 1%Si steels (Figure 1 in [1] and Figure 2 in this paper). The second is that the rolling reduction of 75% in former steel is smaller than those of 80% and 86% in this study. The third is that the superheating degree of 30 °C at 1100 °C in the former is lower than the 100–155 °C at 1150 °C in this study, thus the former corresponds to a memory type of recrystallization texture, whereas the latter shows transformation texture from the austenite grains after holding at a higher temperature, where no memory effect can take place. In summary, when commercial low-grade electrical steels are used for transformation treatment, the steels with less Al and P should be selected. When the composition is determined, a higher heating temperature should be selected, namely 100 °C superheating degree should be used. Moreover, a fine uniform initial structure before cold rolling is normally suitable for transformation treatment.
Finally, it is stressed that it is important to establish a theory that can both underlie transformation behavior and to control all three transformation stages in low-grade electrical steels due to their theoretical significance and practical value. As mentioned in the introduction, solid transformation in columnar grains of high temperature δ-ferrite to α-ferrite through austenite should firstly be well-controlled because of the strong transformation delay or even suppression of transformation. The transformation between austenite and ferrite during heating and hot rolling of cast slabs should, secondly, be well-optimized because deformation, recrystallization and phase transformation are interplayed in two phases. Lastly, the transformation to ferrite in terms of surface-effect-induced texture control should be well treated because it is influenced by the two preceding transformation control. As transformation texture can be in different types, either memory texture or surface-effect-induced texture, which is developed by controlling different heating temperatures. The best initial microstructure and texture may be different. The memory type of transformation texture needs more {100}-oriented grains or deformed regions and coarse grain sizes, whereas surface effect transformation texture needs initial fine equiaxed grains. It is noted that composition can strongly influence the transformation between austenite and ferrite and until now we have not known how to control such transformation even in one kind of commercial electrical steel. Due to the transformation delay and suppression in columnar grain slabs, the change in heating temperature or holding time may strongly influence hot band structure [1,11], namely, there is a variety of hot rolling structures. Thus, further investigation on commercial low-grade electrical steels processed by transformation control is needed in order to establish a combined theory of transformation texture control in low-grade electrical steels.

5. Conclusions

Using two low-grade commercial electrical steels with different compositions, the possibilities of applying transformation treatment through the surface-effect-induced transformation to ferrite are examined and the influence of initial microstructure, rolling reduction and annealing parameters are also investigated. The following conclusions are obtained.
(1) Commercial low-grade electrical steels cast slabs containing 0.72%Si and 1%Si, respectively, show a lot of {100}-oriented columnar grains due to the transformation delay and suppression. In addition, the existence of Σ3 boundaries indicates that K-S OR is present during the transformation to ferrite. This means that transformation strain effect exists and should be utilized for transformation control;
(2) Composition affects the degree of surface-effect-induced transformation to ferrite and the 2# alloy with low Al and low transformation texture can present typical surface-effect-induced transformation more easily. Similarly, due to the presence of Al and P elements, commercial electrical steels generally show less pronounced surface-effect-induced transformation texture than the laboratory-prepared steels without Al and P, which lead to segregation or surface oxidation;
(3) The directly cold-rolled columnar grain structure and the fine grained hot-rolled bands produce similar transformation-treated coarse-grained microstructure and nearly random texture. Higher hydrogen flow rate and higher cooling rate do not show an effect on grain sizes and texture. A decrease in rolling reduction or increase in sheet thickness promotes the formation of typical transformation microstructure and weakening textures;
(4) Two commercial low-grade electrical steels show improved grain sizes and textures after transformation treatment in comparison with the recrystallization texture. The {111}-oriented grains are effectively reduced by transformation treatment.

Author Contributions

Conceptualization, P.Y.; methodology, P.Y.; software, J.W., D.M. and S.P.; validation, P.Y. and D.M.; formal analysis, P.Y.; investigation, P.Y. and J.W.; data curation, J.W., D.M. and S.P.; writing—original draft preparation, P.Y.; writing—review and editing, D.M.; project administration, P.Y. and X.G.; funding acquisition, P.Y. All authors have read and agreed to the published version of the manuscript.

Funding

This research was funded by National Natural Science Foundation of China (No. 51931002).

Data Availability Statement

Data available on request due to restrictions e.g., privacy or ethical.

Conflicts of Interest

The authors declare no conflict of interest.

References

  1. Gu, C.; Yang, P.; Mao, W.M. The influence of rolling process on the microstructure, texture and magnetic properties of low grades non-oriented electrical steel after phase transformation annealing. Acta Metall. Sin. 2019, 55, 181–190. [Google Scholar]
  2. Liu, H.T.; Li, H.L.; Schneider, J.; Liu, Y.; Wang, G.D. Effects of coiling temperature after hot rolling on microstructure, texture, and magnetic properties of non-oriented electrical steel in strip casting processing route. Steel Res. Int. 2016, 87, 1256–1263. [Google Scholar] [CrossRef]
  3. Wu, S.; Li, H.; Yue, C.X.; Li, H.L. Effect of finishing temperature on magnetic properties of medium and low grade non-oriented silicon steel. Trans. Mater. Heat Treat. 2021, 40, 89–94. [Google Scholar]
  4. An, L.Z.; Liu, H.T.; Wang, G.D. Effects of hot-rolled coiled temperature on microstructure, texture and magnetic properties of low silicon non-oriented electrical steels. Electr. Steel 2021, 3, 15–21. [Google Scholar]
  5. An, L.Z.; Wang, Y.P.; Wang, G.D.; Liu, H.T. Fabrication of high-performance low silicon non-oriented electrical steels by a new method: Low-finishing-temperature hot rolling combined with batch annealing. J. Magn. Magn. Mater. 2022, 546, 168907. [Google Scholar] [CrossRef]
  6. Yashiki, H.; Okamoto, A. Effect of hot-band grain size on magnetic properties of non-oriented electrical steels. IEEE Trans. Magn. 1987, 23, 3086–3088. [Google Scholar] [CrossRef]
  7. Wu, X.L.; Gu, C.; Yang, P.; Gu, X.F.; Pang, S.F. Transformation delay and texture memory effect of columnar grained cast slab in low grades non-oriented electrical steels. ISIJ Int. 2021, 61, 1669–1678. [Google Scholar] [CrossRef]
  8. Wu, X.L.; Yang, P.; Gu, X.F.; Cui, F.E. Effect of the initial columnar-grained inhomogeneity of electrical steels on the transformation temperature. Steel Res. Int. 2021, 92, 2100388. [Google Scholar] [CrossRef]
  9. Xie, L.; Yang, P.; Xia, D.S.; Mao, W.M. Microstructure and texture evolution in a non-oriented electrical steel during γ→α transformation under various atmosphere conditions. J. Magn. Magn. Mater. 2015, 374, 655–662. [Google Scholar] [CrossRef]
  10. Xie, L.; Yang, P.; Zhang, N.; Mao, W.M. Texture optimization for intermediate Si-containing non-oriented electrical steel. J. Mater. Eng. Perform. 2014, 23, 3849–3858. [Google Scholar] [CrossRef]
  11. Yang, P.; Xia, D.S.; Wang, J.H.; Mao, W.M. Influence of processing parameters on microstructures, textures and magnetic properties in a Fe-0.43Si-0.5Mn electrical steel subjected to phase transformation treatment. In Proceedings of the 11th annual Chinese Iron and Steel Congress, Beijing, China, 14 May 2017; pp. 6–12. [Google Scholar]
  12. Yang, P.; Zhang, L.W.; Wang, J.H.; Mao, W.M. Improvement of texture and magnetic properties by surface effect induced transformation in non-oriented Fe-0.82Si-1.37Mn steel sheets. Steel Res. Int. 2018, 89, 1800045. [Google Scholar] [CrossRef]
  13. Sung, J.K.; Lee, D.N.; Wang, D.H.; Koo, Y.M. Efficient generation of cube-on-face crystallographic texture in iron and its alloys. ISIJ Int. 2011, 51, 284. [Google Scholar] [CrossRef]
  14. Sung, J.K.; Koo, Y.M. Magnetic properties of Fe and Fe-Si alloys with {100} texture. J. Appl. Phys. 2013, 113, 17A338-1. [Google Scholar] [CrossRef] [Green Version]
  15. Sung, J.K.; Lee, D.N. Evolution of crystallographic texture in pure iron and commercial steels by γ to α transformation. Mater. Sci. Forum. 2012, 706–709, 2657–2662. [Google Scholar]
  16. Xie, L.; He, M.T.; Sun, L.Y.; Wang, J.T.; Lu, Y.L.; Yao, C.F. Columnar grain growth in non-oriented electrical steels via plastic deformation of an initial columnar-grained solidification microstructure. Mater. Lett. 2020, 258, 126797. [Google Scholar] [CrossRef]
  17. Xie, L.; Liu, S.J.; He, M.T.; Wang, J.T.; Wang, J.; Lu, Y.L.; Xu, W.T.; Yao, C.F. Growth and strain behavior of columnar grains in Fe-0.5%Mn alloy by hot-rolling. J. Alloys Compd. 2021, 877, 160257. [Google Scholar] [CrossRef]
  18. Yang, P.; Ma, D.D.; Gu, X.F.; Cui, F.E. On the transformation textures influenced by deformation in electrical steels, high manganese steels and pure titanium sheets. Front. Mater. Sci. 2022, 16, 220582. [Google Scholar] [CrossRef]
Figure 1. Schematic diagram of processing steps.
Metals 12 01628 g001
Figure 2. EBSD maps of 1# (1%Si) and 2# (0.72%Si) cast slabs. (a,c) IPF-ND map and (b,d) band contrast maps with grain boundaries characters (red: Σ3).
Metals 12 01628 g002
Figure 3. Micrographs in transverse section of hot-rolled sheets 1# (a) containing 1%Si and 2# (b) containing 0.72%Si.
Metals 12 01628 g003
Figure 4. EBSD maps of recrystallized structure and textures in two sheets with different rolling reductions in 2# sample annealed at 900 °C. (a) 0.5 mm; (b) 0.35 mm.
Metals 12 01628 g004
Figure 5. EBSD map of commercial 800-grade electrical steel measured on rolling plane. (a) orientation map; (b) orientation distribution function (ODF) figure at ϕ2 = 45° section.
Metals 12 01628 g005
Figure 6. The microstructure and texture evolution during transformation treatment in 2# sheets at different holding times. Starting from hot-rolled sheets, cold rolling to 0.5 mm with 80% reduction. Heating to 1050 °C for different time and cooled either by water quenching (a1a3) or 5 °C/min in H2 of 4 L/min (a4a6). (a1a6) IPF-ND maps, (b1b6) band contrast maps (red lines: Σ3 boundary) and (c1c6) ODFs at ϕ2 = 45° section.
Metals 12 01628 g006
Figure 7. EBSD maps after final transformation treatment under 3 different processing parameters C1 to C3 of 1# sample, 0.5 mm thickness. (a) EBSD maps of IPF-ND, (b) Band contrast maps (red line: Σ3); (c) ODFs at ϕ2 = 45° section.
Metals 12 01628 g007
Figure 8. EBSD maps of 1# sheets similarly processed on 0.35 mm cold rolled sheets after final transformation treatment at 1150 °C under three conditions C1 to C3. (a) EBSD maps of IPF-ND, (b) Band contrast maps (red line: Σ3); (c) ODFs at ϕ2 = 45° section.
Metals 12 01628 g008
Figure 9. EBSD maps of 2# samples after final transformation treatment by 1150 °C of three conditions C1 to C3 on the 0.5 mm cold rolled sheets with initial columnar grain structure. (a) IPF-ND maps; (b) band contrast maps with boundary characters (red lines: Σ3); (c) ODFs at ϕ2 = 45° section.
Metals 12 01628 g009
Figure 10. EBSD maps of 2# sheets after final transformation treatment by 1150 °C of three conditions C1 to C3 following cold rolling of columnar grained samples to 0.35 mm. (a) IPF-ND maps (b) band contrast maps with boundary characters (red lines: Σ3); (c) ODFs at ϕ2 = 45° section.
Metals 12 01628 g010
Figure 11. EBSD maps of 1# sheets after final transformation treatment by heating to 1150 °C under three conditions C1 to C3 following cold rolling of hot bands to 0.5 mm. (a) IPF-ND maps; (b) band contrast maps (red lines: Σ3); (c) ODFs at ϕ2 = 45° section.
Metals 12 01628 g011
Figure 12. EBSD maps of 1# sheets after final transformation treatment under three conditions C1 to C3 of cold rolled 0.35 mm sheets from initial hot-rolled plates. (a) IPF-ND maps; (b) band contrast maps (red lines: Σ3); (c) ODFs at ϕ2 = 45° section.
Metals 12 01628 g012
Figure 13. EBSD maps of 2# sheets after final transformation treatment under three conditions C1 to C3 of cold rolled 0.5 mm sheets from initial hot-rolled structure. (a) IPF-ND maps; (b) band contrast maps (red lines: Σ3); (c) ODFs at ϕ2 = 45° section.
Metals 12 01628 g013
Figure 14. EBSD maps of 2# sheets after final transformation treatment under three conditions C1 to C3 of cold rolled 0.35 mm sheets from hot-rolled bands. (a) IPF-ND maps; (b) band contrast maps (red lines: Σ3); (c) ODFs at ϕ2 = 45° section. Red arrow in (a) indicates a small region of two-layer grains in C3-processed sheet.
Metals 12 01628 g014
Figure 15. Calculated phase diagrams of different Al contents. (a) Fe-Si-0.5Mn; (b) Fe-Si-1.37Mn; (c) 1#; (d) 2#.
Metals 12 01628 g015
Table 1. Compositions (wt%) of samples 1# and 2# and their transformation temperatures (°C; heating/cooling rate: 10 °C/min.).
No.SiMnPSAlAc1Ac3Ar3Ar1
1#10.250.00950.00220.26100010751000960
2#0.720.210.0820.00260.00049701025940920
Table 2. Processing parameters of final transformation treatments for 1# and 2# samples.
RoutineHeating TemperatureH2 Flow RateCooling Rate
C11150 °C + 5 min8 L/min5 °C/min
C21150 °C + 5 min3 L/min5 °C/min
C31150 °C + 5 min8 L/min~25 °C/min by Power off
Table 3. Composition of steels and their key Si contents and A1 and A3 temperatures.
No.Composition (wt%)Max Si% in AusteniteMini Si% When Austenite
Disappear
A1–A3 (°C)Degree of
Superheating (T-A3) (°C)
[9,11]Fe-Si-0.5Mn2.2 (1185 °C)2.65 (1170 °C)855–890 (0%Si)/875–920 (0.45%Si)110/80
[12]Fe-Si-1.37Mn3.0 (1200 °C)3.77 (1185 °C)820–900 (0.82%Si)100
1#0.0020C-0.0095P-0.25Mn-0.26Al1.37 (1170 °C)1.8 (1165 °C)970–1050 (1%Si)100
2#0.0020C-0.082P-0.21Mn-0.0004Al1.5 (1170 °C)2.06 (1150 °C)925–995 (0.72%Si)155/55
Publisher’s Note: MDPI stays neutral with regard to jurisdictional claims in published maps and institutional affiliations.

