Article

Hydrogen Absorption during Case Hardening of Steels EN20MnCr5 (SAE5120) and EN18CrNiMo7-6 (SAE4820)

1
Leibniz-Institute for Materials Engineering—IWT, Badgasteiner Straße 3, 28359 Bremen, Germany
2
Prof. Hoffmann Werkstofftechnik, Braut-Eichen 17, 28757 Bremen, Germany
3
MAPEX Center for Materials and Processes, Universität Bremen, Bibliothekstraße 1, 28359 Bremen, Germany
*
Author to whom correspondence should be addressed.
Metals 2022, 12(1), 6; https://doi.org/10.3390/met12010006
Submission received: 22 November 2021 / Revised: 17 December 2021 / Accepted: 18 December 2021 / Published: 21 December 2021

Abstract

:
Damages to case-hardened components are often associated with the phenomenon of hydrogen embrittlement due to their specific fracture pattern. In the present work, the effects of the case hardening process on the hydrogen content in the material were investigated and the effects of hydrogen on the mechanical properties were examined. In order to determine not only the influence of the heat treatment process but also the influence of the material, the case-hardening steels EN20MnCr5 (SAE5120) and EN18CrNiMo7-6 (SAE4820) with different degrees of purity were investigated. From the results it can be deduced that the sulphidic and oxidic inclusions have no significant influence on the hydrogen content. When checking the mechanical properties, it was shown in the incremental step loading technique according to ASTM F1624 that a purely case-hardened condition only has a slight tendency to hydrogen embrittlement. However, if the material is additionally loaded with hydrogen, the material fails significantly below the maximum expected load in the incremental step loading test, which is to be interpreted as a clear indication of failure due to hydrogen embrittlement. However, the fracture patterns of these two states do not show any significant differences. Therefore, it does not seem possible to attribute damage to a case-hardened component to hydrogen embrittlement on the basis of the fracture pattern alone.

1. Introduction

The damaging effect of hydrogen on high-strength material states has been known for a long time and is referred to as hydrogen embrittlement [1]. Hydrogen penetrating the material can cause sudden component failure, even at loads below the yield strength [2,3]. Particularly with the further development of high-strength materials, research in this area has increased, as the sensitivity to hydrogen increases with the strength. The mechanisms of hydrogen absorption as well as hydrogen transport and hydrogen solubility in the material are of great importance. The fundamentals of this have been comprehensively summarised in the literature [4,5,6].
Case-hardening is one of the most frequently used processes for the thermochemical surface treatment of highly stressed drivetrain components in order to produce a high-strength surface layer paired with a ductile core. Carbon is introduced into the surface layer so that after subsequent hardening the component has a wear-resistant surface layer and a tough core area. Hydrogen plays an important role in the carburisation process. Most atmospheres used for carburization contain a high proportion of hydrogen playing a pivotal role determining the speed of the carburisation process [7]. As hydrogen is a mandatory atmosphere component during gaseous carburization it thus is significantly involved in the boundary reaction of the carbon and can penetrate into the material [8,9]. At least an equilibrium hydrogen content will be achieved from carburization just like the carbon profile intentionally designated.
The diffusible hydrogen can effuse after quenching, a temperature increase during tempering treatment accelerates this process. Since tempering treatment is mostly carried out in the temperature range <190 °C, there will remain a significant amount of hydrogen in the surface layer and below even after tempering because of the limited diffusions speed at such low temperatures. In gas carburising with endogenic gas atmospheres, values of about 4 ppm are averaged over the depth of the case hardening layer; in processes with direct gassing (e.g., nitrogen-methanol), higher values are sometimes measured [8,9,10]. Since there is a hydrogen gradient in the material and the averaging often takes place over the entire case hardening layer, significantly higher peak values must be expected locally.
Streng [8,10] showed the influence of the carburising process in his investigations. Gas carburisation with direct hardening led to the highest hydrogen uptake. The second austenitisation with single hardening led to a reduction in the hydrogen content and with low-pressure carburising no hydrogen input could be determined, the diffusion stages at reduced pressure even led to a reduction in the hydrogen content compared to the initial state. This was also proven by investigations by Laumen et al. [11]. Studies by Hoffmann showed that hydrogen uptake is influenced by the carbon potential of the atmosphere [9].
The uptake of atomic hydrogen in steels always takes place via the partial steps of molecular adsorption, dissociation into H+ ions, absorption and diffusion. The major part of the hydrogen ions recombines and is discharged back into the atmosphere, a smaller portion diffuses into the material [12]. Below 300 °C, hydrogen is not only dissolved into the matrix as interstitial, but can also be present in larger quantities in so-called “traps”. The interactions between the atomic hydrogen and the traps are essential for the consideration of the mode of action, cf. [5]. It follows that hydrogen is dissolved at carburising temperature and can be partially bound to the traps after quenching.
At these traps, i.e., lattice defects, there is a stronger accumulation of hydrogen (molecular hydrogen in cavities and on surfaces, atomic hydrogen on phase boundaries and in and around dislocations and vacancies) or in stress fields. The increase in hydrogen solubility due to lattice defects is approximately 100 times that of a material without defects [13].
For thermodynamic reasons, the hydrogen pressure in the pores cannot exceed the external pressure in the case of pressurised hydrogen loading, whereas it can rise to 100 bar in the case of electrochemical processes [14]. This can then lead to pickling bubbles.
As is to be expected, the hydrogen solubility increases with tensile stresses (as a result of the expansion of the lattice) and decreases with compressive stresses [6]. According to Pöpperling and Schwenk [15], there is no correlation between the service life and the hydrogen content of a sample. The service life increases with an increasing number of hydrogen sinks inside the material. Thus the influence of phase boundaries and precipitations may be of interest. Furthermore, this indicates that in addition to the absolute hydrogen content, the dissolved hydrogen and trapped hydrogen content should also be considered.
There is still no overarching theory for the general interpretation of hydrogen embrittlement and its processes [4]. The most likely mechanisms are HEDE (hydrogen-enhanced decohesion) and HELP (hydrogen-enhanced local plasticity), which can also occur simultaneously according to a simulation model by Novak et al. [16]:
  • HEDE (hydrogen-enhanced decohesion): The interstitially dissolved hydrogen atoms lead into a reduction in the cohesive forces between the iron atoms [4,16,17,18,19]. It is assumed that the hydrogen accumulates in the lattice widened by stresses at some distance from e.g., a crack tip. So far, according to Barnoush, there is no evidence that the necessary enrichment can occur as calculated or predicted in the simulations [4]. However, experiments show a clear influence.
  • HELP (hydrogen-enhanced local plasticity): The stress/strain state in the region of the crack tip leads to an energetically favourable arrangement of the lattice defects for hydrogen incorporation, so that it accumulates in these regions [20]. The model assumes that dislocations can move more easily there and thus a locally very limited, increased plasticity occurs, the crack propagation rate increases and a brittle fracture forms as a result [4,5,21].
Damage to case-hardened components is often associated with hydrogen after fracture surface examinations under the scanning electron microscope, as the damage patterns resemble hydrogen fractures:
  • fracture surfaces along the grain boundaries,
  • pores on the grain boundaries and
  • gaping grain boundaries.
However, this does not take into account that high-strength material states show the same characteristics as fractures that tend to occur with hydrogen participation. This is because the surface layer of case-hardened components contains such a high-strength material state: low tempered martensite with carbon contents that are usually between 0.6 and 1.2 wt%. Very often, a damage investigation with regard to hydrogen as the cause of damage reveals that other causes—such as metallurgical notches, manufacturing defects, improper heat treatment or unfavourable stress conditions—were the cause of the damage.
Although there are many general statements on hydrogen absorption and the behaviour of hydrogen in the material, the state of knowledge on the connection between hydrogen absorption and release during case hardening is still insufficient. The present investigations are therefore focused on hydrogen absorption of steels during case hardening in order to determine the effects of individual key process variables on the resulting hydrogen content after carburisation and tempering. For this purpose, the influence of the case hardening process, the carburising atmosphere and the tempering were considered on the process side. On the material side, the chemical composition and purity were varied in order to investigate their effect on hydrogen absorption, the resulting hydrogen content and the resulting mechanical properties.

2. Experimental Setup

2.1. Materials and Samples

Four material melts EN20MnCr5 (SAE5120) (0.16–0.18 wt% C, 0.27–0.30 wt% Si, 1.19–1.25 wt% Mn, 1.14–1.26 wt% Cr) and three material melts EN18CrNiMo7-6 (SAE4820) (0.17–0.19 wt% C, 0.21–0.33 wt% Si, 0.54–0.75 wt% Mn, 1.61–1.71 wt% Cr, 0.26–0.28 wt% Mo, 1.44–1.49 wt% Ni) are involved in the investigations. The melts are numbered consecutively with Roman numerals. The exact composition of the individual melts can be found in [22]. All seven materials were melted using the electric steel process. The materials were selected in such a way that they offer a broad spectrum with regard to the degree of purity in order to determine the influence of the degree of purity on the hydrogen absorption during case hardening. The degree of purity of the edge and core areas of the used materials has been determined according to DIN 50602 (method K) and is listed in Table 1. This method evaluates the sulphidic and oxide inclusions with factors according to their size and distribution.
In order to expand the material variety with regard to the degree of purity (non-metallic inclusions), samples of each material were taken from the edge area as well as from the core area of the available hot rolled bars, since it is known that the core area of continuous cast materials has a lower degree of purity than the edge area. The effective position referred to as core area is in the very centre of the bars and the position of the edge area is at 75% of the radius of the respective bars.
Suitable samples were produced from the test materials for the various analysis methods and tests. The samples for melt extraction have a mass of 1 g and a cylindrical dimension of ⌀ 9 × 2 in mm and the samples for the HCA method have a cylindrical dimension of ⌀ 9 × 60 in mm. The 4-point bending beams have a dimension of 33 × 7 × 7 in mm with a U-notch in the middle. The individual geometries of the samples are documented in detail in [22].
The investigations on the influence of the carburising atmosphere on the hydrogen absorption during case hardening were carried out on iron foils.

2.2. Heat Treatment

Two different processes and furnaces were used for the heat treatments. The two carburising processes are gas carburising and low-pressure carburising. Gas carburising was carried out in a multi-purpose bell furnace made by SOLO, Porrentruy, Switzerland. The charge chamber has the dimensions 300 × 300 × 300 mm3. The atmosphere was generated by direct gassing with nitrogen-methanol. The heat treatment was carried out in a single-stage process (view Figure 1).
The low-pressure carburising was carried out in a two-chamber system from Ipsen, Kleve, Germany, type RVFOQ, with integrated oil quenching. The batch chamber has the dimensions 400 × 300 × 220 mm3. The carburising medium used was 600 L/h acetylene at a pressure of 4 mbar; evacuation to approximate 5 × 10⁻² mbar was applied during the diffusion phase. The programme used was composed of seven alternating carburising and diffusion steps (carburizing + diffusion: 2 + 20-1.5 + 30-1.5 + 30-1.5 + 30-1 + 30-1 + 40-1 + 40 in min). After carburising, the temperature was reduced to 850 °C in 20 min, held for 40 min in vacuum and subsequently quenched with 10 bar nitrogen for 10 min at maximum fan speed in a cold chamber.
Both carburising processes were carried out at a typical temperature of 940 °C. A surface carbon content of 0.7 wt% and a case hardening depth of 0.6 mm were aimed for. Following oil quenching, the samples were washed in a washing machine at 60 °C for 20 min.
Tempering was carried out in conventional chamber furnaces in air.

2.3. Hydrogen Analysis

2.3.1. Total Hydrogen Content

The total hydrogen content was measured via melt extraction. This method is very common for hydrogen analysis. The sample is melted so that the total hydrogen is measured. For the present investigations, a measuring device of the company Eltra, Haan, Germany of the type ONH-2000 was used.
The samples were washed directly after heat treatment and the surface was sanded by hand with fine sandpaper.

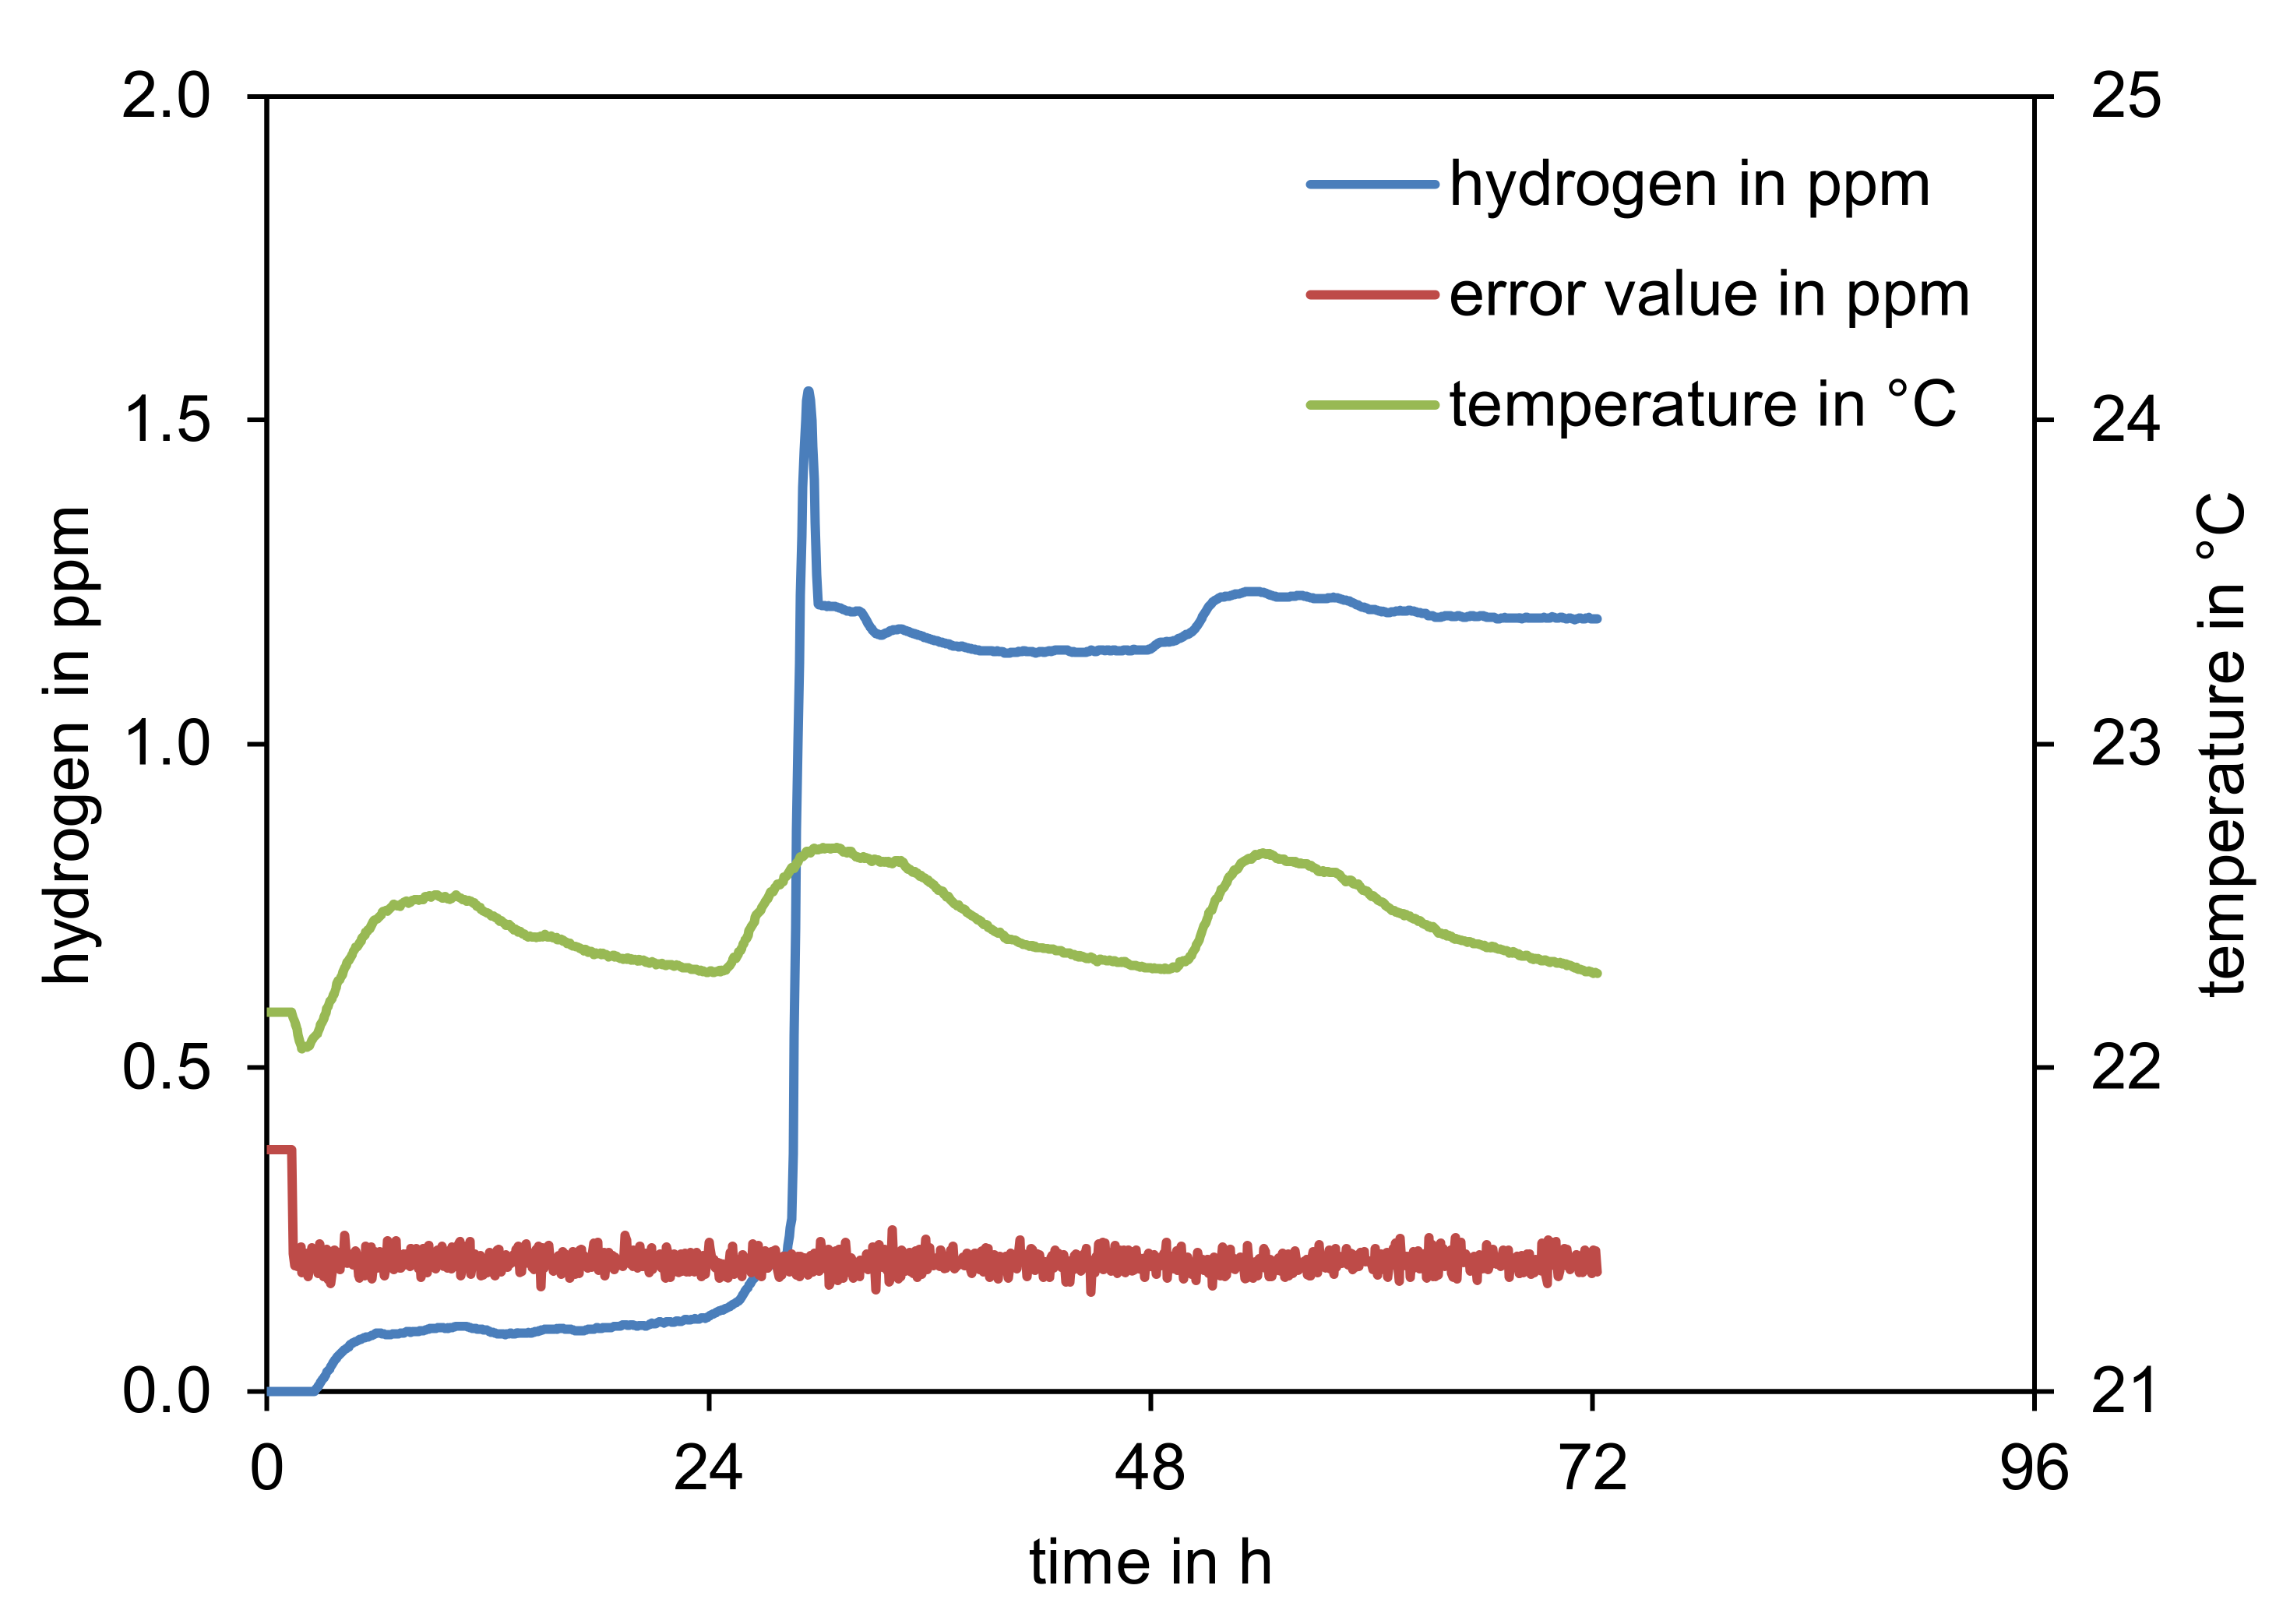
2.3.2. Diffusible Hydrogen Content

To measure the diffusible hydrogen in a sample, the Hydrogen Collecting Analysis (HCA) method was applied. This hot extraction method was carried out at the Ruhr University Bochum (RUB) in the Institute for Materials, Department of Materials Testing. In order to ensure that as little hydrogen as possible diffuses out of the samples during transport, the samples were directly stored and transported in a container cooled with liquid nitrogen after hydrogen loading test.
To determine the diffusible hydrogen content with the HCA method, the sample was enclosed in an evacuated cuvette and annealed at 210 °C for a period of 24 h, so that the hydrogen diffusible up to this temperature diffuses out of the material. Subsequently, the hydrogen content was determined with the aid of a conventional carrier gas analyser of the company Eltra, type ONH-2000.
In addition, the diffusible hydrogen was determined with the sensor system of the company KircTec, Göttingen, Germany. For the measurement, a vanadium probe is applied to the sample by means of resistance spot welding. The probe has a higher affinity for hydrogen than the steel sample under investigation, which increases the hydrogen concentration in the probe, which is continuously monitored by the means of transient change of electrical conductivity. In addition, the H-sensor can be used to measure the permeation of hydrogen through the sample. For this purpose, the other side of the sample is additionally brought into contact with aqueous H2SO4 solution. A constant current is applied between the sample and a Pt electrode in the electrolyte so that electrochemical hydrogen charging takes place.

2.3.3. Residual Hydrogen Content

The measurement of the residual hydrogen content was carried out after effusion annealing as part of the HCA process. It was assumed that no diffusible hydrogen is present after annealing up to a temperature of 210 °C and that only bound, residual hydrogen is present in the material.
The samples were taken by wire cutting and the cut surface was sanded by hand with fine sandpaper to remove the copper deposit.
The residual hydrogen content was then determined by using the melt extraction method.

2.4. Experiments to Determine the Factors Influencing Hydrogen Up-Take

2.4.1. Carburising Conditions
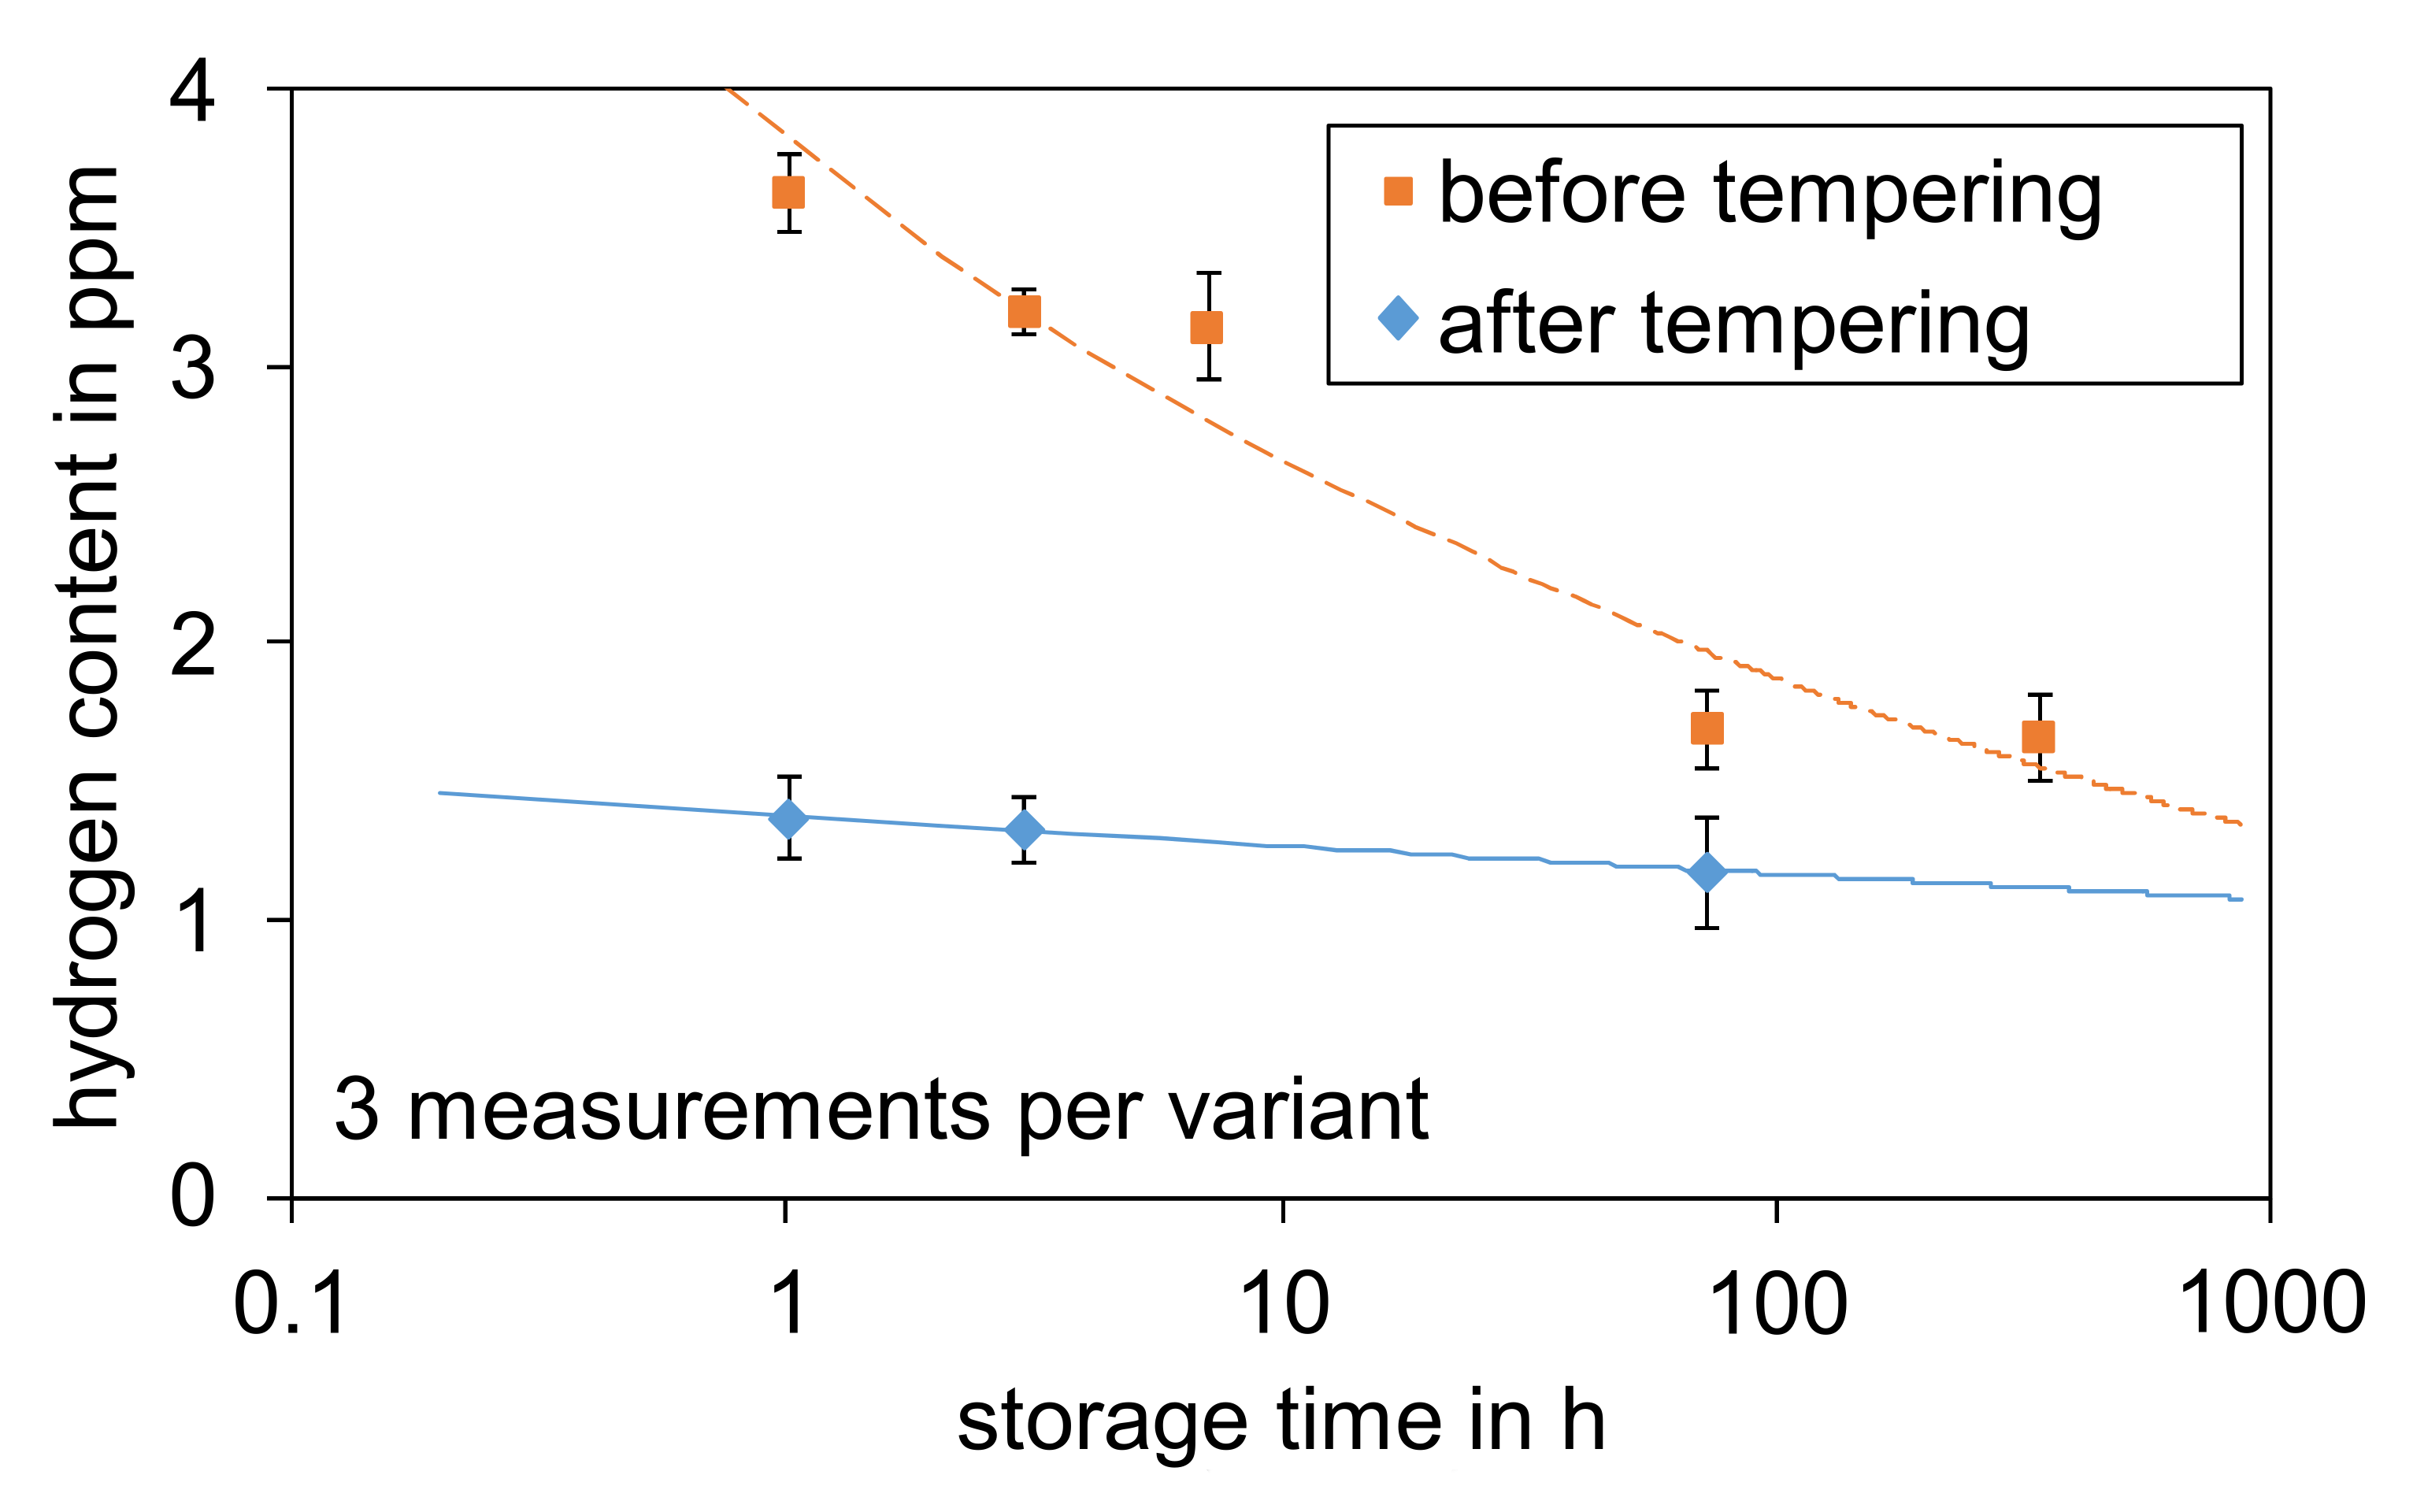
The investigations on the influence of the carburising atmosphere on hydrogen absorption were carried out using iron foils. These were introduced with a batching aid from below through an airlock into the furnace chamber of the bell furnace. The foils were annealed for 20 min in the furnace atmosphere. Immediately after the annealing treatment, the films were cleaned, cut into small pieces and examined for their carbon and hydrogen content.
The method of Design of Experiment was used to determine the effect of the carburising parameters on the hydrogen uptake. Three statistical test plans were created and evaluated with the statistical software Cornerstone™ from camLine. The first experimental design DoE I comprises the three factors “hydrogen in the carburising atmosphere” (20–50 vol%), “carburising temperature” (925–1015 °C) and “carbon potential” (0.58–1.03 wt% C). These were varied to five factor levels each in a central composite circumscribed (CCC) type experimental design.
Based on the results of the first experimental design, supplementary experiments were carried out in a second experimental design DoE II. Again, the three factors “hydrogen in the carburising atmosphere” (35–50 vol%), “carburising temperature” (940–1000 °C) and “carbon potential” (0.8–1.0 wt% C) were considered in a restricted range of values. Since the number of factor levels differs for the individual factors, an experimental design of the type “d-optimal” was used.
Based on the first two experimental designs, a supplementary third experimental design DoE III was set up under sole variation of the factor “carbon potential” (0.58–1.03 wt% C). The factors “hydrogen in the carburising atmosphere” (50 vol%) and “carburising temperature” (940 °C) were kept constant, so that according to the first two experimental plans a high hydrogen content in the iron foils is to be expected.

2.4.2. Tempering

To determine the effect of tempering, the total hydrogen content was determined on case-hardened and tempered samples of the material 18CrNiMo7-6 (III). The tempering was carried out according to a statistical test plan. The statistical test plan was also planned and evaluated with the help of the statistical programme Cornerstone from camLine. Three factors “tempering temperature” (180, 210, 240 °C), “tempering time” (1, 2, 4 h) and “storage time” (1, 3, 72 h), the time between quenching and tempering, were examined. Consequently, using a d-optimal experimental design results in a number of 15 factor level combinations. In order to additionally investigate the influence of the removal position or the degree of purity, samples were taken from the edge and core area of the material 18CrNiMo7-6 (III).
In order to determine the dependence of the diffusible and residual hydrogen on the tempering treatment, further tempering treatments were carried out at temperatures of 100 to 220 °C (20 K steps) for 1 h. Each heat treatment condition was investigated on three HCA samples for statistical validation.

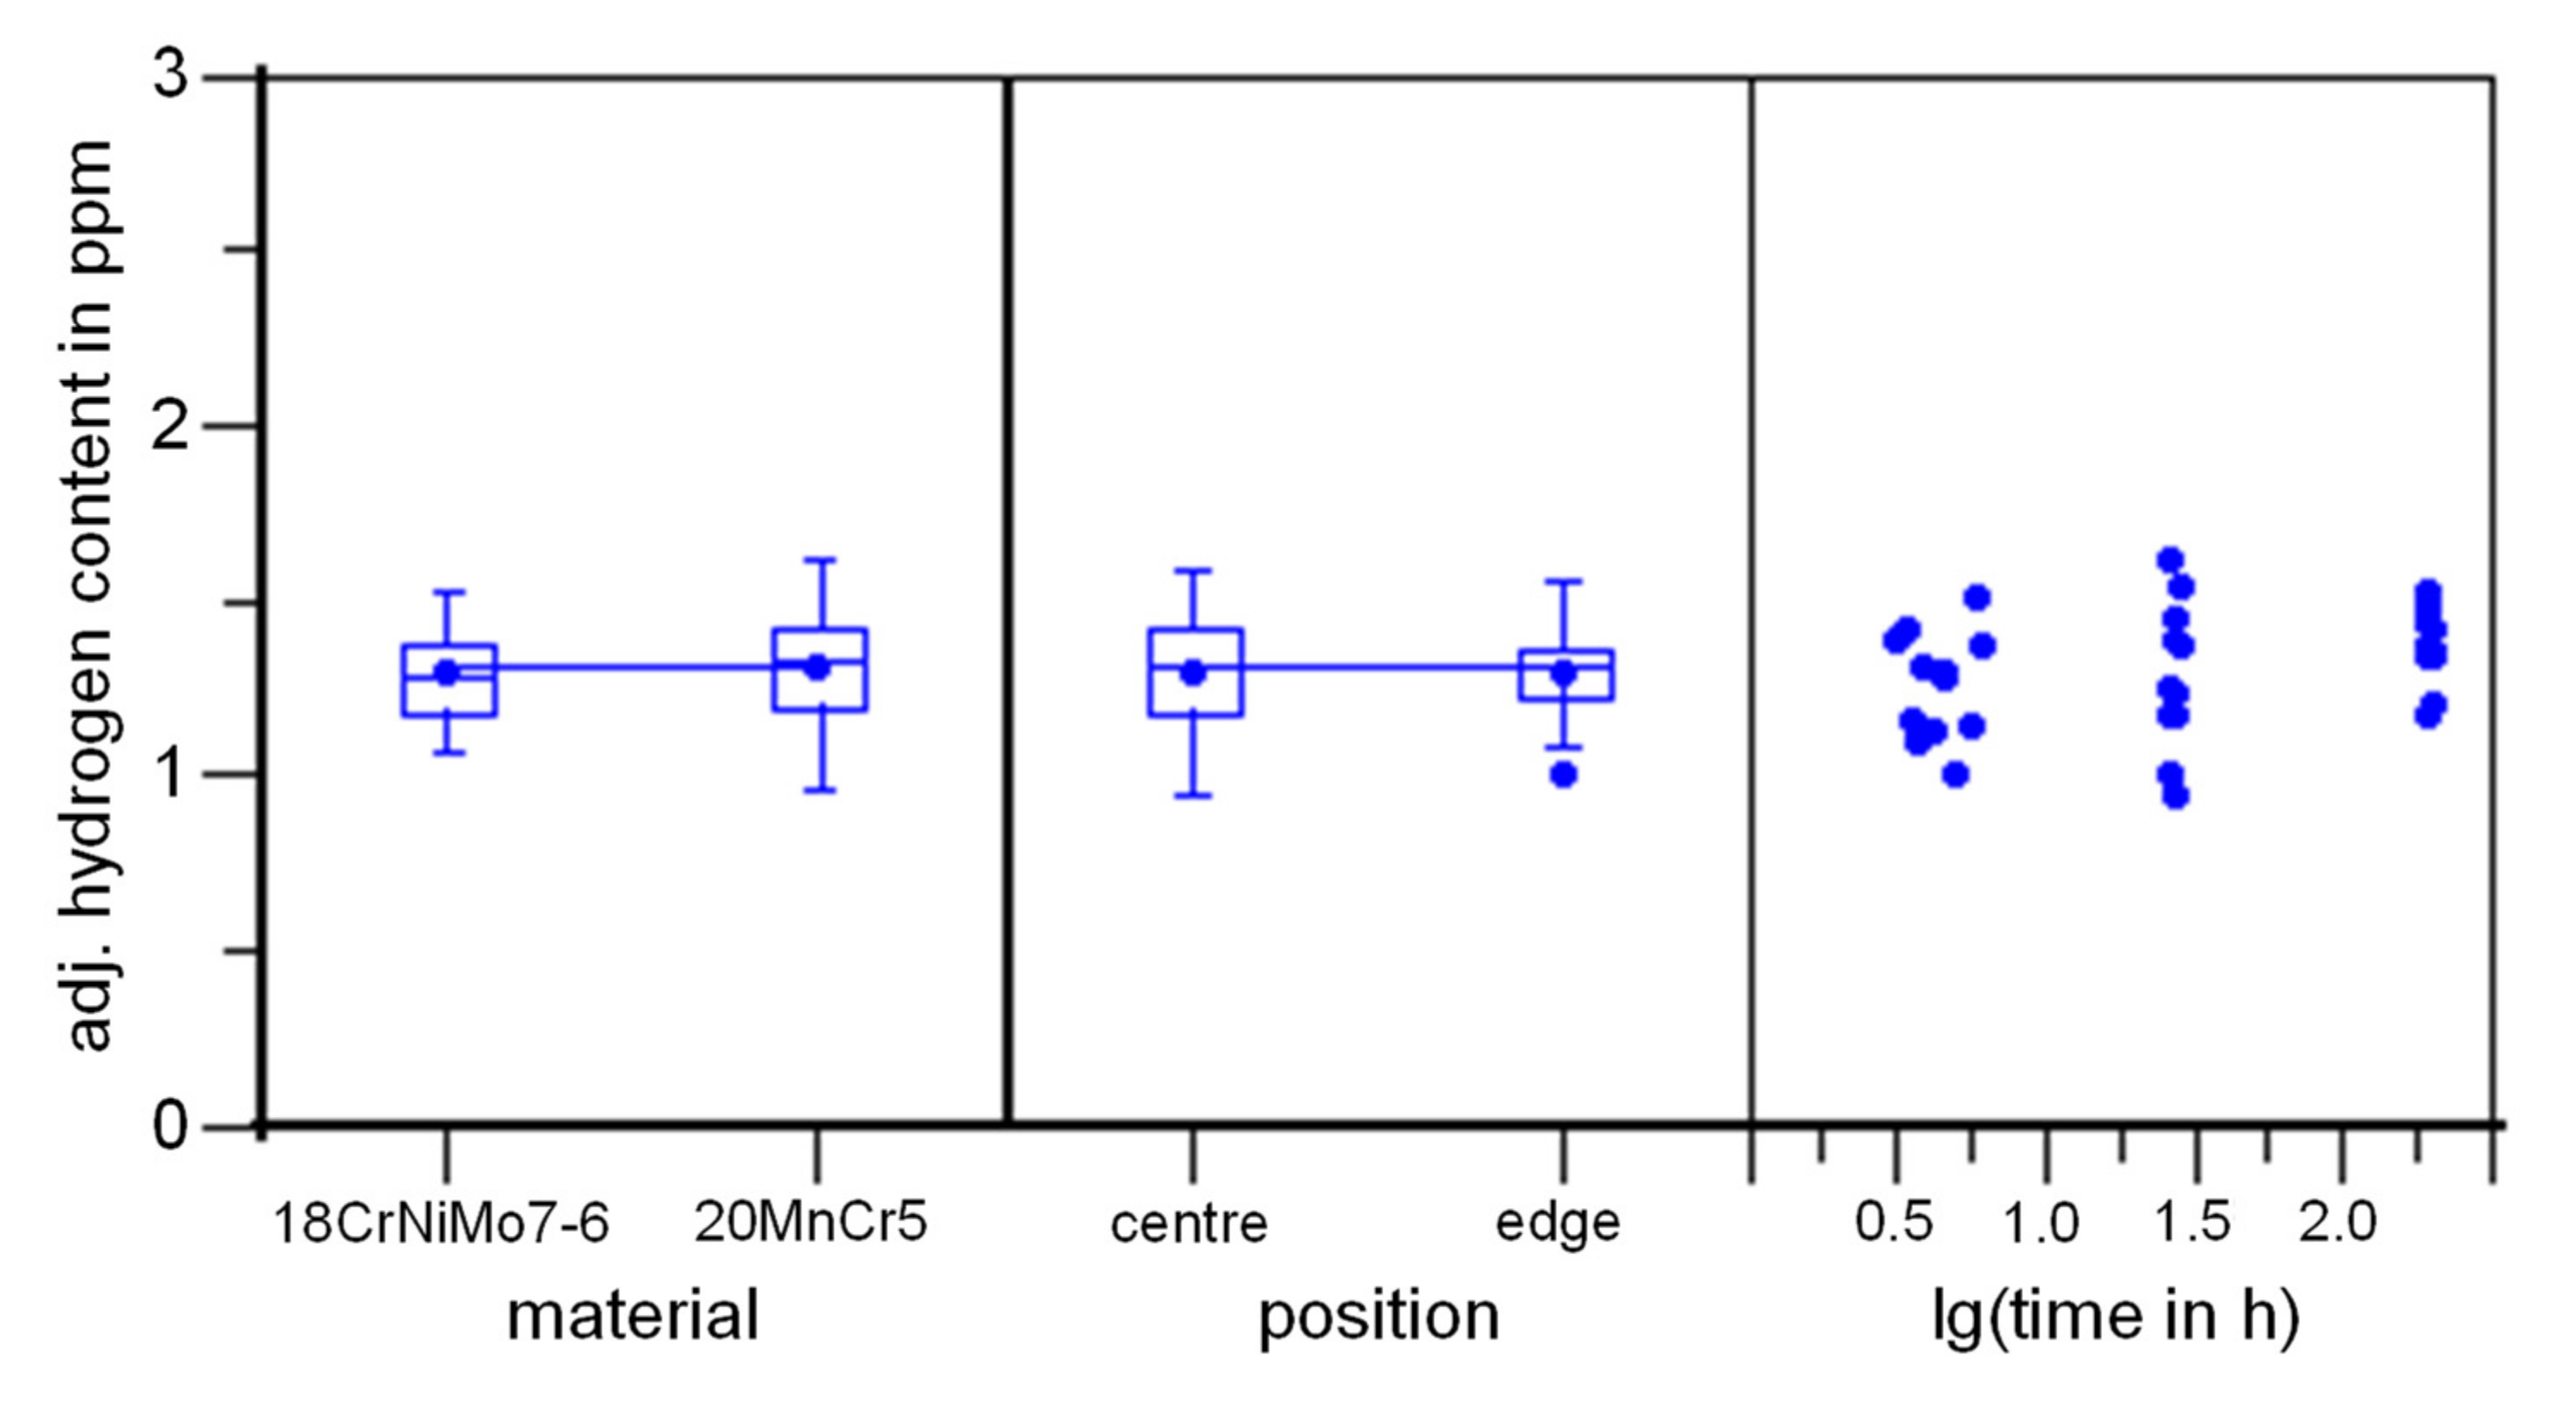
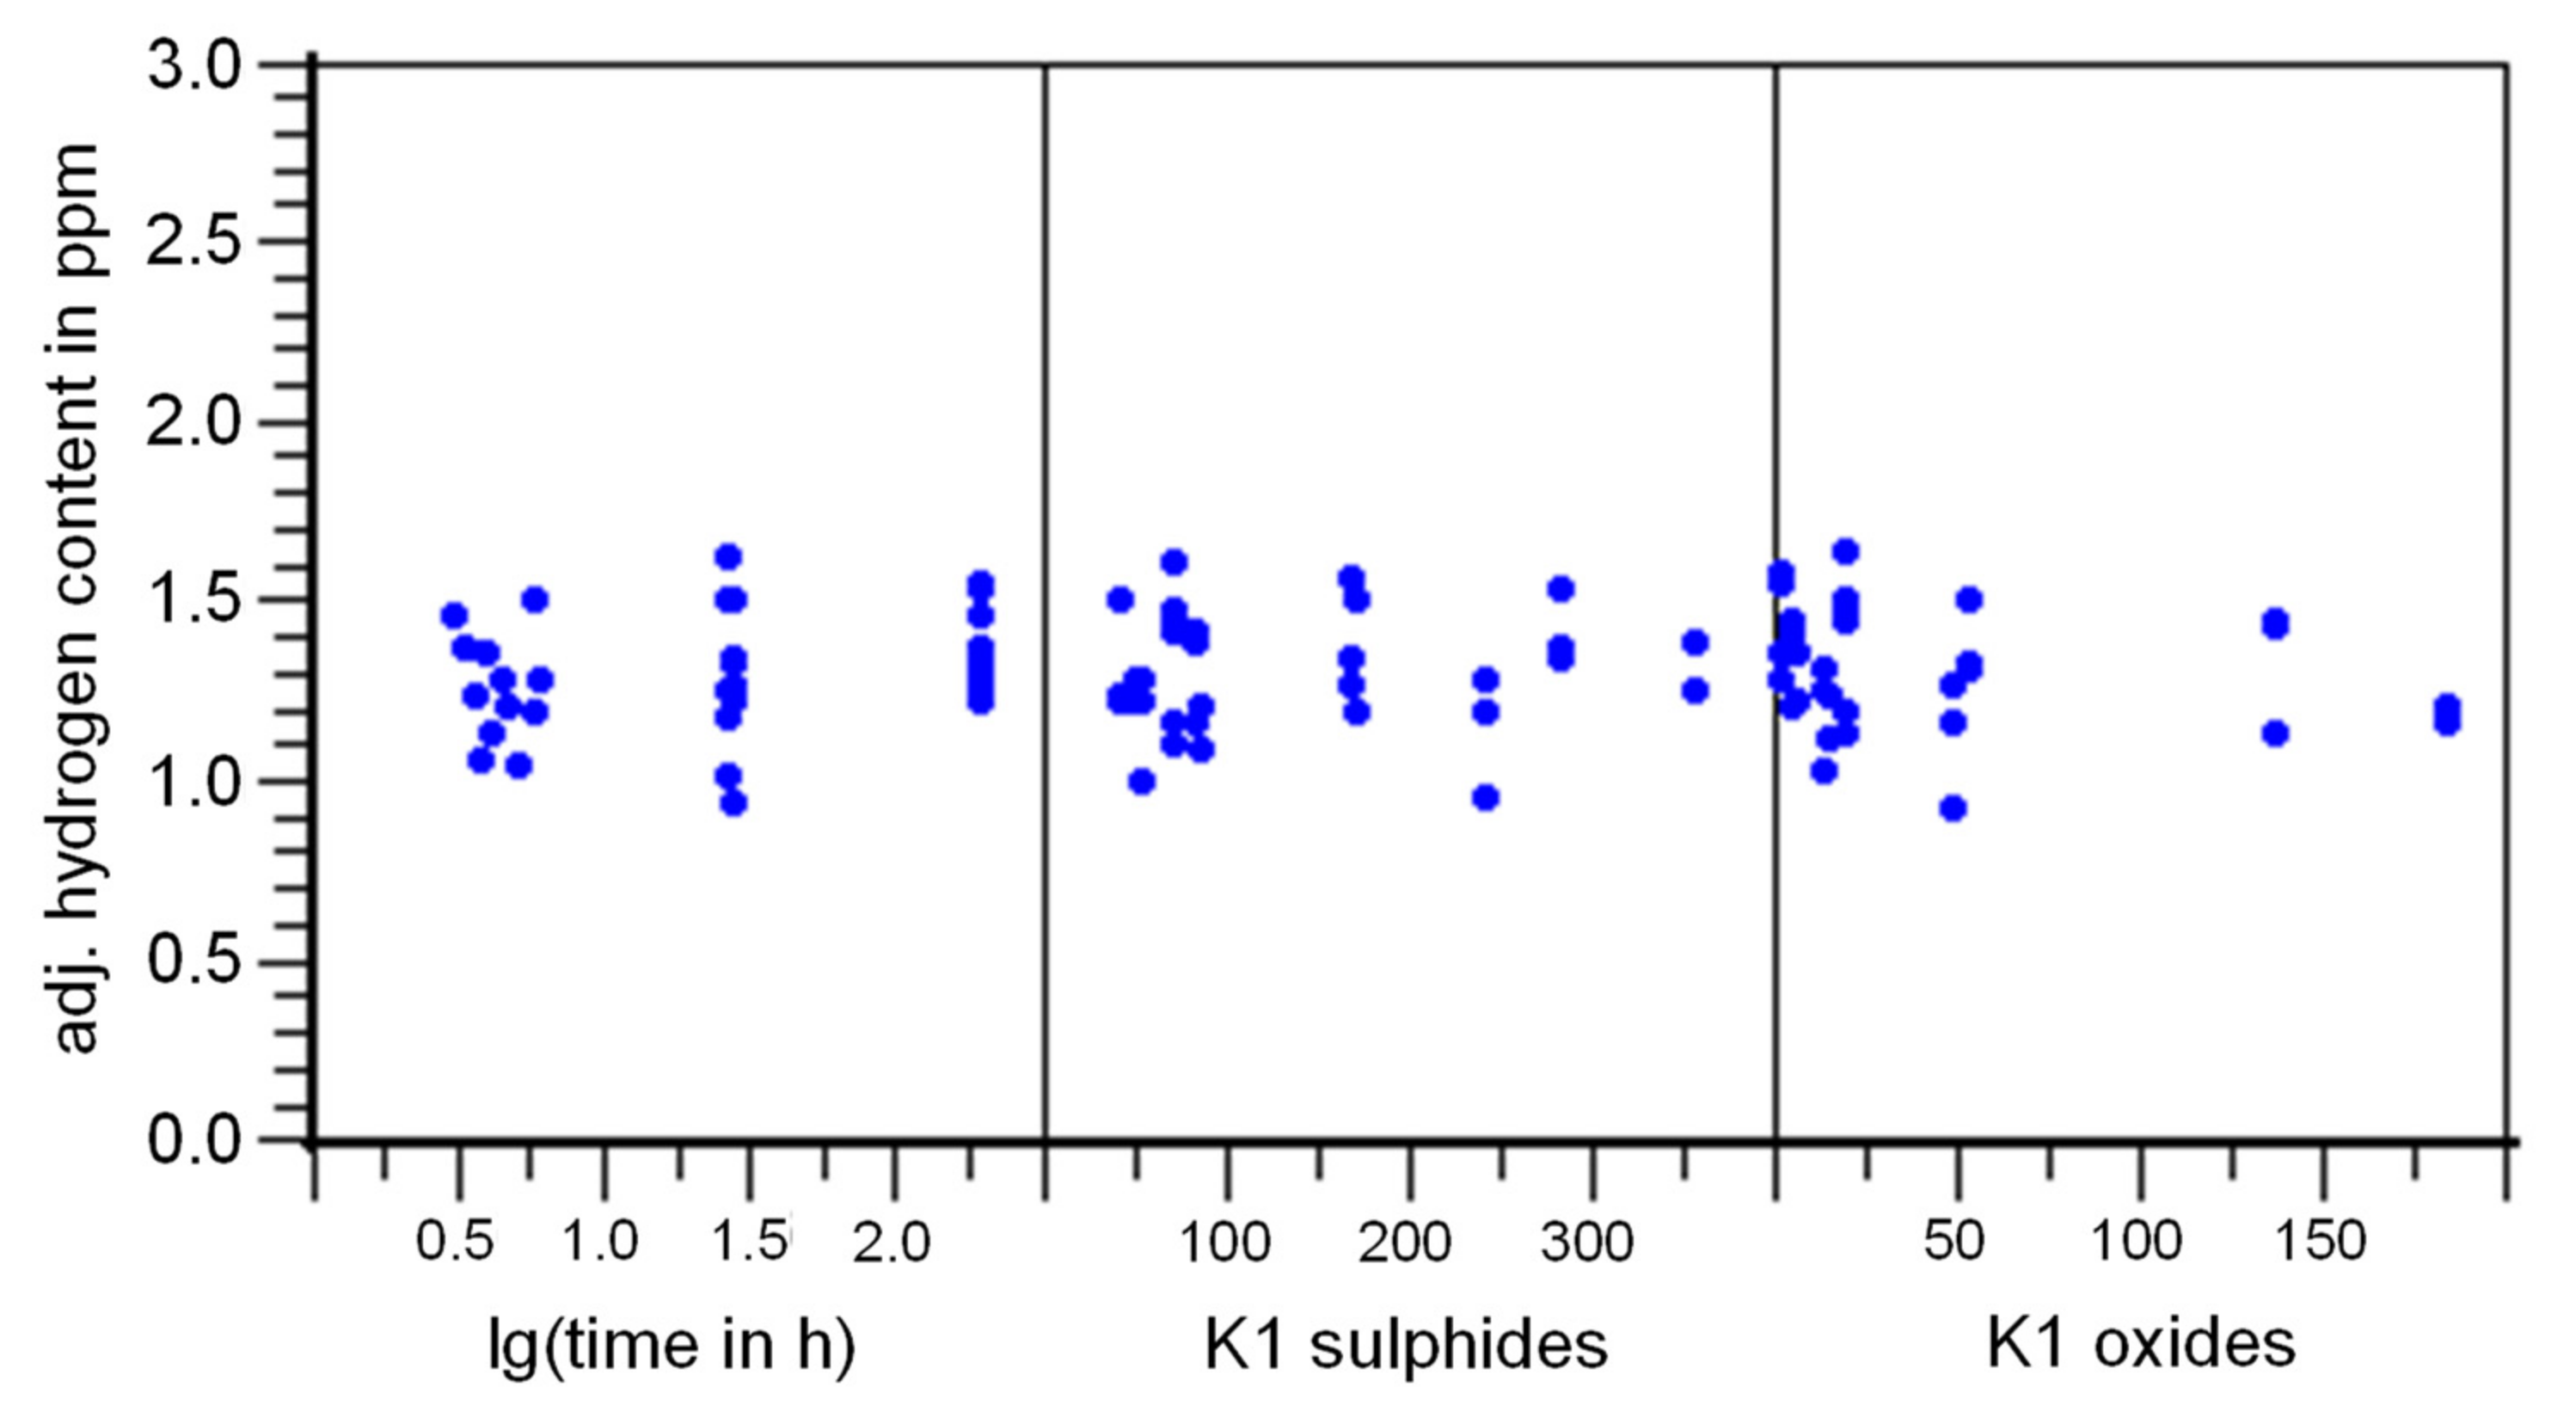
2.4.3. Material and Degree of Purity

In order to derive a statement about the absorption and effusion behaviour as a function of the degree of purity of the material, the total hydrogen content was determined for various melts of the case-hardened steels 20MnCr5 and 18CrNiMo7-6 in the quenched state and after a tempering treatment at 180 °C for 1 h, in each case at three points in time after the melt extraction process. The first time point was 3 to 6 h, the second 1 day and the third 8 days after quenching.

2.5. Mechanical Properties

In order to prove a possible damaging effect of hydrogen in case-hardened material conditions, incremental step loading tests according to ASTM F1624 were carried out with 4-point bending beams using a universal testing machine with spindle drive from Schenk-Trebel 250 kN. Each test is statistically validated with three specimens (n = 3). The dimensions of the samples are described in Section 2.1.
Table 2 lists the material states investigated in this section. The first state was set by an industrial gas carburising (GC) in a multi-purpose bell furnace. Gassing was carried out with a mixture of nitrogen-methanol. A hydrogen content of 50 vol% was set in the atmosphere. A second condition was case-hardened together with the samples of the gas carburised condition, but, in contrast, electrolytically charged with hydrogen (H-charged) for 20 h immediately before the mechanical test. The electrolyte of the electrolysis cell consisted of 0.5 molar aqueous sulphuric acid and the applied current density was 5 mA/cm2. A third, low-hydrogen state was set by a low-pressure carburisation (LPC).
The near-industrial, gas carburised condition was investigated on four material melts of 20MnCr5 (I, II, III, IV) and on two material melts of 18CrNiMo7-6 (I, II). The “H-charged” condition was tested in a short experiment on the material 20MnCr5 (III) and the low-pressure carburised, low-hydrogen condition was tested in a random test on the material 20MnCr5 (II).

3. Presentation and Discussion of the Results

3.1. Carburising Process

The diffusible and residual hydrogen contents measured after conventional gas carburising and low-pressure carburising are shown in Table 3. The total hydrogen content of the material 18CrNiMo7-6 (III) in the initial state was determined in advance using the melt extraction method.
The conventionally gas carburised samples show higher contents of diffusible and residual hydrogen in the quenched state than the low-pressure carburised samples. In the quenched gas carburised state, a total of just under 4 ppm H can be measured, this value agrees with the value from Sieverts’ solubility at approx. 1000 °C [23]. By tempering at 180 °C for one hour, the contents decrease and approach a total value near the hydrogen content of the initial state.
The samples carburised at low pressure show almost no diffusible hydrogen after heat treatment. The residual hydrogen content is also very low and lower than in the initial state. These low contents are due to the process of low-pressure carburising, since carburising pulses and diffusion phases alternate during low-pressure carburising, and the diffusion phases take place in a vacuum, the diffusion phases act like a low-hydrogen annealing at elevated temperatures and therefore significantly reduce the hydrogen content.
The result graph of the H-sensor is shown in Figure 2. The H-sensor continuously outputs the hydrogen content, an error value (standard deviation) and the temperature. The measurement took place over 72 h. The fluctuations of the temperature between 22.3 and 22.7 °C are due to the day-night rhythm despite the air-conditioned room. After 24 h, the value of the hydrogen content rises to 1.5 ppm and then settles at 1.2 ppm. The error value is 0.2 ppm. So this sample has a diffusible hydrogen content of (1.2 ± 0.2) ppm. The value of the H-sensor is below the value of the HCA method.
Since the results of the H-sensor depend significantly on the number and quality of the welding spots and the factually difficult to weld case-hardened material conditions, the continuous H-sensor was not used more extensively.

3.2. Carburising Atmosphere

The influence of the three investigated factors “hydrogen in the carburising atmosphere”, “carburising temperature” and “carbon potential” on the hydrogen content in the iron foil is explained in a so-called adjusted response graph. This representation ensures the observation of the effects of the individual influencing variables, as the influence of the respective other factors is averaged out by a corresponding calculation. The hydrogen contents of the iron foils of the three statistical test plans are shown in Figure 3 as a function of the investigated factors.
In the first experimental plan (DoE I), a local minimum in the hydrogen content of the foils is found for the factor “hydrogen in the atmosphere” at approx. 35 vol%. As the factor ”temperature” increases, the hydrogen content in the films decreases, and as the carbon potential factor increases, in the range from 0.8 to 1.0% C, the hydrogen content in the foils increases.
The second experimental design (DoE II) was carried out with a restricted range of values of the factors in order to check the results of DoE I. The results of DoE II are within the range of the factors temperature and carbon potential. The results of DoE II are on average about 8 ppm lower than the results of DoE I. This difference is attributed to the calibration of the analyser, which has led to a systematic offset of about 8 ppm between the measured values and is not considered real. For the factor hydrogen in the atmosphere a local minimum in the range of 35 to 40 vol% is found. The temperature affects the hydrogen content in the foils as in DoE I, with increasing temperature, the hydrogen content in the foils decreases. The carbon potential factor was only tested in the range of 0.8 to 1.0% C in order to confirm the relationship from DoE I. However, in this experimental design, the hydrogen content in the films shows an increase. However, in this experimental design, the change in carbon potential has no influence on the hydrogen content of the films.
In the third experimental design (DoE III), only the change in the carbon potential factor on the hydrogen content in the films was checked again, since different correlations follow from the first two experimental designs. The results show that a change in the carbon potential has no influence on the hydrogen content of the pure iron foils.
In addition to the main effects, effects of two-way interactions must also be considered for the correct description of the results, especially in the case of the results from the first experimental design. First and foremost, these are the interactions that occur in connection with the carbon potential factor. However, these dependencies could not be identified from the results of the second experimental design.

3.3. Tempering

The effects of the tempering temperature, the storage time between the heat treatment steps case hardening and tempering as well as the tempering time can be derived from the adjusted response graph in Figure 4: With increasing tempering temperature as well as with longer time during tempering and storage, there is a tendency for the hydrogen content to decrease. Significant interactions (α < 0.05) were not identified in the evaluation of the statistical test plan. It should also be noted that the relatively low regression coefficient of 0.75 with a degree of freedom of 11 weakens the significance of the regression model.
For further analysis of hydrogen effusion, the hydrogen contents immediately before tempering (i.e., after storage at RT) of all variants were also determined. These are shown together with the values after tempering as a function of storage time in Figure 5. Even when the samples are stored at room temperature, a clear effect on the hydrogen content can be seen (orange curve). Tempering leads to a decrease in the hydrogen content, whereas after tempering only a weak influence of the storage time can be identified (blue curve).
Based on these results, the effusion behaviour of the hydrogen substance was described using the following approximation equation for the Fick’s first law:
c ¯ c U c A c U = EXP D eff A V t
With:
c ¯ : middle hydrogen content
cA: initial hydrogen content
cU: final/environmental hydrogen content
A: specimen surface
V: specimen volume
t: time
Deff: effective diffusion coefficient
Despite the relatively small number of measured values, the diffusion coefficients determined from this are within the range of the literature values: Deff, 20 °C = 1.24·10−6 cm2/s; Deff, 200 °C = 5.71·10−6 cm2/s (see Figure 6, red line).
Figure 7 shows the values of the diffusible hydrogen content determined with the HCA method. The quenched and non-tempered state is marked with a cross in the diagram. This value is entered in the diagram at the temperature of 60 °C, since the samples were quenched to 60 °C and then washed at 60 °C. The diamonds mark the hydrogen contents of the samples that were tempered at the appropriate temperature after case hardening. As the tempering temperature increases, the content of remaining diffusible hydrogen decreases. The hydrogen contents of the samples in the range of the steep drop (tempering temperature: 100 °C, 120 °C and 140 °C) show an increased standard deviation. For the tempering temperature of 100 °C, only two samples were available for averaging, which further increases the standard deviation. It is clear from the diagram that the diffusible hydrogen has almost completely vanished after tempering the HCA samples at 160 °C for 1 h. The standard deviation of the mean values is also increased.
Figure 8 shows the residual hydrogen content as a function of the tempering temperature. As the tempering temperature increases, the residual hydrogen content decreases. This effect of a one-hour tempering treatment is still detectable even after the 24-hour effusion annealing at 210 °C during the HCA process. This indicates that during or after the tempering treatment the distribution of diffusible and residual hydrogen changes. Tempering and deep cooling cause structural changes in the material, which have an influence on this distribution. The austenite that is not transformed after quenching (residual/retained austenite) can be stabilised and/or reduced by tempering and/or deep cooling.
To check the individual measurements for determining the diffusible and residual hydrogen content, Figure 9 compares the diffusible hydrogen content from Figure 7 (blue curve) and the residual hydrogen content from Figure 8 (red curve) with the total hydrogen content (orange curve) determined by melt extraction before tempering (60 °C) and after tempering (180 °C). The green curve describes the sum of diffusible and residual hydrogen.
It can be seen that the orange and green curves are almost congruent. This confirms that after carburising and quenching, diffusible hydrogen and trap-bound (residual) hydrogen are present in the material and that only part of the hydrogen can be effused from the material by a tempering treatment in the temperature range investigated. Accordingly, it is also possible to distinguish between diffusible and residual hydrogen in the material using the melt extraction method, since the diffusible hydrogen content represents the difference between the total hydrogen content and the content of residual hydrogen. The residual hydrogen remains in the material if a low-hydrogen annealing, as used in the HCA method, has been carried out.

3.4. Influence of the Material and the Degree of Purity

The adjusted response graphs for the total hydrogen content as a function of the material, the position and the storage time are documented for the quenched samples in Figure 10 and the tempered samples in Figure 11.
In the quenched condition, the factors material and position show a slight trend towards lower hydrogen contents being expected for the material 20MnCr5 or for a sample from the edge region. However, the influence of these factors is very small. The factor storage time shows a strong gradient between the first and the second time point. Between the second and third time point, the values are at the same level. In the tempered state, there is no significant influence of the factors material, sampling position and storage time on the hydrogen content.
In order to make a statement about the hydrogen content after case hardening as a function of the degree of purity, the factors material and position were replaced by the factors cumulative characteristic value for sulphides and cumulative characteristic value for oxides and were statistically evaluated with the programme Cornerstone. In the quenched state (Figure 12), the factor storage time also shows a strong gradient between the first and the second time point and a uniform level between the second and the third time point. The factors K1 sulphides and K1 oxides show a slight trend towards higher hydrogen contents being expected with increasing K1. However, the influence of these factors is very small. In the tempered state (Figure 13), no significant influence of the storage period and the degree of purity on the hydrogen content of the samples can be detected.

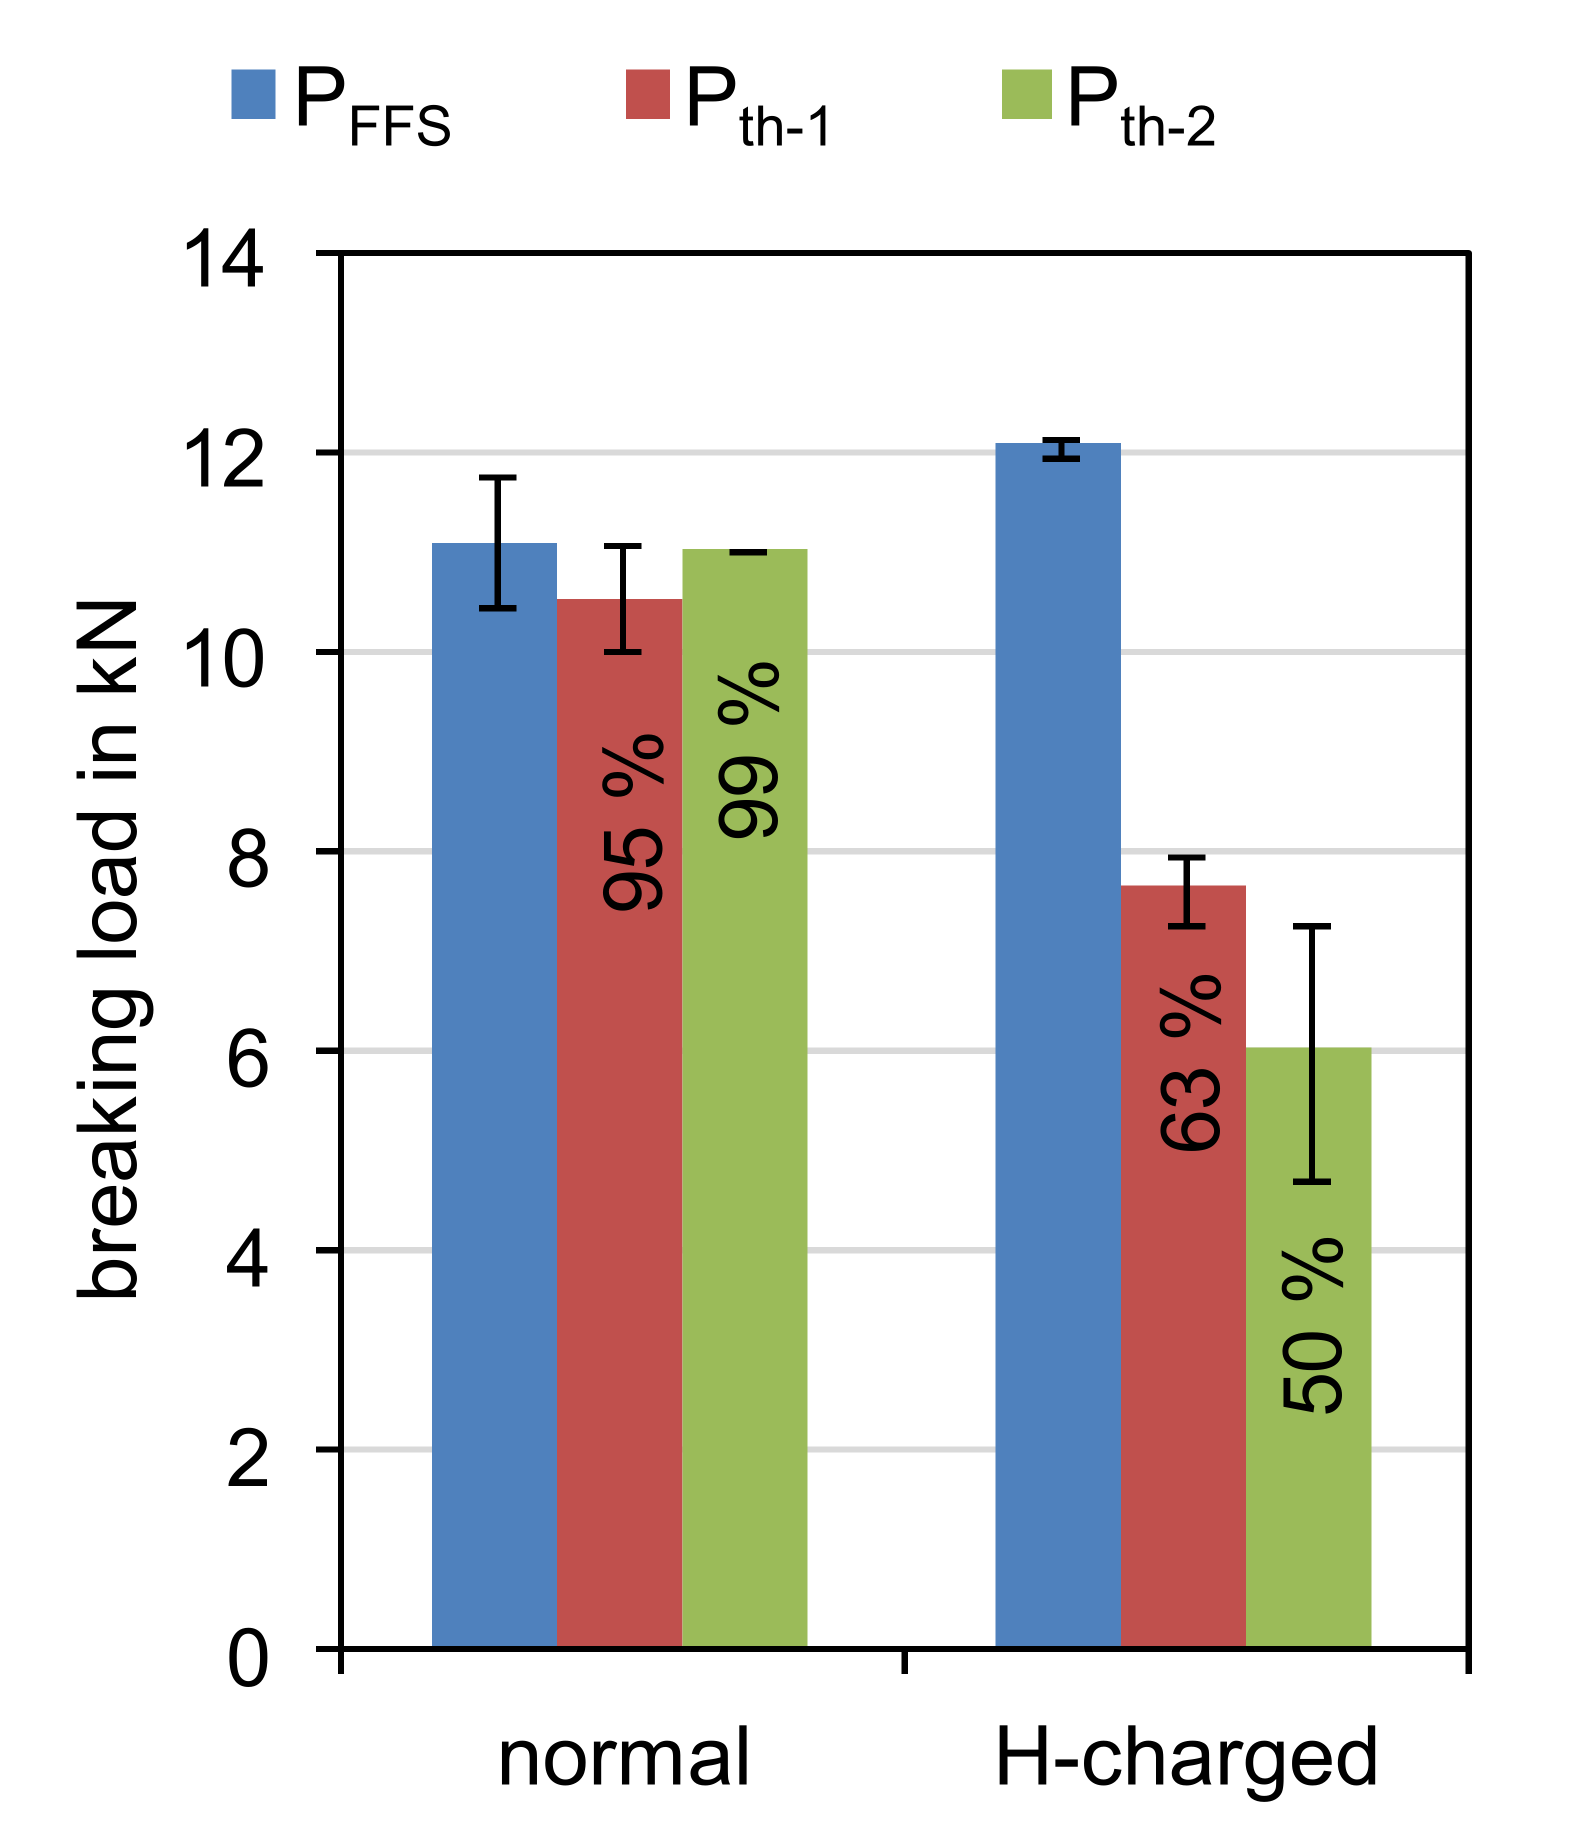
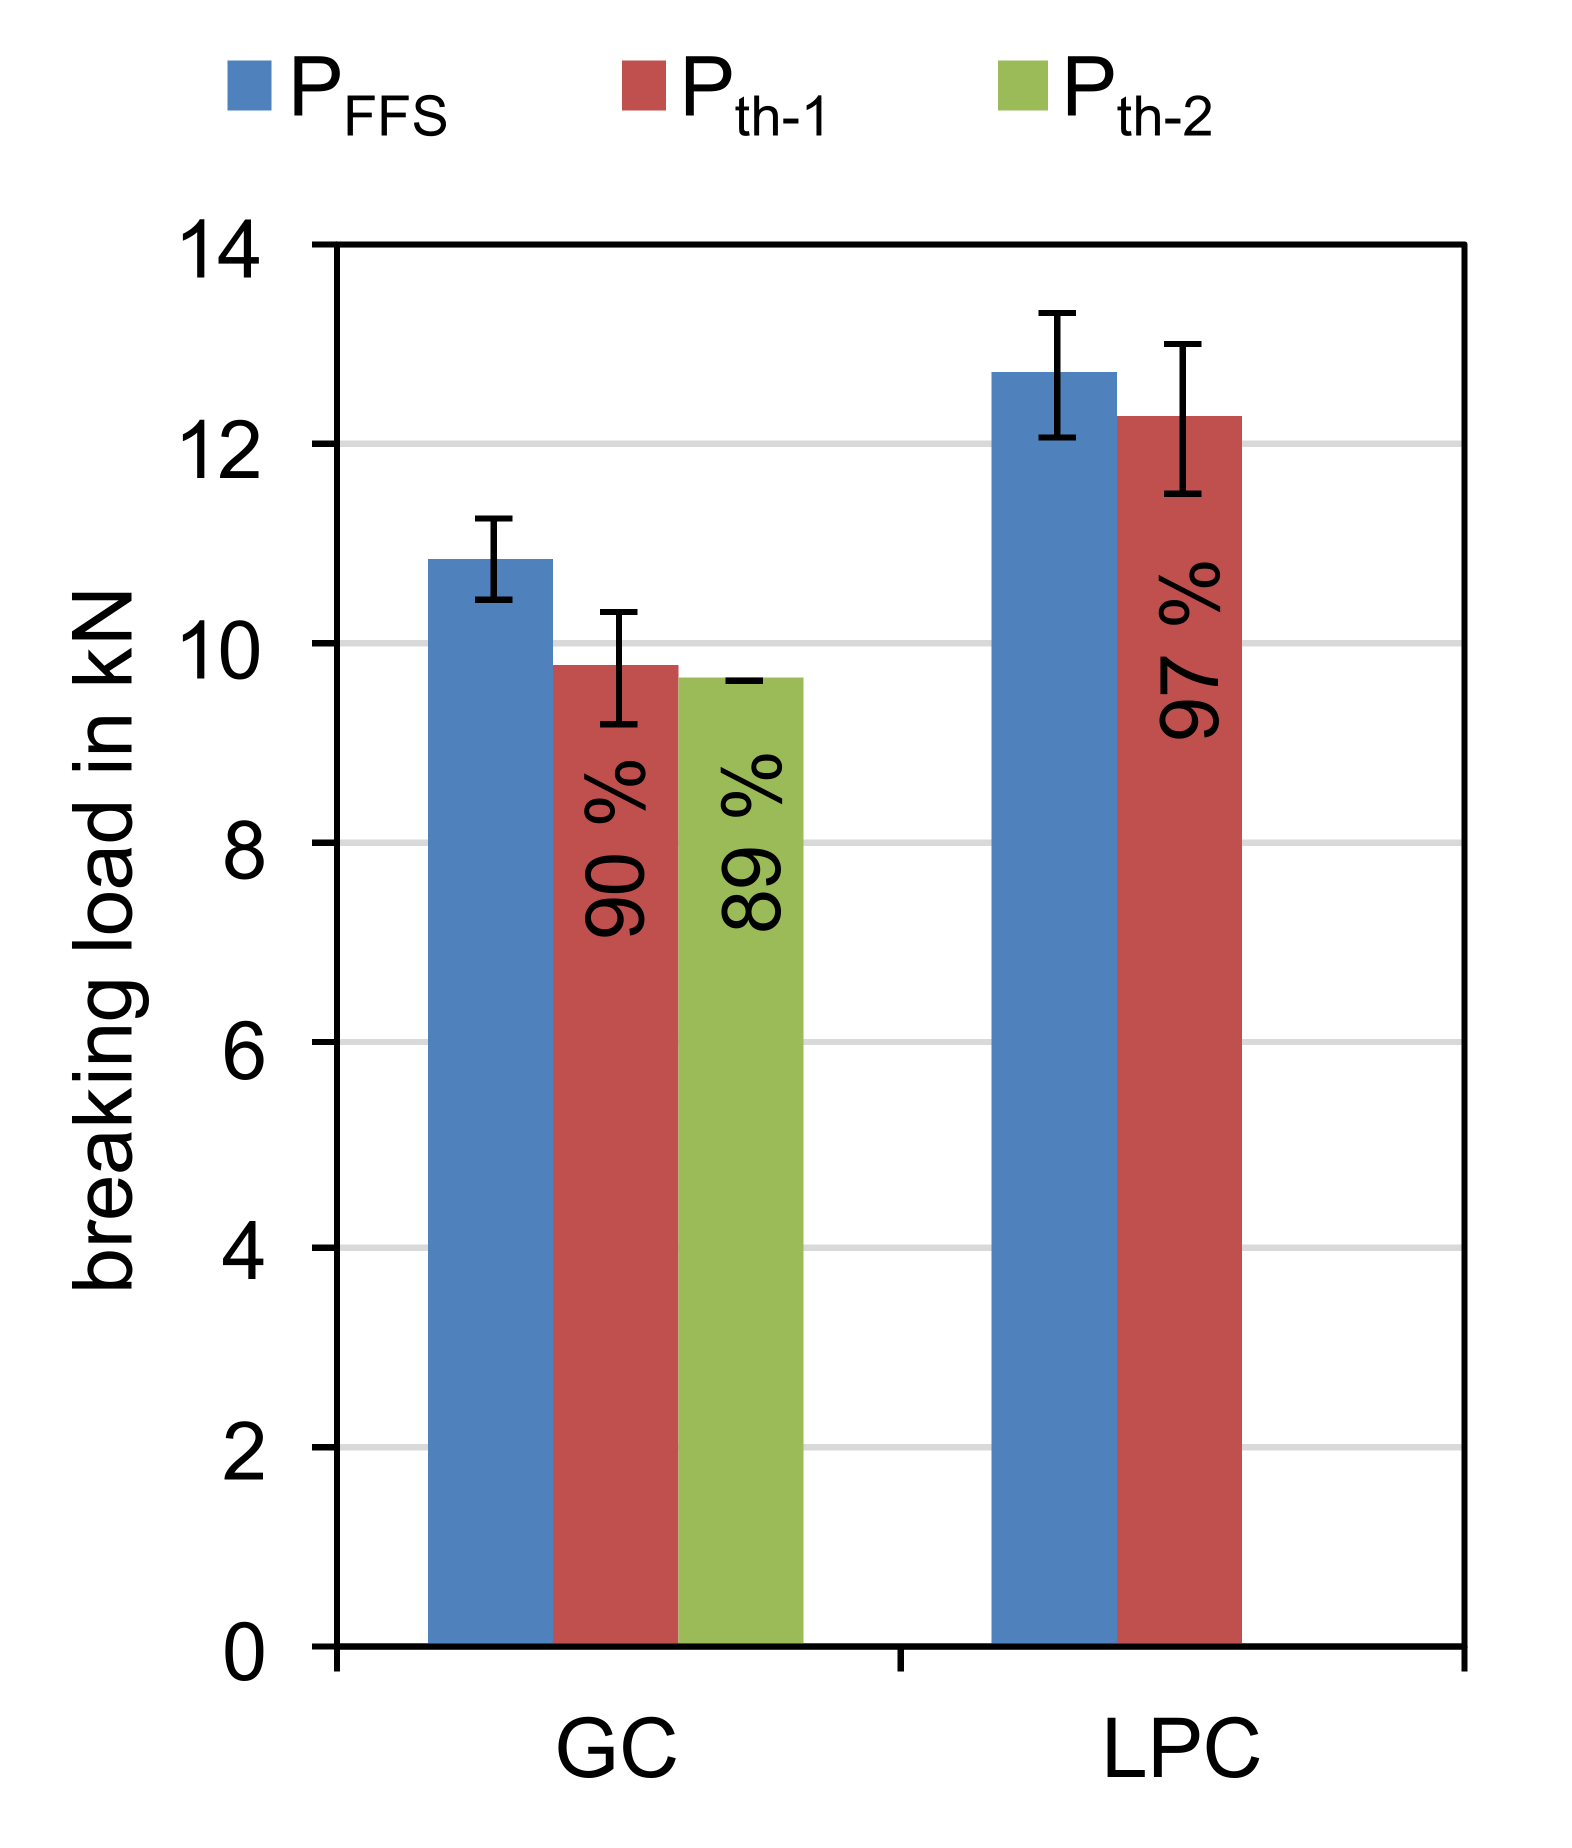
3.5. Mechanical Properties

The hydrogen embrittlement behaviour of the materials 20MnCr5 (I, II, III, IV) and 18CrNiMo7-6 (I, II) with different degrees of purity was investigated in the incremental step loading test according to ASTM F1624. The samples were case-hardened in a heat treatment batch and not tempered. The results of the determination of the fast fracture load PFFS and the threshold loads Pth-1 and Pth-2 are shown in Figure 14. The fast fracture load is between 8 and 12 kN. The invariant threshold loads Pth of the incremental step loading tests, the lowest threshold load in each case, were between 86 and 95% of the respective fast fracture load.
In order to make a statement about the fast fracture load PFFS or the invariant threshold load Pth as a function of the degree of purity, the measured values were statistically evaluated with the program Cornerstone. Figure 15 shows the adj. fast fracture load above the cumulative characteristic values for oxides and sulphides. There is no significant influence of the degree of purity on the fast fracture load. The adj. invariant threshold load plotted against the cumulative characteristic values for oxides and sulphides in Figure 16 also shows no significant influence of the degree of purity on the invariant threshold load.
In order to demonstrate the influence of an increased hydrogen content on the mechanical properties, a small experiment was carried out on the material 20MnCr5 (III) with different hydrogen contents. Figure 17 shows the results of the incremental step loading tests for a gas case-hardened condition (normal) and an additionally electrolytically hydrogen charged condition (H-charged). It can be seen that the fast fracture load of the two states, normal and H-charged, are at a similar level of about 11 and 12 kN. The threshold load of the normal condition is 95% and that of the H-loaded condition is 50% of the respective fast fracture load. It should be noted that the incremental step loading test of the H-charged condition was terminated after the second series, due to the small number of specimens available, and in a third incremental step loading test the threshold load would probably be even lower, because the incremental step loading test should only be terminated when the difference between two successive threshold loads is less than 5%.
Figure 18 compares the fracture patterns of two case-hardened specimens as an example. The left side shows the images of a normal, uncharged specimen and the right side the images of a specimen charged with hydrogen. In the overview, a different fracture structure between the edge and the core region can be seen in the two states. The core region appears macroscopically matt and the edge region shiny. These two areas correspond very well with the case hardening and the high-strength material state in the edge layer. In the core area, both samples show the same fracture structure, a deformation fracture with a typical honeycomb structure and pulled-out inclusions. In the edge region, the fracture structures of the two samples are also very similar. A brittle fracture with inter- and transcrystalline parts can be seen, as well as gaping grain boundaries, microductile parts on the grain boundaries and a low fracture structure of the transcrystalline fracture parts.
The investigations on the influence of the case-hardening process on the hydrogen absorption showed that conventionally gas carburised samples in the quenched state have higher contents of diffusible and residual hydrogen than low-pressure carburised samples, since the diffusion phases taking place in the vacuum act like a low-hydrogen annealing and significantly reduce the hydrogen content. In order to investigate the effect of the different hydrogen content on the mechanical properties, the incremental step loading tests of the gas-carburised condition (GC) are compared with the low-pressure carburised condition (LPC) for the material 20MnCr5 (II) in Figure 19. It can be seen that the fast fracture load of the low-hydrogen state is slightly higher at almost 13 kN than the normal state at almost 11 kN. The threshold load of the low-hydrogen state is higher at 97% than the normal state at 89%. As a possible cause for the lower fast fracture load of the normal state compared to the hydrogen-deficient state, either the higher proportion of diffusible hydrogen can be used, but also the edge oxidation resulting from the gas carburisation can be considered. This is because the 4 point bending test places particularly high stress on the edge areas of the specimens and damage to the edge area due to edge oxidation represents a high notch effect.

4. Conclusions

Carburising in hydrogen-containing atmospheres inevitably leads to hydrogen absorption during the process. The detrimental effect of hydrogen on high-strength material states has been known for a long time and is referred to as hydrogen embrittlement. In the present work, hydrogen absorption during case hardening was investigated because damage to case hardened components is often associated with the phenomenon of hydrogen embrittlement due to their fracture pattern. For this purpose, the effects of the case hardening process on the hydrogen content in the material were investigated and the effects of hydrogen on the mechanical properties were examined.
When analysing the hydrogen content, a distinction must be made between diffusible and residual hydrogen. The diffusible hydrogen is freely mobile in the material and the residual hydrogen is trapped in the material. With an increase in temperature, the residual hydrogen can be mobilised and diffuse in the material, thus it can effuse. The diffusible hydrogen can be trapped in the material by deep cooling and the associated phase transformations from retained austenite to martensite. The sum of diffusible and residual hydrogen corresponds to the amount of total hydrogen.
It has been demonstrated that the total hydrogen content increases up to an equilibrium value of 4 ppm during gas carburising in an atmosphere containing hydrocarbons. After quenching, the diffusible hydrogen tends to effuse out of the material again even at room temperature, whereby a tempering treatment accelerates this process. The used samples have shown a significantly decreased hydrogen content of about 1.2 ppm after 96 h at room temperature or 2 h tempering at 180 °C.
The case-hardened steels 20MnCr5 and 18CrNiMo7 6 with different degrees of purity were available for the investigation of the material dependence. From the results it can be deduced that the sulphidic and oxidic inclusions do not have significant influence on the hydrogen content according to the performed experiments.
When checking the mechanical properties, it could be shown in the incremental step loading test that a case-hardened condition only has a slight tendency to hydrogen embrittlement. However, if the material is artificially charged with diffusible hydrogen, the material fails significantly below the maximum load in the incremental step loading test, which is a clear sign of failure due to hydrogen embrittlement.
Damage patterns after fractures of high-strength material states, such as stress-relieved martensite—i.e., edge layer states that exist in case-hardened states—show the same characteristics as fractures that have occurred with the involvement of hydrogen. Therefore, damages to case-hardened components are often associated with hydrogen after examination of the fracture surface under a scanning electron microscope. The analysis of the fracture patterns of the present investigations did not allow a clear distinction to be made between the case-hardened state and the hydrogen-charged state, the reason it is not possible to assign damage to a case-hardened component to hydrogen embrittlement in retrospect on the basis of the fracture pattern only.

Author Contributions

The paper has been written by M.C. and S.H.; all the heat treatment experiments were performed by M.C.; all hydrogen analysis via melt extraction were performed by M.C.; all hydrogen analysis via HCA method were performed by Ruhr-University Bochum (RUB) in the Institute for Materials, Department of Materials Testing; all 4-point bending experiments were supervised by M.C.; H.S. and M.S. supervised the work and supported with their expert knowledge; the resources were provided by F.H. and R.F.-H. All authors have read and agreed to the published version of the manuscript.

Funding

The authors gratefully acknowledge support from the FVA (Forschungsvereinigung Antriebstechnik e. V.). The project IGF 17984 N was funded by the AiF (Arbeitsgemeinschaft industrieller Forschungsvereinigungen „Otto von Guericke“ e. V.) trough financial resources from the BMWi (Bundesministerium für Wirtschaft und Energie).

Institutional Review Board Statement

Not applicable.

Informed Consent Statement

Not applicable.

Data Availability Statement

Not applicable.

Conflicts of Interest

The authors declare no conflict of interest. The funders had no role in the design of the study; in the collection, analyses, or interpretation of data; in the writing of the manuscript, or in the decision to publish the results.

References

  1. Johnson, W.H. On some remarkable change produced in iron and steel by the action of hydrogen and acids. Proc. R. Soc. 1875, 23, 168–179. [Google Scholar] [CrossRef]
  2. Lange, G. Schäden durch Wasserstoff, Systematische Beurteilung technischer Schadensfälle; WILEY-VCH: Weinheim, Germany, 2001; pp. 255–276. [Google Scholar] [CrossRef]
  3. Gräfen, H. Korrosion durch metallphysikalische Reaktion. In Korrosion und Korrosionsschutz; WILEY-VCH: Weinheim, Germany, 2001; pp. 470–541. [Google Scholar] [CrossRef]
  4. Barnoush, A. Hydrogen Embrittlement, Revisited by In Situ Electrochemical Nanoindentation. Ph.D. Thesis, Saarland University, Saarbrücken, Germany, 2007. [Google Scholar] [CrossRef]
  5. Kühn, S. Einfluss von diffusiblem Wasserstoff auf die mechanischen Eigenschaften von hochfesten Mehrphasenstählen unter Berücksichtigung der Kaltverfestigung. Ph.D. Thesis, TU Bochum, Shaker Verlag, Aachen, Germany, 2011. [Google Scholar]
  6. Schmidt-Thomas, K.G. Meisel, Mathis: Spannungsrisskorrosion durch Wasserstoff—Literaturrecherche und -Auswertung, FVA T145 und T153, Research Report; FVA Forschungsheft Nr. 88 der Forschungsvereinigung Antriebstechnik e. V.: Frankfurt, Germany, 1980. [Google Scholar]
  7. Eckstein, H.J. Technologie der Wärmebehandlung von Stahl; Grundstoffindustrie: Leipzig, Germany, 1987. [Google Scholar]
  8. Streng, H.; Grosch, J.; Razim, C. Wasserstoffaufnahme und -abgabe beim Einsatzhärten. Härt.-Tech. Mitt. 1987, 42, 245–260. [Google Scholar] [CrossRef]
  9. Hoffmann, F.; Linkewitz, T.; Mayr, P. Wasserstoffaufnahme beim Einsatzhärten. HTM 1999, 53, 10–14. [Google Scholar] [CrossRef]
  10. Streng, H. Zähigkeitsoptimierung Einsatzgehärteter Gefüge. Ph.D. Thesis, TU Berlin, Berlin, Germany, 1986. [Google Scholar]
  11. Laumen, C.; Clausen, B.; Hoffmann, F. Hydrogen Pick-Up during Low Pressure Gas Carburizing compared with traditional Gas Carburizing Processes, Heat Treating 2007. In Proceedings of the 24th Conference (ASM International), Detroit, Michigan, MI, USA, 173–19 September 2007; pp. 369–375. [Google Scholar]
  12. Johnson, H.H.; Morlet, J.G.; Troiano, A.R. Hydrogen, Crack Initiation, and Delayed Failure in Steel; Wright Air Development Center Technical Report 57–262; Wright-Patterson Air Force Base: Dayton, OH, USA, 1957. [Google Scholar]
  13. Riecke, E. Wasserstoff in Eisen und Stahl. Arch. Für Das Eisenhüttenwesen 1978, 49, 509–520. [Google Scholar] [CrossRef]
  14. Hieber, H.; Erdmann-Jesnitzer, F. Das Verhalten von kohlenstoffarmem Stahl bei Wasserstoffbeladung und plastischer Verformung. Arch. Für Das Eisenhüttenwesen 1973, 44, 685. [Google Scholar] [CrossRef]
  15. Pöpperling, R.K.; Schwenk, W. Untersuchungen zur H-induzierten Rißkorrosion. Werkst. Korros. 1979, 30, 603–612. [Google Scholar] [CrossRef]
  16. Novak, P.; Yuan, R.; Somerday, B.P.; Sofornis, P.; Ritchie, R.O. A statistical, physical-based, micro-mechanical model of hydrogen-induced intergranular fracture in steel. J. Mech. Phys. Solids 2010, 58, 206–226. [Google Scholar] [CrossRef]
  17. Steigerwald, E.A.; Schaller, F.W.; Troiano, A.R. Discontinuous Crack Growth in Hydrogenated Steel. Trans. Metall. Soc. AIME 1959, 215, 1048–1052. [Google Scholar]
  18. Steigerwald, E.A.; Schaller, F.W.; Troiano, A.R. The role of Stress in Hydrogen Induced Delayed Failure. Trans. Metall. Soc. AIME 1960, 218, 832–841. [Google Scholar]
  19. Neumann, P. Grundlagen der Wirkung von Wasserstoff auf die Rißbildung in Stählen. Stahl Und Eisen 1987, 107, 37–43. [Google Scholar]
  20. Beachem, C.S. A new model for hydrogen-assisted cracking (hydrogen “embrittlement”). Metall. Trans. B 1972, 3, 441–455. [Google Scholar] [CrossRef]
  21. Myers, S.M.; Baskes, M.I.; Birnbaum, H.K.; Corbett, J.W.; DeLeo, G.G.; Estreicher, S.K.; Haller, E.E.; Jena, P.; Johnson, N.M.; Kirchheim, R.; et al. Hydrogen interactions with defects in crystalline solids. Rev. Mod. Phsys. 1992, 64, 559–617. [Google Scholar] [CrossRef]
  22. Castens, M.; Steinbacher, M. Wasserstoffaufnahme beim Einsatzhärten. Abschlussbericht FVA 712 I.; FVA-Forschungsheft Heft Nr. 1305: Frankfurt, Germany, 2018. [Google Scholar]
  23. Haumann, W.; Heller, W.; Jungblut, H.A.; Pircher, H.; Pöpperling, R.; Schwenk, W. Der Einfluß von Wasserstoff auf die Gebrauchseigenschaften von unlegierten und niedriglegierten Stählen. Stahl Und Eisen 1987, 107, 585–594. [Google Scholar]
Figure 1. Schematic representation of the single-stage heat treatment process.
Metals 12 00006 g001
Figure 2. Result graph of the H-sensor of a case-hardened disc made of the material 18CrNiMo7-6.
Metals 12 00006 g002
Figure 3. Hydrogen content in the iron foils as a function of the factors investigated: hydrogen content in the atmosphere, temperature and carbon potential.
Metals 12 00006 g003
Figure 4. Effect of the factors tempering temperature, storage time and tempering time on the hydrogen content after tempering.
Metals 12 00006 g004
Figure 5. Development of hydrogen content before and after tempering as a function of storage time.
Metals 12 00006 g005
Figure 6. Sieverts‘ solubility constant and diffusion coefficient of hydrogen in pure iron from the literature according by Streng [23] and the values determined within this work marked in red.
Metals 12 00006 g006
Figure 7. Development of diffusible hydrogen content (HCA method) as a function of tempering temperature ( x ¯ ± s, n = 3, n(T = 100 °C) = 2).
Metals 12 00006 g007
Figure 8. Development of residual hydrogen content (melt extraction) as a function of annealing temperature following a low hydrogen annealing at 210 °C for 24 h ( x ¯ ± s, n = 3).
Metals 12 00006 g008
Figure 9. Correlation between different hydrogen analysis methods; melt extraction (ME), hydrogen collecting analysis (HCA).
Metals 12 00006 g009
Figure 10. Effects of the factors material, position and logarithmic storage time on the total hydrogen content of the quenched samples (adj. R2 = 0.92, F = 29).
Metals 12 00006 g010
Figure 11. Effects of the factors material, position and logarithmic storage time on the total hydrogen content of the samples tempered at 180 °C/1 h (adj. R2 = 0.05, F = 31).
Metals 12 00006 g011
Figure 12. Effects of the factors logarithmic storage time, cumulative characteristic value for sulphides (K1 sulphides) and cumulative characteristic value for oxides (K1 oxides) on the total hydrogen content of the quenched samples (adj. R2 = 0.93, F = 28).
Metals 12 00006 g012
Figure 13. Effects of the factors logarithmic storage time, cumulative characteristic value for oxides (K1 oxides) and cumulative characteristic value for sulphides (K1 sulphides) of the hydrogen content of the samples tempered at 180 °C/1 h (adj. R2 = 0.06, F = 32).
Metals 12 00006 g013
Figure 14. Result of the incremental step loading test of the different materials, fast fracture load PFFS ( x ¯ ± s, n = 3), threshold loads Pth-1 and Pth-2 ( x ¯ , n = 3).
Metals 12 00006 g014
Figure 15. Fast fracture load PFFS as a function of the degree of purity.
Metals 12 00006 g015
Figure 16. Invariant threshold loads Pth depending on degree of purity.
Metals 12 00006 g016
Figure 17. Comparison of the incremental step loading test between the industrial standard (normal) and the H-charged condition; material: 20MnCr5 (III); x ¯ ± s, n = 3.
Metals 12 00006 g017
Figure 18. Fracture patterns of a normal and H-charged 4 point bending beams.
Metals 12 00006 g018
Figure 19. Comparison of the incremental step loading test between the industrial standard (gas carburising, GC) and the low hydrogen condition (low-pressure carburising, LPC); material: 20MnCr5 (II); x ¯ ± s, n = 3.
Metals 12 00006 g019
Table 1. Degree of purity K1 according to DIN 50602 (method K).
Material20MnCr518CrNiMo7-6
Edge AreaCore AreaEdge AreaCore Area
MeltSOSOSOSO
I43346732094861610251185236
II541467732093169317228554339
III856901731373105567122281240
IV357736324450293------
S: sulphides, O: oxides, ∑: sum of sulphides and oxides.
Table 2. Material states investigated for mechanical properties.
StateProcessMaterial
gas carburising (GC)case-hardened in gas atmosphere20MnCr5 (I, II, III, IV) 18CrNiMo7 6 (I, II)
H-chargedcase-hardened in gas atmosphere and electrolytic hydrogen charging20MnCr5 (III)
low-pressure carburising (LPC)case-hardened in the low-pressure process20MnCr5 (II)
Table 3. Results of carburisation process, material investigated: 18CrNiMo7-6 (III), edge area.
Case-Hardening ProcessStateDiff. H Content in ppmResi. H Content in ppmTotal H Content in ppm
-initial state--1.4 ± 0.3
conventional gas carburisingquenched2.07 ± 0.091.8 ± 0.33.9 ± 0.4 1
tempered0.30 ± 0.011.2 ± 0.11.5 ± 0.2 1
low-pressure carburisingquenched0.01 ± 0.010.7 ± 0.20.7 ± 0.3 1
tempered0.02 ± 0.020.5 ± 0.10.5 ± 0.2 1
1 These values are the respective sums of diff. and res. H content.
Publisher’s Note: MDPI stays neutral with regard to jurisdictional claims in published maps and institutional affiliations.

