Article

Study of Alloy Hot Flow and Hardening Behavior Using a New Correction Method for Hot Uniaxial Tests

1
School of Mechanical Engineering, Dalian University of Technology, Dalian 116024, China
2
Shanghai Spaceflight Precision Machinery Institute, Shanghai 201600, China
3
Shanghai Engineering Technology Research Center of Near-Net Shape Forming for Metallic Materials, Shanghai 201600, China
4
College of Material Science and Engineering, Nanjing University of Aeronautics and Astronautics, Nanjing 211106, China
*
Author to whom correspondence should be addressed.
Metals 2022, 12(1), 42; https://doi.org/10.3390/met12010042
Submission received: 6 December 2021 / Revised: 17 December 2021 / Accepted: 22 December 2021 / Published: 25 December 2021

Abstract

:
The precise characterisation of hot flow behavior of titanium alloys is of vital importance for practical hot forming processes. To precisely determine the hot flow behavior of titanium alloys under the forming conditions, Gleeble hot tensile tests are usually performed to simulate the forming processes by accurately controlling the deformation temperatures and strain rates under designed conditions. However, there exists a non-uniform temperature distribution during the Gleeble tests, which leads to inaccuracies in the determined hot flow behavior. To overcome such an issue, this paper proposed a new strain-based correction method for Gleeble hot tensile tests, enabling the mitigation of the non-uniform temperature-induced stress-strain curve inaccuracies. The non-uniform temperature zones have been successfully excluded in the calculation of the true strain levels. A series of hot uniaxial tensile tests of TA32 at temperatures, ranging from 750 °C to 900 °C, and strain rates, 0.01/s~1/s, were carried out. The obtained stress-strain correlations for a large gauge zone were characterized using the new correction method, which was further used to evaluate the hardening behavior of titanium alloys. The results have shown that the ductility, strain hardening component (i.e., n), strain rate hardening component (i.e., m) and uniform strain value (i.e., ε u ) are over-estimated, compared to conventional method. Higher strain rates and lower temperature leads to enhanced hardening behavior. This research provides an alternative correction method and may achieve more accurate stress-strain curves for better guidance of the hot forming process for titanium alloys.

1. Introduction

Titanium alloys are advanced materials with a superior strength-to-weight ratio and high corrosion resistance [1,2] and have been widely applied in the aerospace, marine and transportation industries. Thin-walled titanium alloy components are one of the dominant load-bearing structures in those industries [3]. TA32 titanium alloy, as a conventional type of titanium alloy, is widely used to form load-bearing thin-walled structures. These structures are usually formed using hot forming processes, such as superplastic forming [4], hot stamping [5] and hot gas forming [6,7], enabling sufficient ductility and hence success in the forming of the integrated complex structures. The success forming of thin-walled structures is normally indicated by the uniform thickness of the formed components without any defects. This largely depends on the material hardening and softening behavior at the designed deformation temperature. Hence, material hot flow behaviors at designed temperature and strain rate ranges shall be thoroughly investigated [8,9,10].
Hot tensile tests at fixed temperatures and strain rates are a commonly used method to characterise hot flow behavior [11] and to investigate hardening phenomena, i.e., strain hardening and strain rate hardening behavior. Conventional hot tensile test using quasi-static tensile facility with a heating furnace could guarantee uniform temperature for the tensile test process and provide a constant stroke speed and hence a constant deformation velocity. However, this could not achieve a constant true strain rate during the hot tensile tests and becomes less accurate especially when the strain rate is high. The Gleeble thermo-mechanical simulator is preferably used for hot tensile tests. However, there exists a temperature gradient in the sample gauge region, as schematically illustrated in Figure 1, due to the radiation from the surface of the specimen and conductive heat loss from the end of the specimen [12]. Such a temperature gradient results in errors when processing the stress-strain data.
Some previous research has been performed to investigate the effect of temperature non-uniformity on the processed true stress-strain curves. Bennett et al. [13]. carried out coupled thermo-mechanical FE modelling of both isothermal axisymmetric compression and uniaxial compression using a Gleeble Thermo-mechanical simulator. Results showed that errors in stress measurement were up to ~20% arising from interfacial friction and temperature non-uniformity distribution in a Gleeble thermo-mechanical compression test. Yu et al. [12]. proposed an approximate iterative method, importing the initial Gleeble test results into the FEM simulation and calculating the stress difference between the simulation and the experimental results. After a series of iterations, the simulation results were nearly the same as the experimental results, and the operation ended. However, in this method, the effect of temperature non-uniformity was not directly excluded, and multiple simulations need a high time cost. Additionally, most of the existing research work concentrated on proposing stress-strain correction methods for compression tests, where both barrelling and temperature non-uniformity introduce errors [13,14], whereas the correction methods for uniaxial hot tensile testing are limited. Li et al. [15]. proposed a strain correction method at the necking stage for boron steel during Gleeble hot tensile test. In this method, the elastic-plastic deformation was not entirely corrected, so only the correction after necking of specimen was achieved. Kong [16]. designed a new grip, which effectively reduced the temperature loss at the grip region and enabled a more uniform temperature distribution. However, such a design could only alleviate the temperature non-uniformity, and it cannot directly solve the problem. Additionally, the design is complex and difficult to operate. Therefore, an easy-to-operate method to effectively correct the temperature-induced stress-strain curve errors is required.
In this study, a new correction method to mitigate the temperature-induced stress-strain curve errors for uniaxial tensile tests at elevated temperatures was proposed. Hot uniaxial tensile tests at various temperatures and strain rates were performed. The experimental data were corrected using the proposed method and compared with those without any correction. Additionally, the hardening behavior was investigated from the corrected TA32 stress-strain curves. Strain hardening component, n, and strain rate hardening component, m, were also calculated and compared with non-corrected ones. Such a study provides a new and easy-to-operate way to achieve accurate hot flow curves and hardening behavior, hence providing better guidance for the hot forming of TA32 titanium alloys.

2. Experimentation

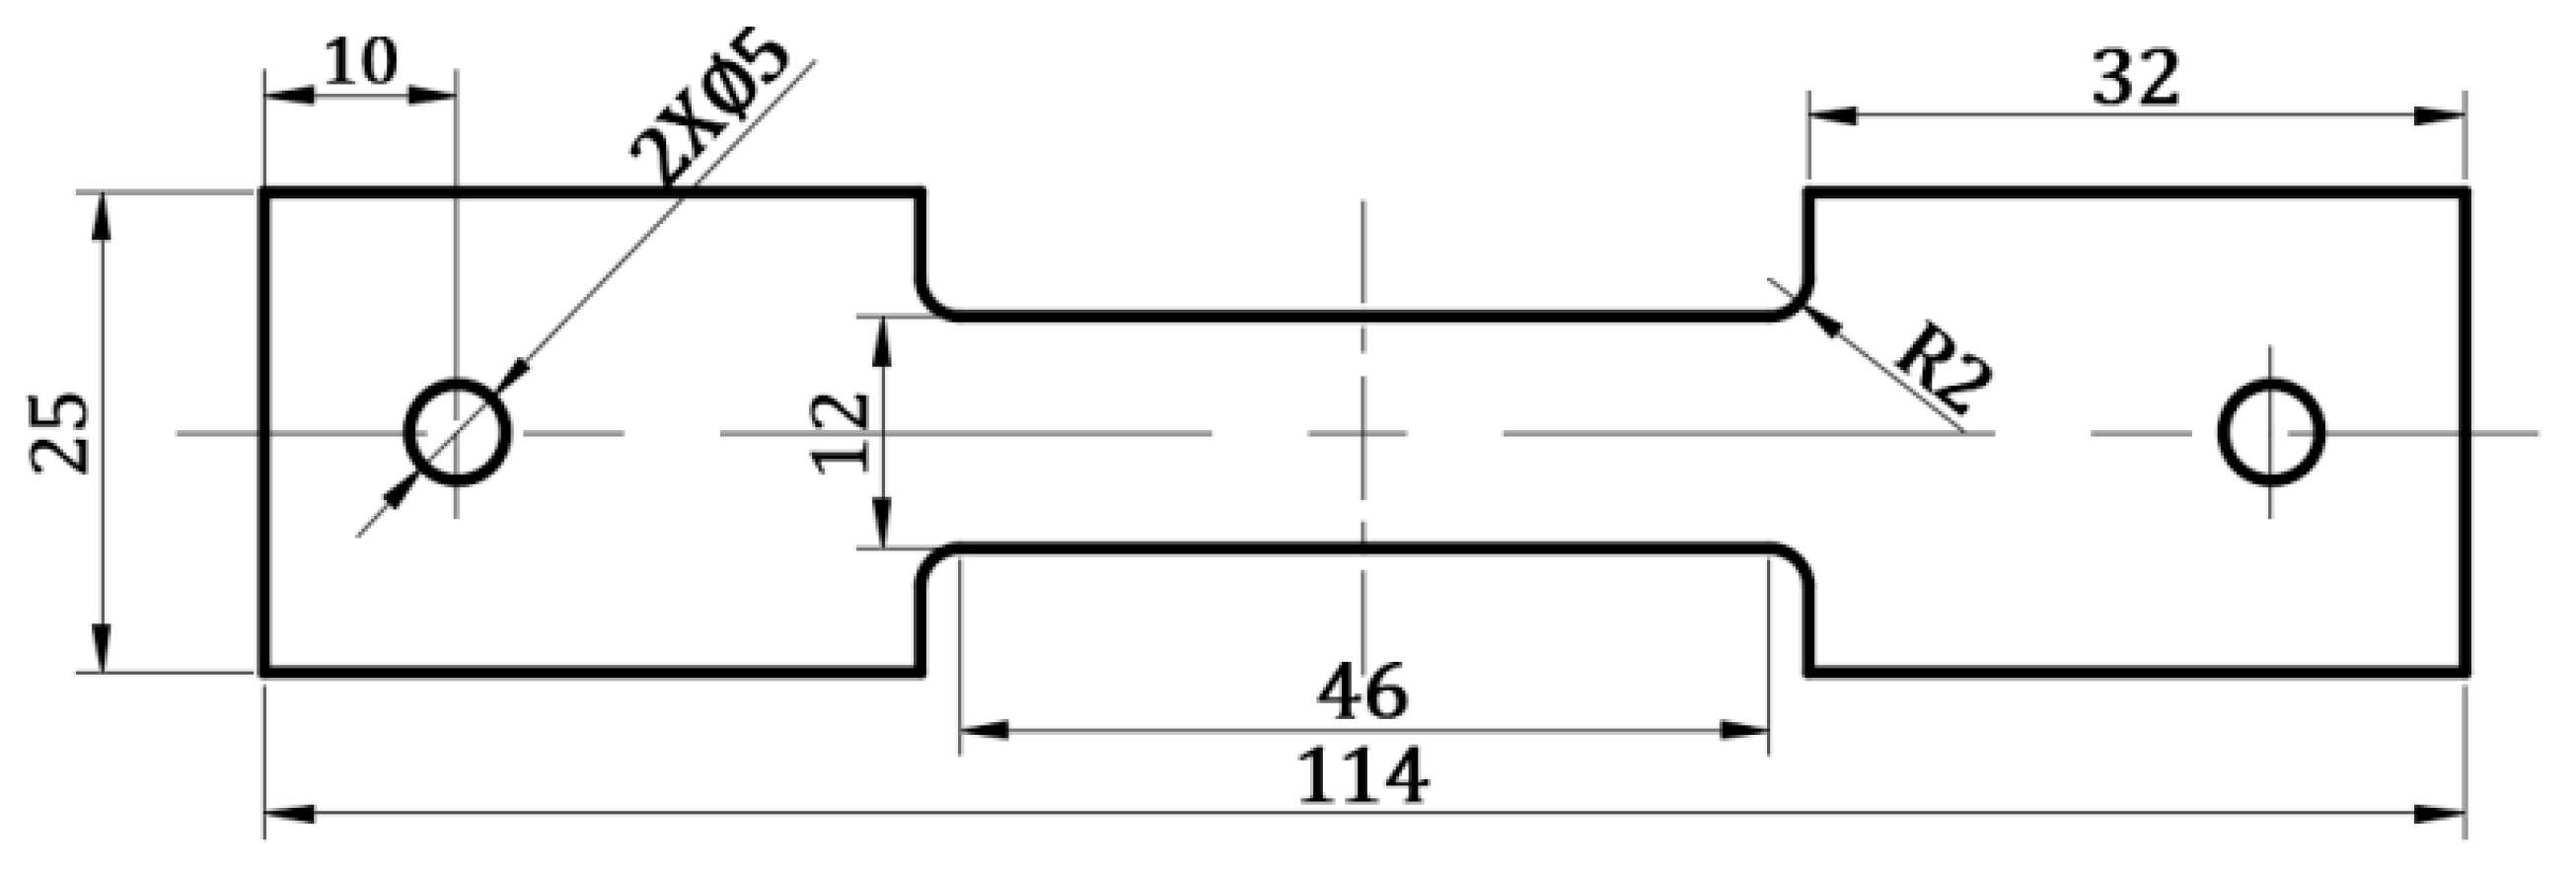
2.1. Material and Sample Geometry

The studied material is a titanium alloy TA32 blank in O-condition (annealed) with a thickness of 1.5 mm. The microstructure of the blank has been checked, which has a uniform grain distribution with an average size of 5.95 μm The main chemical composition of TA32 is given in Table 1 in a weight percentage.
For the tensile specimen, specimens were machined from the raw sheets with the longitudinal direction parallel to the rolling direction. Figure 2 shows the dog-bone shaped specimen design and the dimensions, which was designed according to reference. [17]. The length and width of the parallel zone were 46 mm and 12 mm, respectively. This could ensure a relatively large uniform temperature and deformation region (>8 mm × 12 mm), guaranteeing the reliability of the subsequent data calculation.

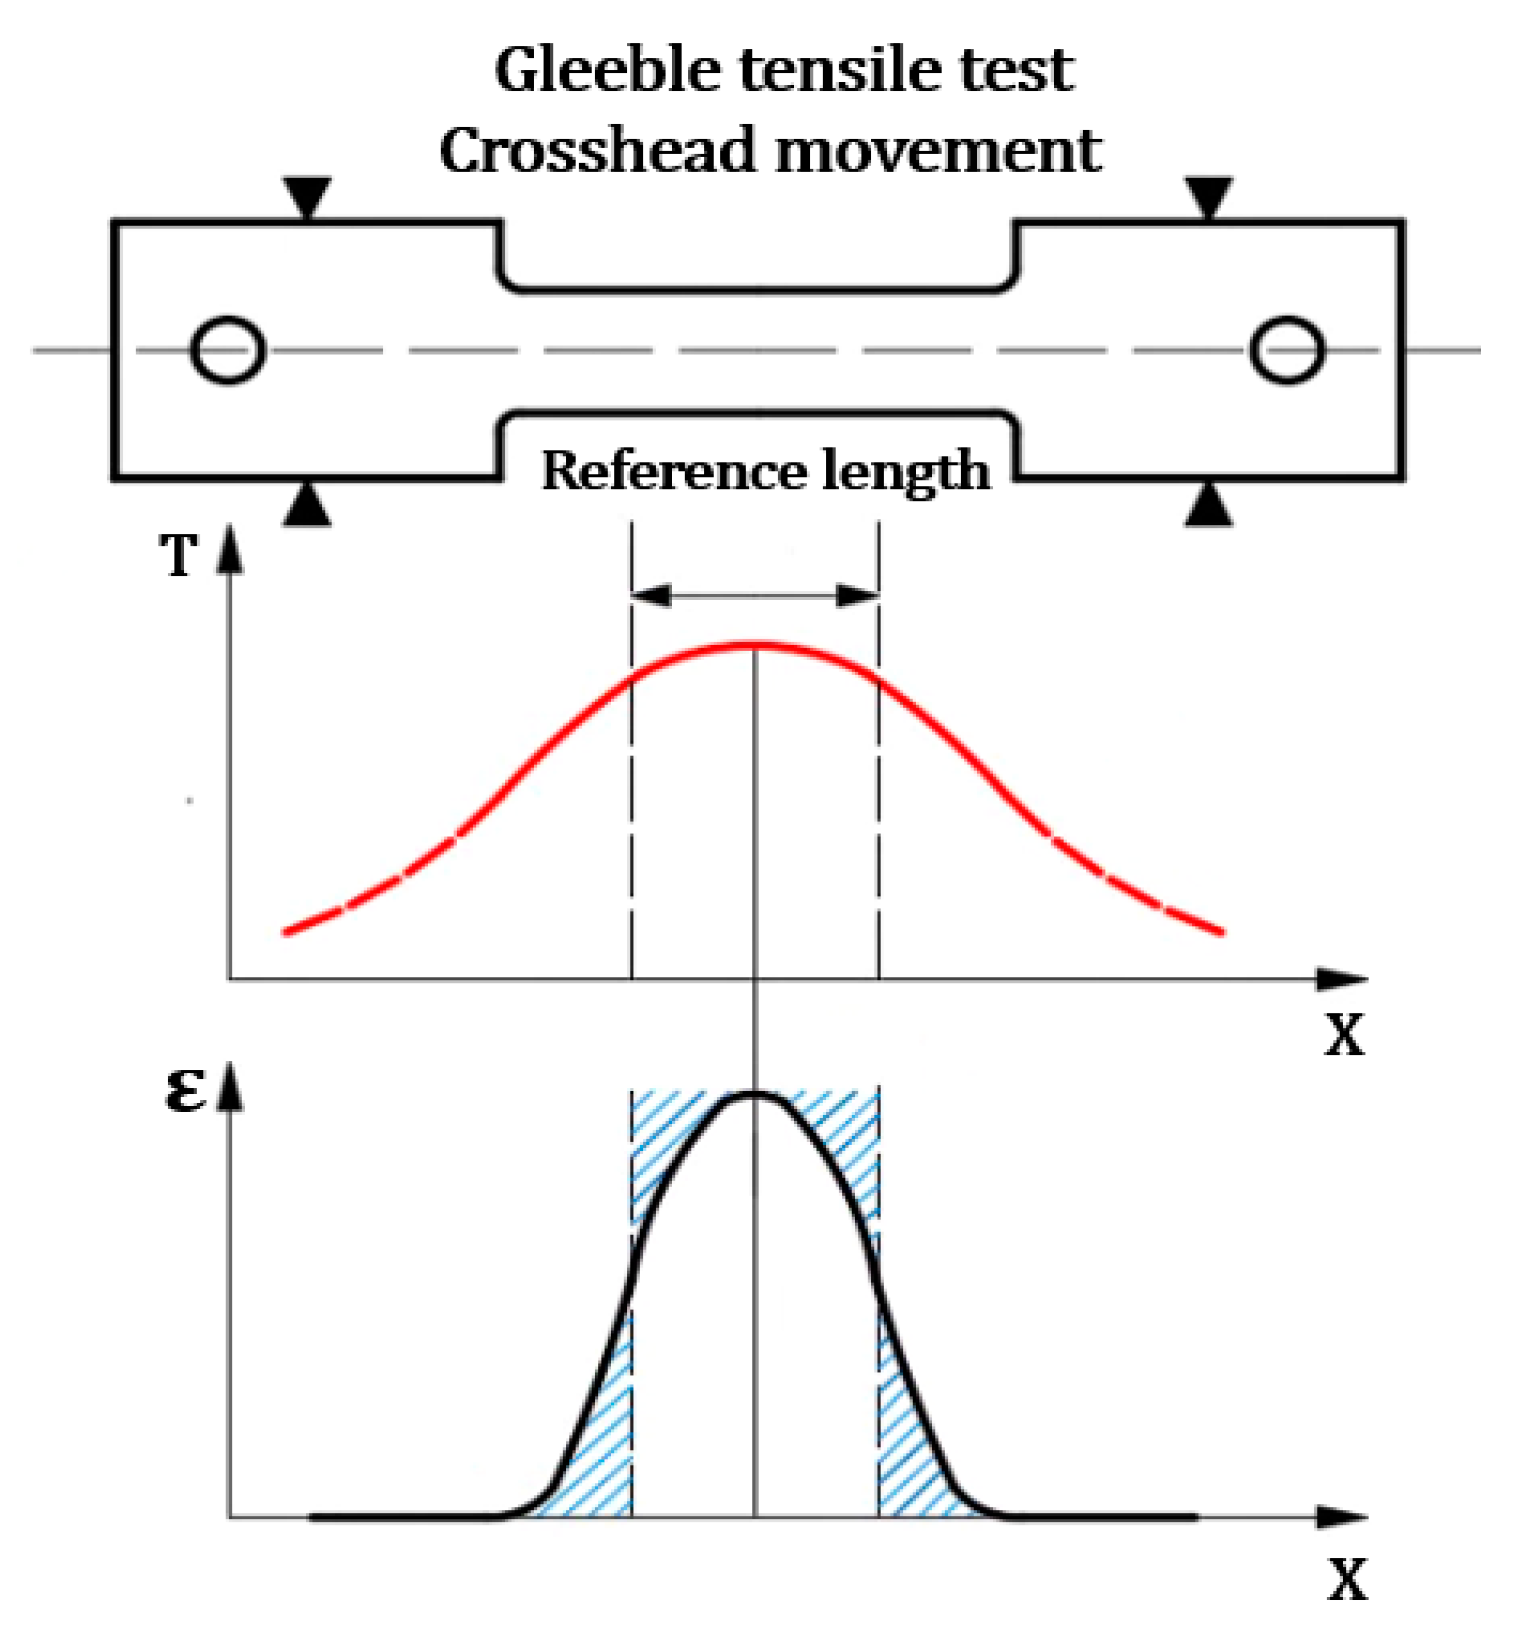
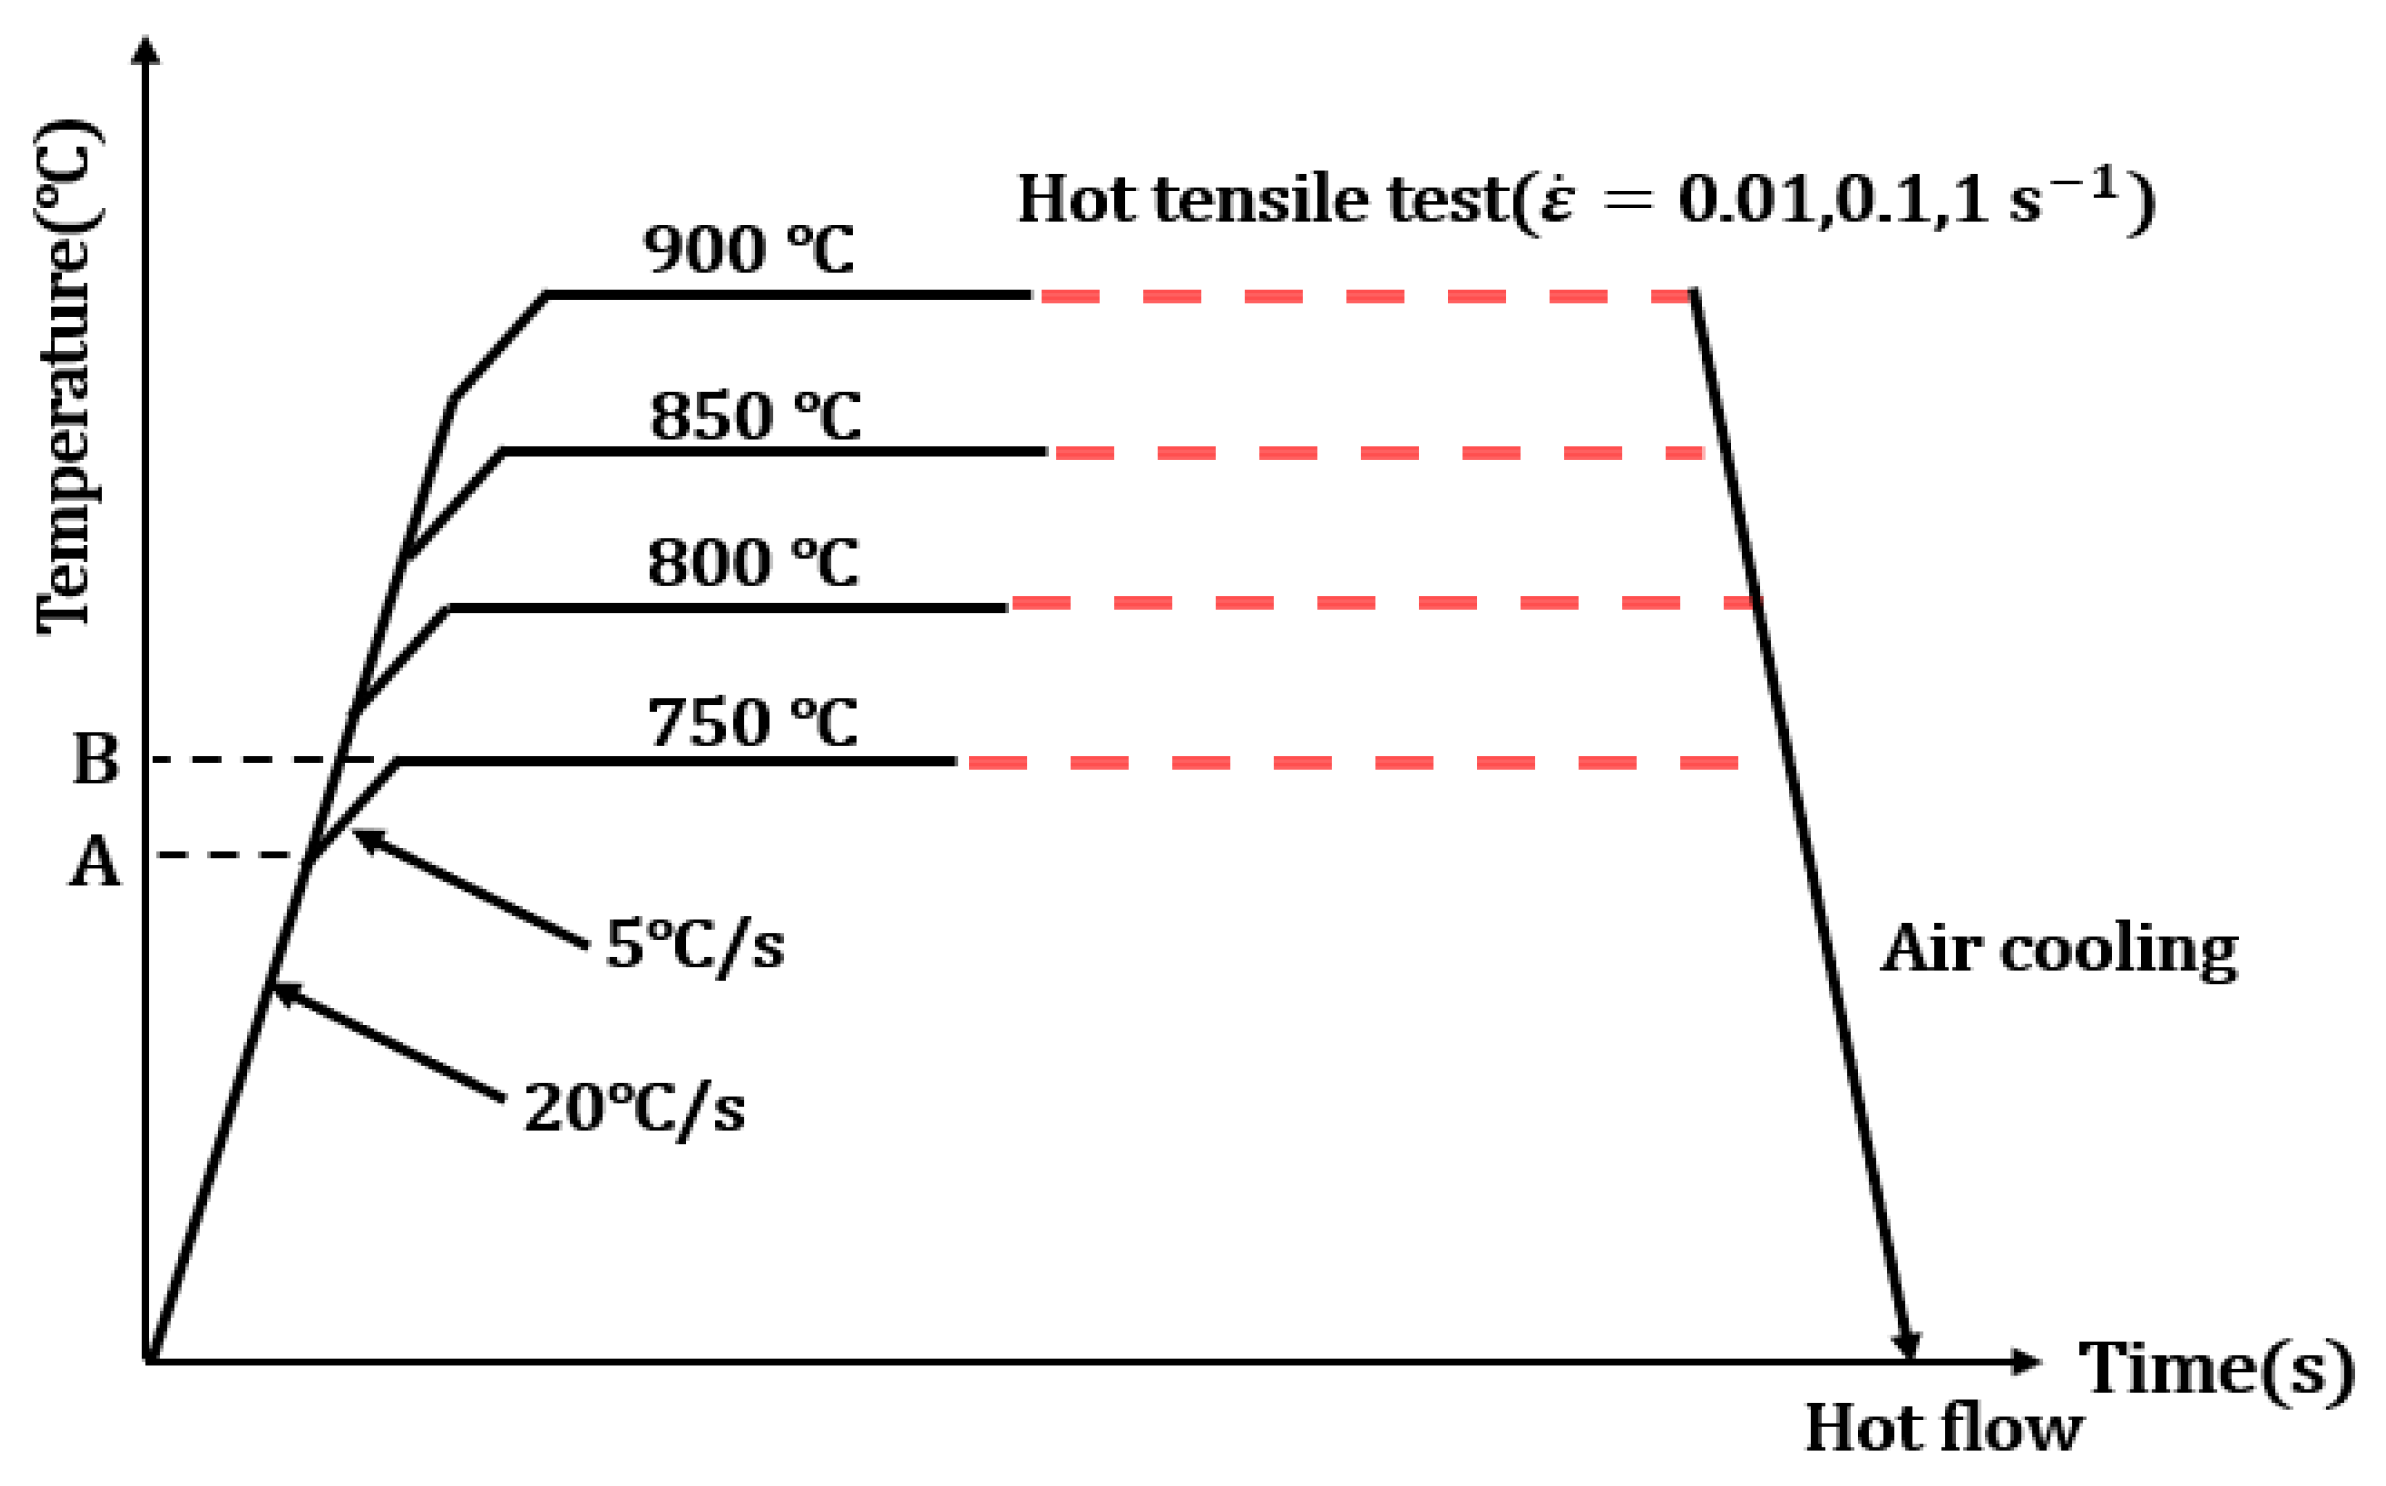
2.2. Gleeble Uniaxial Tensile Test

Hot uniaxial tensile tests were performed using Gleeble 3800 to characterize the hot flow and hardening behavior of TA32 under hot forming conditions. The Gleeble 3800 thermal-mechanical simulator could precisely control the cross-head stroke over time and enable the designed true strain rate to be achieved during the uniaxial tensile tests. Additionally, the Gleeble electrical resistance heating during the tests enables the temperature to be controlled within ±1 °C of the designed temperature, enabling consistent heating history and direct cooling after stretching can be achieved [18,19].
Before testing, thermocouples were welded to the centre of the specimen to measure the temperature and provide feedback to the Gleeble 3800 equipment, such that the designed heating rate and the target deformation temperature were accurately controlled. Figure 3 illustrates the temperature–time profiles of hot uniaxial tensile tests. The temperatures of hot tensile tests are designed at 750 °C, 800 °C, 850 °C and 900 °C, ranging from warm (~0.4–0.6 T m ) to hot (>0.6 T m ) forming conditions. Note that T m stands for the melting temperature of TA32. To avoid overheating the specimen due to fast electrical resistance heating, a two-step heating strategy was adopted, with a heating rate of 20 °C/s in the first step and reduced to 5 °C/s until the target temperature was reached. After heating, the specimen was soaked at the target temperature for the 60 s to guarantee the temperature stability in the uniform temperature zone of the specimen. The strain rates of hot tensile tests were performed at 0.01/s, 0.1/s and 1/s, which are the typical rates for the hot stamping and hot gas forming of titanium alloys. Each condition has been repeated three times to obtain reliable results. The reliability and repeatability of tests were also ensured by the evaluation of temperature and strain rate histories.

3. Strain-Based Correction Model of the Hot Uniaxial Tensile Tests

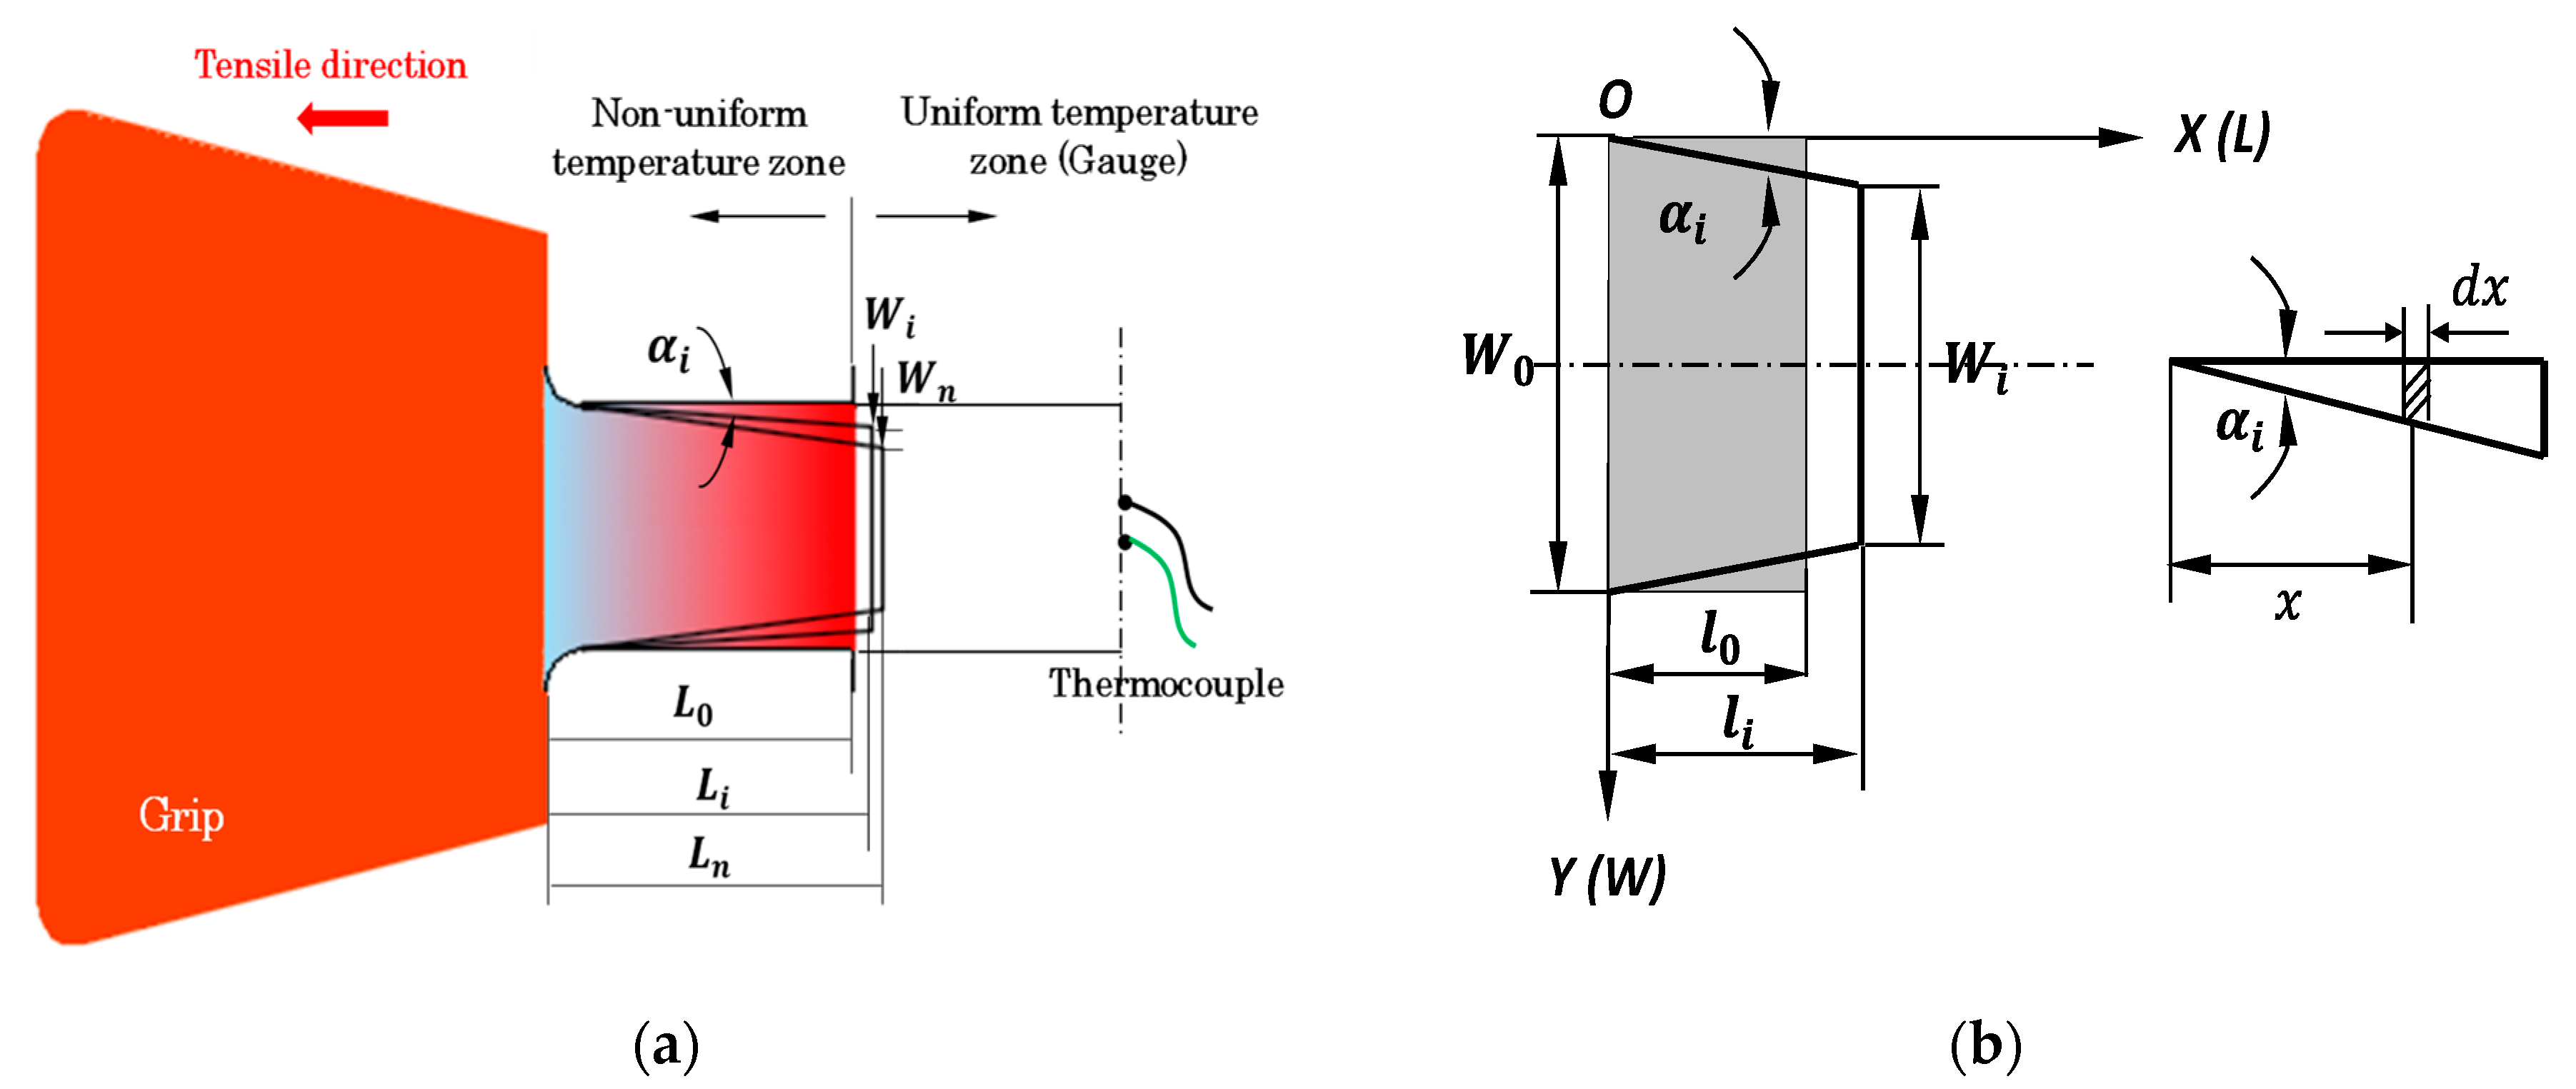
3.1. Geometrical Model

Figure 4 shows the geometrical model of the non-uniform temperature zone of the Gleeble tensile specimen. Taking a half specimen for analysis due to the geometric symmetry as shown in Figure 4a, the uniform temperature zone and the non-uniform temperature zone are defined along the longitudinal direction of the specimen. In this correction model, it is assumed that material in the uniform temperature zone is stretched uniformly in the longitudinal and contracted in the width direction. For the rest of the specimen in the non-uniform temperature zone, the section shape gradually changes from the initial rectangle to the trapezoid, as schematically shown in Figure 4a. The principle of the proposed correction method is to calculate the length of the non-uniform temperature zone, which evolves with time during the test. Provided with the total stroke from the facility, the length of the uniform temperature zone could be achieved by subtracting the non-uniform zone from the total stroke. The calculated length of the uniform temperature zone, which also evolves with time, will be used as the gauge length for subsequent calculation of the true strain levels and, hence, the true stress-strain curves.

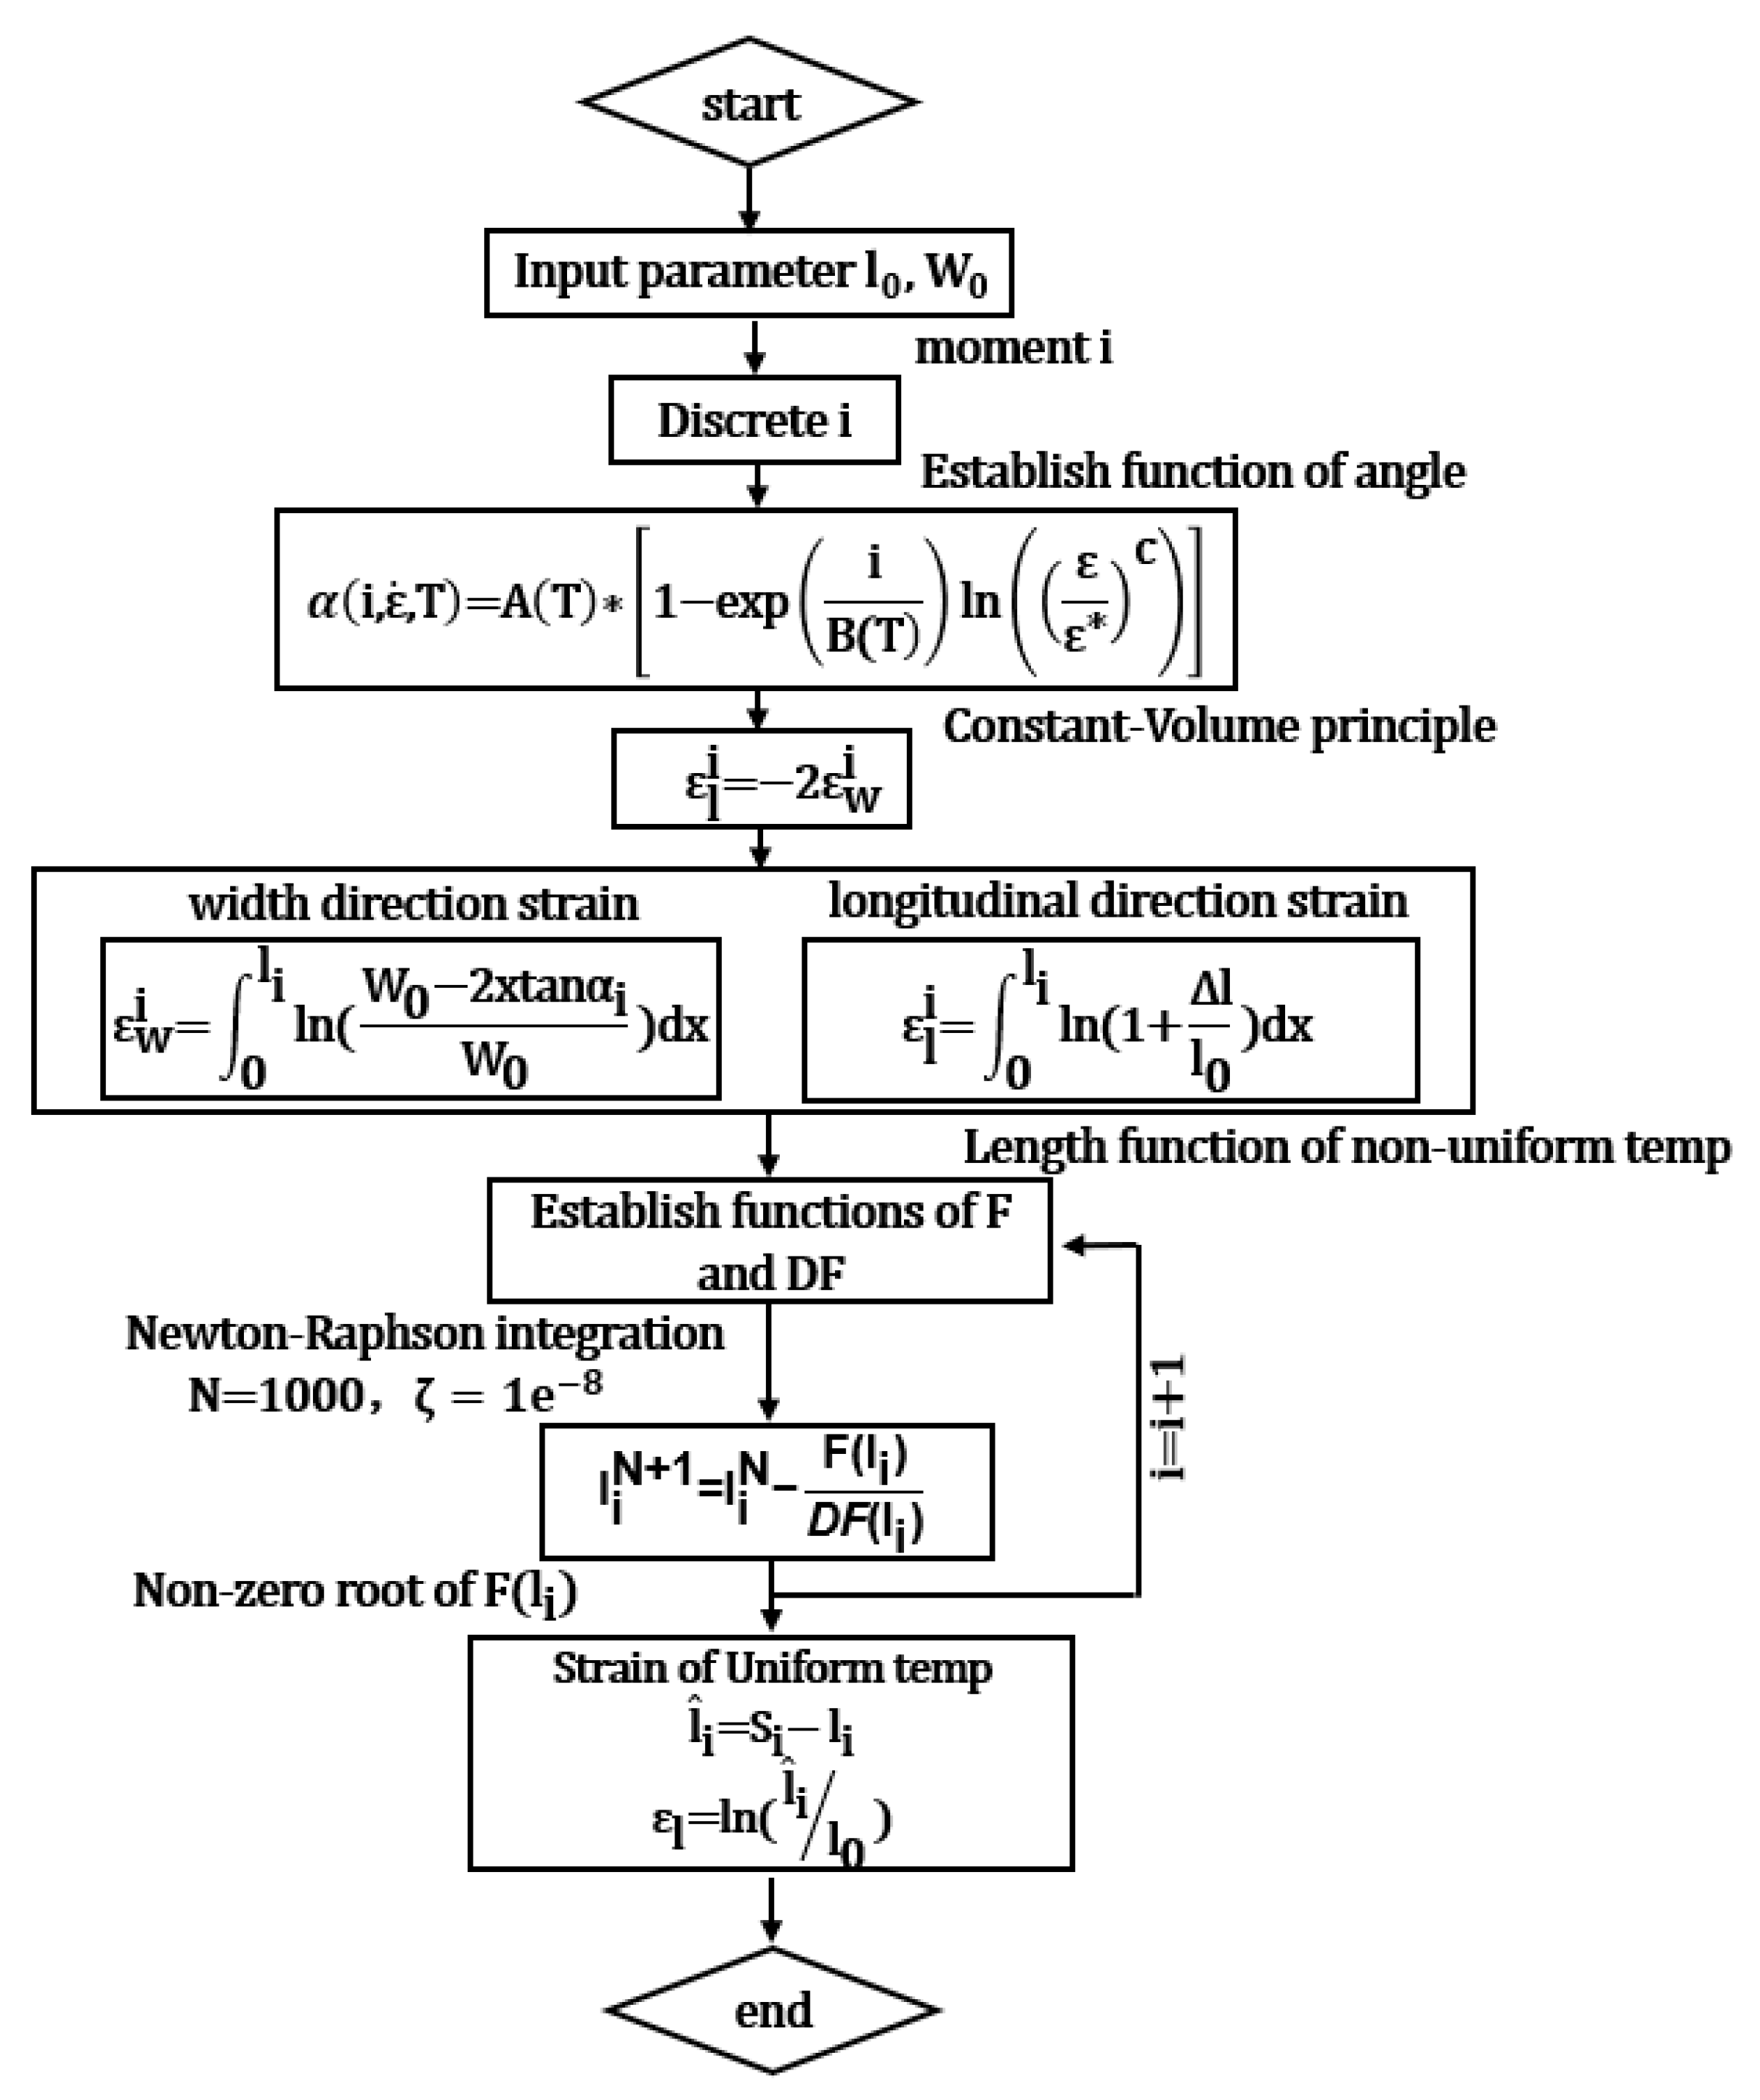
3.2. Model Calculation

Based on the volume consistency principle, the inclined angle, α i , as schematically given in Figure 4, in the non-uniform temperature zone gradually increases with the proceeding of deformation. The angle, α i , can be expressed using Equation (1).
t a n α i = W i W 0 2 l i
where W 0 is the initial width of the specimen, and W i and l i are the section width and length of the non-uniform temperature zone, respectively, at an instant moment.
To model the angle variation, a phenomenological expression of angle as a function of temperature and strain rate is proposed in Equation (2).
α ( i , ε ˙ , T ) = A ( T ) [ 1 e x p ( i B ( T ) ) ( ln ( ε ε ˙ ) ) c ]
where ε is the reference strain rate, used as 10 4 /s in this study. A ( T ) and B ( T ) are temperature-dependent constants. They are expressed using linear relationships, and temperature coefficients are determined using the experimental results. A ( T ) and B ( T ) can be expressed using Equations (3) and (4). The developed equation should be able to predict the variations of deformation.
A ( T ) = a 1 T + a 2
B ( T ) = b 1 T + b 2
According to the volume consistency principle, for the non-uniform temperature zone, the length strain ε L i is equal to twice of width strain ε w i of the non-uniform temperature zone. The correlation can be established using Equation (5).
ε L i = 2 ε w i
For strain, in the width direction it can be calculated using Equation (6).
ε w i = 1 l i 0 l i ln ( W i W 0 ) d x
then, by substituting Equation (1) into Equation (6), an integration equation is given as below:
ε w i = 1 l i 0 l i ln ( W 0 2 x t a n α i W 0 ) d x
After integration, an analytical expression of strain in the width direction is obtained:
ε w i = ( 1 l i t a n α i ) [ ( W 0 2 l i t a n α i ) ln ( W 0 2 l i t a n α i ) W 0 ln ( W 0 ) + 2 l i t a n α i + 2 ln ( W 0 ) l i t a n α i ]
For the simplicity of calculation, the tensile strain in the longitudinal direction is assumed as:
ε L i = ln ( 1 + Δ l l 0 )
Then, substitute Equations (8) and (9) into Equation (5) to obtain the length l i at an instant moment. The non-zero root of the established equation is the calculated value of the instant length of the non-uniform temperature zone. The function is given as:
F ( l i ) = [ ( W 0 2 l i t a n α i ) ln ( W 0 2 l i t a n α i ) W 0 ln ( W 0 ) + 2 l i t a n α i + 2 ln ( W 0 ) l i t a n α i l i t a n α i ln ( l i ) + l i t a n α i ln ( l 0 ) ]
It is impossible to obtain the analytical solution of F ( l i ) = 0 . Therefore, The Newton–Raphson integration method is utilised to mathematically compute the root.
l i + 1 = l i F ( l i ) F ( l i )
where F ( l i ) is the derivative of F ( l i ) given as follows:
F ( l i ) = D F = 2 t a n α i ln ( W 0 2 l i t a n α i ) + 2 ln ( W 0 ) t a n α i t a n α i ln ( l i ) t a n α i l i + t a n α i ln ( l 0 )
Figure 5 shows the flow chart of this correction model using MATLAB. Once the length of the non-uniform temperature zone is known, the length of the uniform temperature zone, l i ^ , can be obtained.
l i ^ = S i l i
where S i is the sum of the stroke of uniform temperature zone. The corrected strain for uniform temperature zone Equation (14) is given as follows:
ε l = ln ( l i ^ l 0 )

4. Results and Discussion

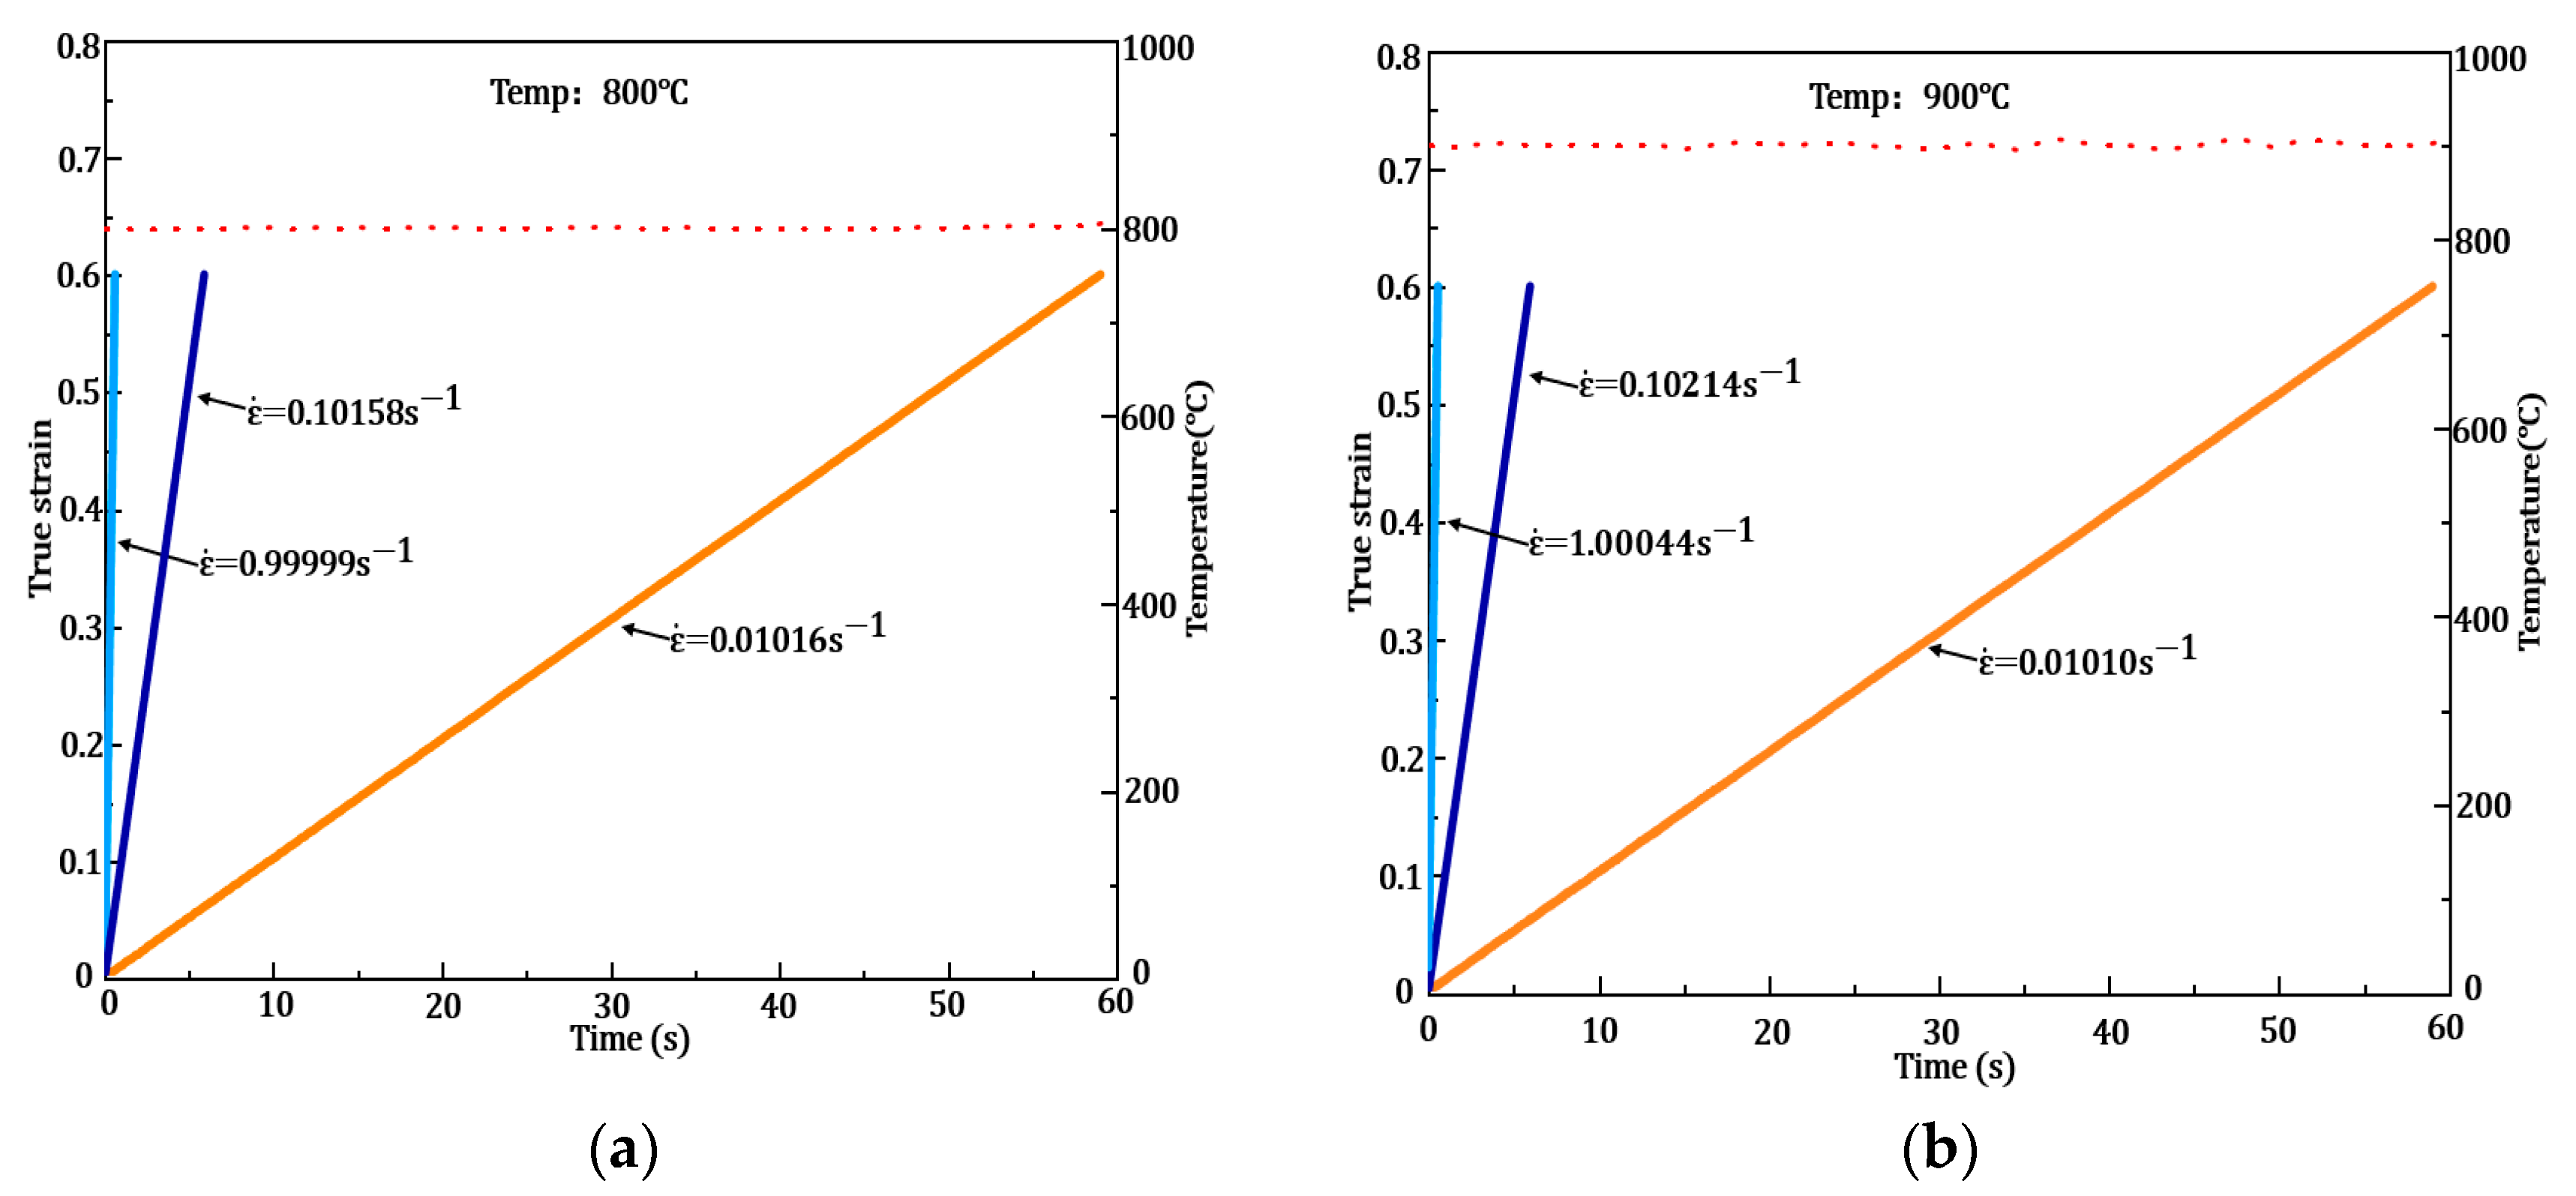
4.1. Verification of Deformation Conditions
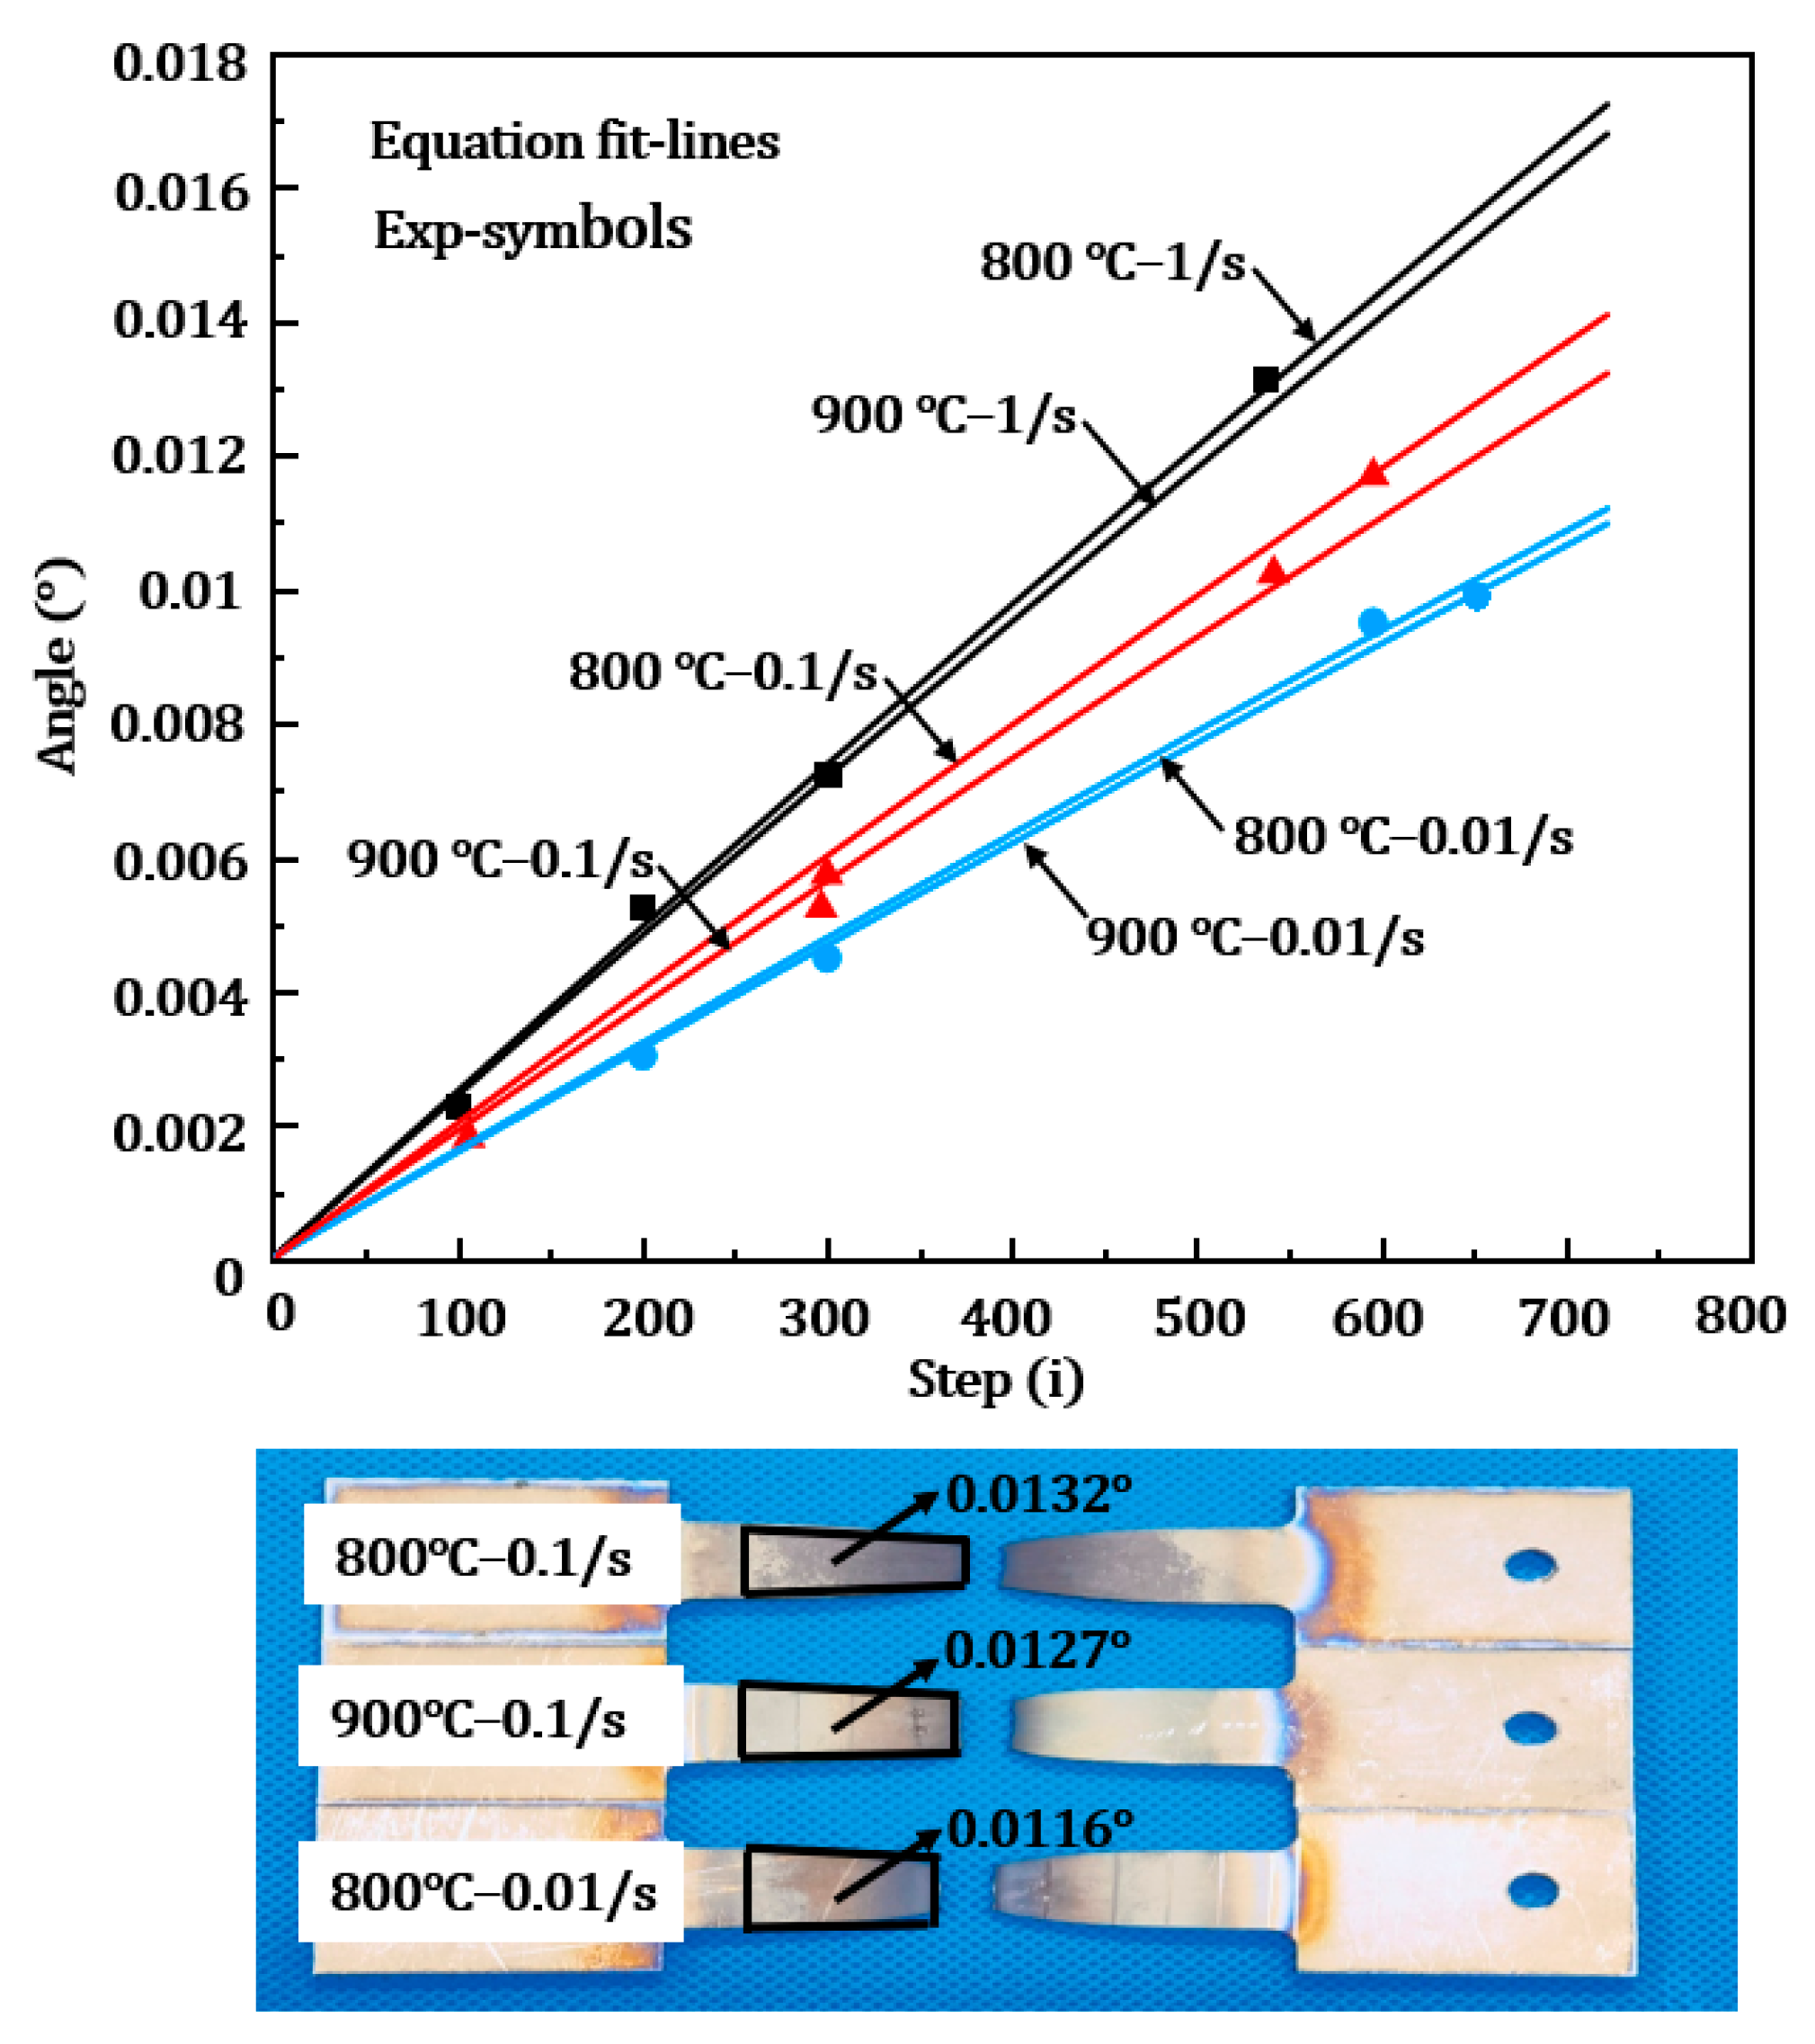
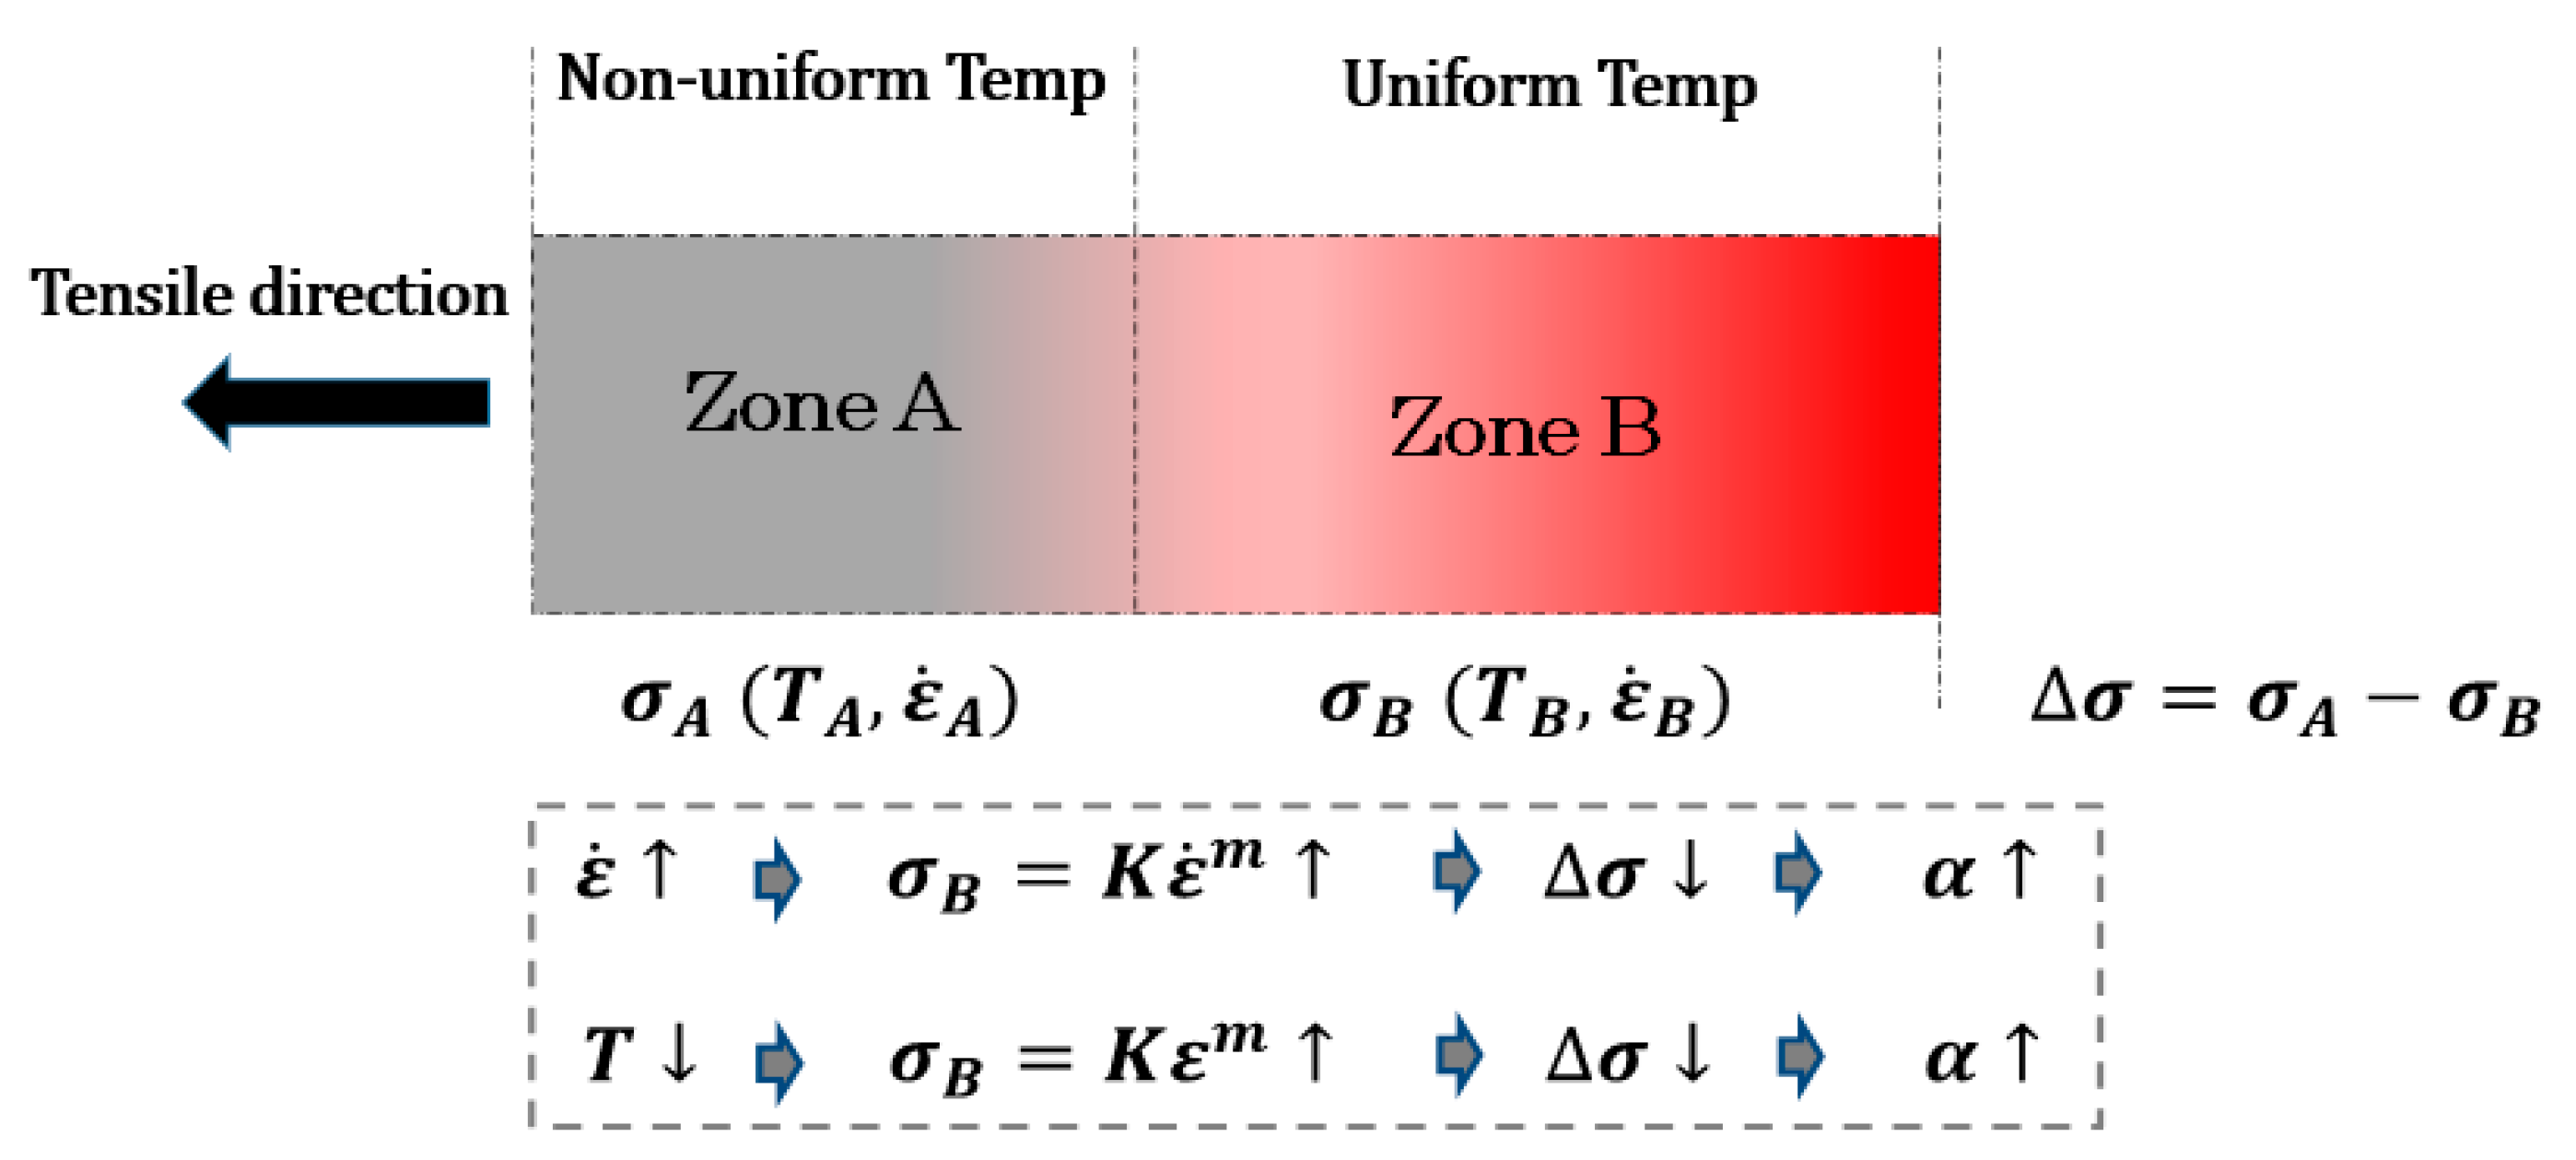
To verify the correctness of Gleeble testing, the deformation conditions were evaluated using the corresponding experimental data of the specimen under different tensile conditions to validate the constant temperature and strain rates. Figure 6 shows the determined temperature and strain rate results.Figure 6a shows the plots of strains versus time. The programmed strain rates were 0.01/s, 0.1/s and 1/s at 800 °C, while Figure 6b shows the results for the same strain rates at 900 °C. The constancy of tensile speed can be verified by the strain rate of the specimen shown in Equation (15).
ε ˙ = Δ ε Δ t
where Δ ε and Δ t are the variations of strain and time, respectively.
In addition, the temperature variations measured using thermocouples are also plotted in Figure 6. As can be seen in this figure, linear correlations can be found for the strain plots. At 800 °C, the strain rate was 0.01013/s, 0.10126/s and 1.01518/s, and at 900 °C, it was 0.01012/s, 0.1013/s and 1.10108/s. These post determined strain rates are identical to the original set values, which illustrates the excellent stability of strain rates during testing.

4.2. Calibration of the Angle, α i , Evolution in the Non-Uniformity Zone

In this section, the evolution of the experimental angle, α i , during deformation at the designed temperature (i.e., 800 °C and 900 °C) and strain rates (0.01/s, 0.1/s and 1/s) are presented as symbols in Figure 7. For temperature determination, the designed temperature are selected based on industrial hot forming conditions for titanium alloys, which is 0.4–0.6 T m . Both temperatures are determined based on the industrial range. The experimental angles are calculated using Equation (1), where the W i values are measured. These data were used to calibrate the proposed angle evolution model in Equation (2). The determined angle equation parameters are given in Table 2.
As shown in Figure 7, The equation fits and experimental results show a good agreement. The angle change indicates the deformation uniformity. A lower value in angle indicates a more uniform deformation. The angle value increases with decreasing temperature and increasing strain rates. This could be explained using Figure 8. The deformation zone could be divided into a uniform-temperature zone (zone A) and a non-uniform temperature zone (zone B). The flow stresses of both zones can be described by phenomenological equations–Fields–Bachofen mode shown in Equation (16) [20].
σ = K ε n ε ˙ m
where K is the strength coefficient, n is the strain hardening component and m is the strain rate hardening component.
At a low temperature and a high strain rate, the flow stress of zone B becomes higher. Then the difference of stress, Δ σ , between zones A and B is smaller. This results in a larger deformation of the non-uniform zone and, hence, higher α values. Thus, a low temperature and high strain rate cause larger non-uniformity of the specimen.
The fracture morphology of the sample is provided in Figure 7. The two sets of data, for 0.1/s and 0.01/s on 800 °C and for 900 °C, only 0.1/s were given to create an orthogonal experimental matrix, aiming to measure and compare the angle value of the non-uniform temperature zone for the same strain rate, at different temperatures, and for the same temperature, at different strain rates. The angle value of the non-uniform temperature zone is 800 °C–0.1/s > 900 °C–0.1/s > 800 °C–0.01/s. This is consistent with the above explanation, where the angle variation of the non-uniform temperature was in a positive relationship with strain and a negative relationship with temperatures.

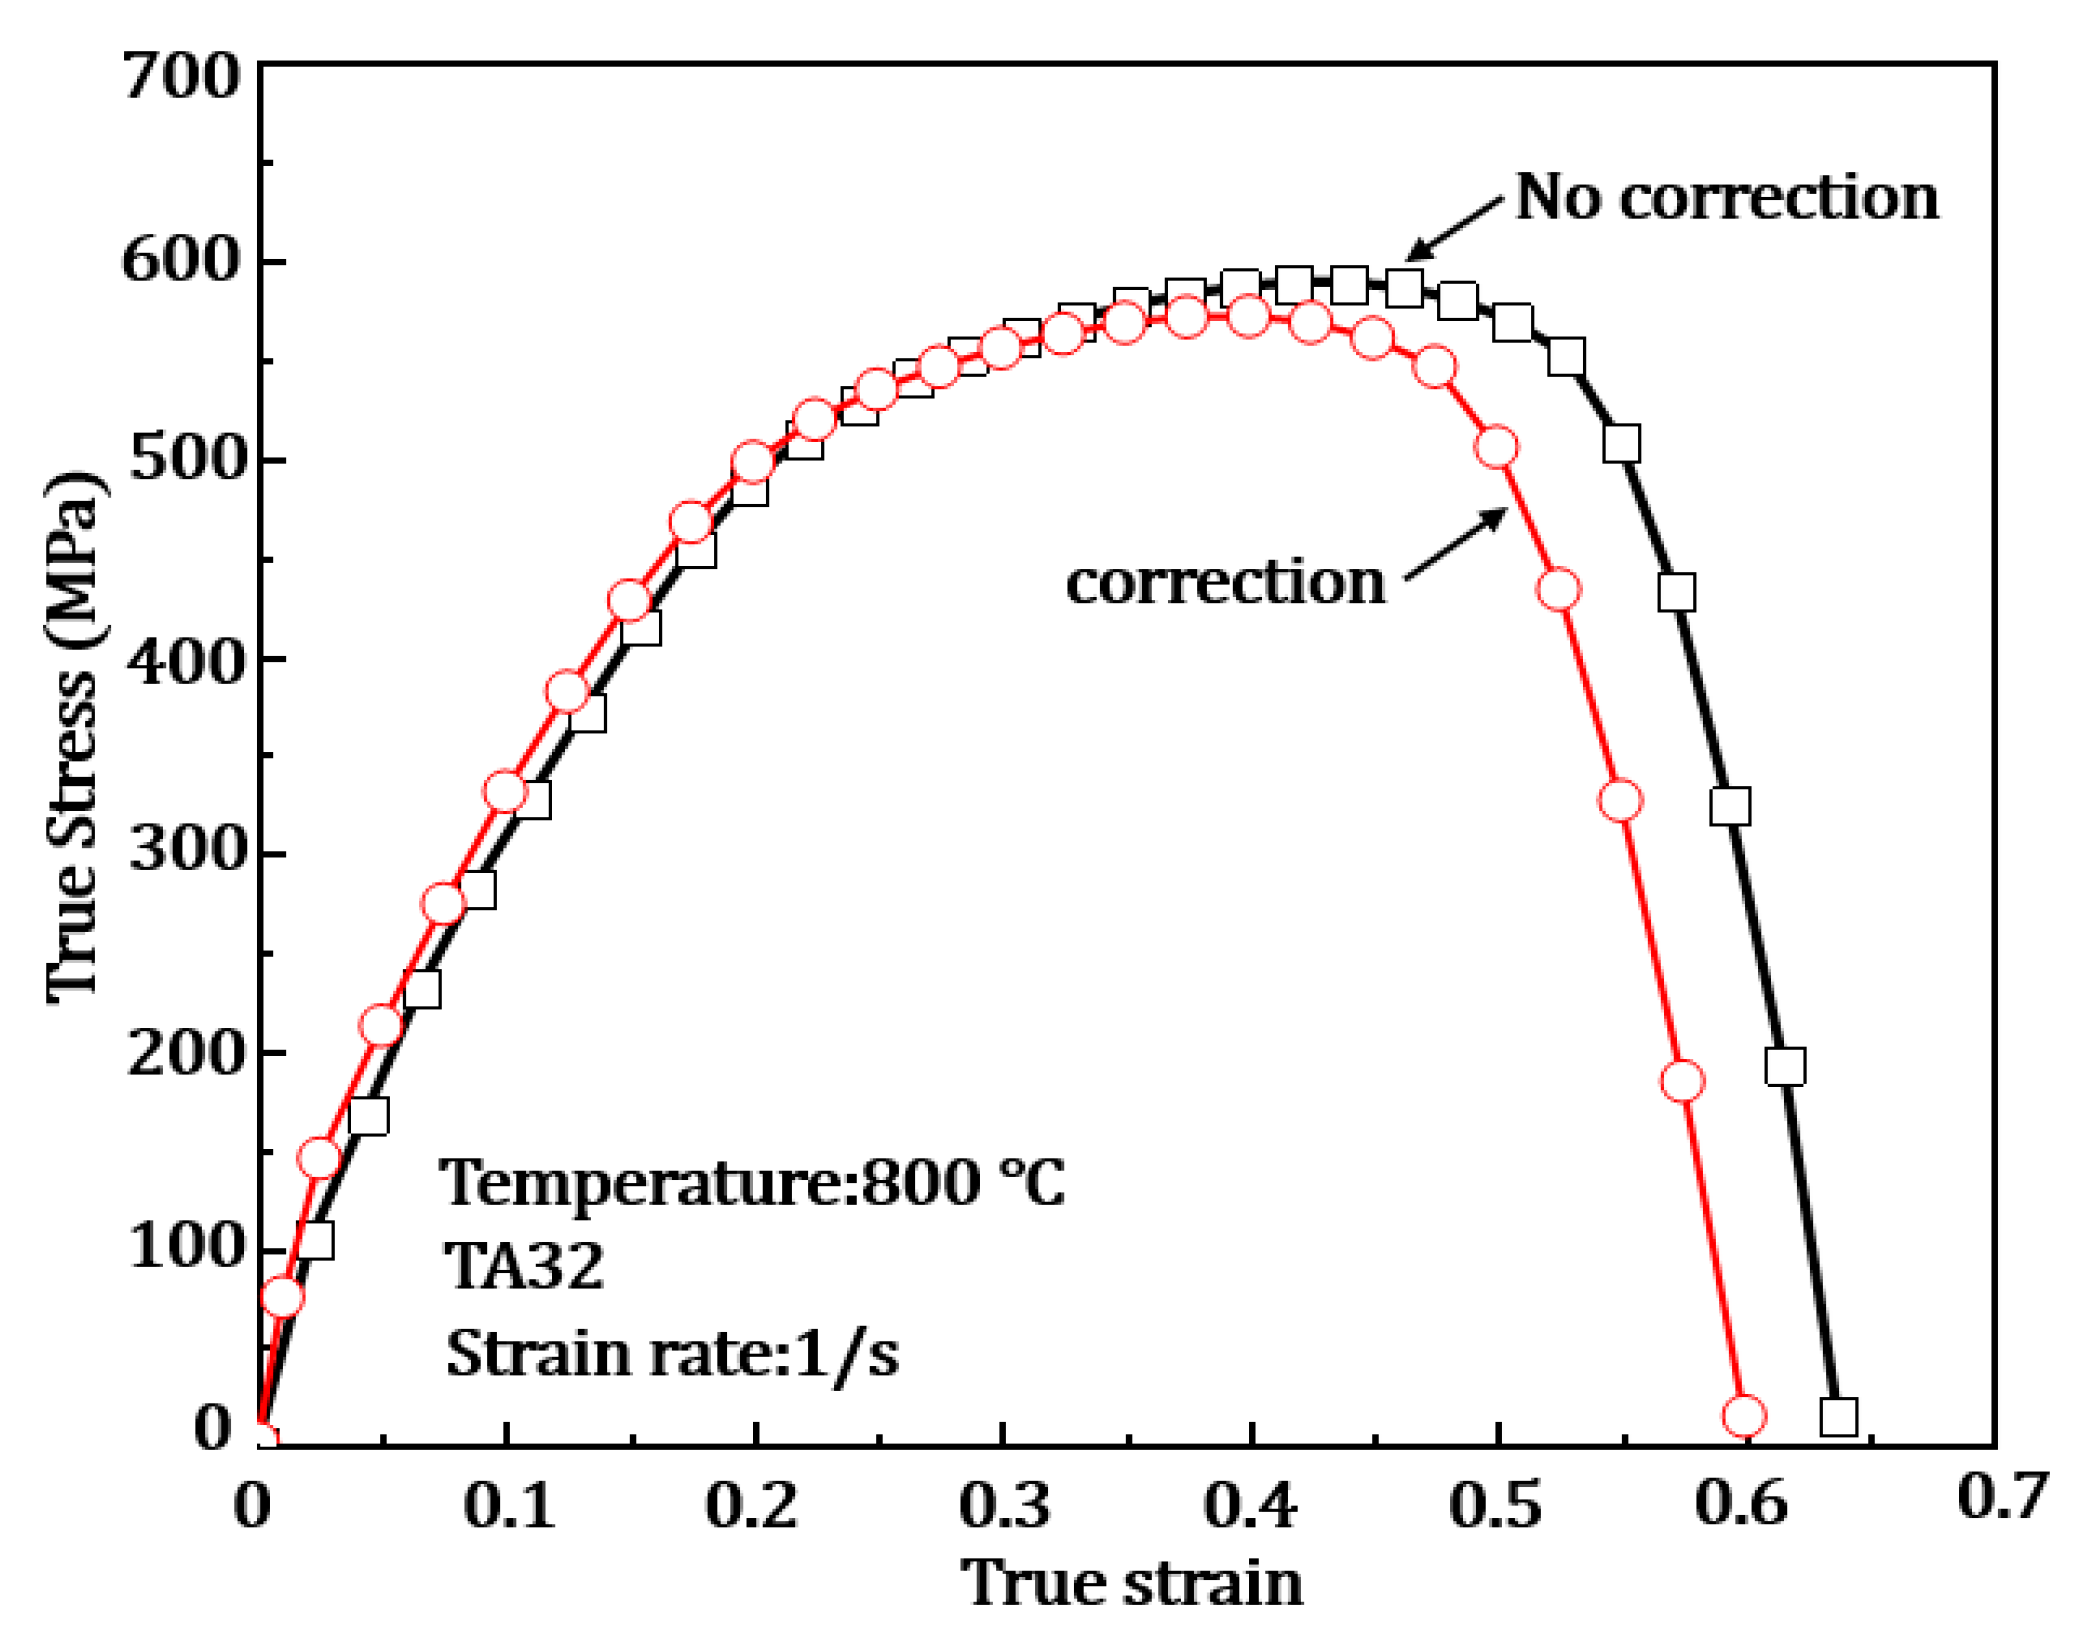
4.3. Corrected Stress-Strain Correlations

Figure 9 shows the comparison between corrected results and original stroke-based results of TA32 titanium alloy under the condition of 800 °C, 1/s. It can be seen that the difference between the corrected and non-corrected stress-strain curves becomes larger with the proceeding of deformations. This continuously enlarged difference is mainly attributed to the increased differences in the calculated deformation increment (i.e., Δ l in Equation (9)). With the increase in the deformation levels, the angle (i.e., α i ) in the non-uniform deformation zone increases and the effect of the length increment (i.e., Δ l i ) in the non-uniform deformation zone progressively increased and accumulated. Hence, the difference between the stress-strain curves becomes increasingly visible. Such trends also apply to the true stress-strain curves for other conditions, where the difference between the corrected and the non-corrected curves gradually apprears. The stress-strain curve obtained based on this correction method excludes the influence of the non-uniform deformation, which resulted in a reduction of the maximum plastic deformation stress and strain, i.e., the tensile strength and the maximum strain to failure.
Based on the correction method, the stress-strain curves at all conditions are reprocessed and shown in Figure 10. These corrected curves follow a similar trend to the compared results before and after the correction given in Figure 9, and the corrected results are only given in this section for the sake of graphical appearance and to reduce the intersection of curves. The trends of the hot flow behavior are similar to those without any corrections, where higher strain rates and lower temperature result in higher flow stress and smaller elongations. At a fixed temperature, as shown in Figure 10a,b, the elongation of the TA32 titanium alloy reduces with increasing strain rates, and the maximum strain to failure can reach 0.8 at 800 °C, 0.01/s. Considering the flow stress, lower strain rates reduce the flow stress values. Lower strain rates lead to longer deformation time and, hence, a longer time soaking at high deformation temperatures. This facilitates the dislocation recovery and reduces the deformation resistance, hence resulting in a lower flow stress. On the contrary, the flow stress of TA32 at a fixed temperature increases with the increase in strain rates due to the presence of more dislocations, which are easily piled up and increase the deformation resistance. This is observed in Figure 10a,b, where the maximum flow stress at a strain rate of 1/s is greater than those at 0.1/s and 0.01/s.
At a fixed strain rate, as shown in Figure 10c, a higher temperature leads to lower flow stresses with a higher ductility. Additionally, the hardening behavior is less significant at higher deformation temperatures, where the flow stress is rapidly flaunted to 170 MPa. The reduced hardening behavior is mainly attributed to the dislocation recovery [21]. Such reduced hardening behavior may also be attributed to the concurrent dynamic recrystallization, if it occurs [22].

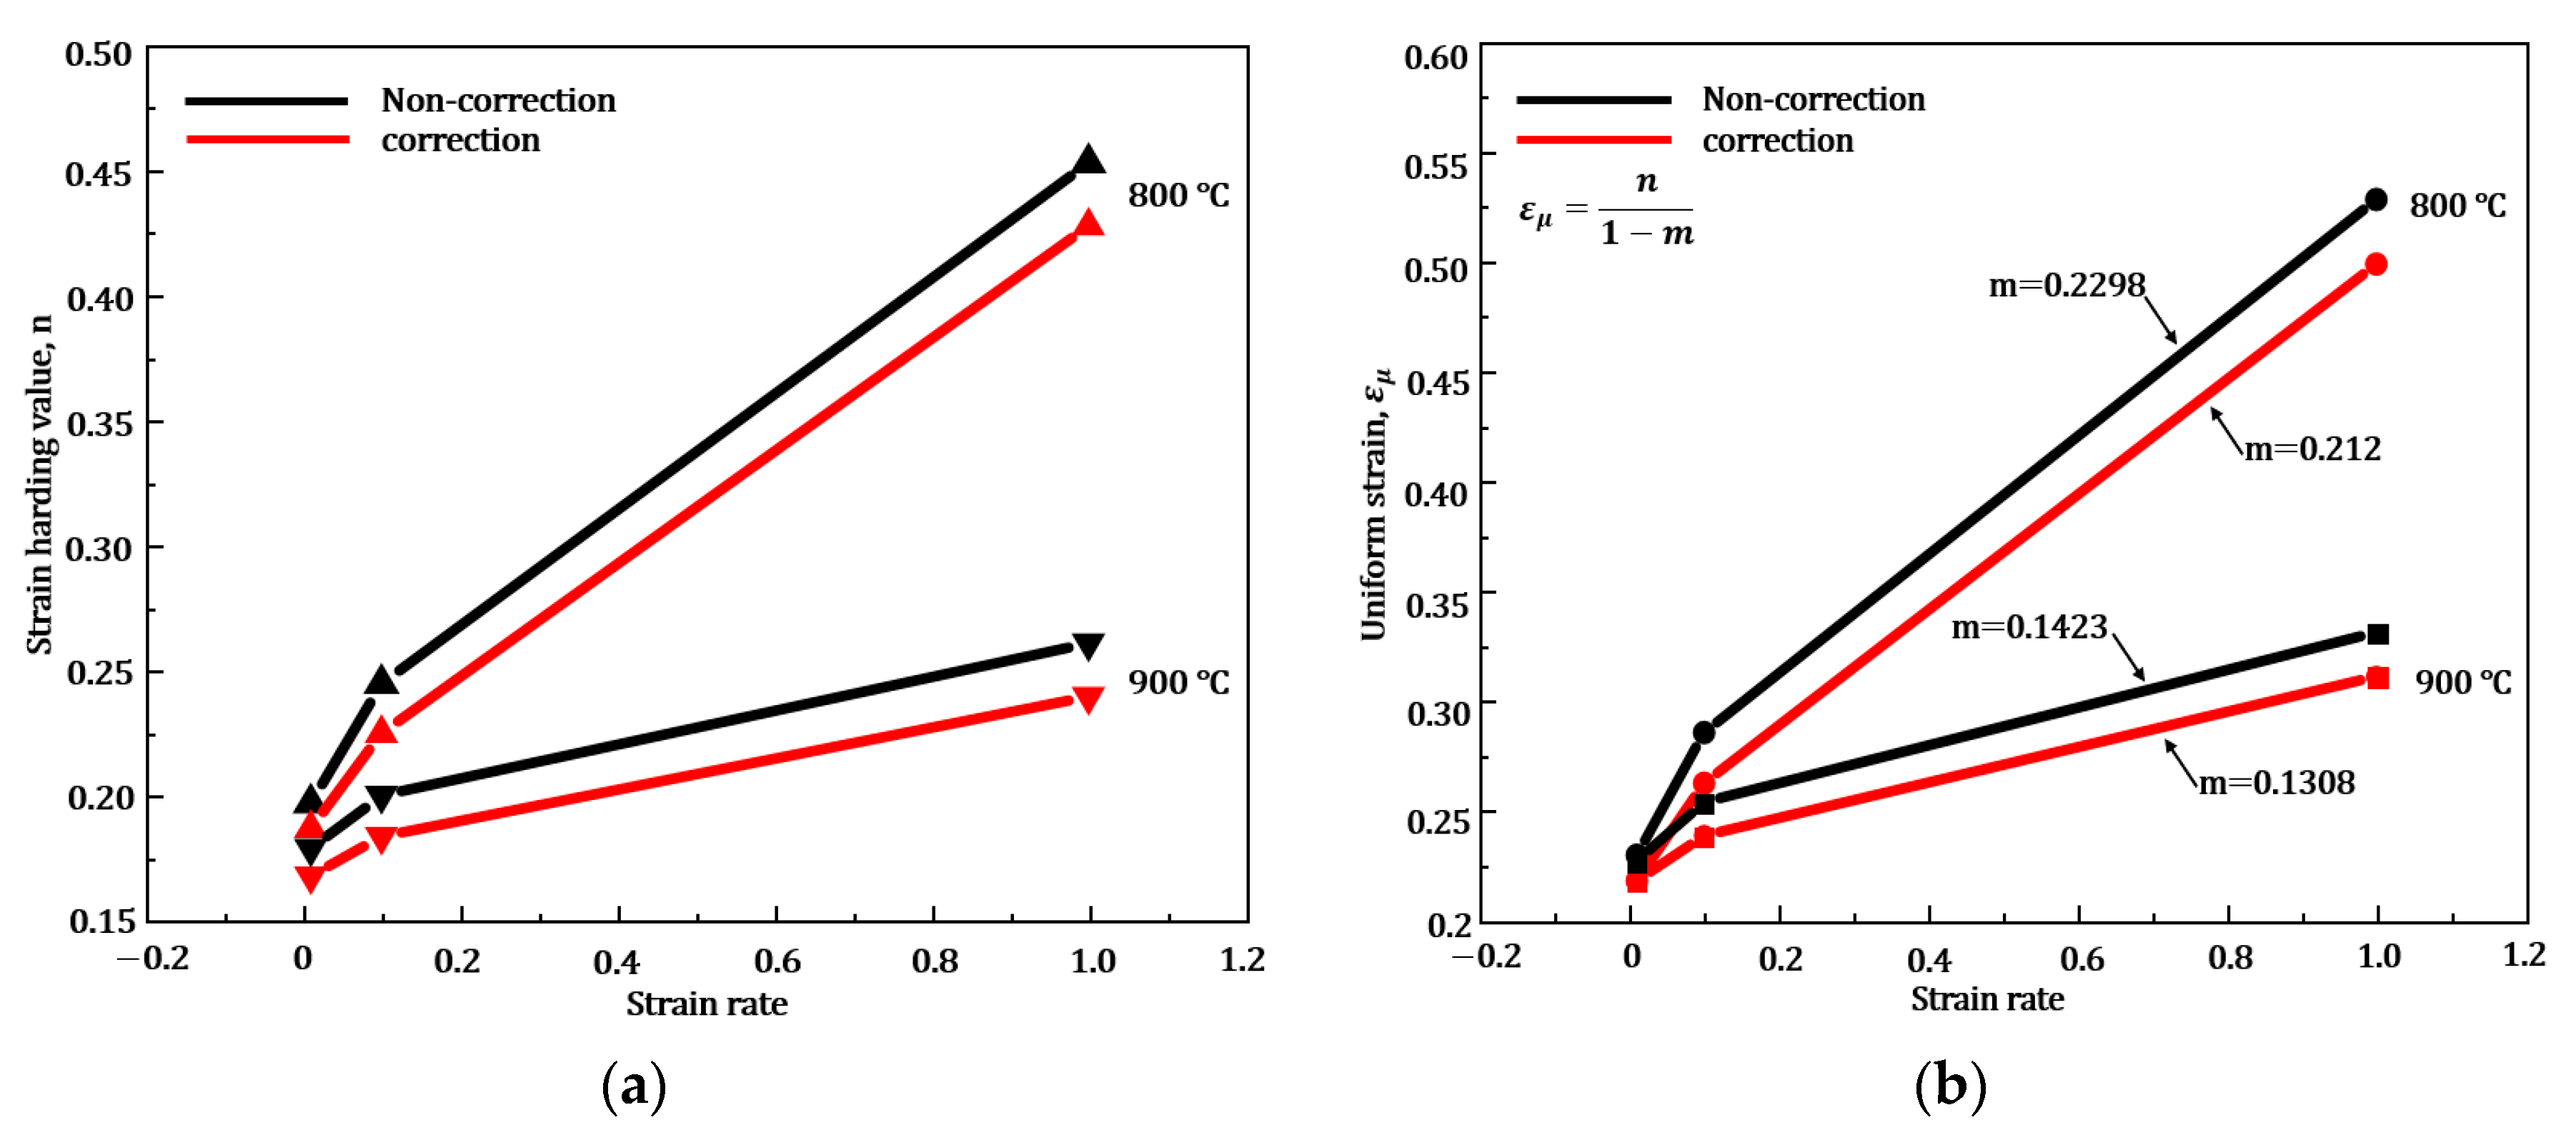
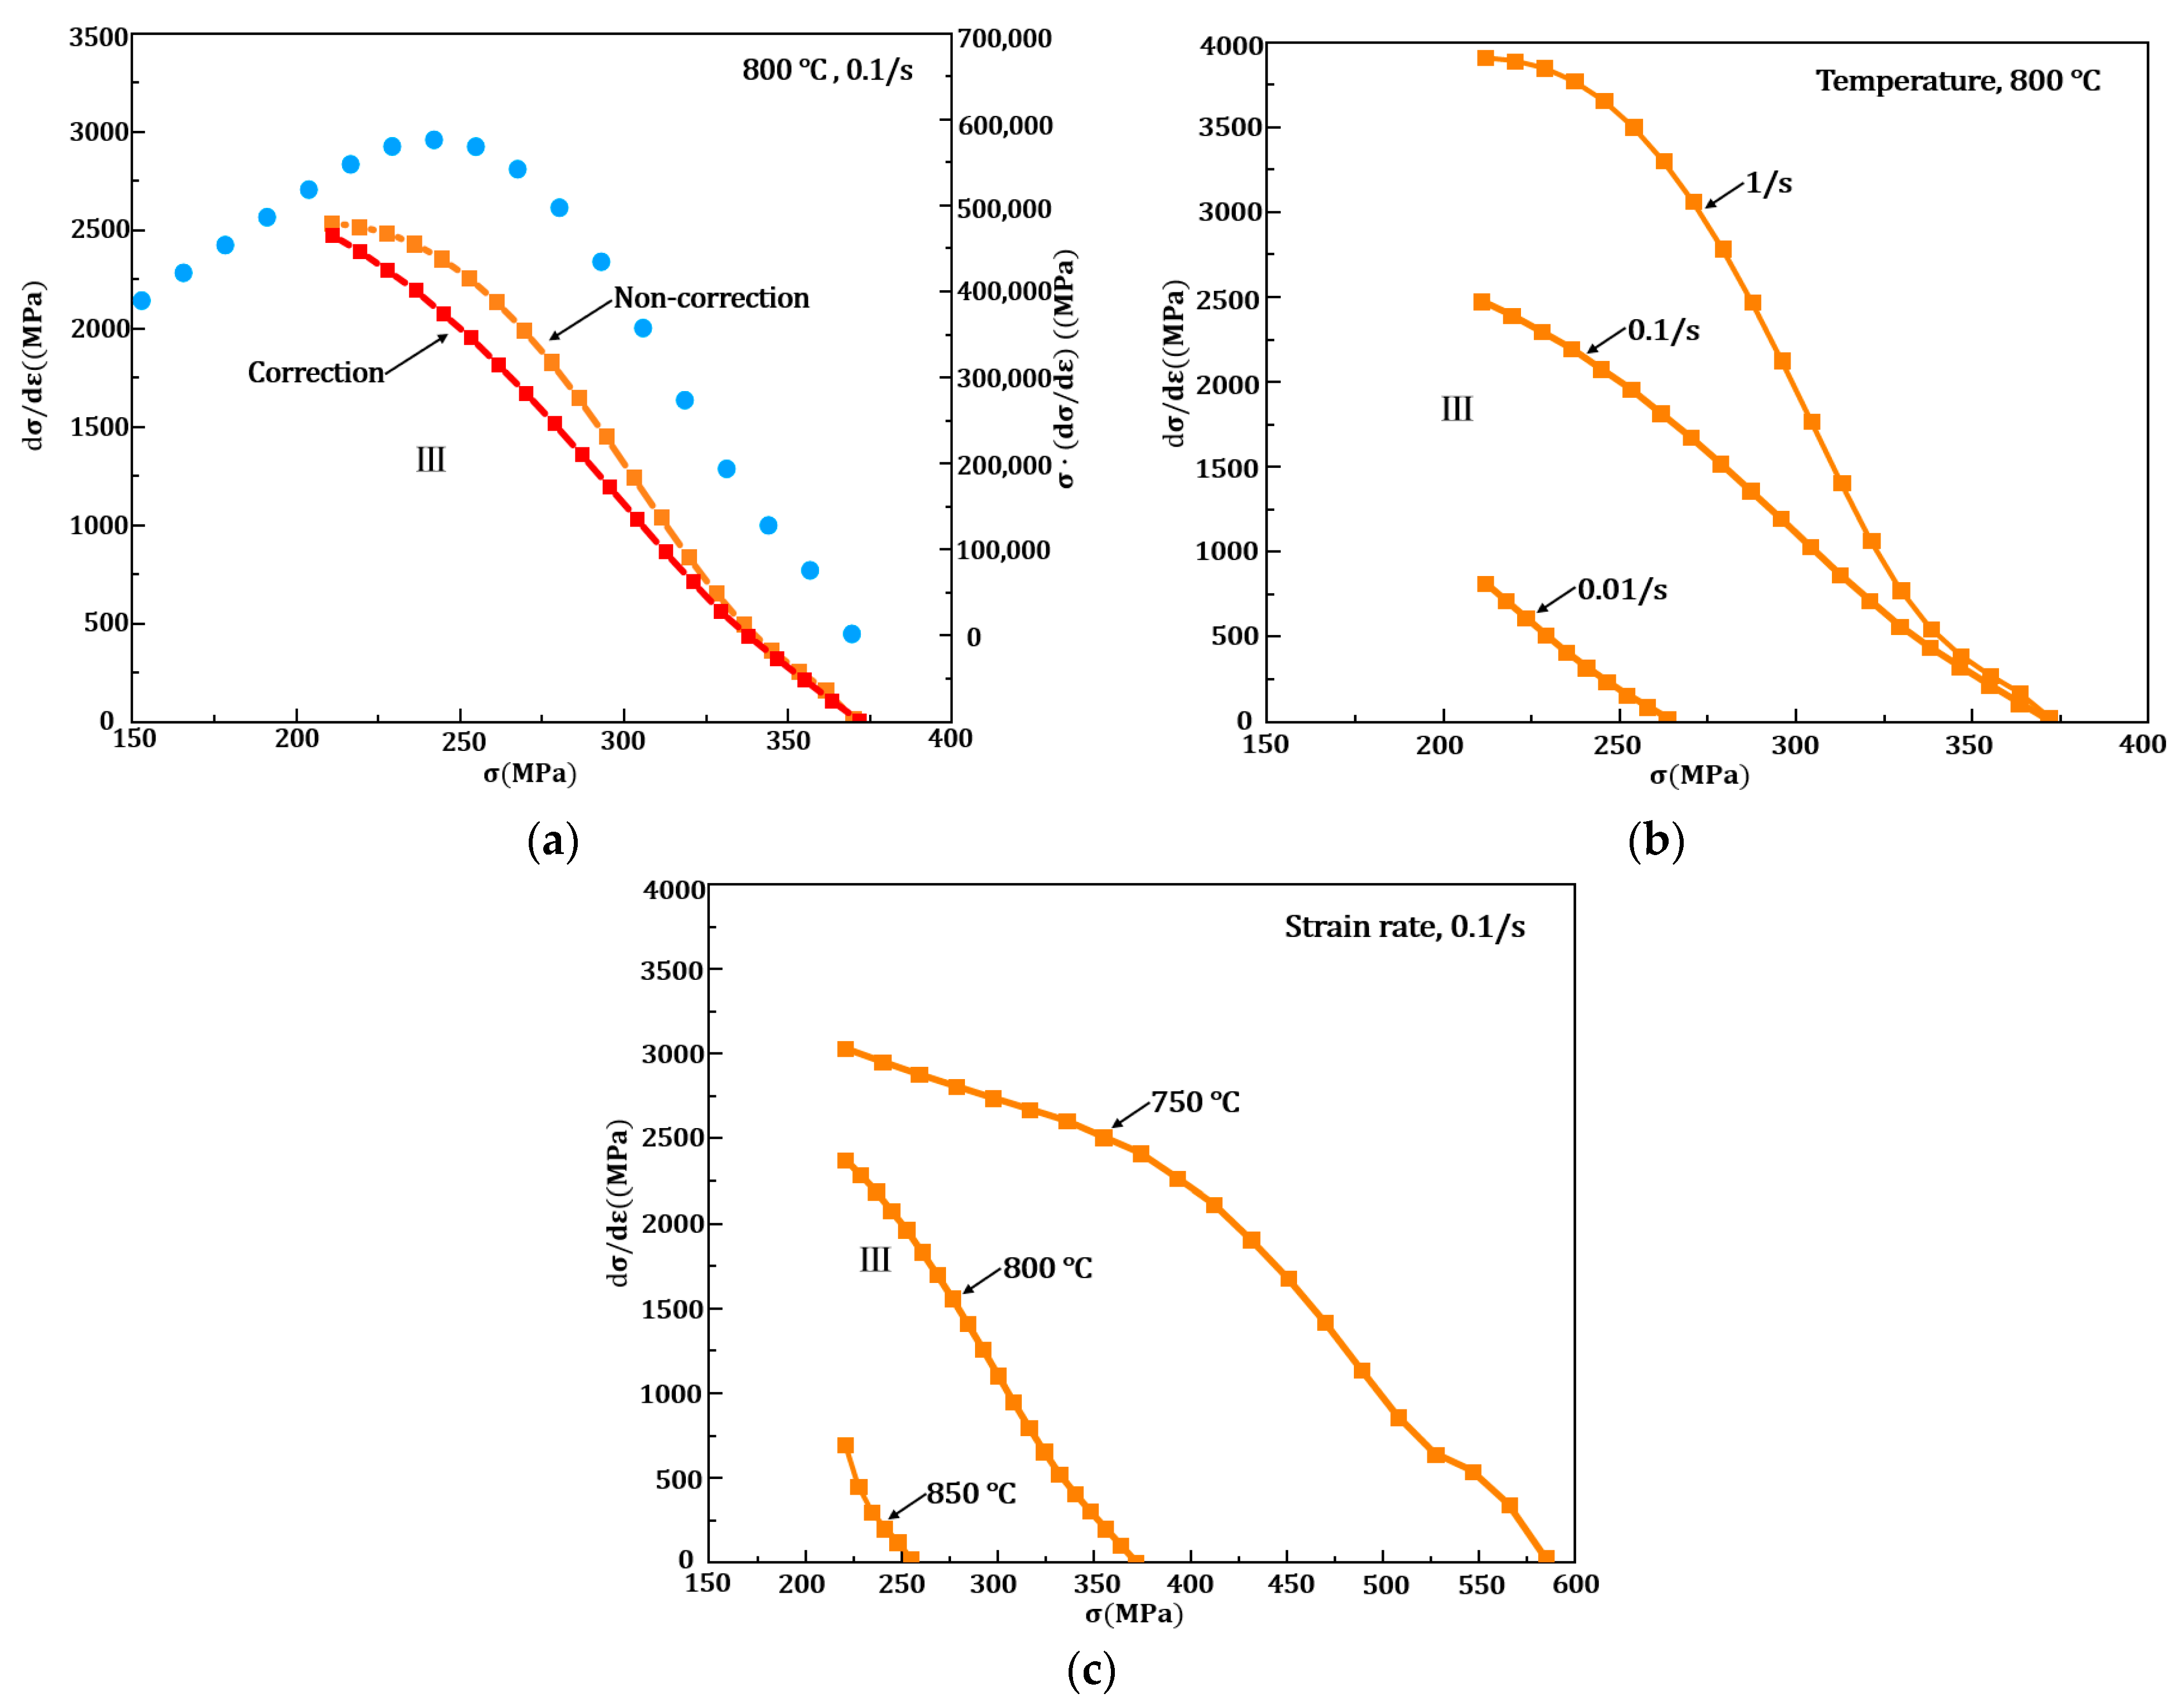
4.4. Hardening Behavior

The hardening behavior of the material is of great importance for sheet metal forming, which determines the deformation uniformity. For hot forming titanium alloys, strain hardening and strain rate hardening are two dominant hardening mechanisms, which can be evaluated by calculating strain hardening component, n, and strain rate hardening component, m. Figure 11 shows the hardening components (i.e., n, m) of TA32 calculated from the stress-strain curves both with and without correction in Figure 10. After correction, both the strain hardening value and the strain rate hardening value were reduced compared with those without correction. The trends of the n and m values are as generally expected, where lower temperatures enhance both strain and strain rate hardening, which is reflected from the increased n and m values at lower temperatures. The n value also increases with strain rates due to the shorter deformation time, where fewer dislocations recover, resulting in stronger deformation resistance.
Considering that the strain hardening component and strain rate hardening component is not at the same scale, conventionally, it is difficult to evaluate the contributions of each. To compare the contribution of hardening at various process parameters and facilitate the process parameter selection, the direct influence of hardening on uniform strain is used in this study to quantify the relative contributions of strain hardening and strain rate hardening. The considered criteria of hardening on uniform strain is used in this study [23], as given in the below equation.
ε u = n / ( 1 m )
where ε u represents the uniform strain before necking.
The ε u value could be used to evaluate the uniformity of the formed parts. The trends for ε u at various temperatures and strain rates are similar to those of n values, where higher strain rates and lower temperatures increase the ε u value. The comparison results of uniform strain of non-correction and correction are shown in Figure 11b, which also shows a reduction after correction. The reason for the above results is that the overall stress and strain level of the original stroke-based constitutive curve is reduced after correction, resulting in weakened hardening behavior.
The hardening performance of the metal during plastic deformation can be divided into five stages [24], where the stages could be identified using the σ · d σ d ε vs. σ curves (i.e., the blue dots in Figure 12) [25]. As can be seen, the σ · d σ d ε values firstly increase and subsequent decrease with the increase in stress level. No apparent fluctuation is seen in the decline region, indicating that there are no obvious stage IV and stage V exits in this material. Hence, it is believed that the plastic deformation remains in stage III.
The hardening stages could be identified from the plotted d σ d ε vs. σ curves in Figure 12. It can be seen that the hardening rates continuously decreases with increased flow stresses, due to the gradually saturated dislocation density. Figure 12a again compares the hardening rates before and after correction. The hardening rates of the corrected stress-strain curves are lower than those before correction, indicating an overestimation of the hardening behaviors using the traditional data processing method. Figure 12b,c gives the hardening rate curves under 800 °C (0.01/s, 0.1/s and 1/s) and 0.1/s (750 °C, 800 °C and 850 °C) after correction. As expected, a lower temperature and higher strain rate enhanced the hardening behavior and, hence, higher hardening rates. These generally accepted trends are still applicable to the hardening rate behaviors after correction.
It may be mentioned that the proposed correction method is based on the width measurement and transfers it to the length direction using the ‘Volume Consistency Principle’. This is a generally accepted way to process the data and obtain true stress-strain curves using Gleeble [15]. Furture work, which considers both the width and thickness changes and applied to the non-uniform temperature correction method, would be of value.

5. Conclusions

In this paper, a strain correction method is proposed and used to process the Gleeble hot tensile tests data, aiming to mitigate the temperature non-uniformity induced true stress-strain curve inaccuracies. Such method was validated using the hot flow behavior of titanium TA32 and the major conclusions are as bellow:
  • The proposed correction method, for the first time, successfully excludes the influence of temperature non-uniformity in Gleeble hot tensile tests for the whole deformation process. It considers the length variation of the uniform temperature zone and calculates the true strain values in the entire uniform deformation region.
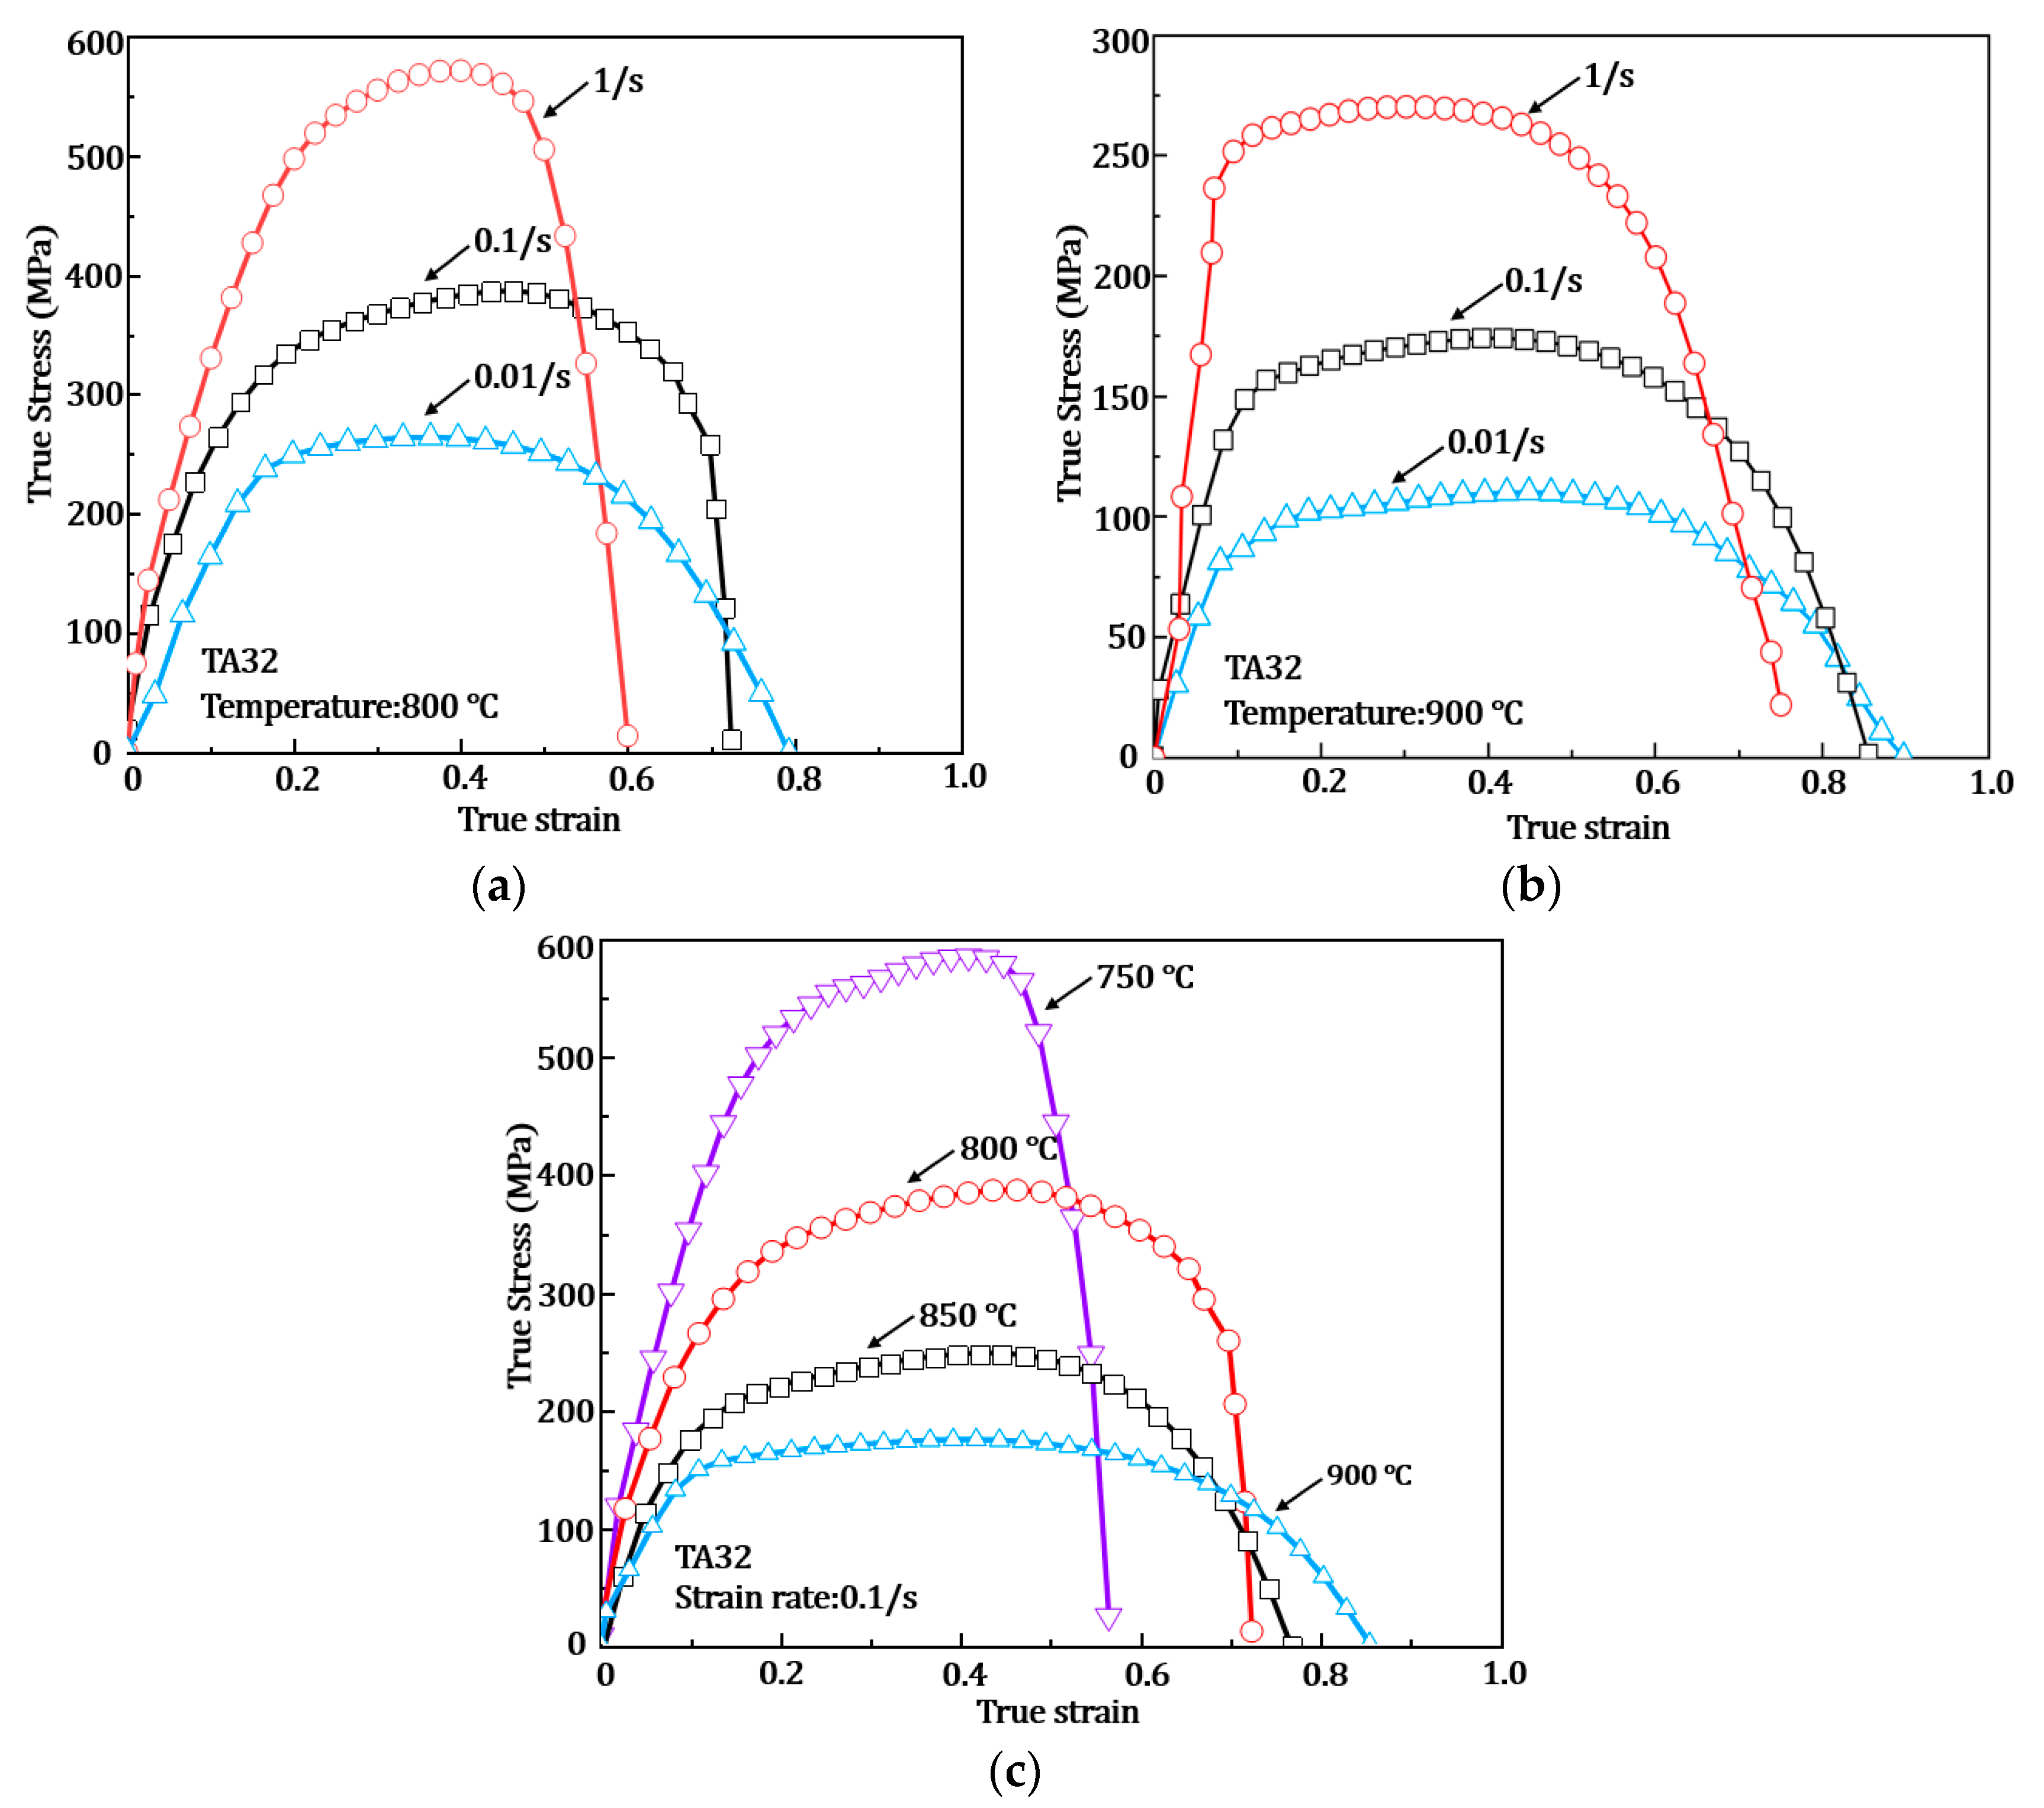
  • The flow behavior of TA32 titanium alloy at different temperatures (750 °C~900 °C) and strain rates (0.01/s~1/s) was successfully determined using this correction method and compared with the non-correct ones. Results showed that the conventional Gleeble data processing method may overestimate the true strain values and lead to a ~7% overestimation of the strain-to-failure level.
  • The hardening component, n, and hardening rate component, m, increases with higher strain rates and lower temperatures. A 5~8% overestimation was observed for the n value, 7~8% for the m value and 4~8% for the uniform strain, ε u , values.

Author Contributions

The research in this paper was performed as a collaboration between all the authors. S.Q., K.Z., Z.H. and J.Z. designed the project and research theme and provided scientific guides and discussions. S.Q. performed the hot tensile tests. S.Q., H.P. and K.Z. solved the correction process. S.Q., H.P., Z.H., K.Z. and J.Z. wrote the manuscript. All authors analyzed the correction results. All authors have read and agreed to the published version of the manuscript.

Funding

The funding is support from the the National Natural Science Foundation of China (Grant No. 52005076), the National Natural Science Foundation of China (Grant No. 52105359), the Fundamental Research Funds for the Central Universities under the Grant Agreement DUT20RC (3)012, Liaoning Revitalization Talents Program XLYC1802065, the College Talent Starting Funds for Nanjing University of Aeronautics and Astronautics (Grant No. 1006-YAH21099) and the National Defense Basic Scientific Research (Grant No.JCKY2020203C033).

Institutional Review Board Statement

Not applicable.

Informed Consent Statement

Informed consent was obtained from all subjects involved in the study.

Data Availability Statement

The raw/processed data required to reproduce these findings cannot be shared at this time, as the data also forms part of an ongoing study.

Conflicts of Interest

The authors declare no conflict of interest.

References

  1. Boyer, R.R. An Overview on the Use of Titanium in the Aerospace Industry. Mater. Sci. Eng. A 1996, 213, 103–114. [Google Scholar] [CrossRef]
  2. Fan, R.; Chen, M.; Wu, Y.; Xie, L. Prediction and Experiment of Fracture Behavior in Hot Press Forming of a TA32 Titanium Alloy Rolled Sheet. Metals 2018, 8, 985. [Google Scholar] [CrossRef] [Green Version]
  3. Chen, C.; Chen, M.; Xie, L.; Gong, Z.; Ye, J. Numerical and Experimental Investigations of the Hot Stamping Process for Complex Aircraft Skin Parts Composed of TA32 High-Temperature Titanium Alloy Using an Arrhenius-Type Constitutive Model. Int. J. Adv. Manuf. Technol. 2019, 103, 807–817. [Google Scholar] [CrossRef]
  4. Mosleh, A.O.; Kotov, A.D.; Mestre-Rinn, P.; Mikhaylovskaya, A.V. Superplastic Forming of Ti-4Al-3Mo-1V Alloy: Flow Behavior Modelling and Finite Element Simulation. Procedia Manuf. 2019, 37, 239–246. [Google Scholar] [CrossRef]
  5. Liu, Y.; Zhu, B.; Wang, Y.; Li, S.; Zhang, Y. Fast Solution Heat Treatment of High Strength Aluminum Alloy Sheets in Radiant Heating Furnace during Hot Stamping. Int. J. Lightweight Mater. Manuf. 2020, 3, 20–25. [Google Scholar] [CrossRef]
  6. Wu, Y.; Liu, G.; Wang, K.; Liu, Z.; Yuan, S. The Deformation and Microstructure of Ti-3Al-2.5V Tubular Component for Non-Uniform Temperature Hot Gas Forming. Int. J. Adv. Manuf. Technol. 2017, 88, 2143–2152. [Google Scholar] [CrossRef]
  7. Wu, Y.; Fan, R.-l.; Qin, Z.-h.; Chen, M.-h. Shape Controlling and Property Optimization of TA32 Titanium Alloy Thin-Walled Part Prepared by Hot Forming. Trans. Nonferrous Met. Soc. China 2021, 31, 2336–2357. [Google Scholar] [CrossRef]
  8. Ko, Y.G.; Shin, D.H.; Park, K.T.; Lee, C.S. An Analysis of the Strain Hardening Behavior of Ultra-Fine Grain Pure Titanium. Scr. Mater. 2006, 54, 1785–1789. [Google Scholar] [CrossRef]
  9. Pang, X.; Xiong, Z.; Yao, C.; Sun, J.; Misra, R.D.K.; Li, Z. Strength and Ductility Optimization of Laser Additive Manufactured Metastable β Titanium Alloy by Tuning α Phase by Post Heat Treatment. Mater. Sci. Eng. A 2022, 831, 142265. [Google Scholar] [CrossRef]
  10. Lin, J.; Dean, T.A. Modelling of Microstructure Evolution in Hot Forming Using Unified Constitutive Equations. J. Mater. Process. Technol. 2005, 167, 354–362. [Google Scholar] [CrossRef]
  11. He, D.; Zhu, J.C.; Lai, Z.H.; Liu, Y.; Yang, X.W. An Experimental Study of Deformation Mechanism and Microstructure Evolution during Hot Deformation of Ti-6Al-2Zr-1Mo-1V Alloy. Mater. Des. 2013, 46, 38–48. [Google Scholar] [CrossRef] [Green Version]
  12. Yu, D.J.; Xu, D.S.; Wang, H.; Zhao, Z.B.; Wei, G.Z.; Yang, R. Refining Constitutive Relation by Integration of Finite Element Simulations and Gleeble Experiments. J. Mater. Sci. Technol. 2019, 35, 1039–1043. [Google Scholar] [CrossRef]
  13. Bennett, C.J.; Leen, S.B.; Williams, E.J.; Shipway, P.H.; Hyde, T.H. A Critical Analysis of Plastic Flow Behaviour in Axisymmetric Isothermal and Gleeble Compression Testing. Comput. Mater. Sci. 2010, 50, 125–137. [Google Scholar] [CrossRef] [Green Version]
  14. Xiao, H.; Fan, X.G.; Zhan, M.; Liu, B.C.; Zhang, Z.Q. Flow Stress Correction for Hot Compression of Titanium Alloys Considering Temperature Gradient Induced Heterogeneous Deformation. J. Mater. Process. Technol. 2021, 288, 116868. [Google Scholar] [CrossRef]
  15. Li, N.; Sun, C.; Guo, N.; Mohamed, M.; Lin, J.; Matsumoto, T.; Liu, C. Experimental Investigation of Boron Steel at Hot Stamping Conditions. J. Mater. Process. Technol. 2016, 228, 2–10. [Google Scholar] [CrossRef] [Green Version]
  16. Kong, X. Characterisation of Advanced Aluminium Alloys for the HFQ® Technology. Ph.D. Thesis, Mechanical Engineering, The University of Nottingham, Nottingham, UK, 2016. [Google Scholar]
  17. Zheng, K.; Li, Y.; Yang, S.; Fu, K.; Zheng, J.; He, Z.; Yuan, S. Investigation and Modeling of the Preheating Effects on Precipitation and Hot Flow Behavior for Forming High Strength AA7075 at Elevated Temperatures. J. Manuf. Mater. Process. 2020, 4, 76. [Google Scholar] [CrossRef]
  18. El-Shenawy, E.H. Physical Simulation Technology for Thermo-Mechanical Processing of Metallic Alloys Using Gleeble System. Mater. Today Proc. 2019, 28, 998–1004. [Google Scholar] [CrossRef]
  19. Lee, R.S.; Lin, Y.K.; Chien, T.W. Experimental and Theoretical Studies on Formability of 22MnB5 at Elevated Temperatures by Gleeble Simulator. Procedia Eng. 2014, 81, 1682–1688. [Google Scholar] [CrossRef] [Green Version]
  20. Fields, D.S.; Backofen, W.A. Determination of Strain Hardening Characteristics by Torsion Testing. Proc. ASTM 1957, 57, 1259–1272. [Google Scholar]
  21. Jiang, J.; Britton, T.B.; Wilkinson, A.J. Evolution of Dislocation Density Distributions in Copper during Tensile Deformation. Acta Mater. 2013, 61, 1239–1263. [Google Scholar] [CrossRef]
  22. Lin, J.; Liu, Y. A Set of Unified Constitutive Equations for Modelling Microstructure Evolution in Hot Deformation. J. Mater. Process. Technol. 2003, 143, 281–285. [Google Scholar] [CrossRef]
  23. Hart, E.W. Theory of the Tensile Test. Acta Metall. 1967, 15, 351–355. [Google Scholar] [CrossRef]
  24. Zehetbauer, M.; Seumer, V. Cold Work Hardening in Stages IV and V of F.C.C. Metals-I. Experiments and Interpretation. Acta Metall. Mater. 1993, 41, 577–588. [Google Scholar] [CrossRef]
  25. Argon, A.S.; Haasen, P. A New Mechanism of Work Hardening in the Late Stages of Large Strain Plastic Flow in F.C.C. and Diamond Cubic Crystals. Acta Metall. Mater. 1993, 41, 3289–3306. [Google Scholar] [CrossRef]
Figure 1. Temperature distribution with Gleeble heating.
Metals 12 00042 g001
Figure 2. Specimen of Gleeble hot uniaxial tensile test (All dimensions are in mm).
Metals 12 00042 g002
Figure 3. Temperature profile of the uniaxial tensile tests.
Metals 12 00042 g003
Figure 4. Geometrical model of Gleeble tensile test: (a) Geometrical model; (b) Non-uniform angle variation model.
Metals 12 00042 g004
Figure 5. The calculation procedure of the correction model.
Metals 12 00042 g005
Figure 6. Verification of strain rates and temperatures using Gleeble tensile testing: (a) 800 °C; (b) 900 °C.
Metals 12 00042 g006
Figure 7. Prediction of angle equation.
Metals 12 00042 g007
Figure 8. Schematic illustration of the angle variation.
Metals 12 00042 g008
Figure 9. Experimental stress-strain curves with and without correction. The temperature is 800 °C, and the strain rate is 1/s.
Metals 12 00042 g009
Figure 10. True stress-strain curves of the TA32 at different temperatures and strain rates after correction: (a) 800 °C; (b) 900 °C; (c) 0.1/s.
Metals 12 00042 g010
Figure 11. Hardening component of corrected TA32: (a) strain hardening component, n; (b) uniform strain, εu, and strain rate hardening component, m.
Metals 12 00042 g011
Figure 12. Hardening performance: (a) comparison of corrected and non-corrected hardening rate; (b) the corrected hardening rate at 800 °C (0.01/s, 0.1/s and 1/s); (c) the corrected hardening rate at 0.1/s (750 °C, 800 °C and 900 °C).
Metals 12 00042 g012
Table 1. Main chemical composition of TA32.
AlSnZrMoNbTaSiTi
5.53.53.00.90.50.70.3Remain
Table 2. The determined angle equation parameters.
TemperatureParametersValues
800 °Ca13.002 × 10−5
a20.1311
c0
900 °Cb1−7.01
b2−1974
c0
Publisher’s Note: MDPI stays neutral with regard to jurisdictional claims in published maps and institutional affiliations.

