Article

Hydrometallurgical Recycling of Copper Anode Furnace Dust for a Complete Recovery of Metal Values

Faculty of Materials, Institute of Recycling Technologies, Metallurgy and Recycling, Technical University of Košice, Letná 9, 042 00 Kosice, Slovakia
*
Author to whom correspondence should be addressed.
Metals 2022, 12(1), 36; https://doi.org/10.3390/met12010036
Submission received: 1 December 2021 / Revised: 12 December 2021 / Accepted: 20 December 2021 / Published: 24 December 2021
(This article belongs to the Special Issue Recovery of Valuable Metals from Industrial By-Products)

Abstract

:
Copper anode furnace dust is waste by-product of secondary copper production containing zinc, lead, copper, tin, iron and many other elements. Hydrometallurgical Copper Anode Furnace dust recycling method was studied theoretically by thermodynamic calculations and the proposed method was verified experimentally on a laboratory scale. The optimum condition for leaching of zinc from dust was identified to be an ambient leaching temperature, a liquid/solid ratio of 10 and H2SO4 concentration of 1 mol/L. A maximum of 98.85% of zinc was leached under the optimum experimental conditions. In the leaching step, 99.7% of lead in the form of insoluble PbSO4 was separated from the other leached metals. Solution refining was done by combination of pH adjustment and zinc powder cementation. Tin was precipitated from solution by pH adjustment to 3. Iron was precipitated out of solution after pH adjustment to 4 with efficiency 98.54%. Copper was selectively cemented out of solution (99.96%) by zinc powder. Zinc was precipitated out of solution by addition of Na2CO3 with efficiency of 97.31%. ZnO as final product was obtained by calcination of zinc carbonates.

1. Introduction

Copper is the third most widely used metal and total global smelter production was approximately 24.5 million metric tons in the year 2020 [1,2,3]. Due to its wide use and unique properties, production is not expected to decrease in the future. High demand for copper increases the extraction of primary raw materials, which affects many environmental aspects [4]. The extraction of raw materials of this widely used metal can be reduced by introducing a circular economy, i.e., by recycling secondary raw materials containing copper and reintroducing them back into the economy. Copper recycling requires up to 85% less energy than primary production [5]. Around the world, it saves 100 million MWh of electrical energy and 40 million metric tons of CO2 annually [6,7,8]. End of Life Recycling Input Rate for copper in the EU is currently only 17%, which create space for further recycling capacity increase [9]. The production of copper from secondary sources is different from the production from primary sources. The whole recycling process consists of several operations, the most important being:
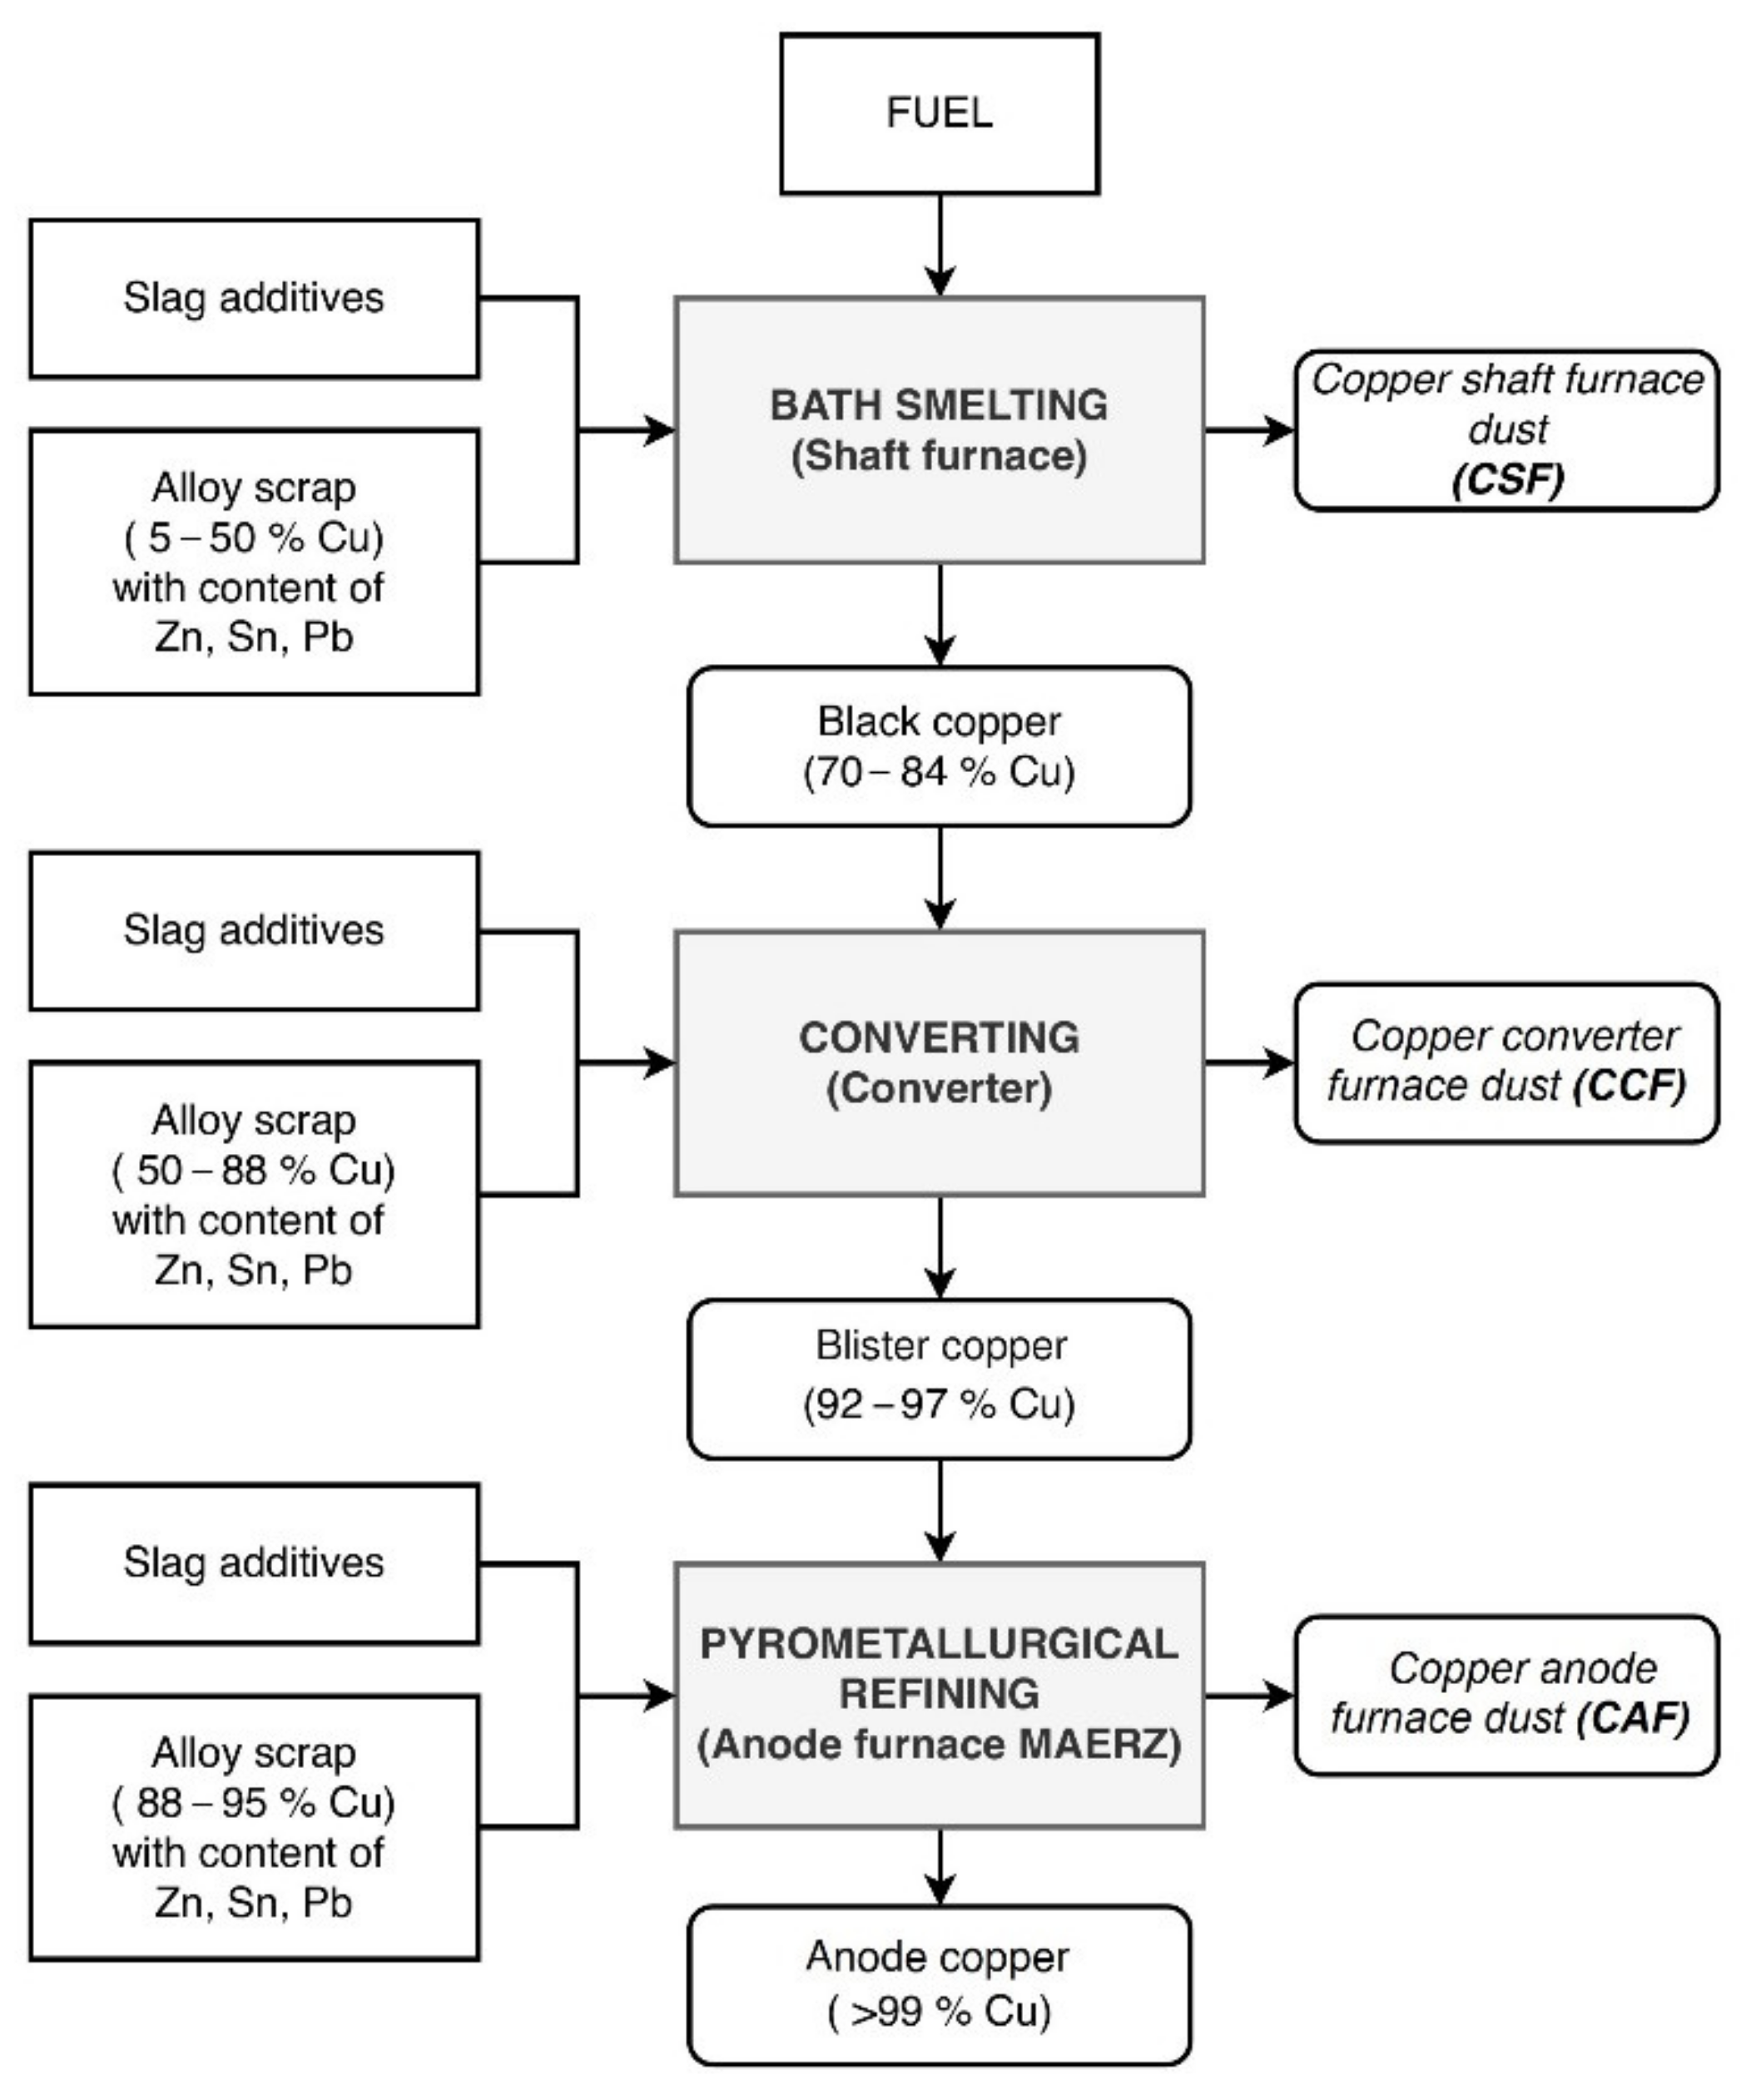
  • The reduction of Cu, Sn and Pb oxides and separation of these components from the rest of the batch, with most of the batch composed of Cu in metallic form;
  • Zn separated into the off-gases and captured in the oxidized form in the filtration station;
  • Transfer of unwanted components into slag;
  • Converting of black copper and removal of Ni, Sn and Sb;
  • Pyrometallurgical refining;
  • Electrolytical refining [10];
Various chemical elements enter the process of recycling from secondary raw materials, which are later separated from copper in refining processing steps. This leads to the production of large amounts of waste with different chemical compositions. The most common waste are slags, which are the subject of many research papers, but in addition, dust (shown in Figure 1) is also generated.
The chemical composition of the dusts differs from the type of furnace in which they are produced. Dusts contain from 1.37 to 27% Cu, from 3.6 to 40.2% Zn, from 1.5 to 22.4% Pb and they can also contain smaller contents of elements such as Fe, Sn, Ca, As, Si and Ni [10,11,12,13,14,15,16,17,18,19,20,21,22,23,24]. The phase composition analysis of the dusts confirms the presence of oxides, chlorides, sulfates and sulfides of these elements.
The recycling of copper dust takes place both pyrometallurgically and hydrometallurgically. Common practice has been to recycle these dusts to the smelter to recover the copper content. The recycling of dust decreases furnace capacity, which reduces productivity. Hydrometallurgical processing consists of leaching of the dusts, refining of leach solutions and products’ recovery from leach solutions [25,26,27].
The leaching of the dust takes place in acidic (commonly in H2SO4 and HCl) and alkaline solutions (commonly in NaOH, but others, such as NH4CO3, are studied as well) [28]. The leaching efficiency in H2SO4 varies from 80 to 100% for copper and from 85 to 95% for zinc [14,17,18,21,22,29]. The leaching efficiency in HCl varies from 73 to 95% for copper and up to 95% for zinc [24,29,30]. In one case, a high zinc leaching efficiency in NaOH of 87% was achieved [11], but in other cases it was significantly less (4–11% Cu and 11–52% Zn) [18]. The comparison shows that the leaching efficiency depends on the chemical and phase composition of the dusts used, on the type of leaching medium, the temperature and the redox conditions during the leaching.
The operations followed by leaching are different and not all of the studied scientific articles also study conditions of the leach solutions refining and recovery of products from leach solutions. Li Qiang et al. studied the leaching of dusts in 5M NaOH and subsequent electrolysis with a current density of 100–250 A.m−2, by which they obtained Pb and in the second step they increased the current density to 1500–1200 A.m−2 to obtain Zn [11]. Another method consists of dust leaching in the mixture of (NH4)2CO3-NH4OH, leach solution refining by zinc powder cementation and from the pH adjustment to obtain Zn(NH3)2CO3·ZnO at pH 7. The precipitate was further roasted at 400 °C to obtain 99% pure ZnO [12]. T. Mukongo et al. investigated the leaching of zinc-containing dusts in spent electroplating zinc electrolyte for further reuse in electroplating [13]. Laubertová et al. studied lead cementation from more environmentally friendly acetate dust leach solution. The proposed method achieved almost 90% lead removal efficiency [31].
Of the articles studied, only a small amount cover the recovery of products and an even smaller amount include the selective recovery of by-products. In this study, copper anode furnace (CAF) dust was analyzed, thermodynamic study was conducted to simulate leaching, solution refining and product recovery from the dust and small-scale lab batch-type experiments were conducted to verify the thermodynamic calculations.

2. Materials and Methods

2.1. Used Materials

Copper Anode Furnace (CAF) dust samples used for the following experiments are waste material from pyrometallurgical secondary production of copper (Figure 1) supplied by Slovakian copperworks. Samples were collected during a ten-day period from the smelting operations. The as-received samples were re-weighed and subjected to coning, quartering and dividing sample preparation methods to obtain representative samples [32,33].

2.2. Material Characterization

Particle size analysis was performed using the laser diffraction method on a Malvern Mastersizer 2000E (Malvern Instruments, UK, precision: ±1%) with a Scirocco2000M dry sample feeder. The density of each sample was determined using a Micromeritics AccuPyc II 1340 gas pycnometer (Micromeritics Instrument Corporation, USA, accuracy: ±0.02% of nominal cell volume).
The chemical composition of the input samples, intermediates, solid residues and leaching solutions was determined using classical wet analysis using atomic absorption spectrometry (AAS) on a Varian Spectrophotometer SpectrAA20+ (Varian, detection limit: 0.3–6 ppb).
The phases present in the dust, intermediates and recycled products were identified by X-ray diffraction phase analysis (XRD). The samples were prepared according to the standardized Panalytical backloading system, which provides nearly random distribution of the particles. The samples were analyzed using a Philips X’Pert PRO MRD (Co-Kα) diffractometer (Philips, Netherlands) and identified using X’Per HighScore plus software.
Samples were subjected to morphology observation by optical microscopy using a Dino-Lite ProAM413T digital microscope (AnMo Electronics Corporation, Taiwan). Each sample was subjected to scanning electron microscopy (SEM) analysis along with energy dispersive spectrometry (EDS). The morphology and microstructure of the samples were studied using a MIRA3 FE-SEM (TESCAN, USA, resolution: 1.2 nm at 30 kV; 2.3 nm at 3 kV) scanning electron microscope (REM). This equipment also enabled multi-elemental semi- quantitative analysis also using EDS.

2.3. Methodology

The leaching experiments were carried out in an 800 mL glass reactor placed in a thermostatically controlled water bath. The experiments were performed at temperatures of 20, 60 and 80 °C using constant 300 rpm stirring speed. The aqueous solution of sulfuric acid at concentrations of 0.5M and 1M was used as leaching reagents. The pH of the solutions was measured using pH-meter (Inolab, WTW 3710, Germany). The volume of the leaching reagent was 400 mL. Ten grams of dust samples obtained by manual quartering were used for the first set of experiments, which represents the liquid to solid ratio L:S = 40. Subsequently, experiments were performed with an adjusted L:S ratio, where 20, 40 and 80 g of dust samples were used while maintaining a constant volume (400 mL) of sulfuric acid. The total duration of the experiment was 60 min with sampling time after 5, 10, 15, 30 and 60 min. The volume of liquid sample for AAS analysis was 10 mL and leaching efficiency was calculated with respect of volume change caused by sampling and evaporation of solution at higher temperatures.
Two step solution refining process consisted of removal of Fe and Sn ions from the solution by precipitation and of zinc powder cementation. Precipitation of Fe and Sn was achieved by pH adjustment with the addition of 4M NaOH to pH of 4. Cementation experiments were performed with the use of 1.5 and 3 g of Zn powder per 400 mL of leachate, at two different temperatures (20 and 80 °C) with the sampling time after 5, 10, 15, 30 and 60 min.
Zinc precipitation was performed by conversion of soluble zinc sulfates to less soluble zinc carbonates by the addition of sodium carbonate and ammonium carbonate.

3. Results and Discussion

3.1. Material Characterization

Physical–chemical characterization included particle size distribution, chemical analysis and phase analysis.
The laser diffraction method of measuring the particle size distribution showed that the grain size in the sample ranges from 0.224 µm to 632.456 µm, with the largest proportion of particles ranging in size from 2 µm to 10 µm (Figure 2).
The content of mayor and trace elements in the CAF dust sample is show in Table 1. The sample contains 28.35% Zn, 10.28% Pb and 7.51% Cu as mayor metal elements. It also contains 1.5% Sn, 0.67% Fe and 0.22% Ca. Si, As and Ni were also detected by AAS method, but their content was under 0.1% and therefore they are not further studied in followed experiments.
XRD analysis of the dust is shown in Figure 3. The analysis shows that majority of zinc is present as ZnO and Zn2SnO4, tin is present as SnO2, SnCl2 and Zn2SnO4 and lead is present as PbCl2. The copper phase is not clearly determined from the peaks of the diffractogram despite its high content in the sample. Copper phases with highest match were Cu2Cl(OH)3 and Cu46Cl24(OH)68.4H2O. Elements with content below 1% are under the detection limit of XRD method and therefore their phase composition is unknown.
SEM-EDX semiquantitative analysis (Figure 4) identified 15.5% content of O and 15.1% of Cl, which confirms presence of oxide phases and chloride phases in the sample.

3.2. Leaching

3.2.1. Thermodynamic Analysis

The first step of hydrometallurgical treatment was leaching. Thermodynamic analysis studied the leaching of individual CAF dust phases in H2SO4 and reactions are expressed by Equations (1)–(5).
ZnO(s) + H2SO4(aq) = ZnSO4(aq) + H2O(l)
SnO2(s) + 2 H2SO4(aq) = Sn(SO4)2(aq) + 2 H2O(l)
SnCl4(s) + 2 H2SO4(aq) = Sn(SO4)2(aq) + 4 HCl(aq)
PbCl2(s) + H2SO4(aq) = PbSO4(s) + 2 HCl(aq)
CuCl2(s) + H2SO4(aq) = CuSO4(aq) + 2HCl(aq)
Table 2 shows negative values of the standard Gibbs energies change (ΔG°), which indicate that these reactions (Equations (1)–(5)) take place in the direction of product formation and should be spontaneous at temperatures from 0 to 100 °C. In Equation (4), a non-soluble compound PbSO4 (KSP PbSO4 = 1.6 × 10⁻⁶) is formed, which indicates that the separation of the lead from other well-soluble elements should be possible by leaching and filtration. Products of tin, copper and lead chloride leaching in sulfuric acid (Equations (3)–(5)) are sulphates of these elements and hydrochloric acid. Hydrochloric acid further reacts with the zinc oxide present in the dust (Equation (6)) but does not react with tin dioxide (Equation (7)) according to ΔG° values shown in Table 2.
ZnO(s) + 2HCl(aq) = ZnCl2(aq) + H2O(l)
SnO2(s) + 4HCl(aq) = SnCl4(aq) + 2H2O(l)

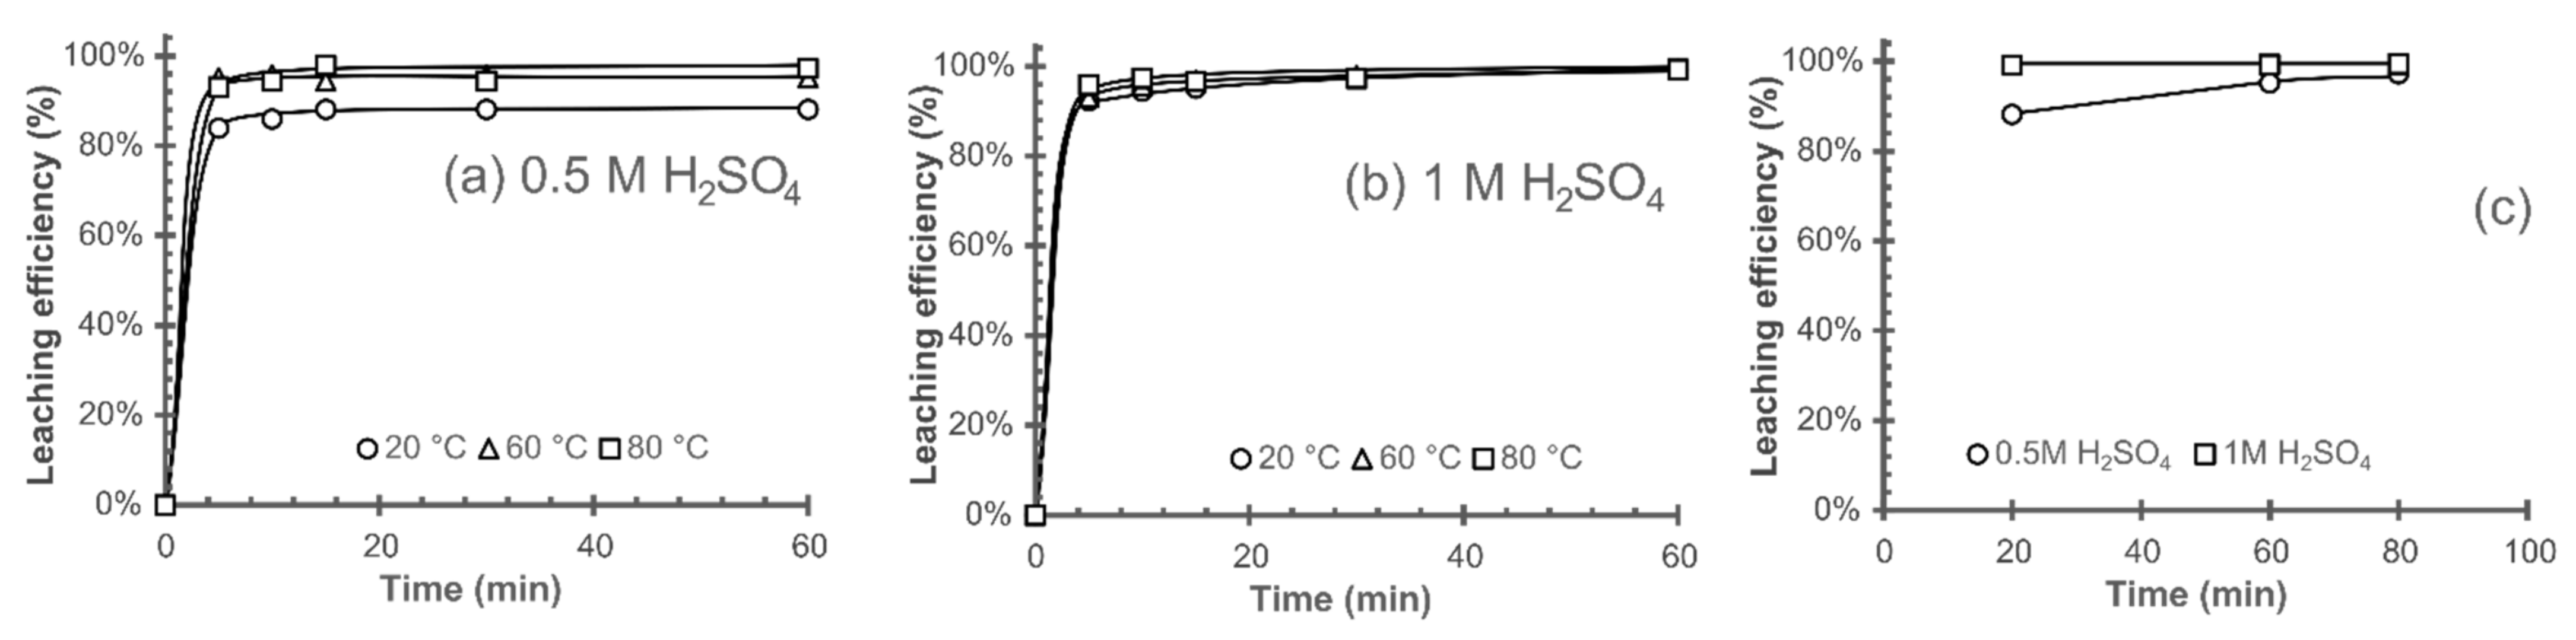
3.2.2. Effect of Temperature on the Leaching Efficiency

The zinc leaching and the effect of temperature on leaching efficiency was studied experimentally. Ten grams of CAF dust were leached in 400 mL of 0.5M (Figure 5a) and 1M (Figure 5b) solution of H2SO4 at 20, 60 and 80 °C. Zinc phases present in the dust were leached to the solution according to the thermodynamic study at relative high speed. The increase in leaching efficiency and its effect of temperature were observed in 0.5M solution (Figure 5c), where the efficiency increased from 89% at 20 °C to 97% at 80 °C. By leaching in 1M, a high leaching efficiency (99.18%) could be achieved at an ambient temperature. According to the thermodynamic study, Cu, Fe and Sn were also leached, while Pb was not, which corresponds to the chemical composition of the solution after leaching shown in Table 3. The leaching residue was filtered and analyzed by SEM-EDX (Figure 6) and XRD (Figure 7), both of which confirmed the presence of a PbSO4 phase.

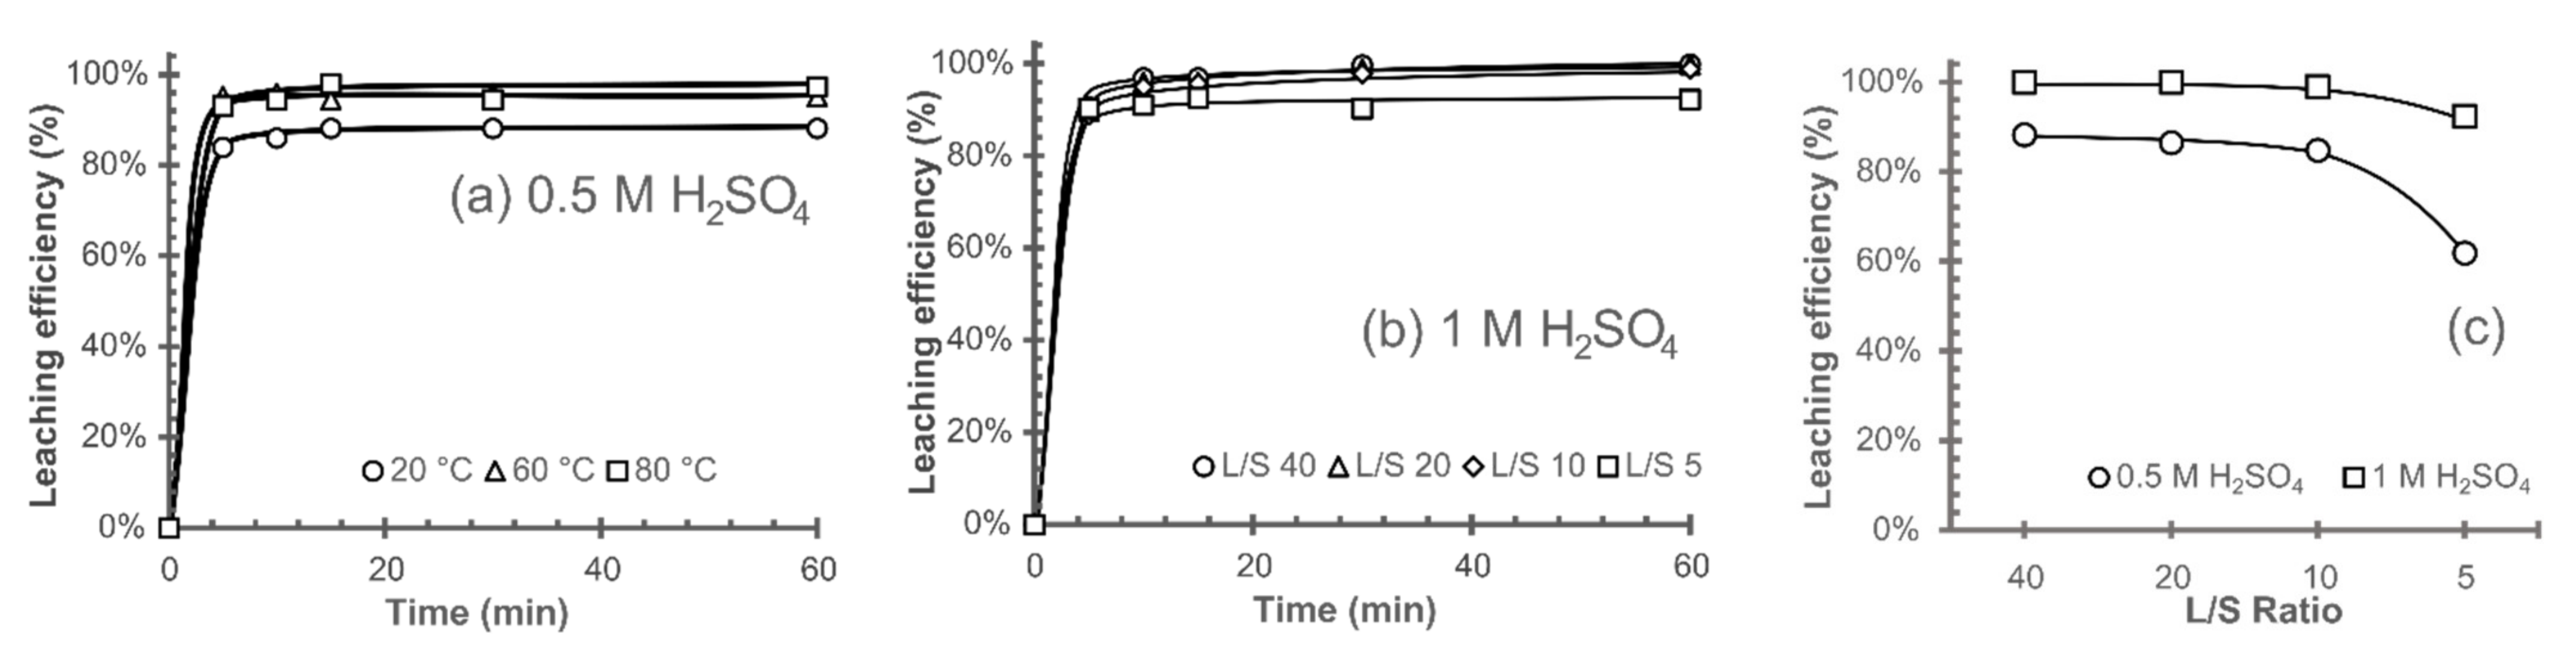
3.2.3. Effect of Liquid–Solid Ratio on the Leaching Efficiency

Previous leaching experiments have confirmed the high leaching efficiencies of zinc at the liquid–solid ratio of 40 and only a slight effect of acid concentration and temperature increase. In the following experiments, the L/S ratio is reduced to increase the zinc concentration in the solution. Figure 8 shows zinc leaching efficiency in 0.5 M H2SO4 (Figure 8a) and 1M H2SO4 (Figure 8b) at 20 °C and L/S ratio 40, 20, 10 and 5. The results confirmed that zinc leaching efficiency did not decrease significantly at L/S interval from 40 to 10. Further decrease in the L/S ratio to 5 led to a slight leaching efficiency decrease when 1 M H2SO4 solution was used and a significant leaching efficiency decrease to 60% occurs when 0.5M H2SO4 was used.
The conditions under which both a high concentration of zinc in the solution and high zinc leaching efficiency were achieved was determined as the L/S ratio of 10 in 1 M H2SO4 at ambient temperature. The chemical composition of the obtained solution ready for next steps of refining and Zn precipitation is shown in Table 4.

3.3. Solution Refining

The refining of the leachate obtained by CAF dust leaching (Table 4) was firstly studied theoretically and results were subsequently verified experimentally. The aim of solution refining was to remove impurities, such as copper, tin, iron and lead, which affects a purity of products obtained in the subsequent zinc precipitation step. A combination of precipitation and cementation has been proposed as suitable refining methods for this specific solution.

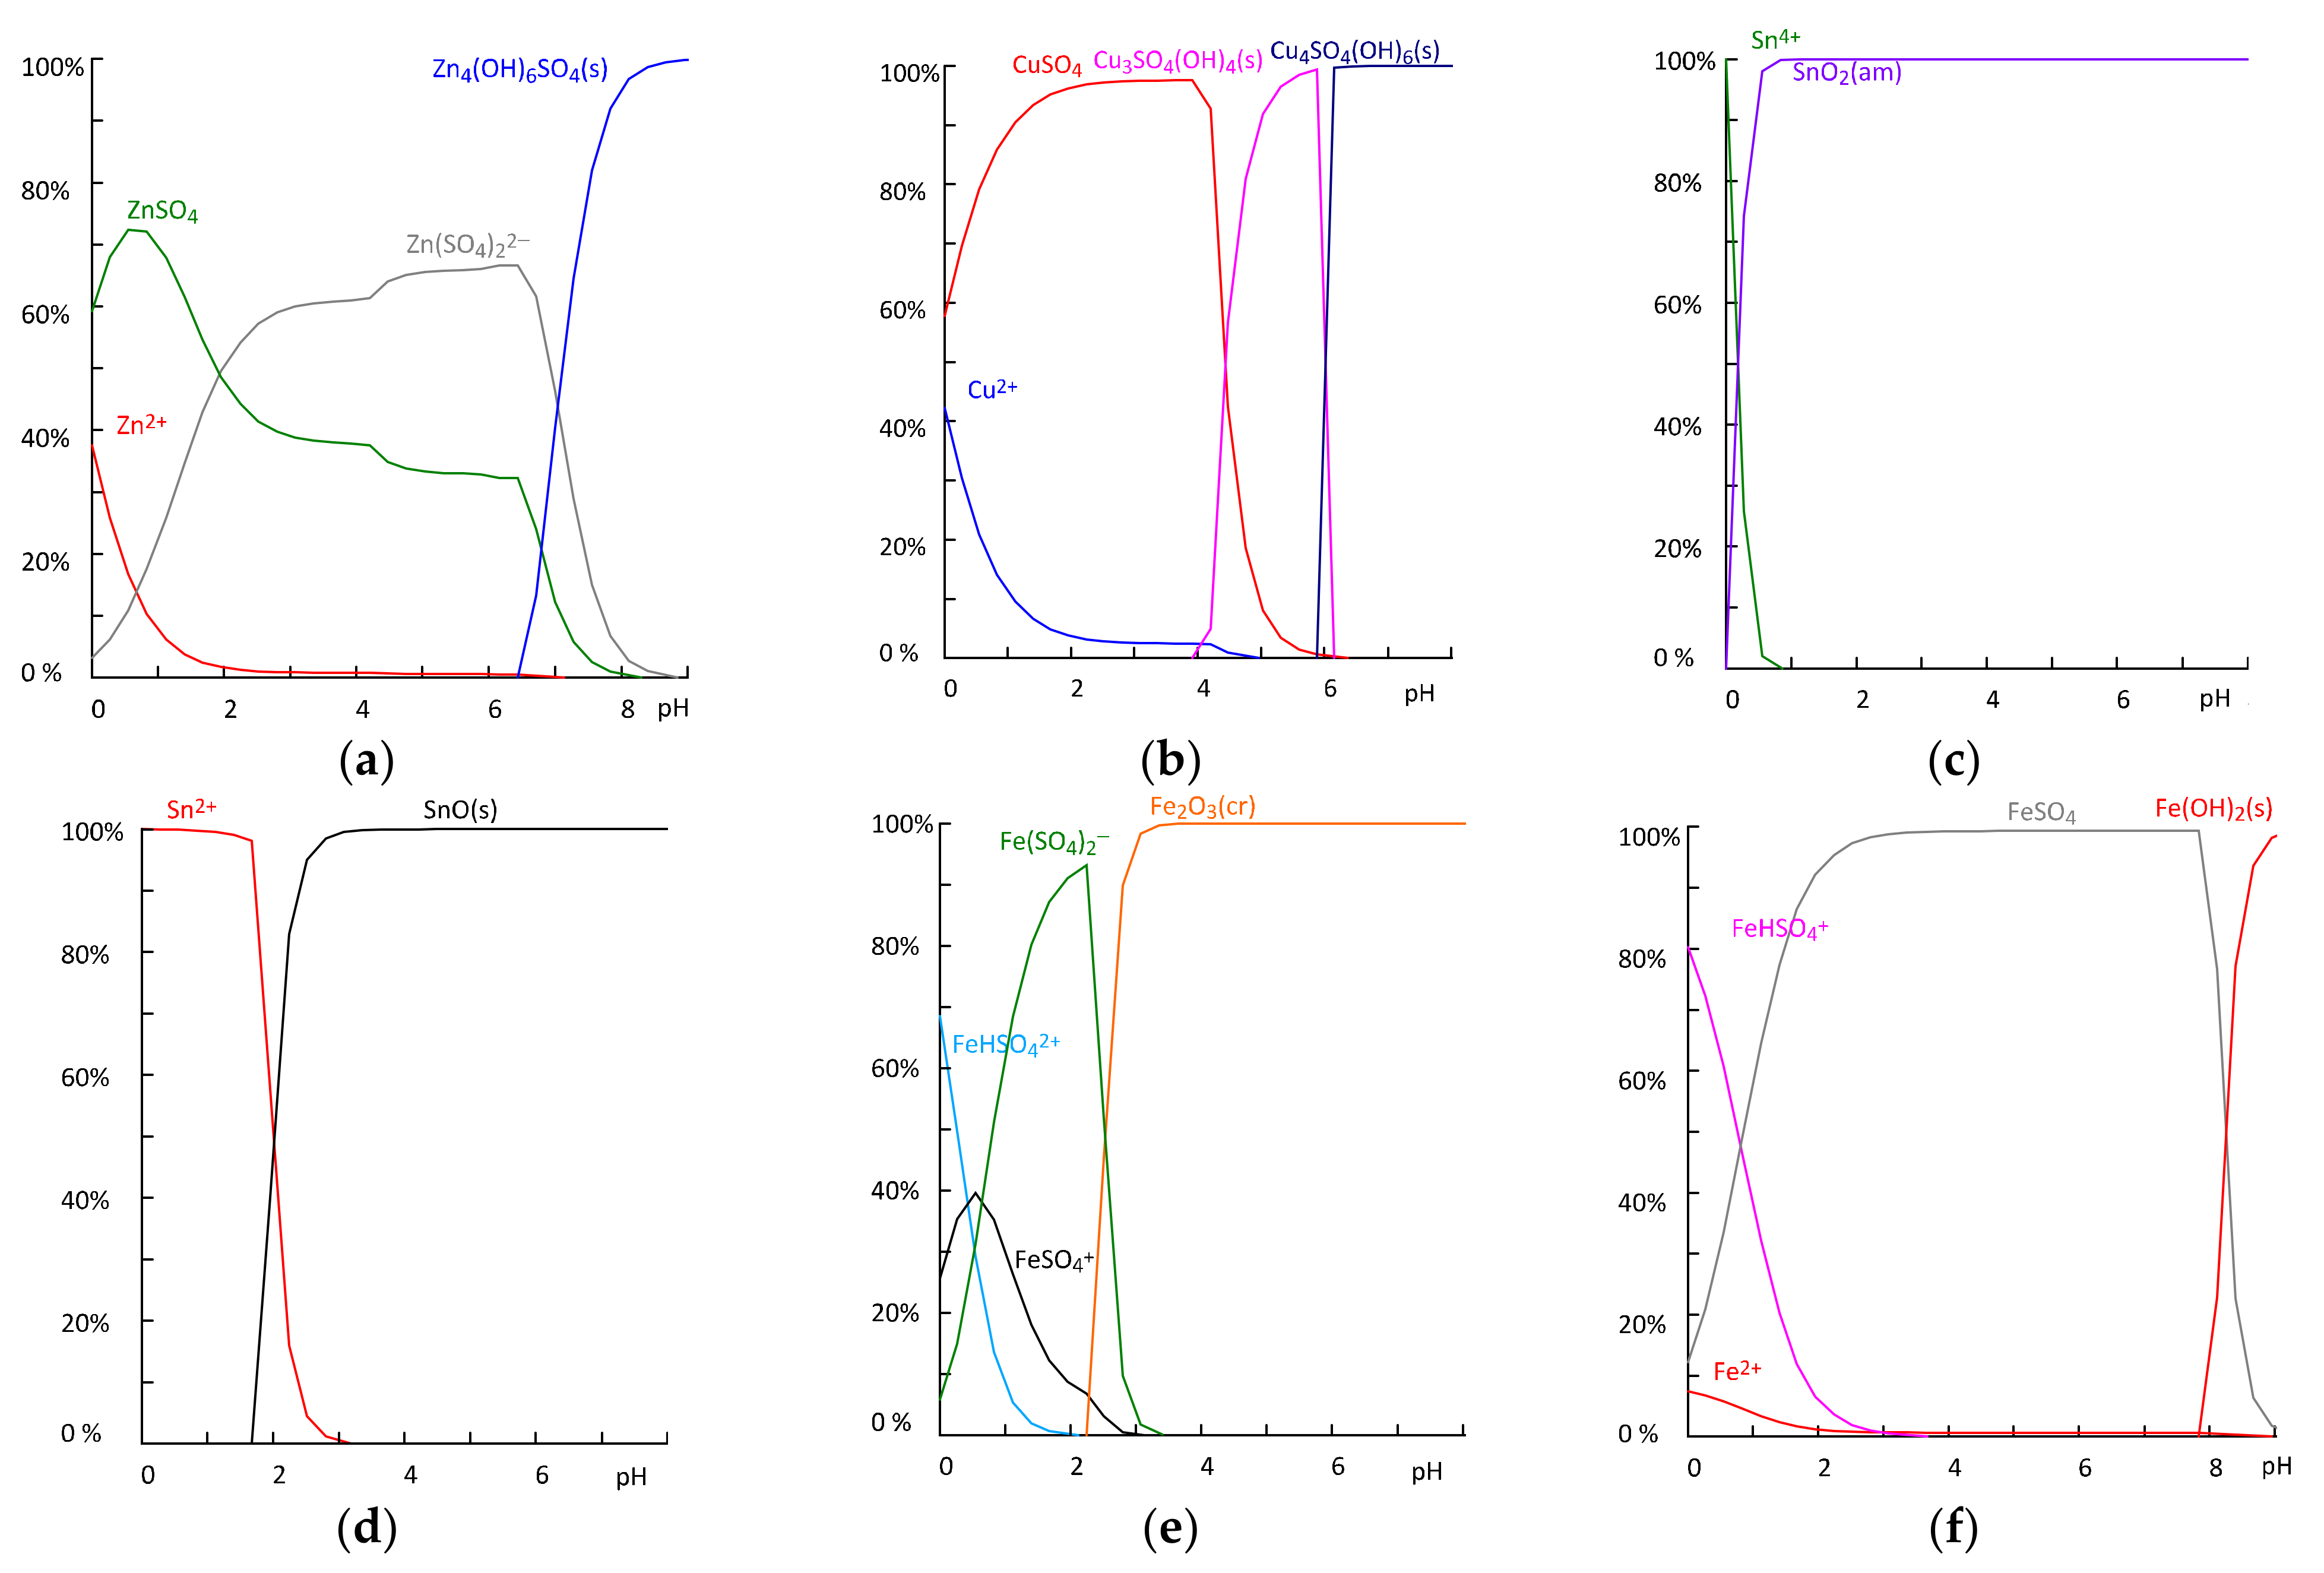
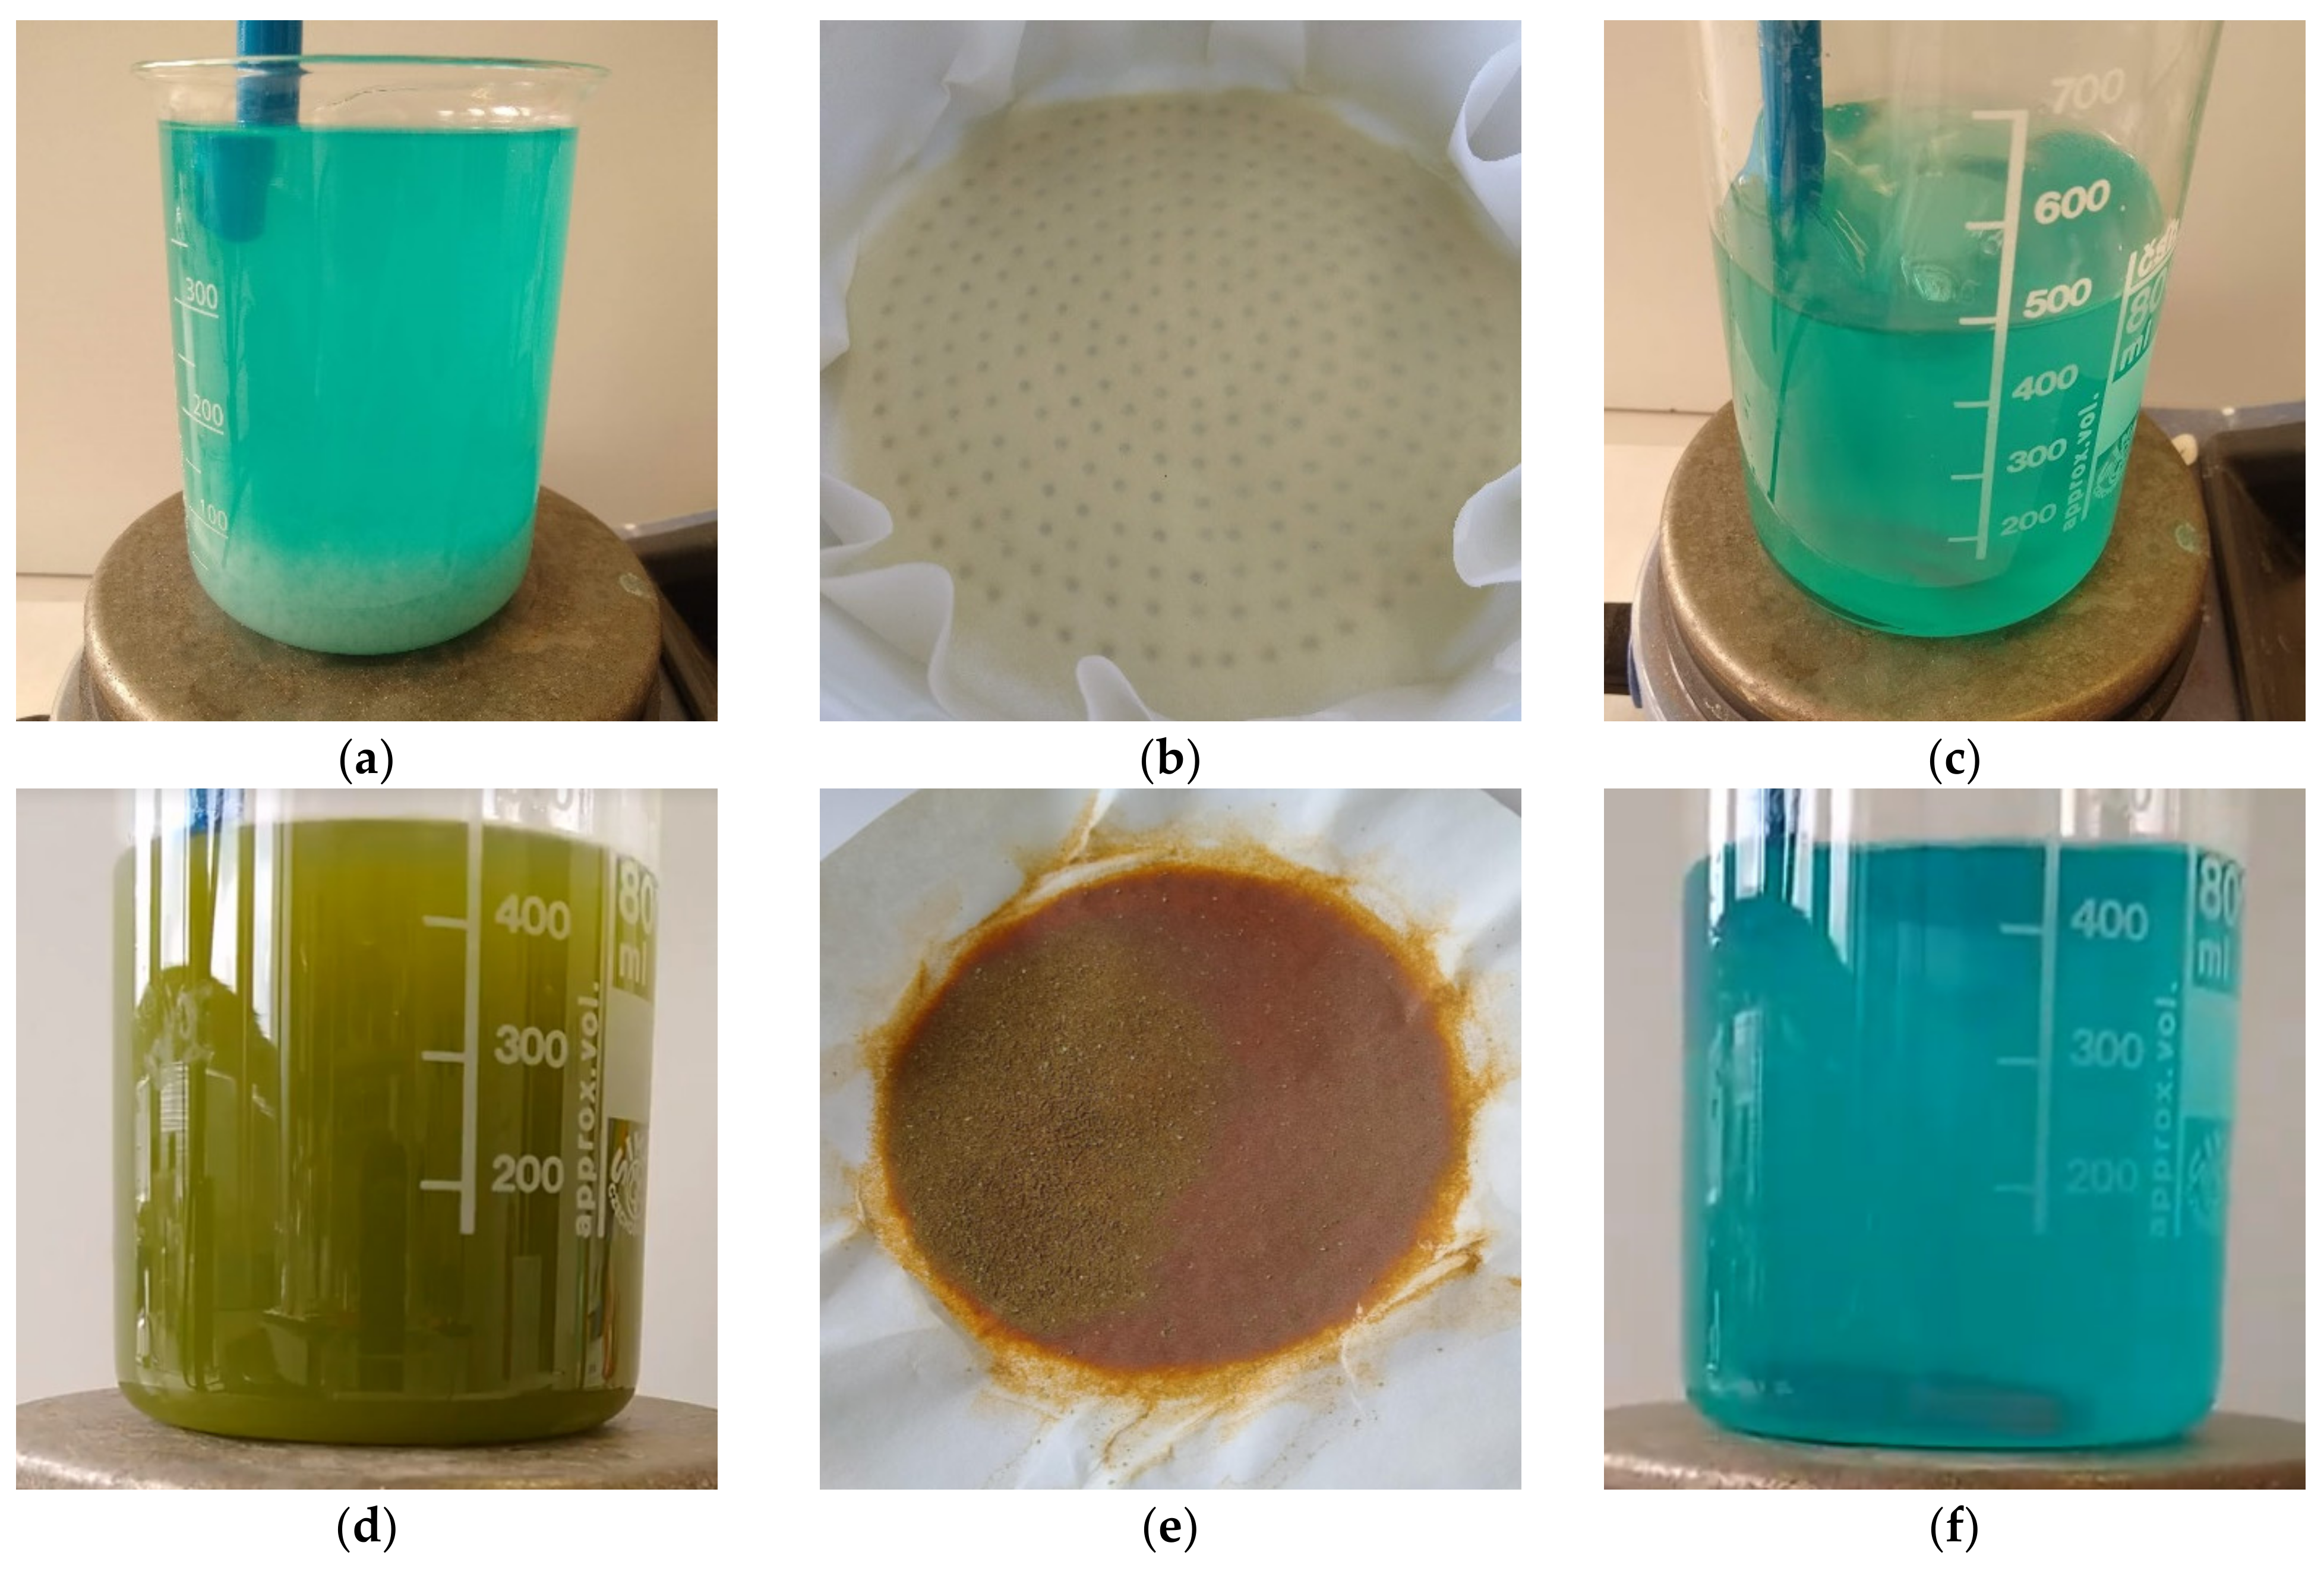
3.3.1. Adjustment of pH and Precipitation
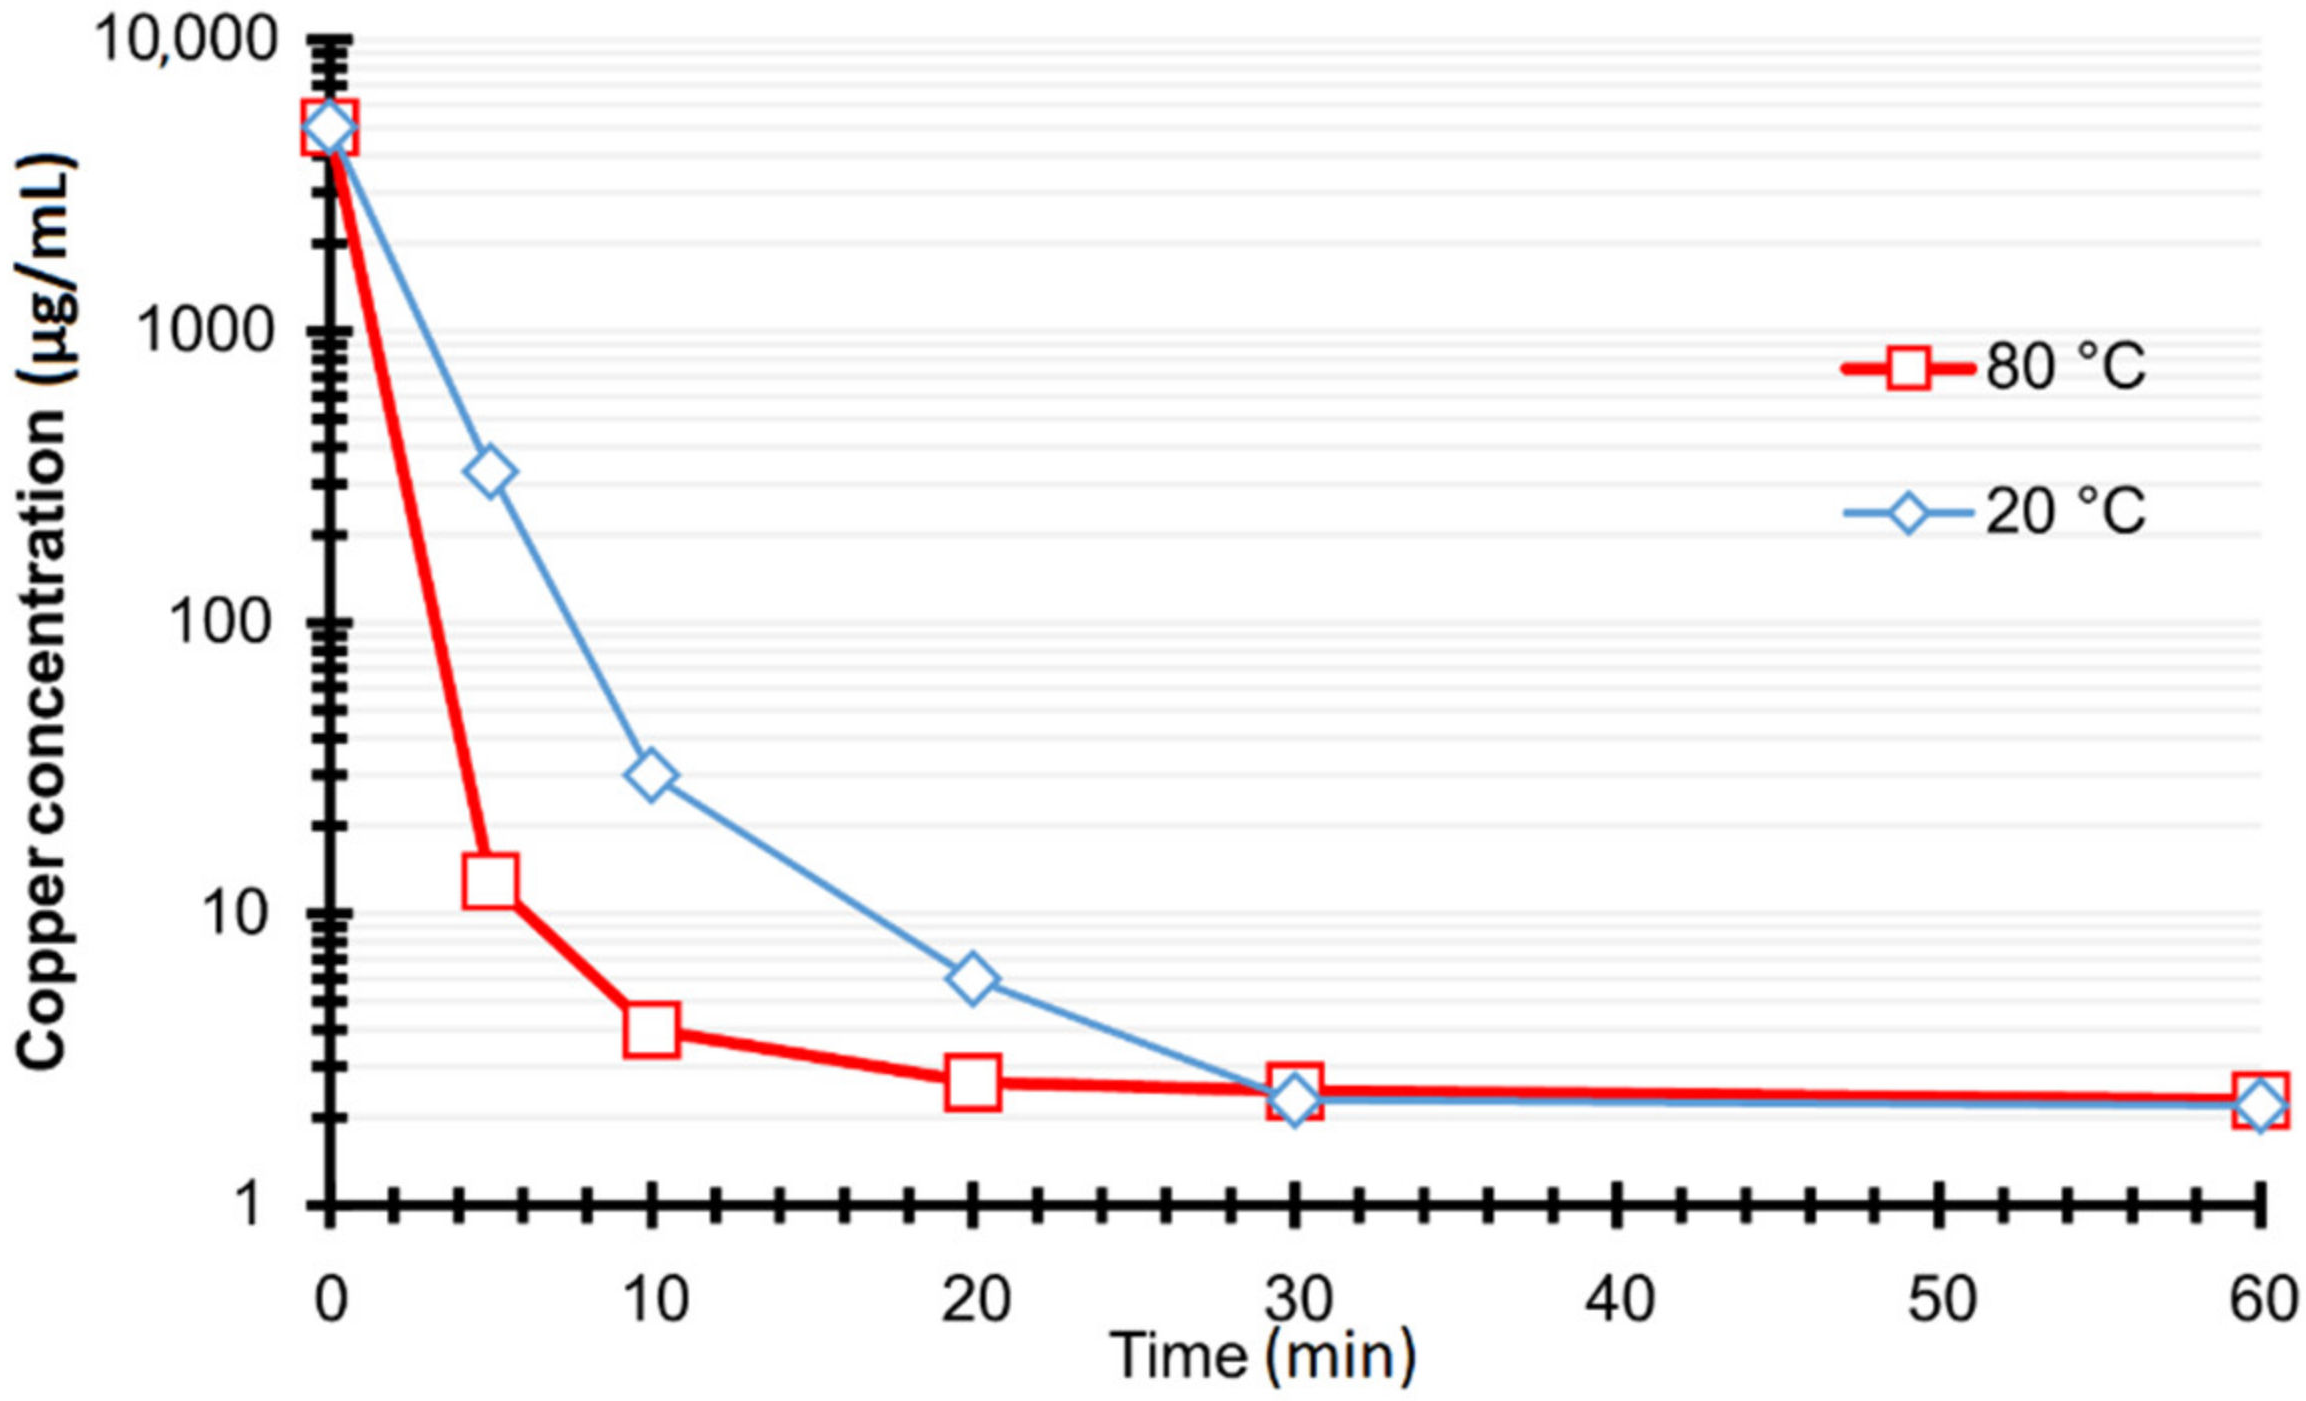
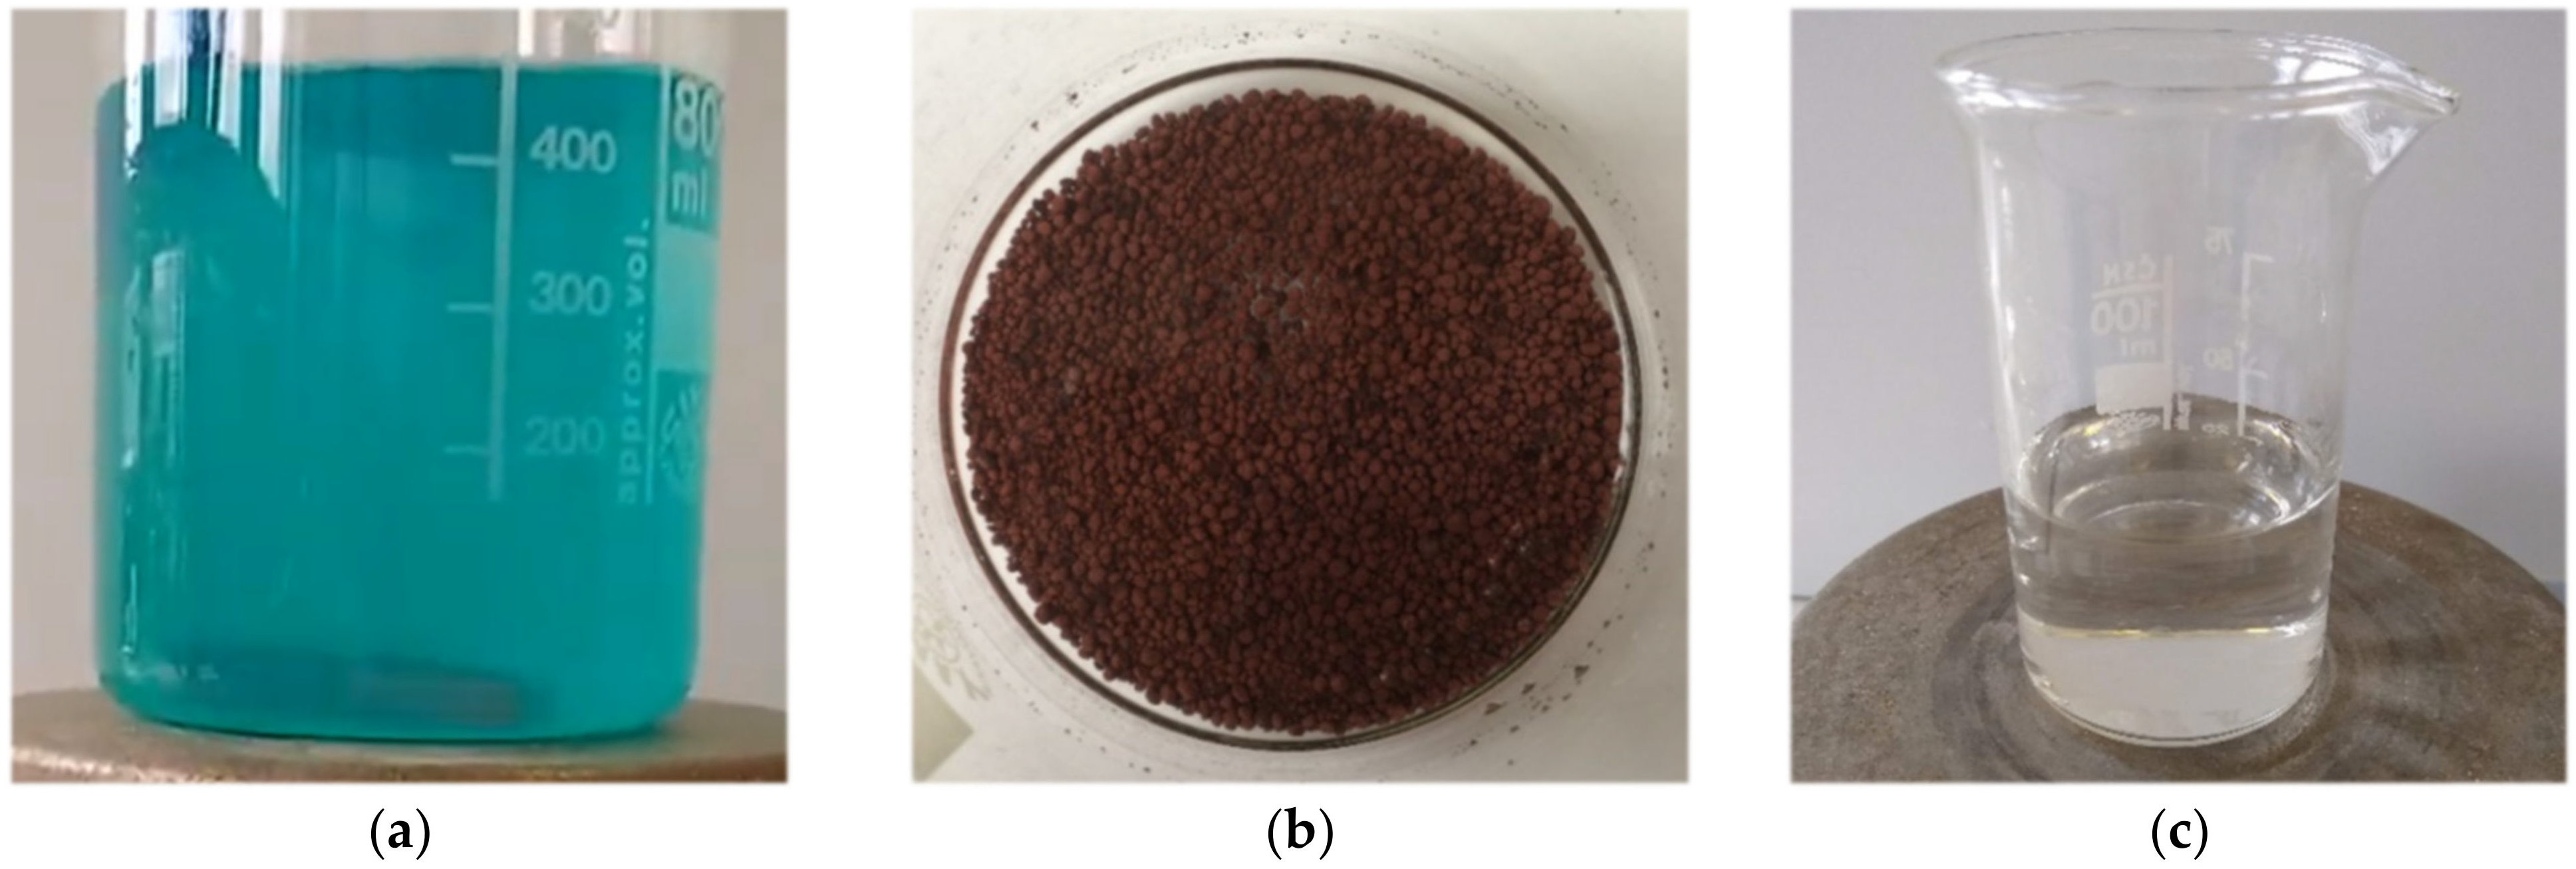
Precipitation can be defined as a process where metal ions react with other compounds to form a low solubility product. Metal hydroxide precipitation is the most common example of this process [34,35]. Figure 9 shows fraction diagrams for zinc, tin, iron and copper respectively. The concentrations of the individual elements were calculated from previous leach solution obtained by leaching at L/S ratio of 10. The measured pH of the solution for refining is 0.33.
The fraction diagram for zinc (Figure 9a) shows presence of Zn2+ ions, Zn(SO4)2−2 complex and as a well-soluble ZnSO4 at pH range from 0.33 to 6.5. Further increase of pH to values above 6.5 leads to precipitation of Zn4(OH)6SO4 and therefore solution refining is possible only at this pH range. According to following diagram (Figure 9b), copper ions start to precipitate out at pH 4 as Cu3SO4(OH)4. The tin precipitates from solution depending on the oxidation number from pH 0 to 1 for Sn4+ ions (Figure 9c) and from 2.5 to 4 for Sn2+ ions (Figure 9d). Phase analysis and leaching thermodynamics predict the presence of Sn4+ ions, but they can act as oxidizing reagents and be reduced to Sn2+. Iron ion precipitation depends on the oxidation state as well. Fe3+ precipitate out from solution at pH range from 2.2 to 3.2 (Figure 9e), but Fe2+ ions cannot be removed by precipitation before zinc, because pH range of precipitation is from 7.8 to 9 (Figure 9f). Therefore, the combination of precipitation and cementation must be used for recovery of high purity zinc products.
Solution of 4M NaOH was added slowly to 200 mL of leachate, while pH was continuously measured. The addition of NaOH caused dilution of leachate and therefore the impurity removal efficiency was calculated based on from Equation (8):
I n p u r i t y   r e m o v a l   e f f i c i e n c y = 1 V 1 · c 1 V 0 · c 0
where V0 and V1 are volumes before and after pH adjustment and c0 and c1 are concentrations of individual elements before and after pH adjustment. The pH was adjusted in two steps to pH 3 and 4, between which the solution was filtered and the solid residues and solutions obtained were analyzed. Solutions and filtered solid residues from pH adjustment are shown in Figure 10 and results from AAS analysis are shown in Table 5. Tin concentration was under the level of detection (LOD) already at pH 3, indicating that the tin was quantitatively removed from the solution according to the theory of fraction diagrams (Figure 9). In addition to tin, 15.79% of iron was precipitated at this pH too and remaining 82.75% of iron was precipitated out of the solution after a pH increase from 3 to 4 with a total 98.54% precipitation efficiency. Zinc losses were 0.27% at pH 3 and 0.33% at pH 4, which confirm good selectivity of the refining step.

3.3.2. Cementation

Cementation, an electrochemical deposition of noble metal ions by a less noble metal as an electron donor, is usually applied to remove/recover metal ions from dilute aqueous solutions [36,37,38,39]. In addition to zinc and copper, a small amount of other impurities were present in the solution after previous refining steps. Table 6 shows redox potentials (E°) of elements present in the CAF dust. Specific E° values confirm the possibility to replace Fe2+, Ni2+, Sn2+, Pb2+ and Cu2+ ions from solutions with metallic zinc according to Equation (9).
mN0 + nMm+ → mNn+ + nM0
where N represent zinc and M are dissolved ions.
In the preliminary cementation experiment, 400 mL of the refined solution with pH 4 was cemented by 6 g of zinc powder at temperature of 20 and 80 °C for the duration of 60 min. The copper concentration change over time is showed in Figure 11.
The results confirmed the effect of temperature on the rate of cementation in the first minutes of experiment, but the efficiency of cementation was the same for both temperature after 30 min. Copper concentration decreased from 5038 to 2.22 mg/L (99.96%) at 20 °C, while zinc concentration was increased from 15,478 to 21,021 mg/L. The copper deposited on the surface of zinc powder (Figure 12b) and transparent solution (Figure 12c) was clearly visible after experiments. Followed method further reduced lead concentration in the solution according to study of Laubertová et al. [31]. Concentration of elements in input and output solution after cementation step is shown in Table 7.

3.4. Zinc Recovery

The recovery of zinc from the zinc sulfate solution is the last step in the CAF dust treatment. Zinc can be recovered in several ways, including crystallization, electrolysis, hydrolysis and precipitation. According to fraction diagram (Figure 9a) it is possible to obtain zinc in the form of Zn4(OH)6SO4(s) by further addition of hydroxide, but presence of sulfur can reduce a purity of obtained products and therefore, zinc carbonate precipitation followed by calcination is studied in this article.

3.4.1. Zinc Carbonate Precipitation

Theoretical study of precipitation consists of thermodynamic calculations and constructions of fraction diagrams. Zinc carbonate is insoluble substance with Ksp = 1.4 × 10⁻¹¹. Precipitation reagent should be soluble and therefore Na2CO3 (solubility = 21.5 g/100 mL) and (NH4)2CO3 (solubility = 25 g/100 mL) are considered as suitable for this purpose. Figure 13 shows fraction diagrams for precipitation with sodium carbonate and Equations (10)–(12) shows reactions of precipitation reagent with zinc sulfate. Thermodynamic values confirm negative ∆G° values (Table 8) indicating the formation of ZnCO3, ZnOH or Zn5(OH)6(CO3)2.
ZnSO4(aq) + Na2CO3(s) = ZnCO3(s) + Na2SO4(aq)
ZnSO4(aq) + Na2CO3(s) + H2O(l) = Zn(OH)2(s) + Na2SO4(aq) + CO2(g)
5 ZnSO4(aq) + 5 Na2CO3(s) + 3 H2O(l) = Zn5(OH)6(CO3)2(s) + 5 Na2SO4(aq) + 3 CO2(g)
According to the fraction diagram, pH 7 should be sufficient for the removal of the zinc from the solution. Solid Na2CO3 was slowly added to stirred 25 mL of refined solution and pH value was measured continuously. Two grams were added until pH 6.9 was reached, but only 81.5% zinc precipitation efficiency was achieved. The main reason for lower zinc precipitation is the complexation of zinc [35]. With increased ionic strength of the solution (Figure 14), the fraction of soluble Zn(SO4)46− complexes increases (green arrow) causing lower Zn recovery (red arrow). Further addition Na2CO3 to total 3 g per 25 mL resulted in pH increase to 9 and zinc precipitation efficiency 97.31%. Only 566 mg/L were in the solution. The chemical composition of solution before and after precipitation steps is showed in Table 9.
Solid residue was dried and solid residue from a parallel trial was washed with distilled water and dried. Figure 15 and Figure 16 shows XRD analysis of these products. Zinc is present as Na2Zn3(CO3)4(H2O)3 phase in non-washed precipitated residue and further washing results in a Zn3CO3(OH)6·H2O phase.

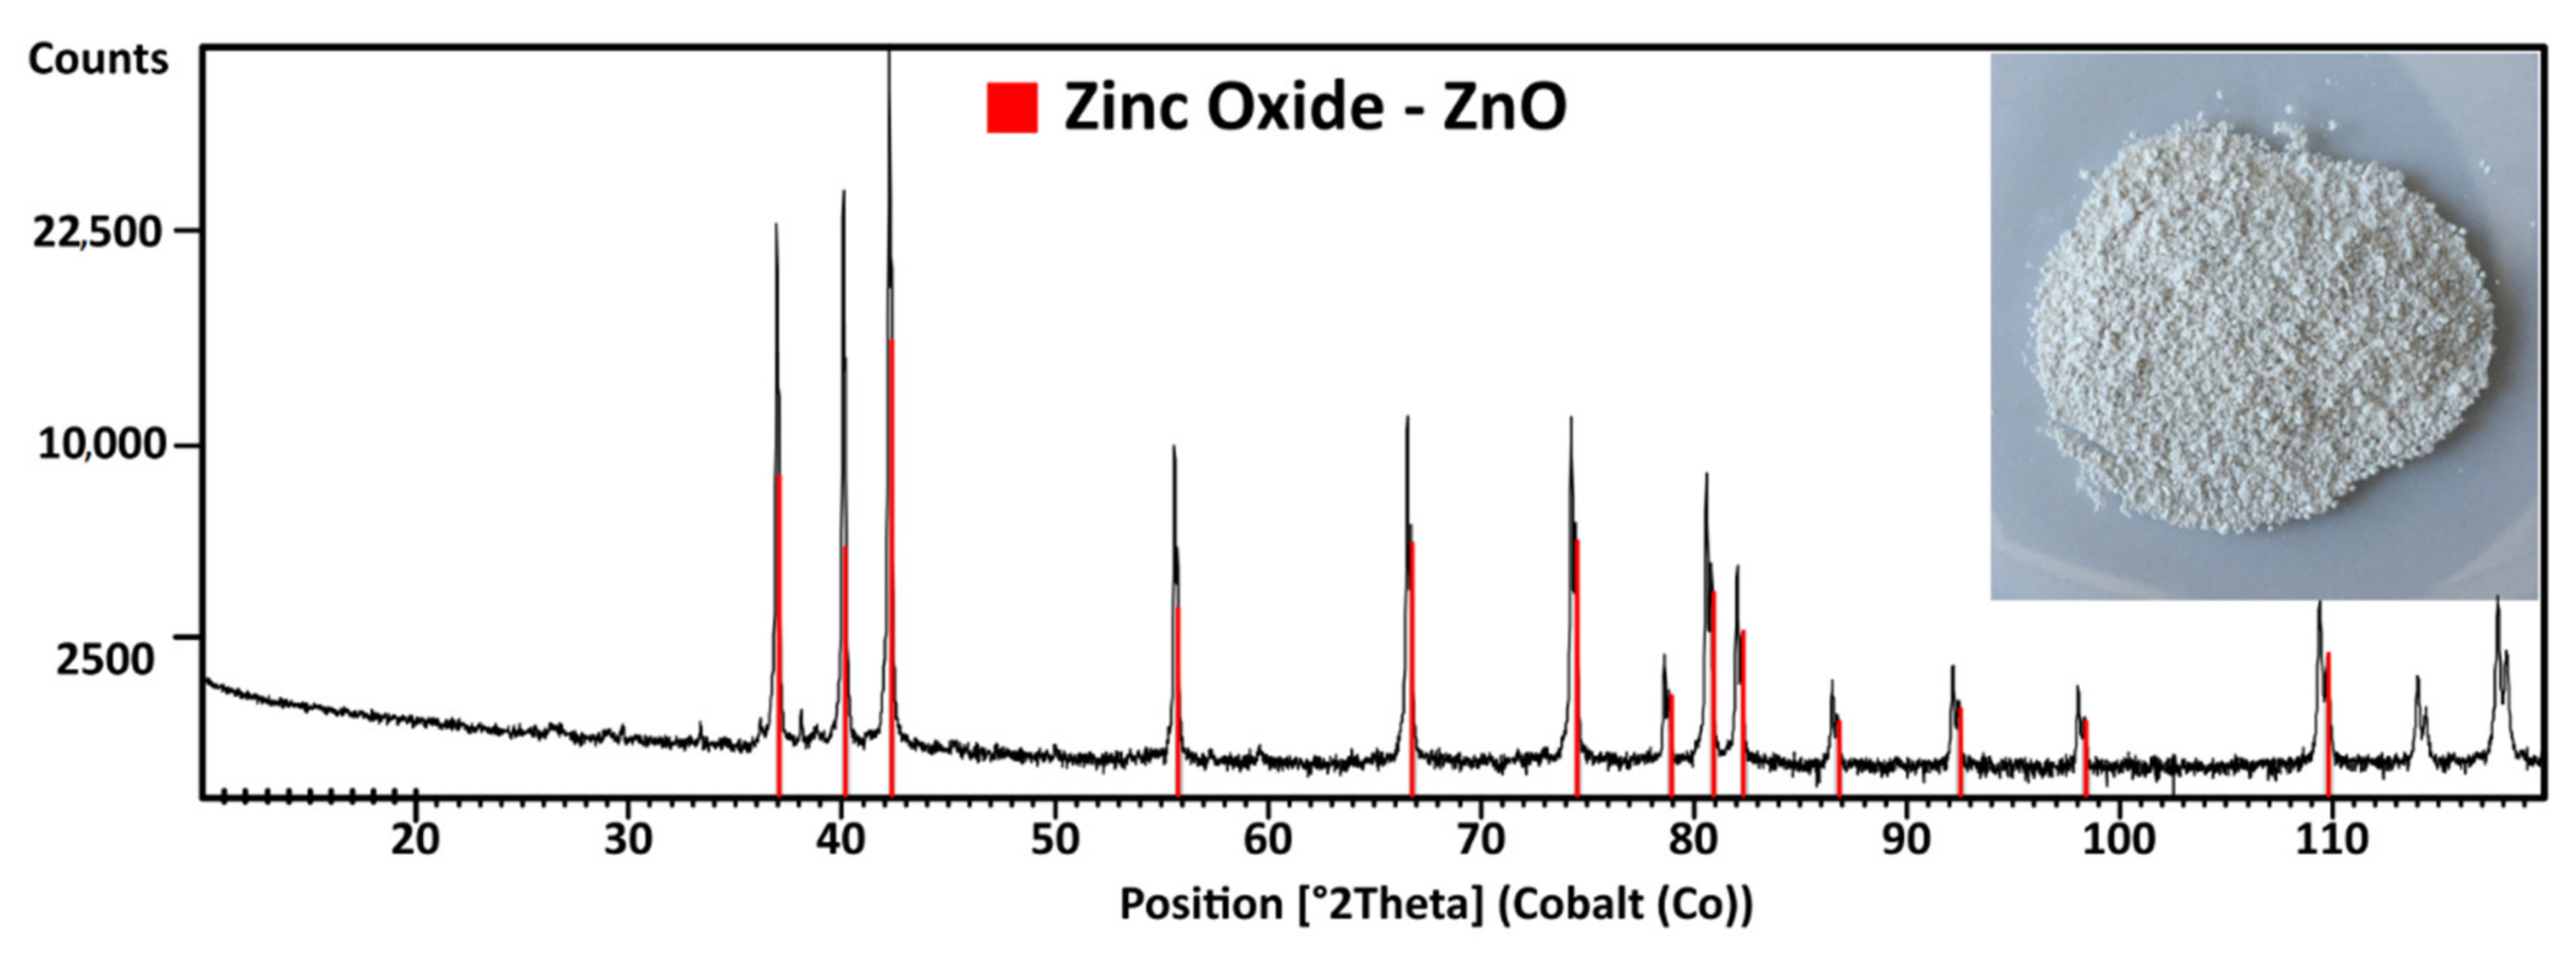
3.4.2. Zinc Carbonate Calcination

Calcination of scrubbed zinc precipitates was carried on to obtain marketable product in form of ZnO according to Equation (13). The temperature of 900 °C was chosen to verify the possibility of calcination of the precipitated zinc phases. Figure 17 shows XRD pattern of that material, which confirm presence of ZnO.
ZnCO3(s) = ZnO(s) + CO2(g)

3.5. Process Flow Sheet

Based on the results obtained in previous stages, an integral multi-step hydrometallurgical processing route for recovery of Zn, Pb, Cu and Sn was developed. The overall process of CAF dust treatment with the achieved concentrations in the solution is shown in Figure 18.

4. Conclusions

Copper anode furnace dust used in this study is by-product of the pyrometallurgical production of copper from secondary sources. The majority of the scientific articles are focused on leaching conditions, but further product recovery is not completely studied yet. Copper anode furnace dust consists of both oxides and chlorides of zinc (28.35%), lead (10.28%), copper (7.51%), tin (2.5%), iron (0.69%) and other elements with content below 0.5%, which were not studied is this paper. The theoretical recycling procedure was designed on the basis of theoretical calculations. The proposed process consists of dust leaching in sulfuric acid, pH adjustment, zinc cementation, precipitation and calcination of the zinc containing products. The proposed procedure was verified by an experimental study and the results were compared with the theoretically simulated process. The experimental study shows:
  • Dust phases present in the sample reacts with H2SO4 and forms sulphates of these elements;
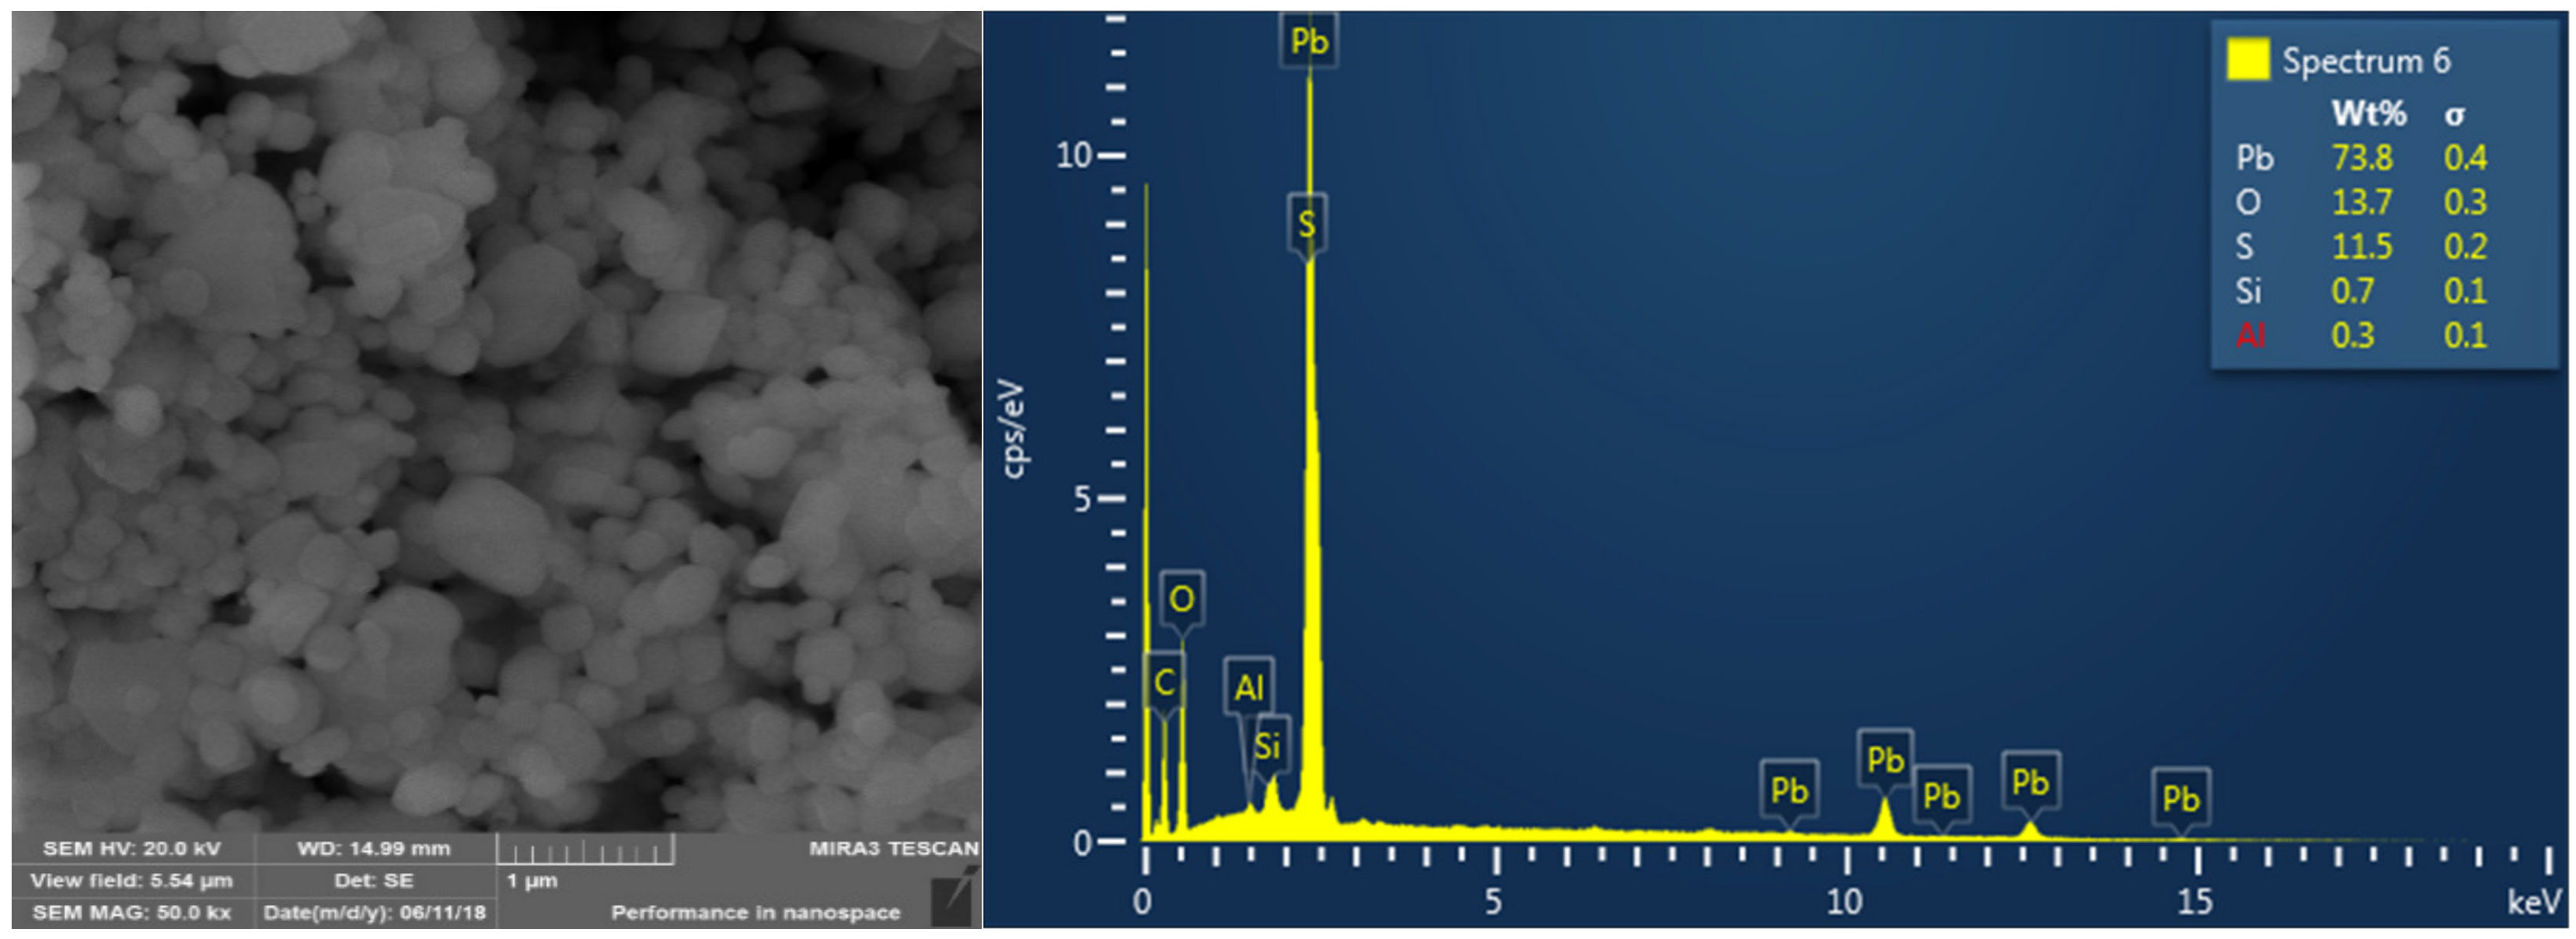
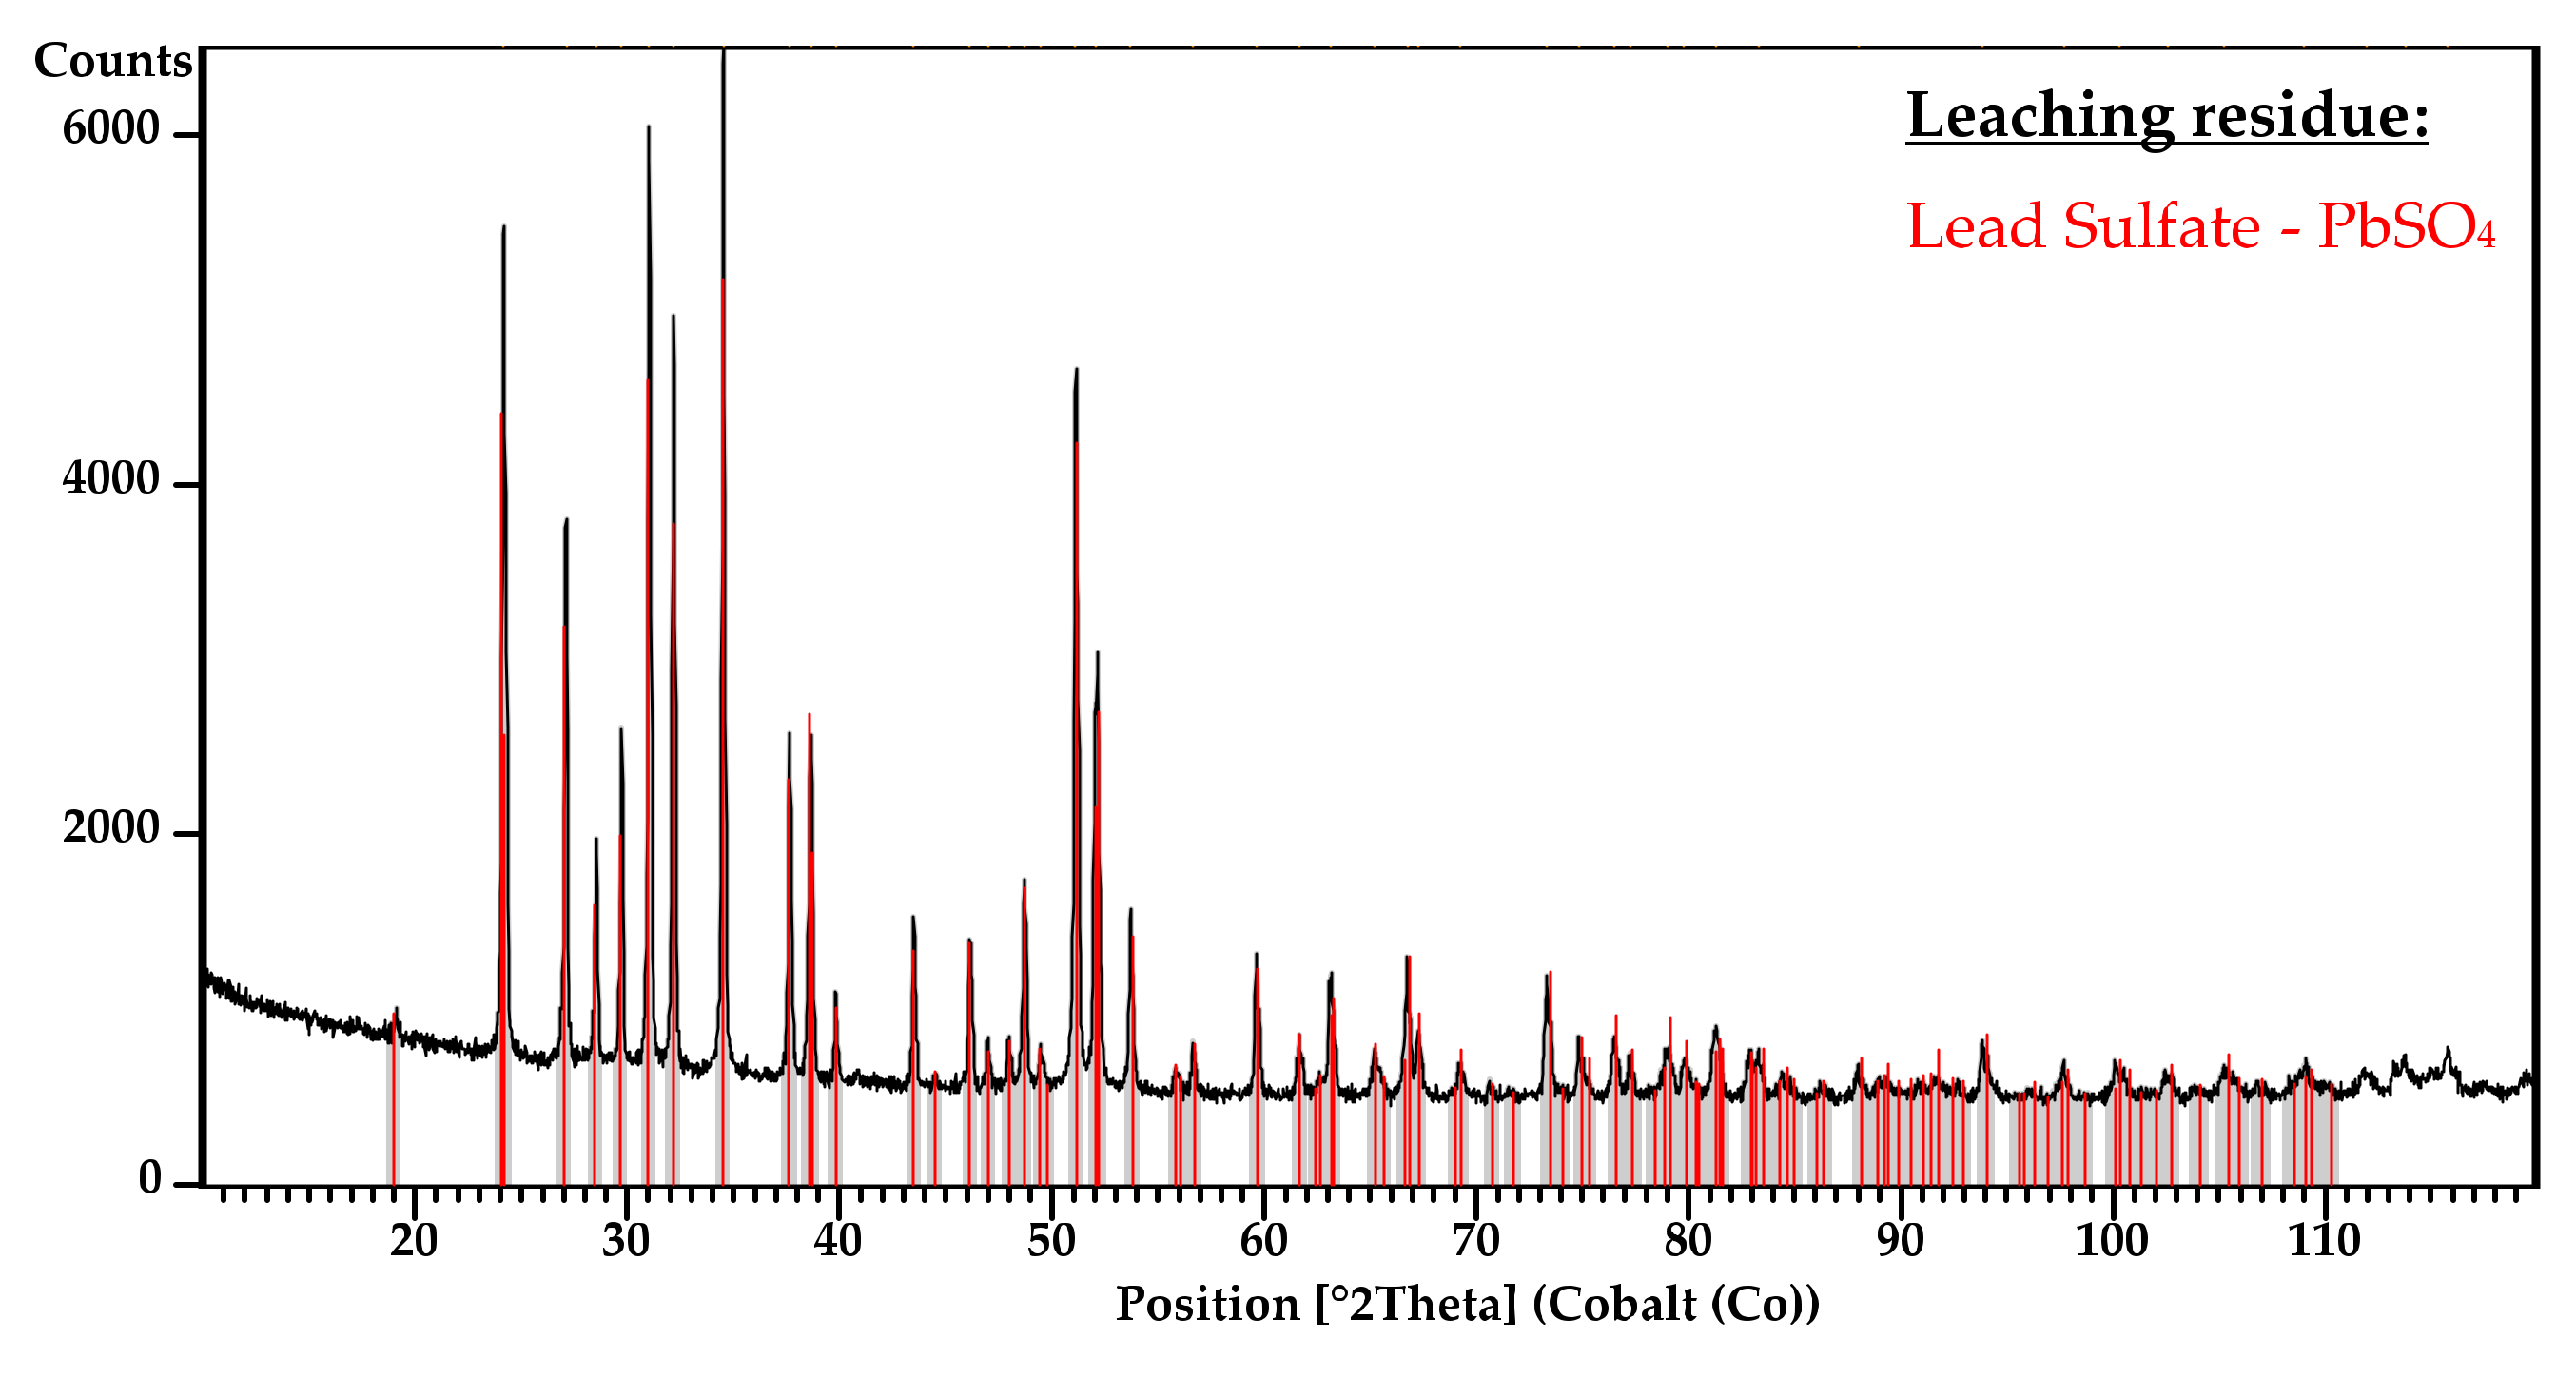
  • Sulphates of present elements are well soluble except for the lead, which forms insoluble PbSO4;
  • Lead sulphate is selectively removed from the zinc, copper, tin, iron and others dissolved elements by filtration;
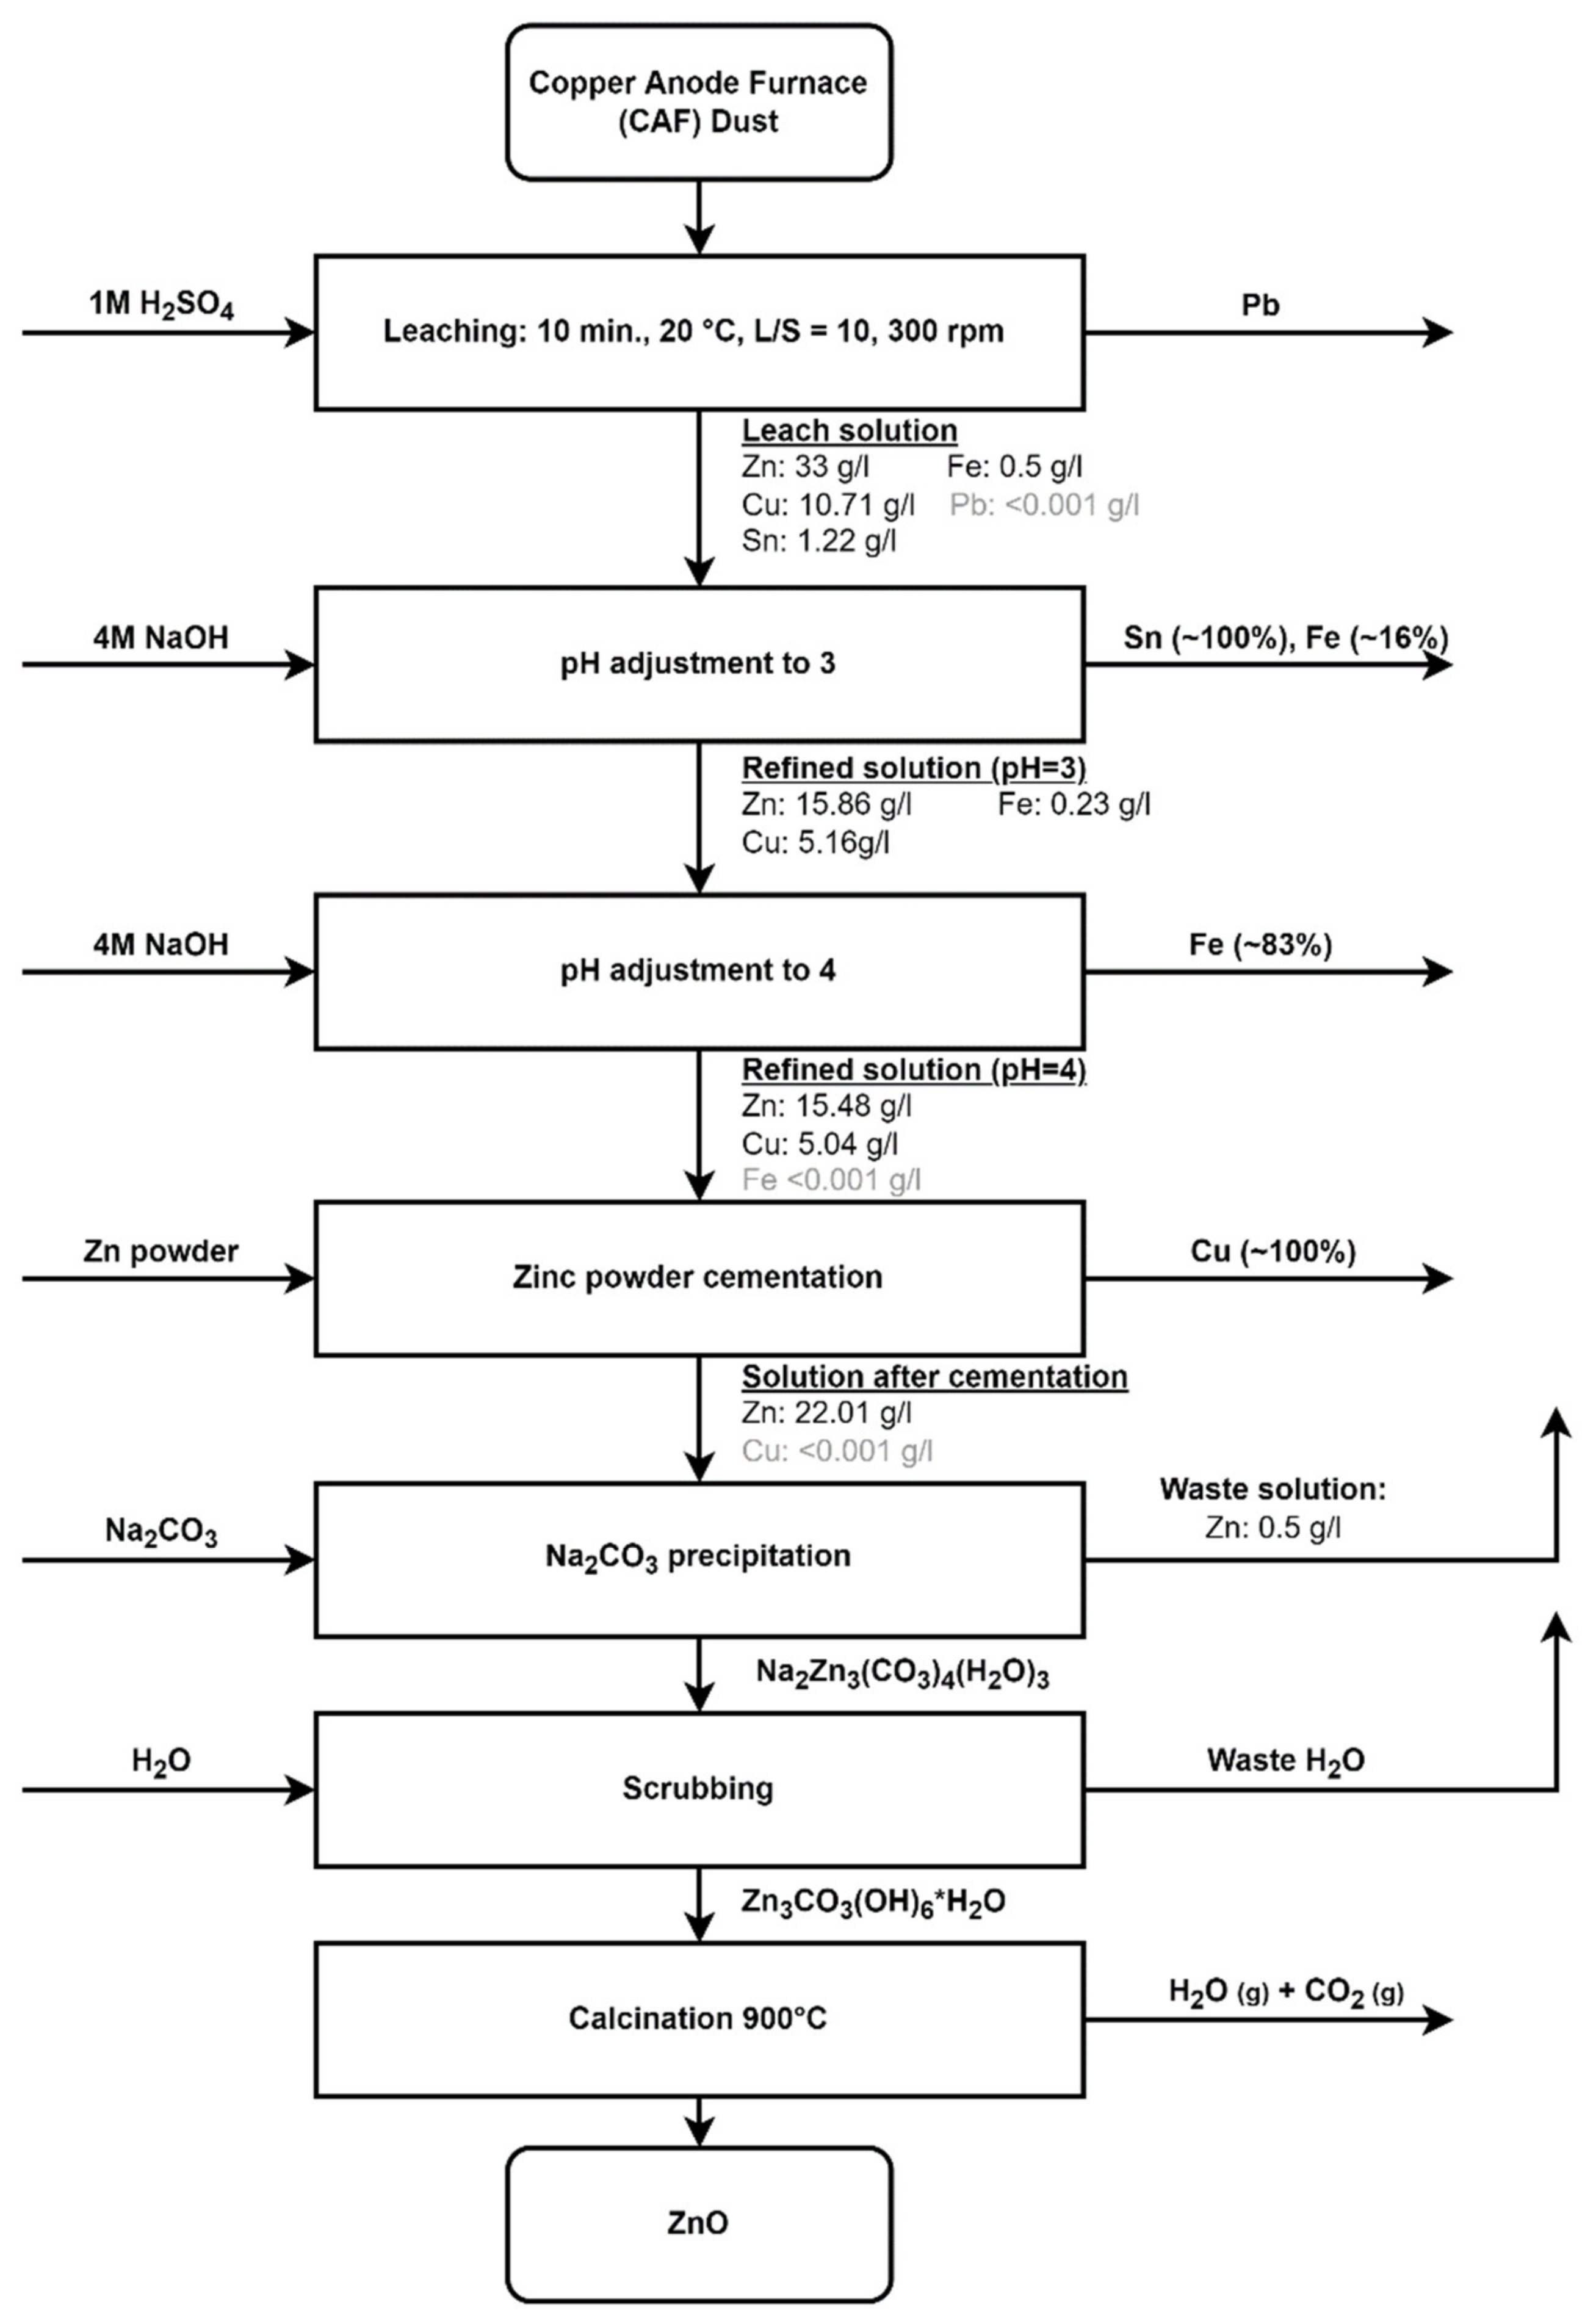
  • Optimum conditions for zinc leaching were determined as liquid to solid ratio of 10, ambient leaching temperature, leaching time of 1 h and 1M H2SO4;
  • Zinc leaching efficiency of 98.85% was achieved at these conditions;
  • Refining of the leach solution consisted of adjusting the pH to value 3, to value 4 and by cementation;
  • pH increase to 3 resulted in quantitative precipitation of the tin from the solution with 15.79% co-precipitation of iron;
  • Further pH increase to 4 led to precipitation of iron remaining 82.75% of iron;
  • No copper or zinc were precipitated during followed pH adjustments;
  • Zinc powder cementation was used in order to remove the copper from the solution;
  • Copper concentration decreased from 5038 to 2.22 mg/L which represent 99.96% removal efficiency of cementation, while zinc concentration was increased from 15,478 to 21,021 mg/L;
  • The increased cementation temperature has no positive effect on the efficiency after 30 min of the experiment;
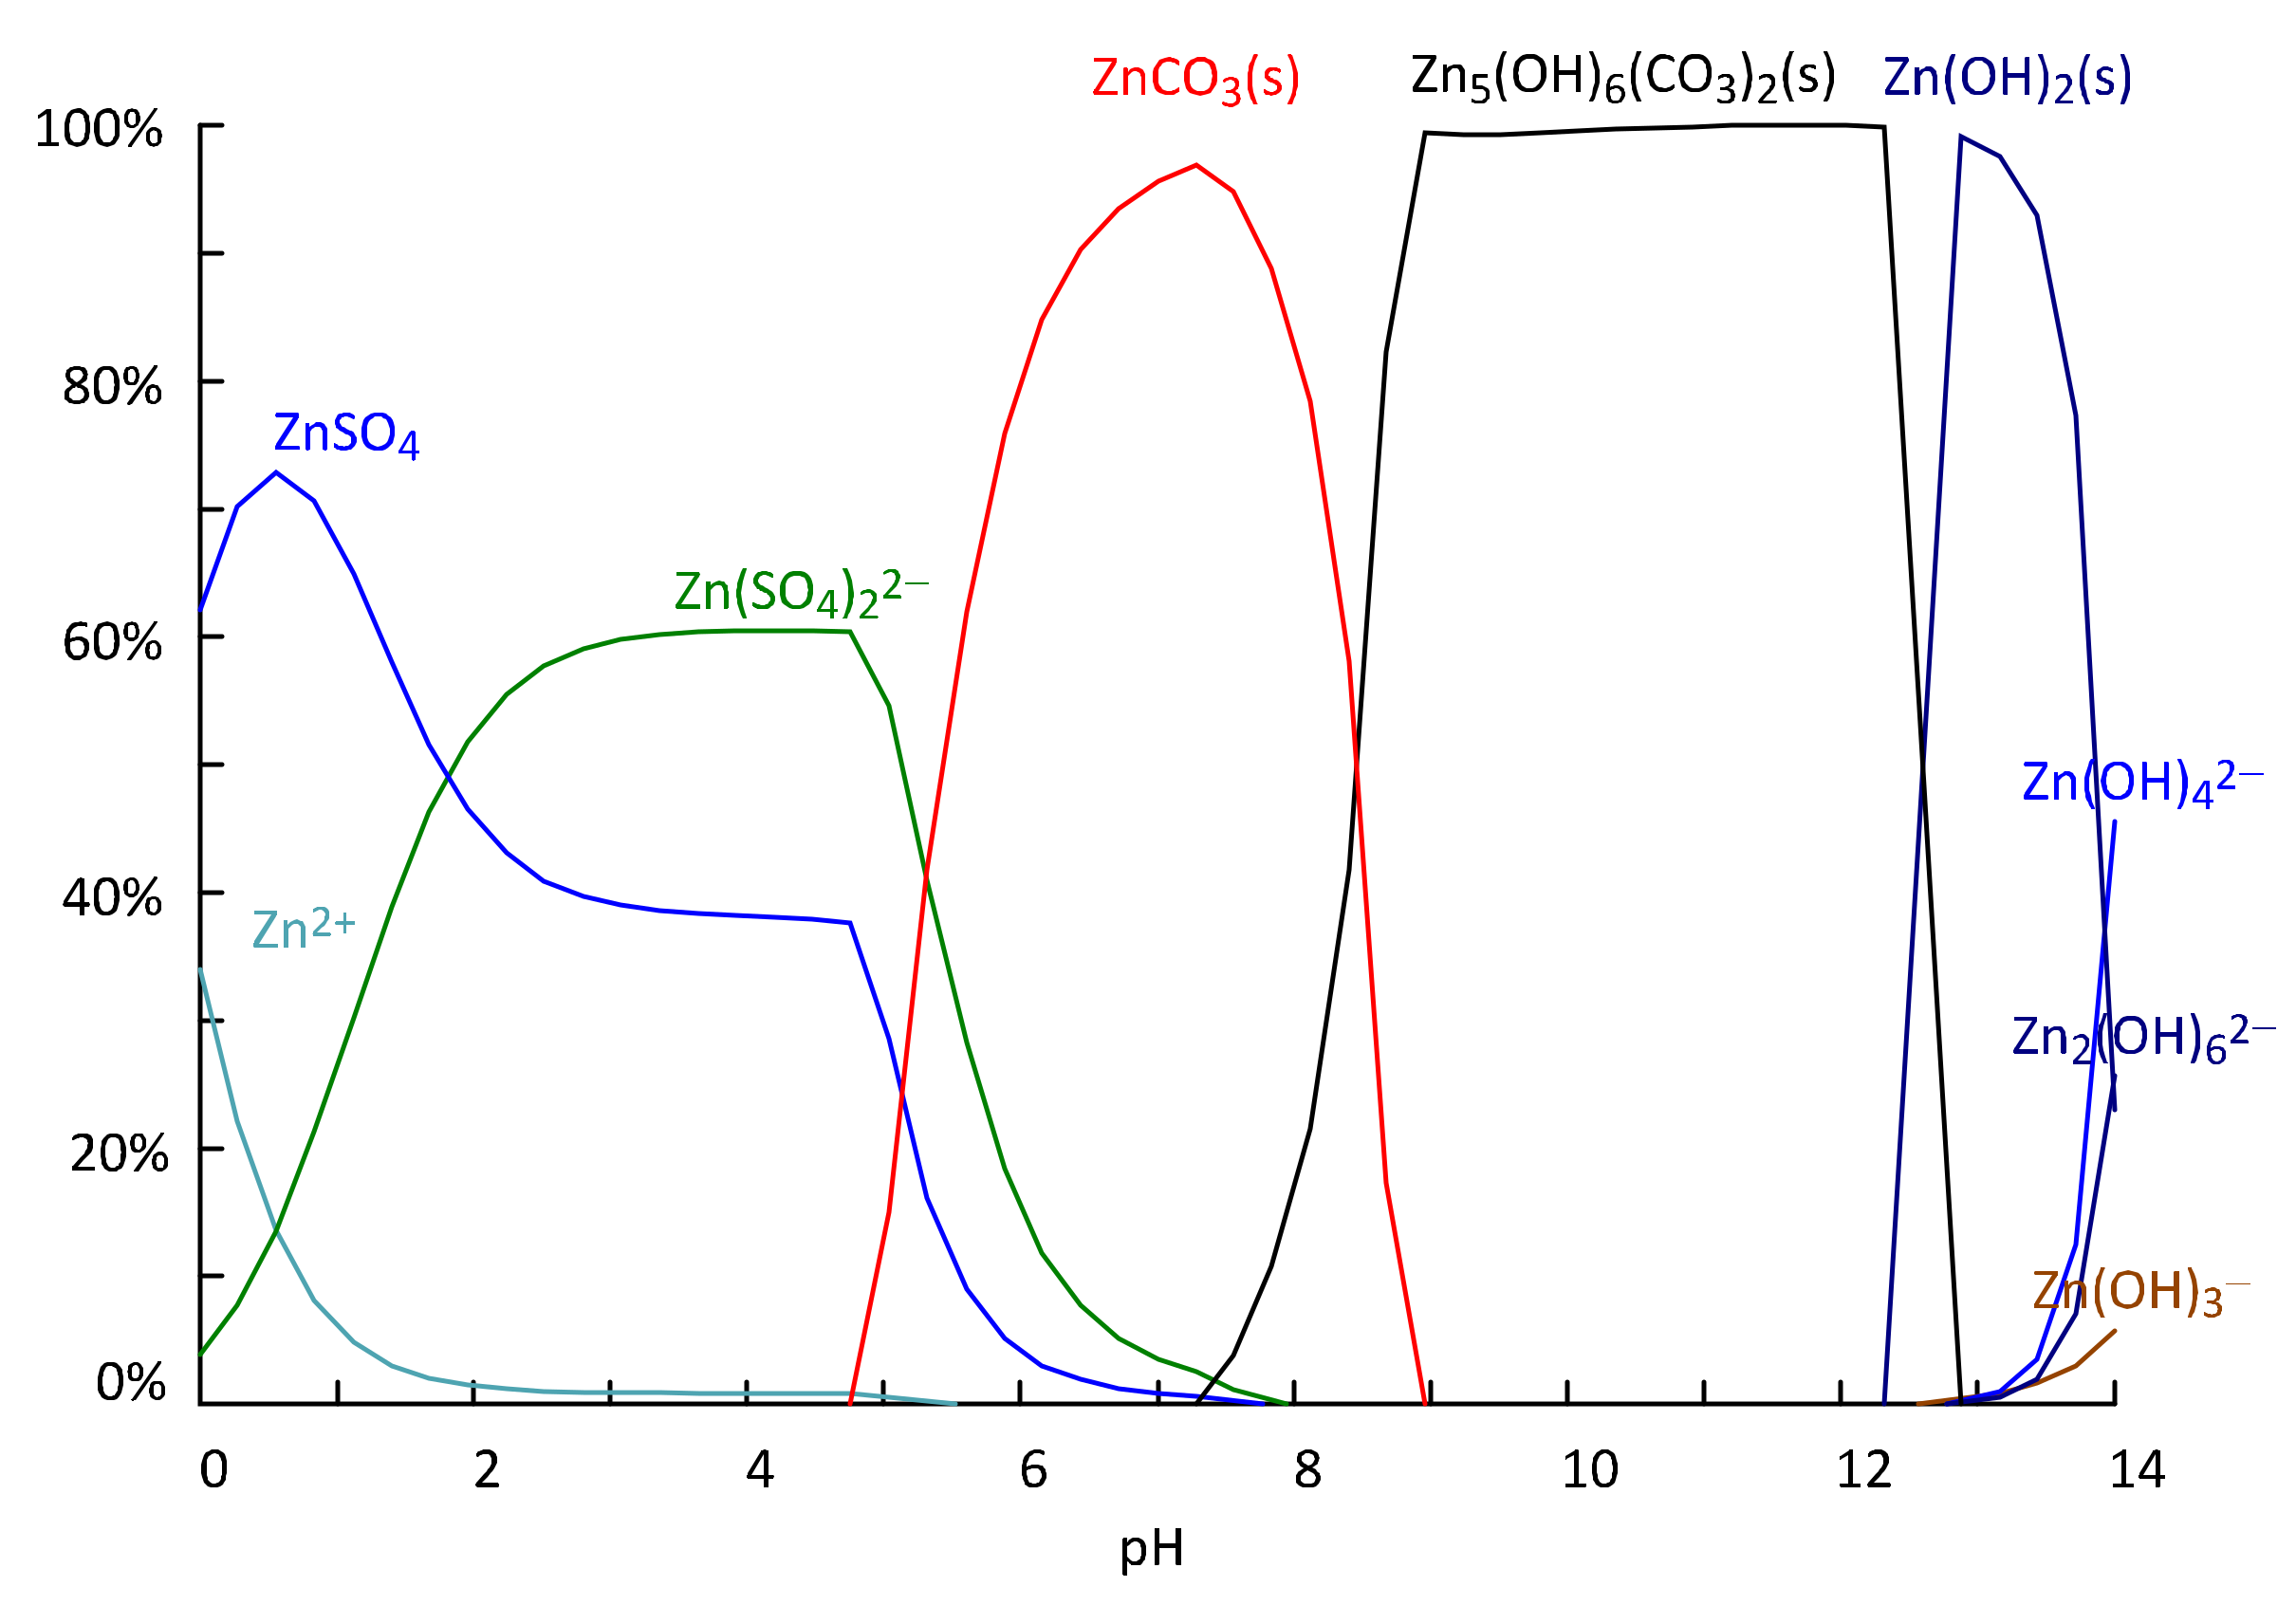
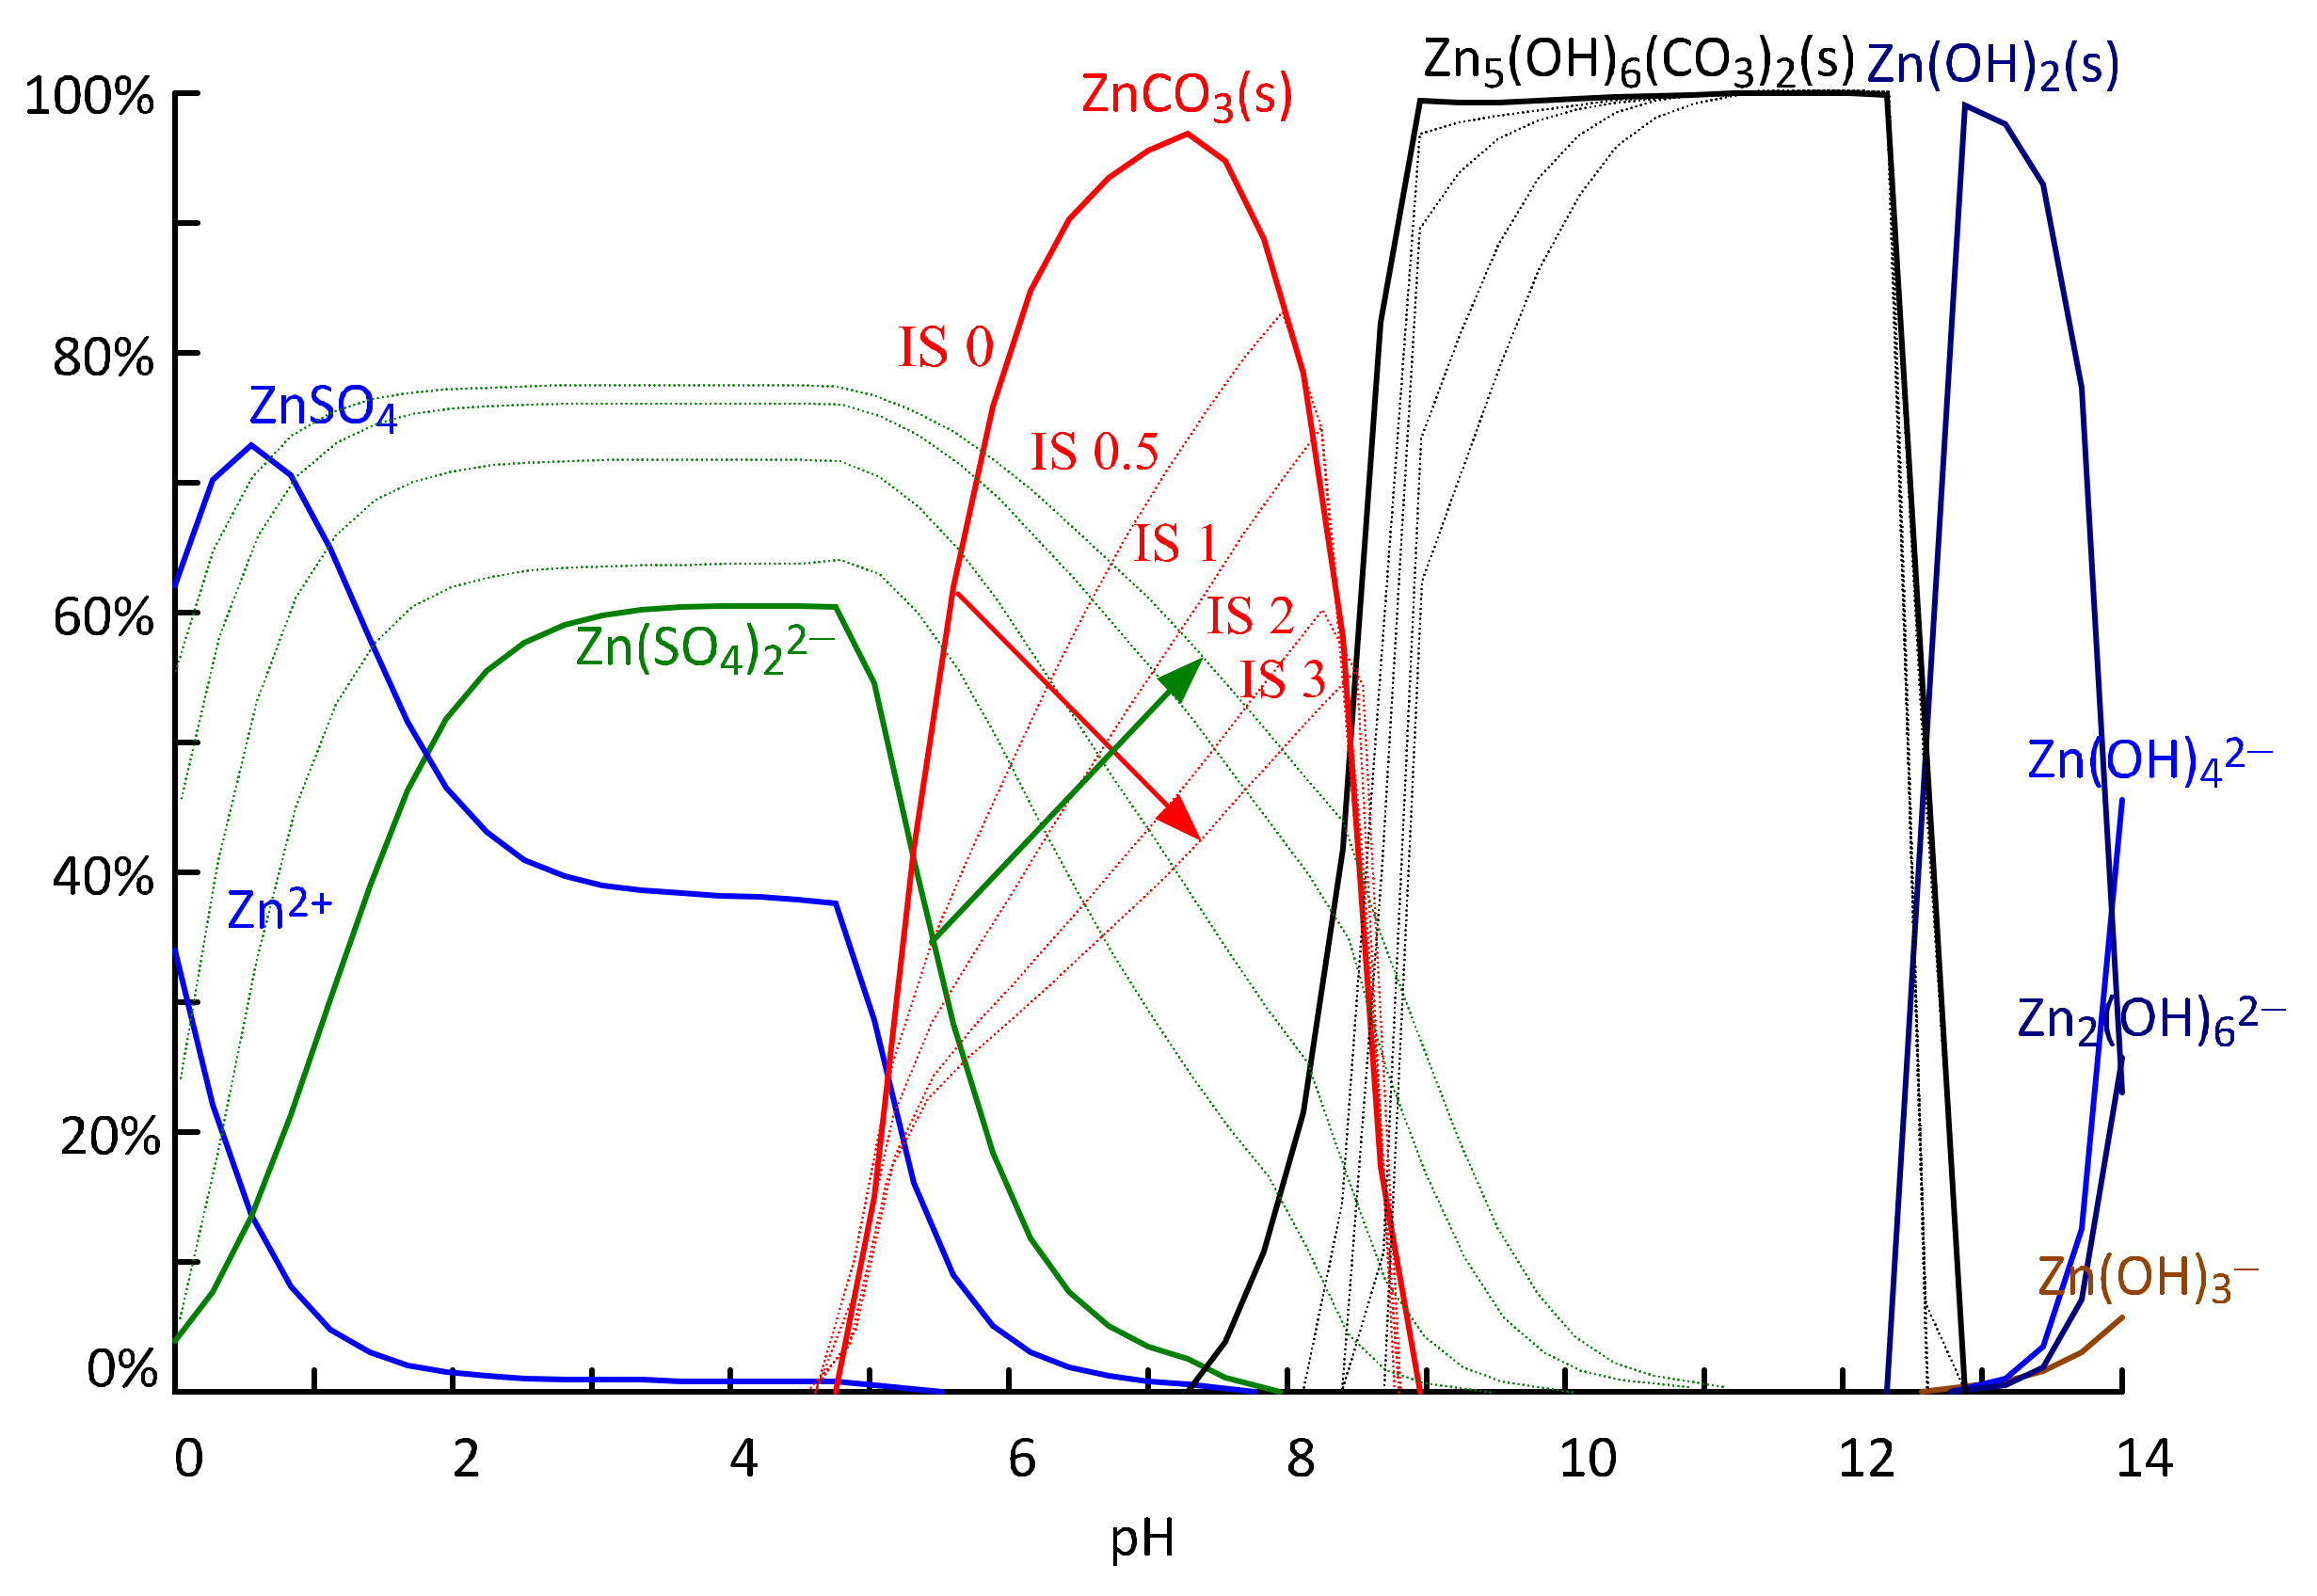
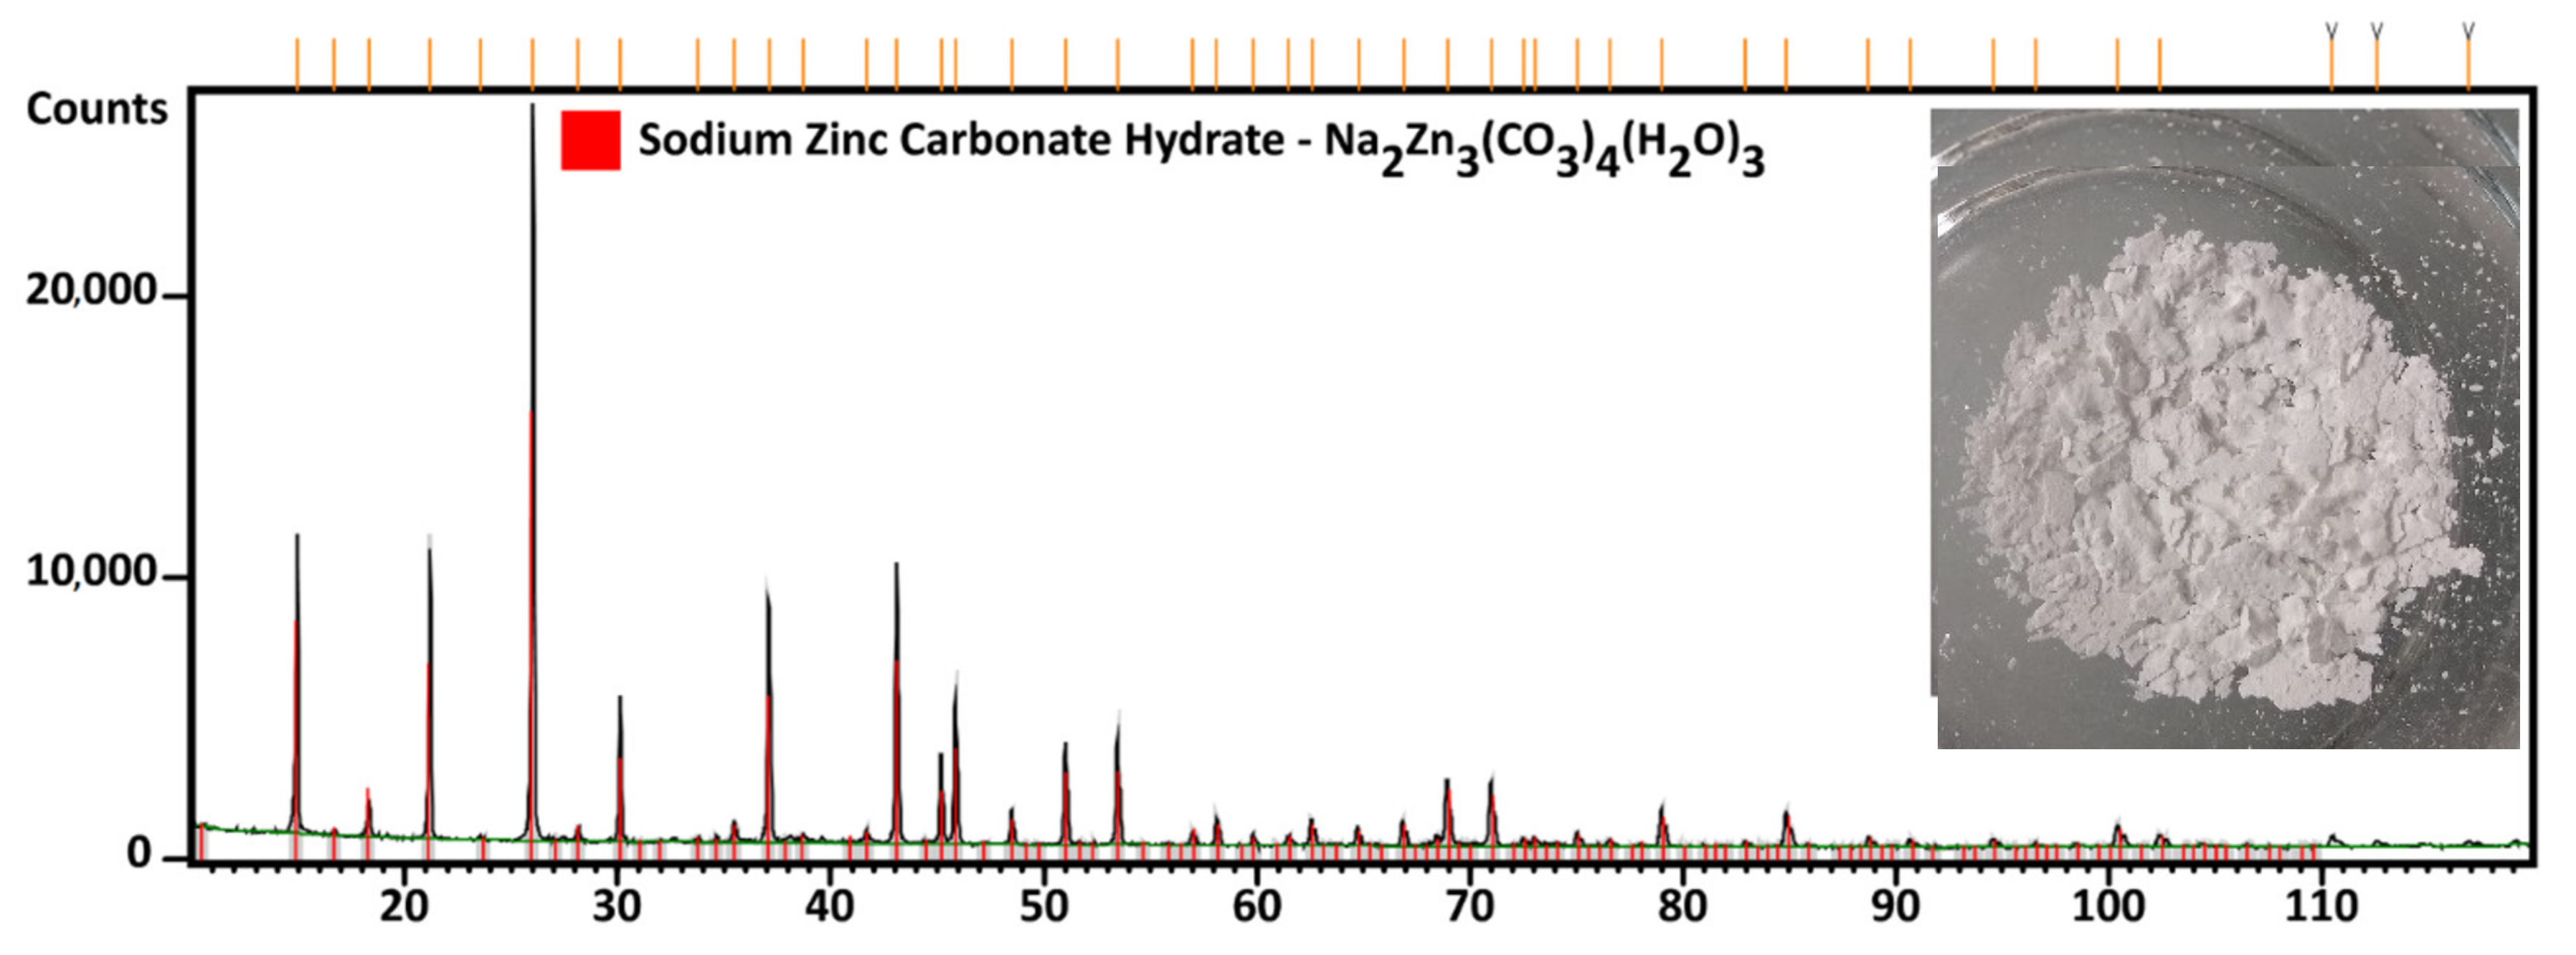
  • Zinc was then precipitated from refined solution by the addition of Na2CO3, which caused further pH increase;
  • Theoretical increase to pH of 6 was not sufficient for quantitative recovery of the zinc from solution due to zinc complexation and therefore the addition of Na2CO3 was increased to 3 g per 50 mL until pH 9 was reached;
  • The concentration of zinc in solution decreased from 21,021 mg/L to 566 mg/L, which represents 97.31% precipitation efficiency;
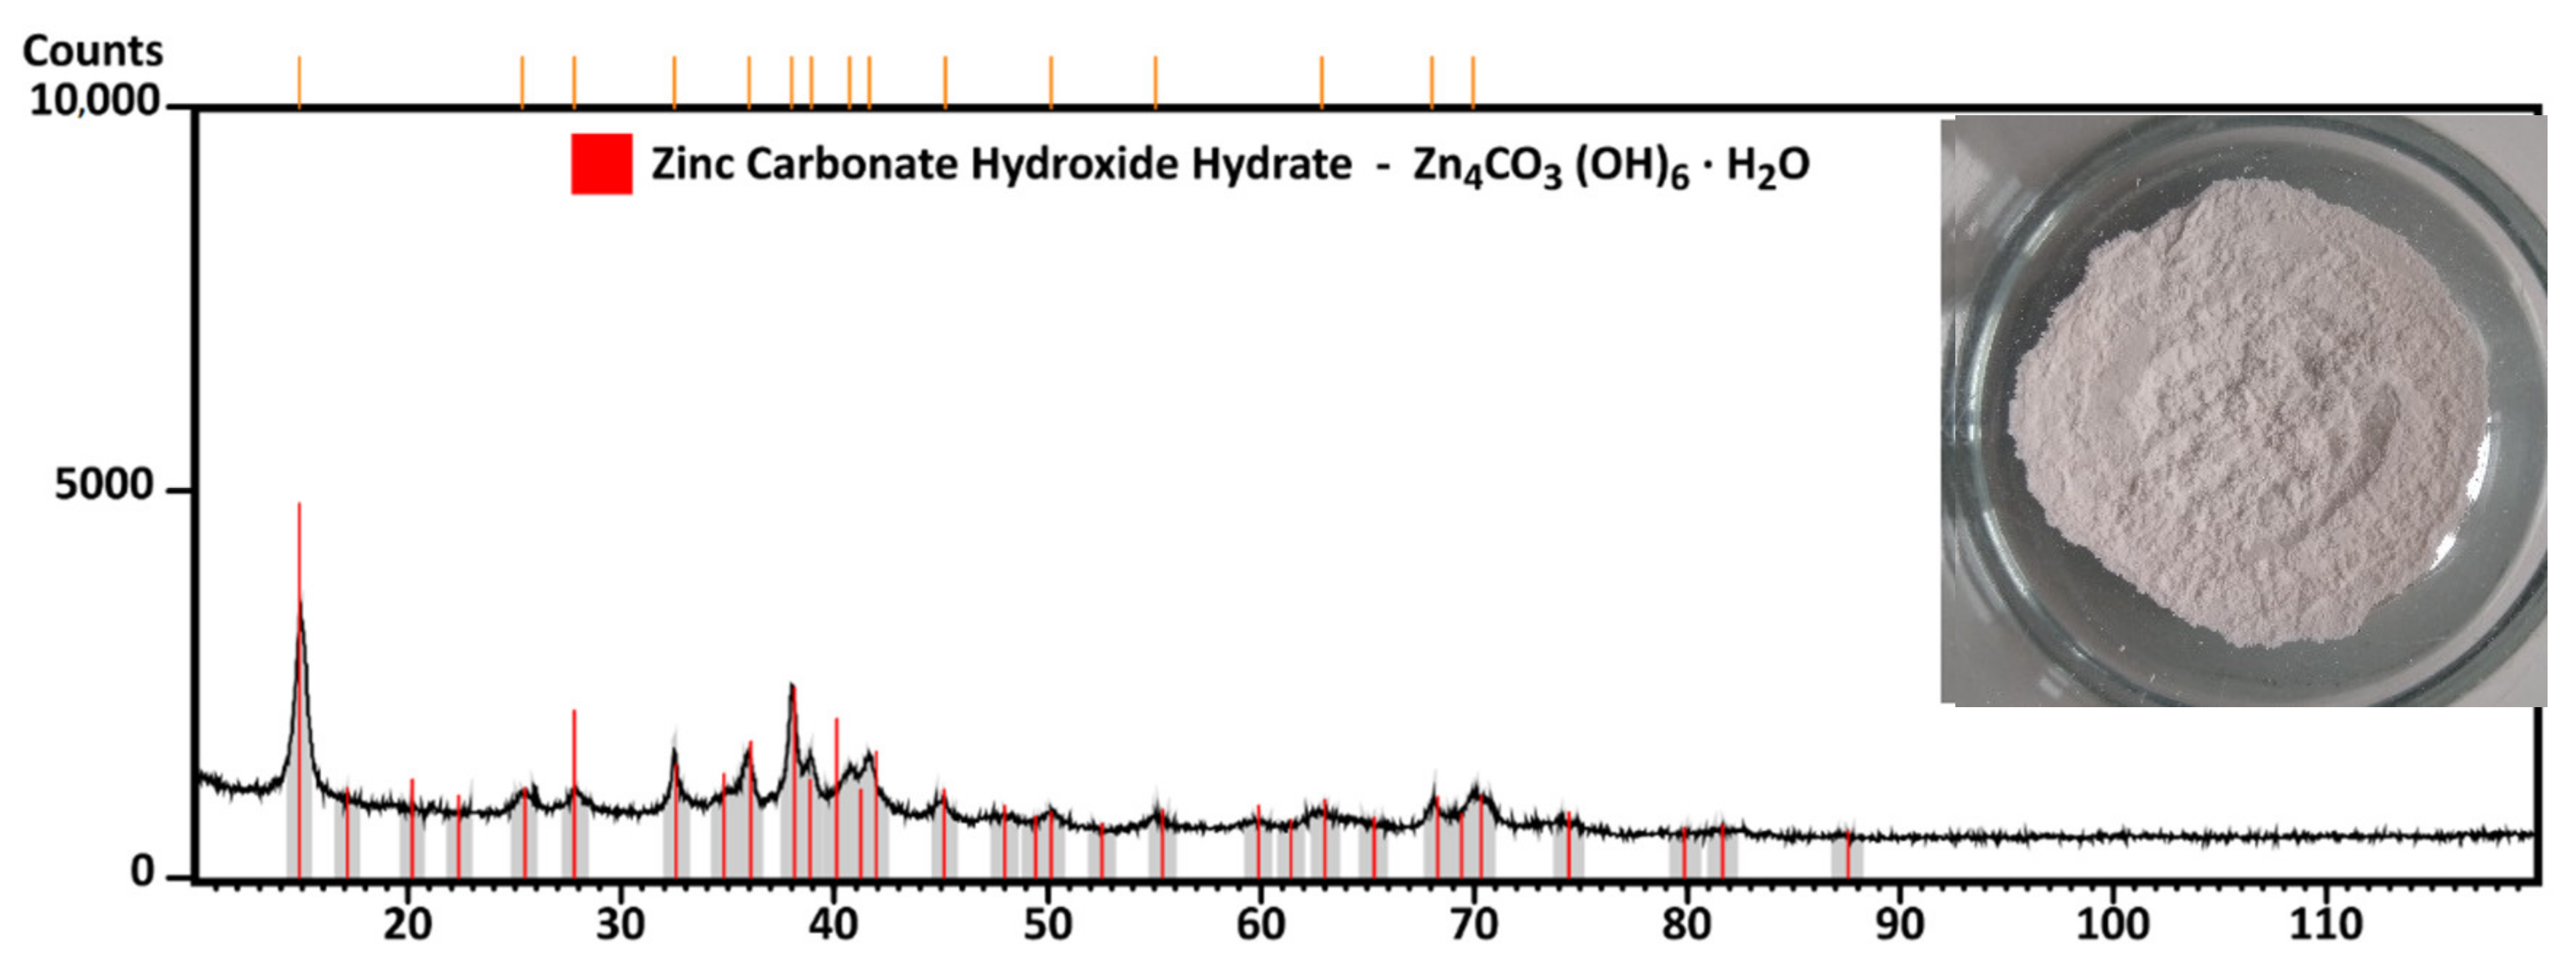
  • The solid residue scrubbing removes sodium and calcination at 900 °C decompose ZnCO3 into ZnO and CO2;
  • A total of 96.16% of the zinc in the form of ZnO was recovered from the CAF dust waste by proposed method.
In further research, the optimal conditions of solution refining and conditions of zinc recovery from solution will be studied in order to reduce zinc powder usage in cementation step and in order to achieve the highest possible efficiency and selectivity of each individual operation.

Author Contributions

Conceptualization, D.O., D.K. and J.K.; investigation, D.K., J.P. and T.V.; software J.K. and P.L.; methodology D.O. and T.V.; validation D.K., J.K. and J.P.; formal analysis J.K. and D.K.; writing—original draft preparation J.K., D.O. and D.K.; writing—review and editing D.O. and P.L.; visualization, J.K., D.K. and J.P.; supervision, D.O., A.M. and P.L.; project administration, D.O. and A.M. All authors have read and agreed to the published version of the manuscript.

Funding

This research was funded by Slovak Research and Development Agency under the contract APVV grant number APVV-14-0591 And The APC was funded by MŠ SR VEGA 1/0556/20.

Institutional Review Board Statement

Not applicable.

Informed Consent Statement

Not applicable.

Data Availability Statement

Data sharing is not applicable.

Acknowledgments

This work was funded by the Ministry of Education of the Slovak Republic under grant MŠ SR VEGA 1/0556/20. This work was supported by the Slovak Research and Development Agency under the contract APVV-14-0591.

Conflicts of Interest

The authors declare no conflict of interest. The funders had no role in the design of the study; in the collection, analyses, or interpretation of data; in the writing of the manuscript, or in the decision to publish the results.

References

  1. International Copper Study Group, Lisbon, Portugal. Available online: https://www.icsg.org/index.php/111-icsg-releases-latest-copper-market-forecast-2021-2022 (accessed on 26 July 2021).
  2. Garside, M. Copper Refinery Production Worldwide 2000–2019. Available online: https://www.statista.com/statistics/254917/total-global-copper-production-since-2006/ (accessed on 26 July 2021).
  3. All the Metals We’ve Mined in One Visualization. Available online: https://elements.visualcapitalist.com/wp-content/uploads/2021/09/all-of-the-metals-one-visualization.html (accessed on 22 November 2021).
  4. Nagyová, I.; Melichová, Z.; Komadelová, T.; Boháč, P.; Andráš, P. Environmental Assessment Of Impacts By Old Copper Mining Activities—A Case Study at Špania Dolina Starohorskémts, Slovakia. Carpathian J. Earth Environ. Sci. 2013, 8, 101–108. [Google Scholar]
  5. Dong, D.; van Oers, L.; Tukker, A.; van der Voet, E. Assessing the Future Environmental Impacts of Copper Production in China: Implications of the Energy Transition. J. Clean. Prod. 2020, 274, 122825. [Google Scholar] [CrossRef]
  6. Europe’s Demand for Copper Is Increasingly Met by Recycling. Available online: https://copperalliance.eu/benefits-of-copper/recycling/ (accessed on 22 November 2021).
  7. Ilyas, S.; Srivastava, R.R.; Kim, H.; Das, S.; Singh, V.K. Circular Bioeconomy and Environmental Benignness through Microbial Recycling of E-Waste: A Case Study on Copper and Gold Restoration. Waste Manag. 2021, 121, 175–185. [Google Scholar] [CrossRef] [PubMed]
  8. You, J.; Solongo, S.K.; Gomez-Flores, A.; Choi, S.; Zhao, H.; Urík, M.; Ilyas, S.; Kim, H. Intensified Bioleaching of Chalcopyrite Concentrate Using Adapted Mesophilic Culture in Continuous Stirred Tank Reactors. Bioresour. Technol. 2020, 307, 123181. [Google Scholar] [CrossRef]
  9. European Commission, Joint Research Centre. Towards Recycling Indicators Based on EU Flows and Raw Materials System Analysis Data: Supporting the EU 28 Raw Materials and Circular Economy Policies through RMIS; Publications Office: Luxembourg, 2018; Available online: https://data.europa.eu/doi/10.2760/092885 (accessed on 22 November 2021).
  10. Orac, D.; Laubertova, M.; Piroskova, J.; Klein, D.; Bures, R.; Klimko, J. Characterization of Dusts from Secondary Copper Production. J. Min. Metall. B Metall. 2020, 56, 221–228. [Google Scholar] [CrossRef]
  11. Li, Q.; Pinto, I.S.S.; Zhao, Y. Sequential Stepwise Recovery of Selected Metals from Flue Dusts of Secondary Copper Smelting. J. Clean. Prod. 2014, 84, 663–670. [Google Scholar] [CrossRef]
  12. Gabler, R. Metal Recovery from Secondary Copper Converter Dust by Ammoniacal Carbonate Leaching; Bureau of Mines, U.S. Department of the Interior: Washington, DC, USA, 1988. [Google Scholar]
  13. Mukongo, T.; Maweja, K.; wa Ngalu, B.; Mutombo, I.; Tshilombo, K. Zinc Recovery from the Water-Jacket Furnace Flue Dusts by Leaching and Electrowinning in a SEC-CCS Cell. Hydrometallurgy 2009, 97, 53–60. [Google Scholar] [CrossRef]
  14. Liu, W.-F.; Fu, X.-C.; Yang, T.-Z.; Zhang, D.-C.; Chen, L. Oxidation leaching of copper smelting dust by controlling potential. Trans. Nonferrous Met. Soc. China 2018, 28, 1854–1861. [Google Scholar] [CrossRef]
  15. Lucheva, B.; Iliev, P.; Kolev, D. Hydro—Pyrometallurgical Treatment of Copper Converter Flue Dust. J. Chem. Technol. Metall. 2017, 52, 320–325. [Google Scholar]
  16. Jose Alguacil, F.; Regel-Rosocka, M. Hydrometallurgical Treatment of Hazardous Copper Cottrell Dusts to Recover Copper. Physicochem. Probl. Miner. Process. 2018, 54, 771–780. [Google Scholar] [CrossRef]
  17. Morales, A.; Cruells, M.; Roca, A.; Bergó, R. Treatment of Copper Flash Smelter Flue Dusts for Copper and Zinc Extraction and Arsenic Stabilization. Hydrometallurgy 2010, 105, 148–154. [Google Scholar] [CrossRef]
  18. Helbig, T.; Gilbricht, S.; Lehmann, F.; Daus, B.; Kelly, N.; Haseneder, R.; Scharf, C. Oxidative leaching of a sulfidic flue dust of former copper shale processingwith focus on rhenium. Miner. Eng. 2018, 128, 168–178. [Google Scholar] [CrossRef]
  19. Klein, D.; Oráč, D. Treatment of anode furnace dust in sulfuric acid. In Metallurgy Junior 2018; Technical University of Košice: Košice, Slovakia, 2018; ISBN 978-80-553-2971-0. [Google Scholar]
  20. Klein, D.; Oráč, D. Cementation of leach solution from copper dust leaching. In Metalurgia Junior 2019; Technická Univerzita v Košiciach: Košice, Slovakia, 2019; ISBN 978-80-553-3315-1. [Google Scholar]
  21. Zhang, Y.; Man, R.-L.; Ni, W.-D.; Wang, H. Selective leaching of base metals from copper smelter slag. Hydrometallurgy 2010, 103, 25–29. [Google Scholar]
  22. Khalid, M.K.; Hamuyuni, J.; Agarwal, V.; Pihlasalo, J.; Haapalainen, M.; Lundström, M. Sulfuric acid leaching for capturing value from copper rich converterslag. J. Clean. Prod. 2019, 215, 1005–1013. [Google Scholar] [CrossRef]
  23. Gargul, K.; Boryczko, B.; Bukowska, A.; Jarosz, P.; Malecki, S. Leaching of lead and copper from flash smelting slag by citric acid. Arch. Civ. Mech. Eng. 2019, 19, 648–656. [Google Scholar] [CrossRef]
  24. Dimitrijević, M.; Urošević, D.; Milić, S.; Sokić, M.; Marković, R. Dissolution of copper from smelting slag by leaching in chloride media. J. Min. Metall. Sect. B Metall. 2017, 53, 407–412. [Google Scholar] [CrossRef] [Green Version]
  25. Palimąka, P.; Pietrzyk, S.; Stępień, M.; Ciećko, K.; Nejman, I. Zinc Recovery from Steelmaking Dust by Hydrometallurgical Methods. Metals 2018, 8, 547. [Google Scholar] [CrossRef] [Green Version]
  26. Piroskova, J.; Laubertova, M.; Miskufova, A.; Orac, D. Hydrometallurgical Treatment of Copper Shaft Furnace Dust for Lead Recovery. World Metall.—Erzmetall 2018, 71, 37–42. [Google Scholar]
  27. Laubertova, M.; Havlik, T.; Parilak, L.; Derin, B.; Trpčevská, J. The Effects Of Microwave-Assisted Leaching On The Treatment Of Electric Arc Furnace Dusts (Eafd). Arch. Metall. Mater. 2020, 1, 321–328. [Google Scholar] [CrossRef]
  28. Caplan, M.; Trouba, J.; Anderson, C.; Wang, S. Hydrometallurgical Leaching of Copper Flash Furnace Electrostatic Precipitator Dust for the Separation of Copper from Bismuth and Arsenic. Metals 2021, 11, 371. [Google Scholar] [CrossRef]
  29. Darezereshki, E.; Bakhtiari, F. Synthesis and characterization of tenorite (CuO) nanoparticles from smelting furnace dust (SFD). J. Min. Metall. Sect. B Metall. 2013, 49, 21–26. [Google Scholar] [CrossRef]
  30. Zhang, D.; Zhang, X.; Yang, T.; Rao, S.; Hu, W.; Liu, W.; Chen, L. Selective leaching of zinc from blast furnace dust with mono-ligand andmixed-ligand complex leaching systems. Hydrometallurgy 2017, 169, 219–228. [Google Scholar] [CrossRef]
  31. Laubertová, M.; Kollová, A.; Trpčevská, J.; Plešingerová, B.; Briančin, J. Hydrometallurgical Treatment of Converter Dust from Secondary Copper Production: A Study of the Lead Cementation from Acetate Solution. Minerals 2021, 11, 1326. [Google Scholar] [CrossRef]
  32. Mičková, V.; Ružičková, S.; Remeteiová, D.; Laubertová, M.; Dorková, M. Sampling and Digestion of Waste Mobile Phones Printed Circuit Boards for Cu, Pb, Ni, and Zn Determination. Chem. Pap. 2018, 72, 1231–1238. [Google Scholar]
  33. Jiři, G.K.; Laubertová, M.; Leber, P.; Král, P. Sampling IV, Industry, 1st ed.; 2Theta: Český Těšin, Czech Republic, 2017; 228p, ISBN 978-80-86380-87-2. (In Slovak) [Google Scholar]
  34. Dean, J.A. Lange’s handbook of chemistry. Mater. Manuf. Process. 1990, 5, 687–688. [Google Scholar] [CrossRef]
  35. Ma, Y.; Stopic, S.; Wang, X.; Forsberg, K.; Friedrich, B. Basic Sulfate Precipitation of Zirconium from Sulfuric Acid Leach Solution. Metals 2020, 10, 1099. [Google Scholar] [CrossRef]
  36. Nelson, A.; Wang, W.; Demopoulos, G.P.; Houlachi, G. Removal of cobalt from zinc electrolyte by cementation: A critical review. Miner. Process. Extr. Metall. Rev. 2000, 20, 325–356. [Google Scholar] [CrossRef]
  37. Demirkran, N.; Künkül, A. Recovering of copper with metallic aluminum. Trans. Nonferrous Met. Soc. China 2011, 21, 2778–2782. [Google Scholar] [CrossRef]
  38. Silwamba, M.; Ito, M.; Hiroyoshi, N.; Tabelin, C.B. Recovery of Lead and Zinc from Zinc Plant Leach Residues by Concurrent Dissolution-Cementation. Metals 2020, 10, 531. [Google Scholar] [CrossRef] [Green Version]
  39. Choi, S.; Yoo, K.; Alorro, R.D.; Tabelin, C.B. Cementation of Co ion in leach solution using Zn powder followed by magnetic separation of cementation-precipitate for recovery of unreacted Zn powder. Miner. Eng. 2020, 145, 106061. [Google Scholar] [CrossRef]
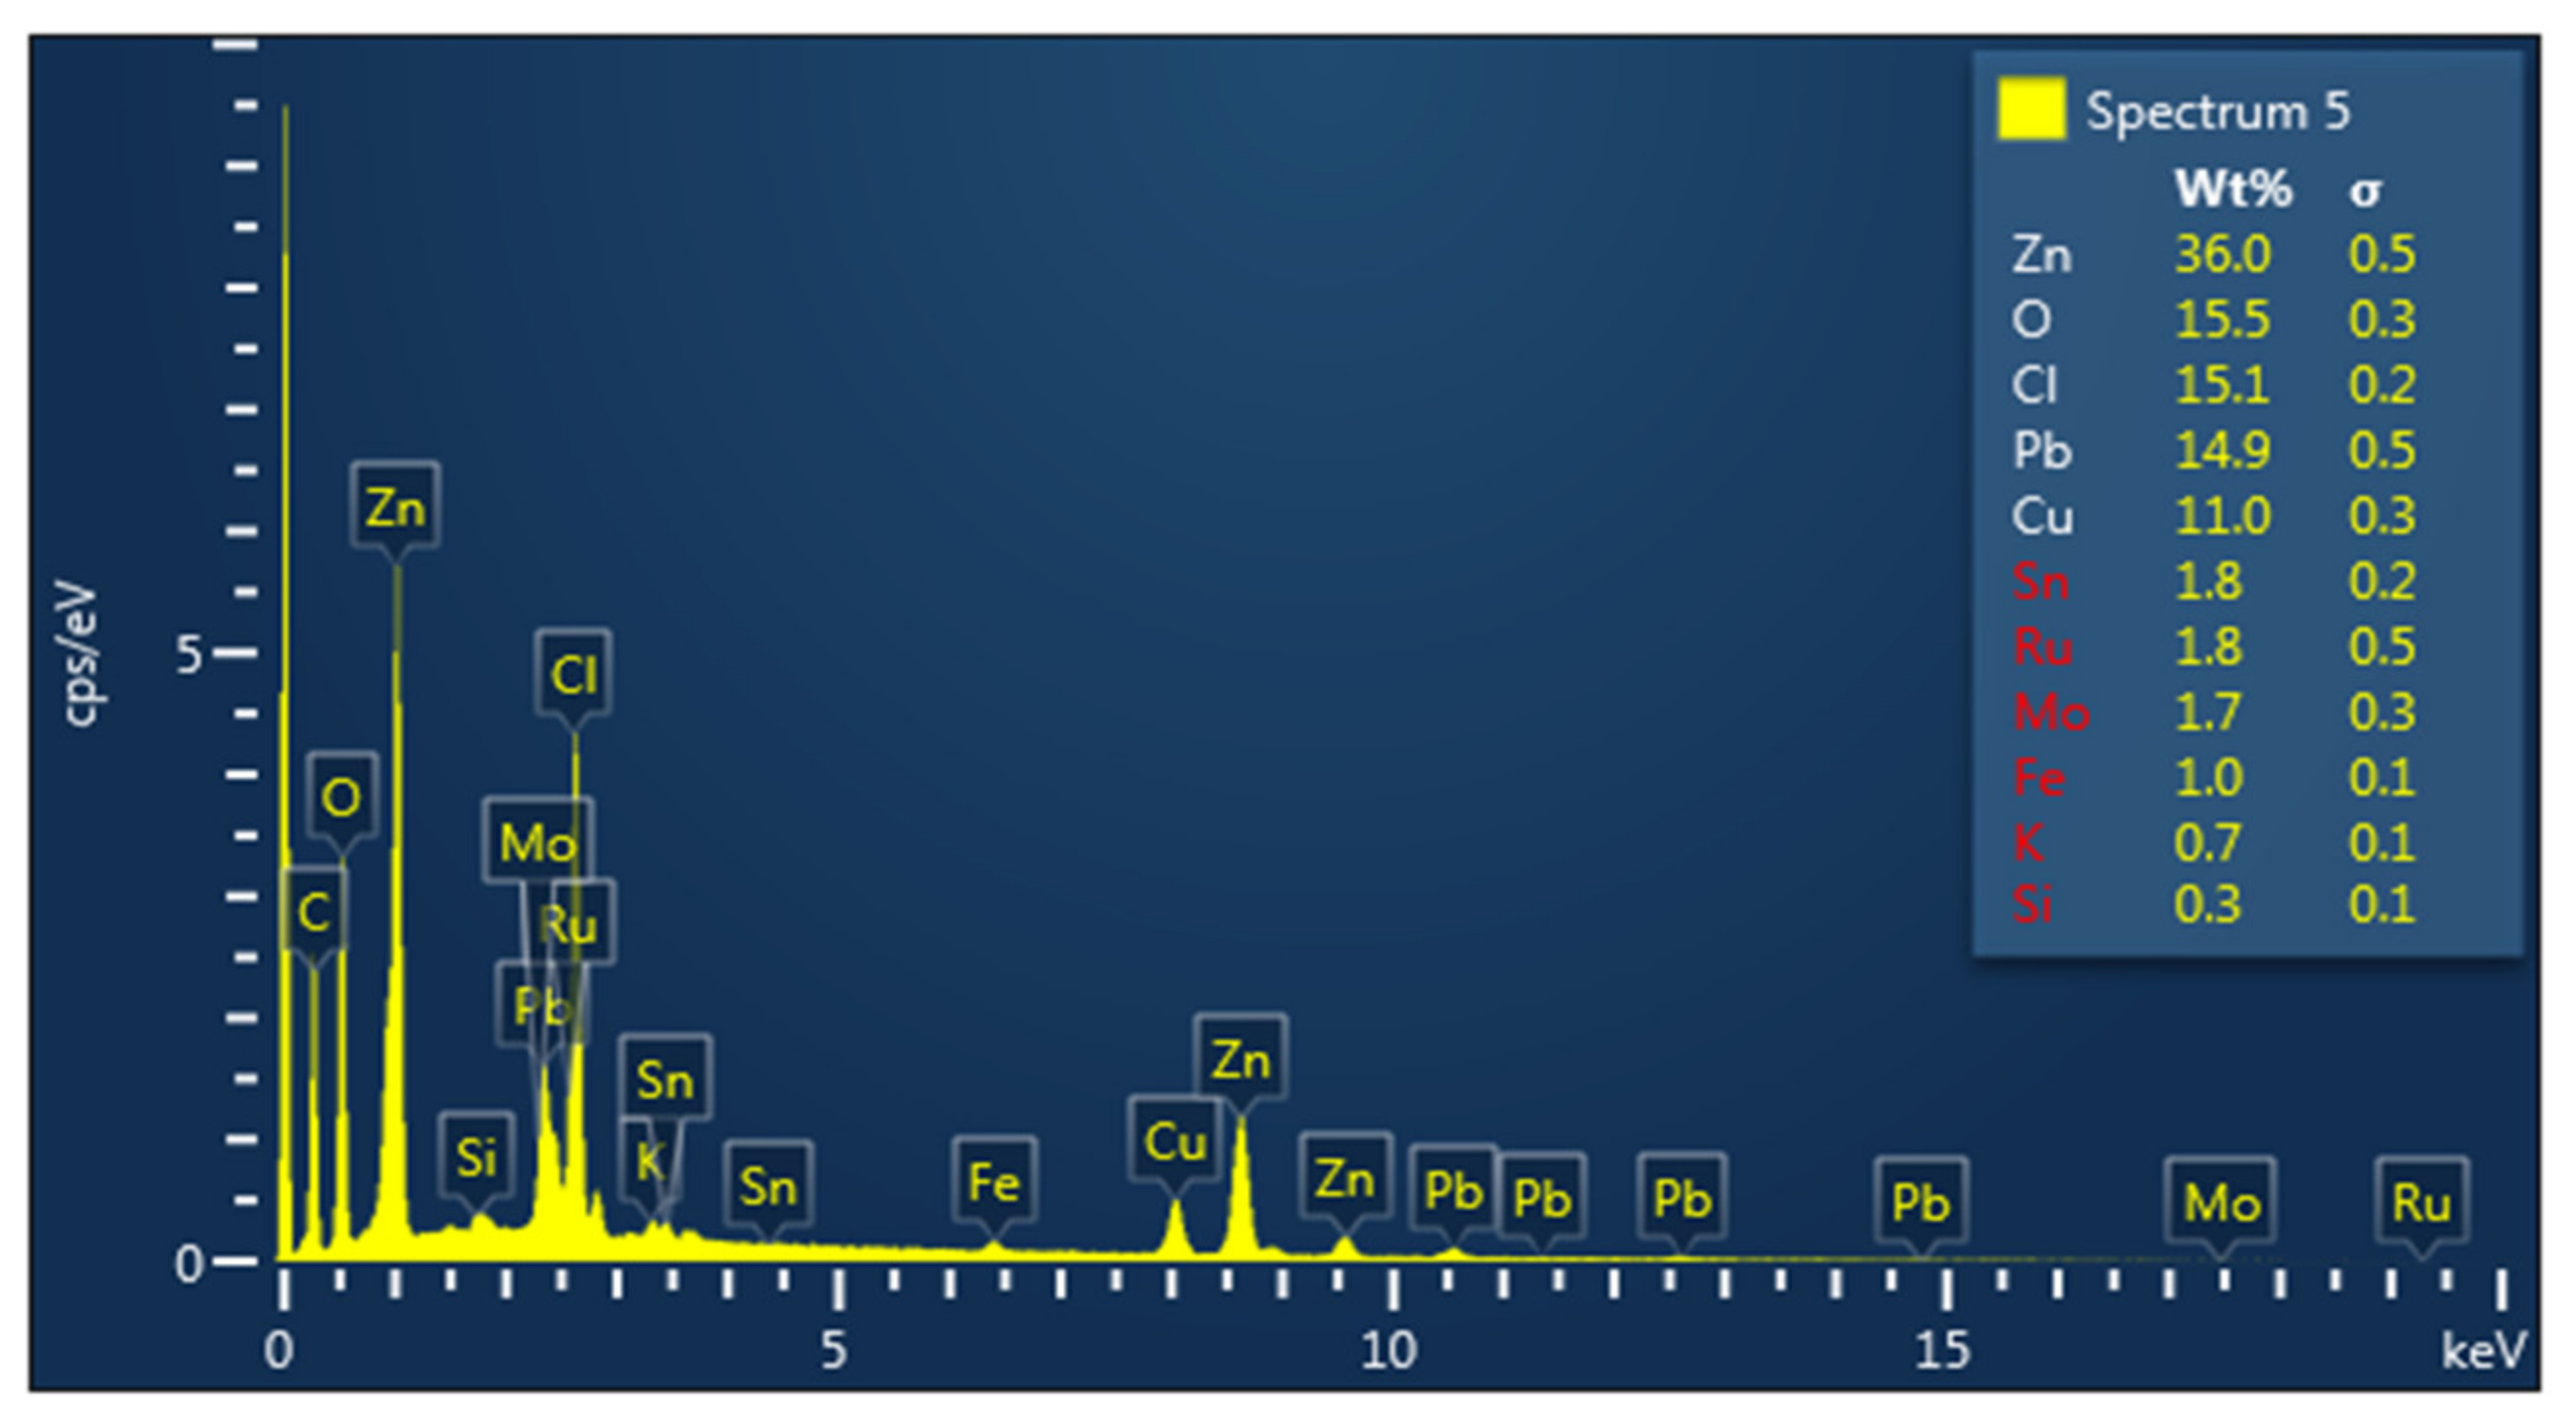
Figure 1. Copper furnace dust sample and particle size distribution [10].
Metals 12 00036 g001
Figure 2. Copper furnace dust sample (left) and particle size distribution (right) [10].
Metals 12 00036 g002
Figure 3. X-ray diffraction phase analysis (XRD) analysis of Copper Anode Furnace dust [10].
Metals 12 00036 g003
Figure 4. Scanning electron microscopy analysis along with energy dispersive spectrometry (SEM-EDX) analysis of Copper Anode Furnace dust [10].
Metals 12 00036 g004
Figure 5. Effect of temperature on Zn leaching efficiency over time at 20 °C, 60 °C and 80 °C, in (a) 0.5 M and (b) 1 M H2SO4 solution, L:S ratio of 40 and constant stirring speed of 300 rpm. (c) Leaching efficiency after the 60th minute of the experiment as a function of temperature for both acid concentrations.
Metals 12 00036 g005
Figure 6. SEM-EDS of solid residue after CAF dust leaching.
Metals 12 00036 g006
Figure 7. XRD analysis of CAF dust leaching residue.
Metals 12 00036 g007
Figure 8. CAF dust leaching efficiency in (a) 0.5 M H2SO4 and (b) 1 M H2SO4 over time at liquid to solid ratio of 40, 20, 10 and 5 and (c) dust leaching efficiency in 60th minute as function of solid to liquid ratio.
Metals 12 00036 g008
Figure 9. Predicted fraction diagrams of (a) [Zn] = 504 mM (b) [Cu] = 110 mM (c,d) [Sn] = 12 mM (e,f) [Fe] = 12 mM [Pb] = 49 mM in 1 M H2SO4 solutions using MEDUSA software (Make Equilibrium Diagrams Using Sophisticated Algorithms, 32-bit version 2010, Royal Institute of Technology, Stockholm, Sweden).
Metals 12 00036 g009
Figure 10. Products obtained by pH adjustment and filtration: (a) solution with pH adjusted to 3, (b) precipitate from pH adjustment to 3, (c) solution with pH 3 after filtration, (d) solution with pH adjusted to 4, (e) precipitate from pH adjustment to 4, (f) solution with pH 4 after filtration.
Metals 12 00036 g010
Figure 11. Copper concentration change over time at temperature of 20 and 80 °C.
Metals 12 00036 g011
Figure 12. (a) Input solution with pH 4 (b) zinc powder after cementation (c) solution after pH adjustment and cementation.
Metals 12 00036 g012
Figure 13. Fraction diagram of [ZnCO3] = 0.310 M precipitation with [Na2CO3] = 0.310 M.
Metals 12 00036 g013
Figure 14. Fraction diagram of [ZnCO3] = 0.310 M precipitation with [Na2CO3] = 0.310 M at different ionic strength and complexation of Zn causing lower precipitation efficiency.
Metals 12 00036 g014
Figure 15. Crude zinc precipitate after drying.
Metals 12 00036 g015
Figure 16. Zinc precipitate after scrubbing and drying.
Metals 12 00036 g016
Figure 17. Zinc precipitate after calcination at 900 °C.
Metals 12 00036 g017
Figure 18. Copper Anode Furnace dust proposed recycling method consisting of leaching, solution refining, zinc precipitation and calcination.
Metals 12 00036 g018
Table 1. Chemical composition of the copper anode furnace dust analyzed by AAS.
ElementZnPbCuSnFeCaAsSiNiCl-
Content (% w/w)28.3510.287.511.500.670.220.080.090.0213.71
Table 2. ΔG° values of CAF dust leaching in the H2SO4 system.
Temp. (°C)∆G° (kJ)
(1)(2)(3)(4)(5)(6)(7)
0−118.33−62.92−199.69−66.99−23.95−2444.17
20−111.86−50.26−182.74−64.26−22.08−24.3547.08
40−105.08−37.35−165.18−61.32−20.3−24.949.75
60−97.98−24.2−147.02−58.18−18.61−25.6452.2
80−90.58−10.81−128.28−54.84−17.03−26.5754.43
100−82.862.81−108.99−51.32−23.95−27.6656.45
Table 3. Concentration of elements in solution after leaching in 1 M H2SO4 at 80 °C.
1 M H2SO4, 80 °C, L/S = 40ZnCuSnFePb
Concentration (mg/L)862020894071686.91
Table 4. Concentration of elements in solution after leaching in 1M H2SO4 at 20 °C and L/S ratio 10.
AnalyteZnCuPbSnFe
Concentration (mg/L)33,00010,71231.981221585.2
Leaching efficiency (%)98.85%94.86%0.30%79.37%78.16%
Table 5. Chemical analysis of solution before and after refining by pH adjustments.
Solution DescriptionAnalyteZnCuPbSnFe
pH 0.33
200 mL
Concentration (mg/L)33,00010,71231.981221585.2
Absolute amount (g)6.62.1420.0060.2440.118
pH 3
415 mL
Concentration (mg/L)15,8605 16214.76<LOD237.5
Absolute Me amount (g)6.5822.1420.00600.099
Me precipitation efficiency (%)0.274%0.008%4.231%100%15.787%
pH 4
425 mL
Concentration (mg/L)15,4785,03810.51<LOD4.03
Absolute Me amount (g)6.5782.1410.00400.002
Me precipitation efficiency (%)0.331%0.058%30.163%100%98.537%
Table 6. Oxidation-reduction potentials of elements present in the CAF dust.
Mex+Me(s)
Zn2+ + 2 e O x i d a t i o n Zn(s)−0.7618
Fe2+ + 2 e R e d u c t i o n Fe(s)−0.44
Ni2+ + 2 e R e d u c t i o n Ni(s)−0.25
Sn2+ + 2 e R e d u c t i o n Sn(s)−0.13
Pb2+ + 2 e R e d u c t i o n Pb(s)−0.126
Cu2+ + 2 e R e d u c t i o n Cu(s)0.34
Table 7. Chemical analysis of solution before and after cementation.
Solution DescriptionAnalyteZnCuPbSnFe
Leachate after pH adjustmentConcentration (mg/mL)15,478503810.51<LOD4.03
Absolute amount (g)6.5782.1410.00400.002
Leachate after cementation at 20 °CConcentration (mg/mL)21,0212.220.65<LOD2.01
Absolute amount (g)8.40840.0008880.0002600.000804
Cementation efficiency (%)-99.96%93.50%-59.80%
Table 8. ΔG° values of CAF dust precipitation by Na2CO3 at temperatures from 0 to 100 °C.
Temperature (°C)∆G° (kJ)
(10)(11)(12)
0−85.067−60.782−392.710
20−84.738−63.351−458.227
40−84.387−65.837−527.329
60−84.015−68.245−590.405
80−83.627−70.579−648.151
100−83.225−72.843−691.628
Table 9. Chemical analysis of solution before and after precipitation.
Solution DescriptionAnalyteZnCuPbSnFe
Leachate after cementation at 20 °CConcentration (mg/L)21 0212.220.6502.01
Absolute amount (g)0.5265.5 × 10−51.63 × 10−505.03 × 10⁻⁵
Leachate after precipitation Na2CO3Concentration (mg/L)5662.450.6501.98
Absolute amount (g)0.0146.1 × 10−51.63 × 10−504.95 × 10⁻⁵
Precipitation efficiency (%)97.31%----
Publisher’s Note: MDPI stays neutral with regard to jurisdictional claims in published maps and institutional affiliations.

