Article

Compressive Rheological Behavior and Microstructure Evolution of a Semi-Solid CuSn10P1 Alloy at Medium Temperature and Low Strain

1
Faculty of Materials Science and Engineering, Kunming University of Science and Technology, Kunming 650093, China
2
City College, Kunming University of Science and Technology, Kunming 650093, China
*
Author to whom correspondence should be addressed.
Metals 2022, 12(1), 143; https://doi.org/10.3390/met12010143
Submission received: 15 December 2021 / Revised: 7 January 2022 / Accepted: 10 January 2022 / Published: 12 January 2022

Abstract

:
Copper–tin alloys are widely used in the machining and molding of sleeves, bearings, bearing housings, gears, etc. They are a material used in heavy-duty, high-speed and high-temperature situations and subject to strong friction conditions due to their high strength, high modulus of elasticity, low coefficient of friction and good wear and corrosion resistance. Although copper–tin alloys are excellent materials, a higher performance of mechanical parts is required under extreme operating conditions. Plastic deformation is an effective way to improve the overall performance of a workpiece. In this study, medium-temperature compression tests were performed on a semi-solid CuSn10P1 alloy using a Gleeble 1500D testing machine at different temperatures (350−440 °C) and strain rates (0.1−10 s−1) to obtain its medium-temperature deformation characteristics. The experimental results show that the filamentary deformation marks appearing during the deformation are not single twins or slip lines, but a mixture of dislocations, stacking faults and twins. Within the experimental parameters, the filamentary deformation marks increase with increasing strain and decrease with increasing temperature. Twinning subdivides the grains into lamellar sheets, and dislocation aggregates are found near the twinning boundaries. The results of this study are expected to make a theoretical contribution to the forming of copper–tin alloys in post-processing processes such as rolling and forging.

1. Introduction

Copper–tin (bronze) alloys have the advantages of high strength, high modulus of elasticity, low coefficient of friction, and good wear and corrosion resistance, making them a high-performance material for use under heavy-duty, high-temperature intense friction conditions [1,2,3]. Tin bronze is widely used in the manufacture of components such as sleeves, bearings, bearing housings and gears [4,5,6]. Post-processing processes, such as rolling, forging, bending or drawing, can effectively change the overall mechanical properties of various complex precision mechanical parts [7]. However, the high-tin copper–tin alloys obtained by conventional casting processes have intergranular brittle high-tin phases distributed in coarse dendrite morphology [7,8]. The presence of coarse dendritic crystals greatly reduces the plastic processing properties of the high-tin copper–tin alloy and is detrimental to the subsequent processing process [7]. Therefore, processes such as heat treatment, 3D printing, or semi-solid-state molding are often used to change the distribution of intergranular tissues for high tin content copper–tin alloys [9,10,11]. High-tin copper alloys, such as the CuSn10P1 alloy, which has not only excellent wear and corrosion resistance, but also significant advantages such as high tensile strength and elongation [12].
Recently, the evolution of microstructure and deformation mechanisms in the plastic deformation process of copper–tin alloys have been extensively studied by Hui J et al. [6], who analyzed the evolution of the organization and mechanical properties of copper–tin alloys under strong spinning conditions. Kim, G.H et al. [13] investigated the microstructure and hot compression deformation behavior of a high tin bronze Cu-22%Sn alloy and found that solute drag creep is the deformation rate controlling mechanism of the alloy at high temperatures. Feng, Z et al. [14] studied the tissue evolution of grain boundaries and grains in tin bronze during compression at 620−720 °C. Their results showed that the subcrystallization, deformation grains and recrystallization are in competition with each other in distribution. Their results showed that subcrystalline, deformed grains and recrystallization were in competition with increasing temperature, with no obvious meritocratic orientation in distribution; the main cause of the softening of rheological stress during compressional deformation was discontinuous dynamic recrystallization (DDRX). Kim, W.J et al. [15] investigated the hot compression properties of a Cu-10 wt.% Sn alloy at different strain rates (10−3−101 s−1) and different temperatures (843−993 K). The results indicate that the interaction between solute and dislocations is responsible for the yield-like drop in the stress–strain curve; the dominant dynamic recrystallization mode at 993 K is DDRX, and the contribution of continuous dynamic recrystallization (CDRX) becomes more significant with decreasing temperature. Wang, Q et al. [16] investigated the recrystallization mechanism and tissue evolution of the semi-solid CuSn10P1 alloy during thermal deformation. The results showed that dynamic recrystallization easily occurred under low strain rate conditions; when the strain rate was 1 s−1 and the temperature was 450 °C, the recrystallization mechanism was dominated by continuous dynamic recrystallization. At present, studies on Cu-Sn alloys have focused on recrystallization behavior in thermal deformation [17,18,19,20], and there are fewer studies on deformation behavior at medium temperatures.
Controlling the cooling rate during solidification can affect the phase formation behavior and distribution of copper–tin alloys, thus changing the alloy’s mechanical properties [21,22]. In this experiment, CuSn10P1 alloy blanks were prepared by a semi-solid-state process and the evolutionary behavior of filamentary deformation marks in the blanks was studied under different process parameters.

2. Materials and Methods

In this experiment, the main chemical composition of the CuSn10P1 alloy was 10.22 wt% Sn, 0.71 wt% P, 0.17 wt% impurity elements, and Cu in sufficient amounts. The semi-solid CuSn10P1 alloy blanks were prepared using an enclosed cooling slope channel (ECSC) device developed in the laboratory [12,20]. The alloy blanks used for the medium-temperature compression tests were cylindrical in size and Φ8 mm × 12 mm. The Gleeble 1500D testing machine was used for the compression test. Figure 1a shows a schematic diagram of the compression test process parameters. The specimen was heated to the set temperature at a heating rate of 50 °C/s and held for 30 s. When the temperature was uniform throughout the specimen, the specimen was subjected to hot compression tests at a set of different strain rates (0.1, 1, 5, 10 s−1) and deformation temperatures (350, 380, 410, 440 °C). The maximum true strain of the samples was measured at 0.3, and the experiments were immediately cooled with water to preserve the microstructure. In order to characterize the tissue evolution process, the experimental stress–strain curves at 350 °C and a strain rate of 10 s−1 were imported into Deform-3D software to simulate the compression process to obtain the strain distribution at different strains.
As shown in Figure 1b, the core region of the deformed sample was selected for the energy dispersive spectroscopy (EDS) testing, scanning electron microscope (SEM) observation and transmission electron microscope (TEM) sampling. After the samples were mechanically polished, they were etched using a ferric chloride solution (5 mL ferric chloride + 10 mL hydrochloric acid + 100 mL pure water) for about 6 s. The SEM model used was the VEGA3 SBH SEM (with ULTIM MAX spectroscopy system) with a voltage of 30 KV. One hundred grains or more were selected in the SEM images and the percentage of the area marked by band deformation in the selected area was counted using image pro plus 6.0.The equipment selected for the preparation of the SEM specimens was a Gatan 691 ion polishing system. Finally, a Tecnai G2 F30 transmission electron microscope was used to test the specimens at a test voltage of 300 kV.

3. Results

3.1. Initial State of Alloy

The properties of the initial semi-solid CuSn10P1 alloy are shown in Figure 2a–e. Figure 2a shows the SEM micrographs of the alloy; apparently, the alloy microstructure consists of spherical and subspherical organization. The α-Cu phase was counted and calculated using image pro plus 6.0 [8], and its average diameter was about 70 μm. The initial semi-solid CuSn10P1 alloy consists of a total of four phases: α-Cu, δ-Cu41Sn11, Cu3P, and β’-Cu13.7Sn [12,20]. The EDS results for points 1−4 in Figure 2b are shown in Table 1. The EDS results were compared and analyzed with the pre-existing X-ray diffraction (XRD) and TEM data [12,20] to determine the distribution of the different phases in the SEM micrographs based on the elemental content. The location of point 1 is the dark black area surrounding the white area. The EDS results show that the elemental content of Sn is 2.7 At%, the elemental content of Cu is 78.5 At%, and the elemental content of P is as high as 21.5 At%. The elemental content of P in the 1-point position far exceeds the average content of P in the CuSn10Pl alloy, and the composition is close to that of the Cu3P phase. The EDS results for the black area at point 2 show that the Sn element content is 3.5 At% and the Cu element content is 96.5 At%. The black area at point 2 is inferred to be the primary α-Cu phase. Three points are located in the gray area near the white intergranular tissue, and the EDS results show that the Sn elemental content is 17.5 At% and the Cu elemental content is 82.5 At%. The gray area at point 3 is inferred to be the β’-Cu13.7Sn phase. Point 4 is the white area, and the Sn elemental content is found to be as high as 17.5 At%, while the Cu elemental content is 82.5 At%. The elemental composition at point 4 is very close to the δ-Cu41Sn11 phase, so the white area is inferred to be the δ phase. The EDS surface distribution of Sn elements in the region of Figure 2b is shown in Figure 2c, and the intergranular phase is the Sn element-enriched region. In the primary α-Cu phase, the Sn content decreases sequentially from the vicinity of the intergranular phase to the central region, i.e., there are high Sn solid solution circles (arrow areas) around the primary α-Cu phase. The EDS surface distribution of the P-element in the region of Figure 2b is shown in Figure 2d, and the dark blue area reflects the net-like distribution of the Cu3P phase in the intergranular organization. The EDS surface distribution of Cu elements in the region of Figure 2b is shown in Figure 2e, and the highest Cu content is in the region of the primary α-Cu phase.
Figure 3 shows the 3D microhardness and 3D elastic modulus mechanical properties of the semi-solid CuSn10P1 alloy blanks. The 3D microhardness of the alloy is shown in Figure 3a, and comparing it with the SEM images in Figure 2b, it can be seen that the red region with the highest hardness is the intergranular brittle phase composed of the (α-Cu+δ-Cu41Sn11+Cu3P) phase, the yellow region with lower hardness is the β’ phase, and the purple region with the lowest hardness is the matrix ductile primary α-Cu phase. The 3D elastic modulus of the alloy is shown in Figure 3b. The relationship between the elastic modulus and hardness of the material depends on the energy dissipation capacity of the material [23], where the alloy elastic modulus is highly similar to the alloy properties shown by the microhardness. The intergranular phase is the highest elastic modulus region, the β’ phase is the higher elastic modulus region, and the incipient α-Cu phase is the lowest elastic modulus region. In conclusion, the semi-solid CuSn10P1 alloy blanks have a microstructure of brittle phases wrapped around ductile phases, and the microhardness and elastic modulus of the different phases are: intergranular phase > β’ phase > incipient α-Cu phase.

3.2. Effect of Deformation Parameters on True Stress-True Strain Curve

The true stress–-true strain curves of the semi-solid CuSn10P1 alloy under different deformation conditions are shown in Figure 4. The true stress increases rapidly at the early stage of deformation (true strain ε = 0−0.02) and the process hardening effect is significant. The main reason for this is the rapid increase in dislocation density at this stage due to the proceeding slip in the elastic phase [24,25]. Then, the trend of increasing flow stress gradually decreases, mainly due to a gradual increase in the softening effect caused by dynamic recovery (DRV) [12]. In addition, heat deformation temperature and strain rate are two key factors that have a significant effect on the rheological stress of the semi-solid CuSn10P1 alloy. Specifically, it is evident from Figure 4a that the true stress values decrease with increasing deformation temperature at a constant strain rate. This may be due to the poorer interatomic bonding of the metal upon warming, as well as having more movable slip systems open.
In general, increasing the strain rate can induce a large number of dislocations; dislocations increase the work-hardening rate, which in turn significantly increases the stress values. However, as shown in Figure 4b, the stress values almost overlap at strain rates of 1, 5, and 10 s−1, i.e., the rheological behavior of the alloy is not sensitive to the strain rate. This is mainly due to the fact that the deformation heating leads to an increase in the temperature of the specimen during the deformation process. Under elevated temperature conditions, the resulting flow stress will be lower than the actual flow stress at the desired test temperature. Increasing the strain rate, the change in temperature can be calculated. Using the following equation [26]:
Δ t = 0.95 δ 0 ε σ d ε ρ C
where Δ t is the temperature change value, °C; ρ is the density, g/cm3, and CuSn10P1 alloy is 8.9 g/cm3; C is the specific heat capacity, J/(g·K), and CuSn10P1 alloy is 0.39 J/(g·K); 0.95 is the efficiency of mechanical energy into thermal energy; δ is the adiabatic correction factor; δ is 0.5, 0.75, 0.845, and 1 for true strain ε of 0.1, 1, 5, and 10, respectively. When the true strain is 0.3, the calculated temperature changes are 13.7 °C, 22.6 °C, 25.5 °C, and 29.2 °C, respectively.

3.3. Microstructure Evolution of Alloy at Medium Temperature Deformation

3.3.1. Impact of Variables

Figure 5 shows the stress distribution clouds for the semi-solid CuSn10P1 alloy at true strain levels of 0.1, 0.2 and 0.3 compressive deformation. It can be seen that the maximum value of the equivalent stress during the unidirectional compressive deformation of the alloy occurs at the core of the specimen, and the minimum value occurs at the center of the upper and lower ends of the specimen. The core part of the specimen is most prone to plastic deformation, while the two ends are not easily deformed due to frictional constraints. During the deformation process, the core deformation zone is mainly subjected to unidirectional compressive stress. SEM and TEM tests were performed later on the deformed specimens in selected central deformation-prone areas. In addition, as the degree of deformation increases, the maximum value of equivalent force also increases gradually, which is the result of process hardening produced by plastic deformation.
Figure 6 shows the microstructure of the semi-solid CuSn10P1 alloy at a strain rate of 10 s−1 and a temperature of 350 °C with different true strains. As shown in Figure 6a, no filamentary deformation sign was observed in the SEM images at a true strain ε = 0. As shown in Figure 6b, when the true strain increases to 0.1, a small number of parallel filamentary deformation marks is found in the area indicated by the red arrow. From the transmission data in Figure 6, it is clear that these filamentary deformation marks are a combination of dislocations, layer dislocations and deformation twins. The faster corrosion rate in corrosion, due to the higher energy of dislocations, laminations and deformation twin regions, is revealed in the grains. At a true strain of ε = 0.2, the filamentary deformation marks in the grain start to cross as shown in Figure 6c. This may be caused by the dislocations meeting the forward extension of the stacking faults after increasing the strain. Finally, as shown in Figure 6d, when the true strain ε = 0.3, some of the filamentary deformation marks have extended into the grain interior. This is mainly due to the fact that the greater strain causes a corresponding increase in stresses inside the alloy, prompting the generation of a large number of dislocations, stacking laminations and twins inside the grain [27]. With the increase in strain, the grain morphology changes significantly from spherical equiaxed grains to elliptical grains.
Figure 7 shows the bright-field transmission electron microscopy images of the semi-solid CuSn10P1 alloy at a strain rate of 10 s−1 and a temperature of 350 °C with different true strains. It can be visually observed that the deformation markings of the bars shift from sparse to dense. As shown in Figure 6a,b, it can be concluded from the diffraction pattern of the inset that the deformation marks observed at this point are slip lines composed of dislocations and layer dislocations. In Figure 7b, the diffraction pattern comparison shows that the slip line is parallel to the (111) plane. Note that, as shown in Figure 7c, the diffraction pattern in the inset shows that the bar deformation marker at this point is mainly composed of twins and layer errors. The twin crystals are {111}<112> typical crystallographic relationship structures. Both slip lines and twins are parallel to the (111) crystal plane, and twins may be preferentially nucleated on the (111) crystal plane where the slip lines are pre-existing. Regarding the plastic deformation mode, the slip mode becomes the main plastic deformation mode of the alloy at the true strain less than 0.2; when the true strain is 0.3, the twin mode becomes the main plastic deformation mode of the alloy. Eventually, the original coarse grains are cut and refined by twinning into lamellar organization.
Figure 8a shows a magnified image of the white boxed area A in Figure 7c, where mutually parallel twin structures are observed. Figure 8b shows a high-resolution transmission electron microscopy (HRTEM) image of the white boxed area in region B of Figure 8a, with the Filtered Fourier transformation (FFT) mode inset. The typical matrix (M)–twin (T)–substrate (M) structure is observed here. Figure 8c,d show the inverse filtered Fourier transformation (IFFT) images of the boxed areas C, D in Figure 8b, respectively. Dislocations or layer dislocations are found to meet the twin grain boundary and are present to high density dislocations in the vicinity of the twin grain boundary. The high density of dislocations has approximately the same number of opposite signs. The fact that the dislocations are located near the twin boundaries indicates that the motion of the dislocations is prevented by the twin boundaries. As shown in the E region in Figure 8c, several dislocation pairs with opposite Burgers vectors aggregate to form dislocation multipole walls in a very small region. The dislocation multipole wall creates a misorientation angle of about 17° at the nanometer size and on the surrounding lattice. In fact, this type of dislocation wall is often observed within micro-twins and matrix lamellae.

3.3.2. Effect of Deformation Temperature

Figure 9 shows the microstructure of the semi-solid CuSn10P1 alloy at different deformation temperatures at a strain rate of 10 s−1 and a true strain of 0.3. Figure 10 shows the percentage of the deformation marks area in the semi-solid CuSn10P1 alloy at different deformation temperatures of 350−440 °C and strain rates of 0.1−10 s−1 using image pro plus 6.0. From Figure 9 and Figure 10, it can be seen that the effect of deformation temperature on the microstructure is mainly manifested in the difference in the percentage of striped deformation marker region area. Under the condition of a constant strain rate, the deformation marker region area decreases with the increase in deformation temperature. This is mainly due to the fact that increasing temperature increases the slip coefficient that can be opened, while the dynamic response consumes more value-added dislocations, which is not conducive to the production of twins, and the number of deformation marks decreases significantly with the increase in temperature [27,28].

3.3.3. Effect of Strain Rate

Figure 11 shows microstructure photographs of the semi-solid CuSn10P1 alloy at different strain rates at a deformation temperature of 350 °C and a true strain of 0.3; Figure 12 shows the area percentage of striped deformation marks in the semi-solid CuSn10P1 alloy measured using image pro plus 6.0 at deformation rates of 0.1−10 s−1 and deformation temperatures of 350−440 °C. In general, increasing the strain rate results in a significant increase in the number of internal dislocation additions and work hardening of the alloy [29,30], which leads to a significant increase in deformation marks. However, it can be seen from Figure 11 and Figure 12 that the deformation rates of 1, 5, and 10 s−1 have less influence on the area share of striped deformation marks in the microstructure; the content of striped deformation marks in the microstructure decreases significantly for a deformation rate of 0.1 s−1. This is mainly due to the temperature increase effect under the high strain rate condition, and the elevated temperature promotes the softening effect of dynamic recovery. The softening effect consumes the dislocations proliferated by work-hardening, which is detrimental to the formation of deformation marks. As shown in Figure 11a and Figure 12 when the strain rate is 0.1 s−1, the material stays at this temperature long enough due to the slow deformation rate; then, the dynamics have enough time, which will weaken the dislocation plugging and work hardening.

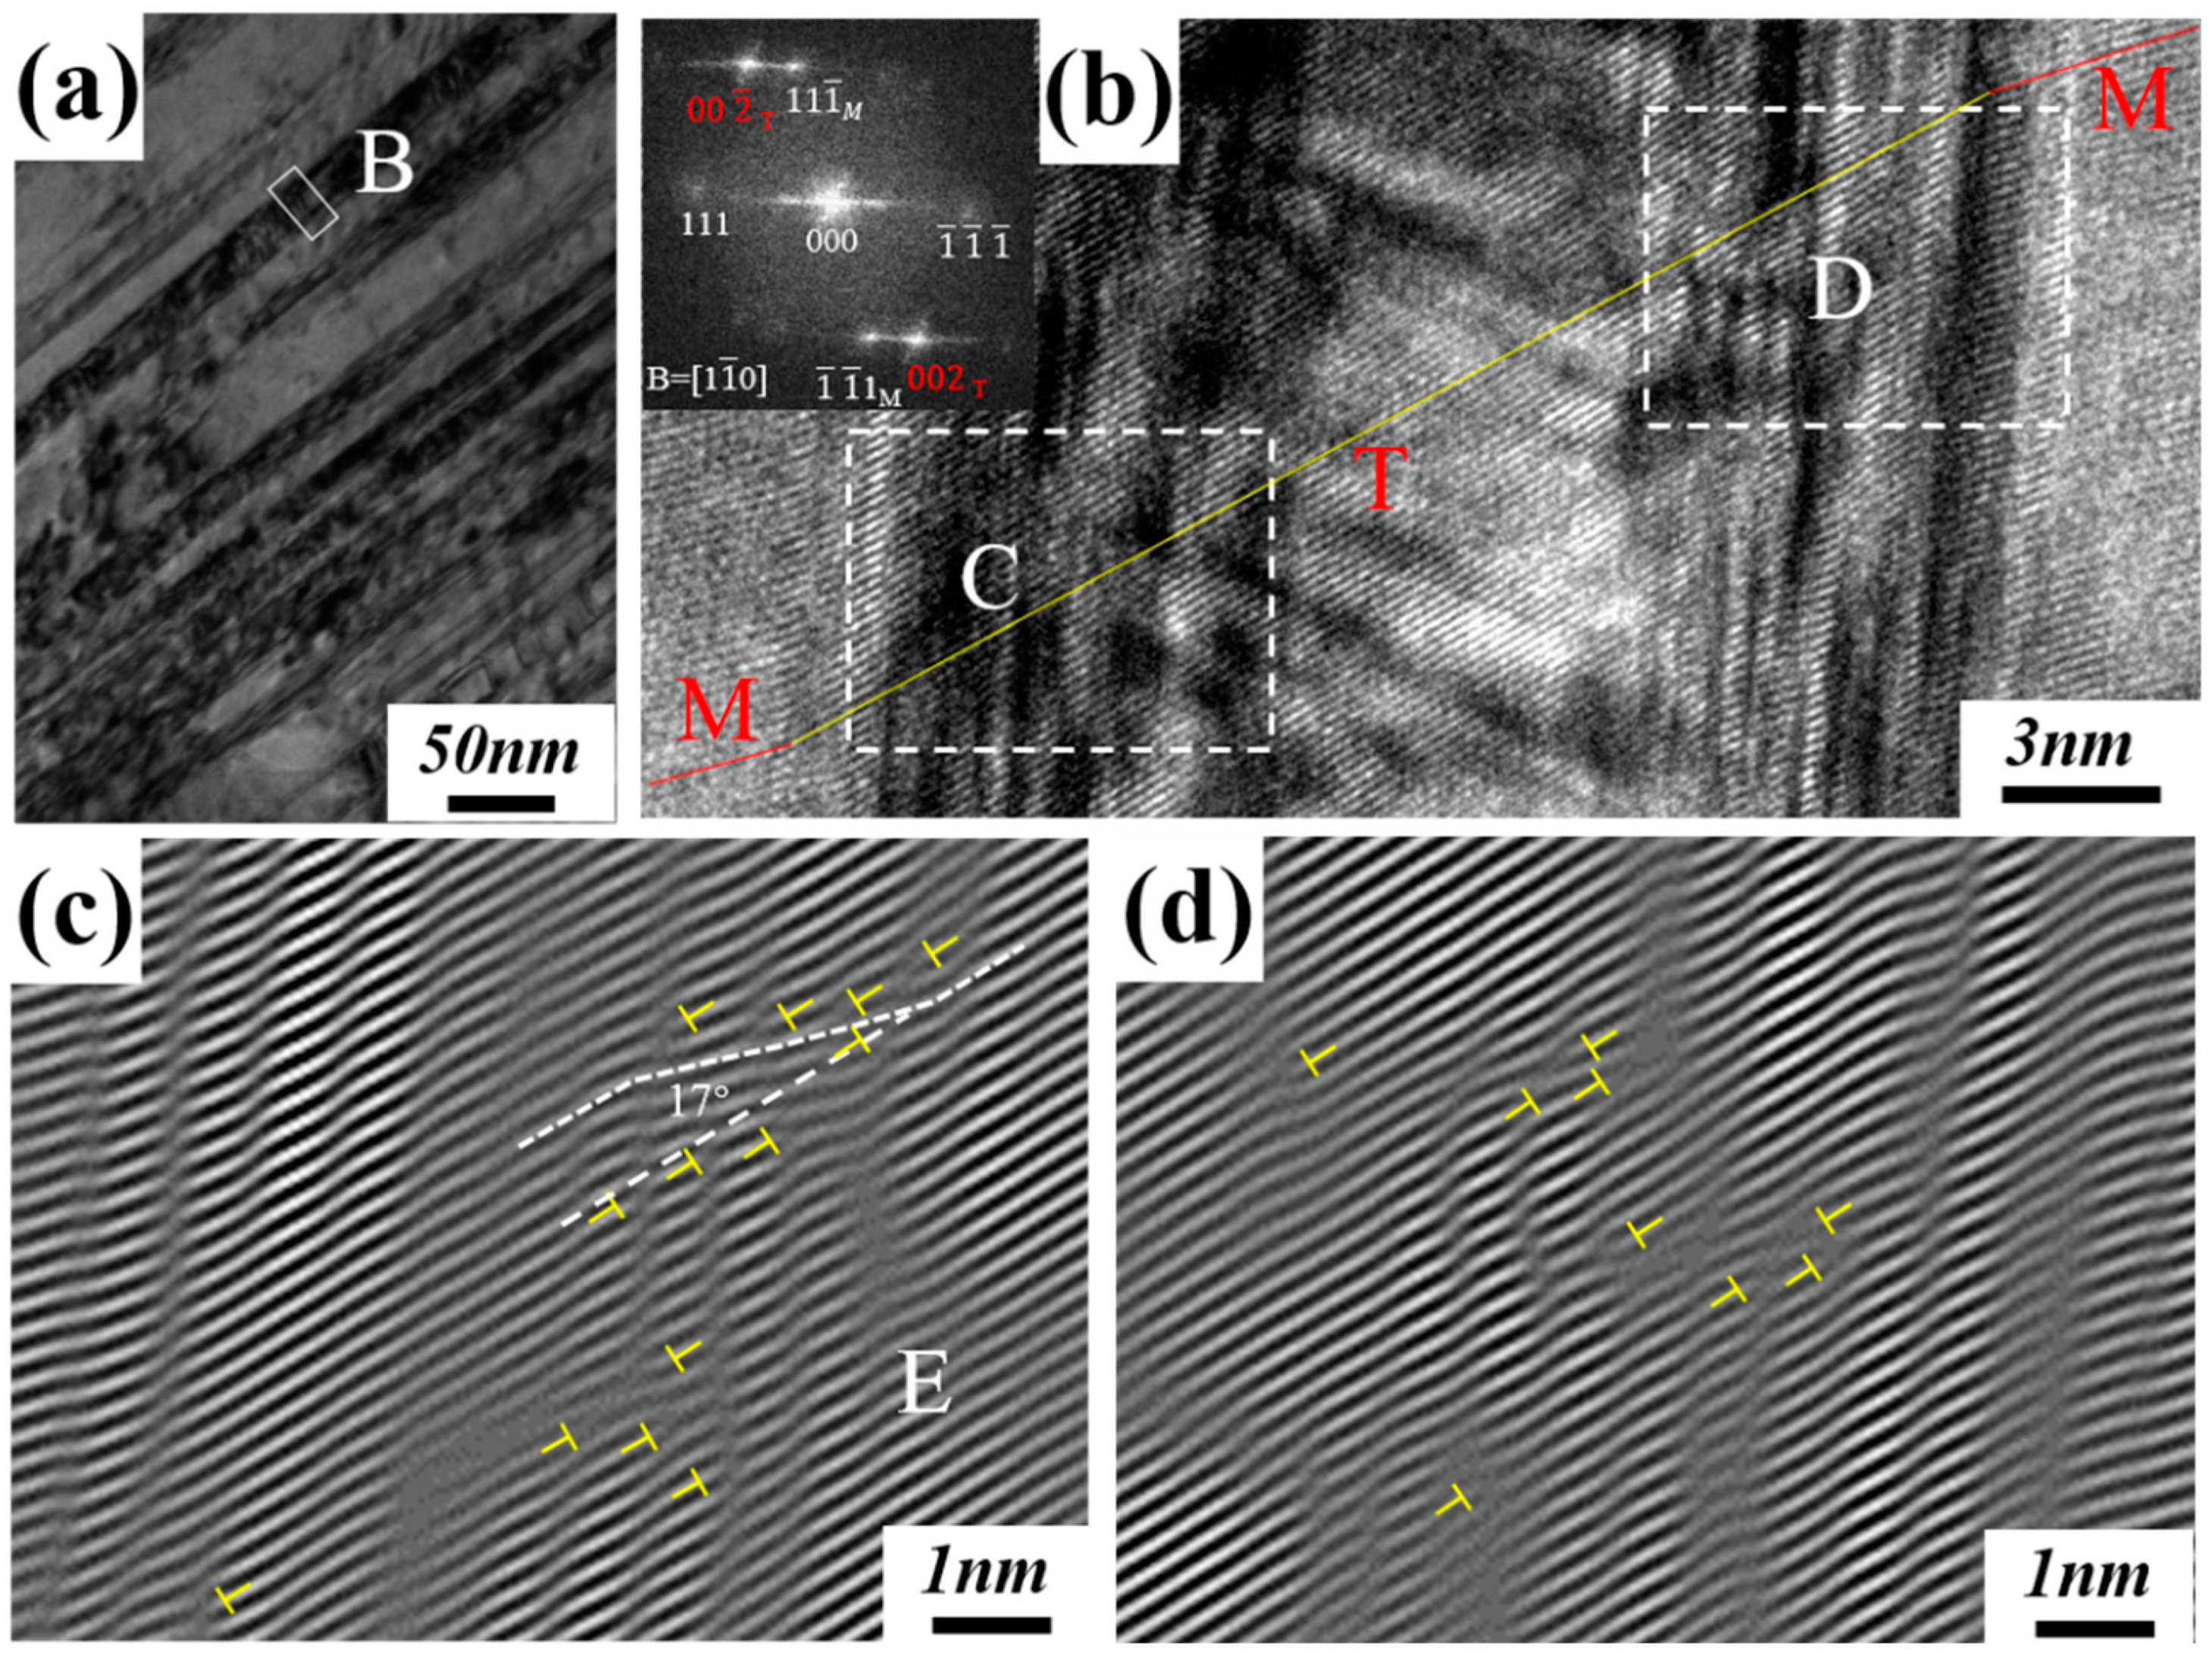
3.4. Evolution of Deformation Markers

Figure 13 shows a schematic diagram of the evolution of the deformation marks during compression testing of the semi-solid CuSn10P1 alloy. Deformation marks are not present in the original alloy without compressive deformation. After step 1, when the compressive strain is small (ε < 0.2), many slip lines are first formed in the grains near the grain boundaries. At the same time, a large number of dislocations are formed near these slip lines. This may be attributed to the continuous interaction of dislocations on different slip planes to produce lattice defects, and the interaction of lattice defects and dislocations to form slip lines at the grain boundaries by plugging. The mechanism of lattice defect formation was confirmed in molecular dynamics simulations of TiAl alloys, where the process of dislocation sliding on different planes led to the generation of a large number of crystal defects [31]. After step 2, compression should then be further increased. It is noteworthy that a large number of SFs with deformation twins are generated in the deformed grains. These layer errors and twins flatten each other. Similar to slip, twinning occurs only when the tangential stress in the twinning direction reaches the critical parting stress [32]. This may be attributed to the fact that the dislocation slip motion is impeded by the grain boundary when it reaches the grain boundary, and the dislocation pile-up forms a dislocation pile-up group at the grain boundary, resulting in a high stress concentration. The highly concentrated local stresses reach the critical stresses required for twinning and excite twinning in the grains. It is a widely accepted theory that the prerequisite for twinning is the preexistence of a certain density of dislocation groupings, where the full dislocations break up into multiple layers of dislocations on adjacent atomic planes, and these layers form twinned nuclei [33].

4. Conclusions

In this study, unidirectional isothermal compression tests were performed on a semi-solid CuSn10P1 alloy at deformation temperatures of 350−440 °C and strain rates of 0.1−10 s−1. The effects of strain, deformation temperature and strain rate on the rheological stress and microstructure of the semi-solid CuSn10P1 alloy were analyzed. The conclusions were summarized as follows:
  • The microstructure of the initial semi-solid CuSn10P1 alloy is nearly spherical, with a high-tin solid-solution circle around its primary α-Cu phase. The intergranular phase of the alloy is a brittle phase with high tin content composed of (α-Cu+δ-Cu41Sn11+Cu3P) phases. The microhardness and elastic modulus of the different phases in the alloy are intergranular phase > β’ > incipient α-Cu phase.
  • At a certain strain rate, the rheological stress of the alloy decreases with the increase in deformation temperature; at higher strain rates, the rheological stress of the alloy is not sensitive to the strain rate due to the softening effect of the rise in temperature.
  • The simulation results show that the alloy is deformed in unidirectional compression, where the stress in the core is the largest, called the stress concentration zone. As the degree of deformation increases, the maximum value of the equivalent stress also increases gradually.
  • With the increase in strain, filamentary deformation marks appear. The deformation marks are composed of dislocations, stacking faults and twins. The number of deformation marks increases with the increase in strain and strain rate and decreases with the increase in temperature.
  • Twin crystals may be preferentially nucleated at the crystal plane where the slip lines exist in advance, and a large amount of dislocation plugging is found near the twin boundary.

Author Contributions

R.Z. and Z.L. designed most of the experiments, analyzed the results and wrote this manuscript. Z.L. and W.X. performed most experiments. Z.H., T.L. and Y.L. helped analyze the experiment data and gave some constructive suggestions about how to write this manuscript. All authors have read and agreed to the published version of the manuscript.

Funding

This research was supported by the Natural Science Foundation of China (Project No. 5176050239).

Acknowledgments

The authors acknowledge funding for the research from the National Science Foundation of China (5176050239). This work is supported by National-local Joint Engineering Laboratory of Metal Advanced Solidification Forming and Equipment Technology of China.

Conflicts of Interest

The funders had no role in the design of the study; in the collection, analyses, or interpretation of data; in the writing of the manuscript, or in the decision to publish the results.

References

  1. Jie, S.; Ting-yun, M.; Hui-xuan, Q.; Qi-song, L. Electrochemical behaviors and electrodeposition of single-phase Cu-Sn alloy coating in [BMIM]Cl. Electrochim. Acta 2019, 297, 87–93. [Google Scholar] [CrossRef]
  2. Gohar, G.A.; Manzoor, T.; Ahmad, A.; Raza, H.; Farooq, A.; Karim, I.; Iftikhar, W.; Umar, M.; Asad, F. Synthesis and investigate the properties of Cu–Al–Ni alloys with Ag addition using powder metallurgy technique. J. Alloys Compd. 2020, 817, 153281. [Google Scholar] [CrossRef]
  3. Liu, Y.; Wang, L.; Jiang, K.; Yang, S. Electro-deposition preparation of self-standing Cu-Sn alloy anode electrode for lithium ion battery. J. Alloys Compd. 2019, 775, 818–825. [Google Scholar] [CrossRef]
  4. Mu, D.; Nan, P.H.; Wang, J.Y.; Song, G.D.; Luo, W.G. Metallurgical and Chemical Characterization of Bronze Remains Found at the Houhe Site in Shanxi Province, China. JOM 2015, 67, 1659–1666. [Google Scholar] [CrossRef]
  5. Kohler, F.; Germond, L.; Wagnière, J.D.; Rappaz, M. Peritectic solidification of Cu–Sn alloys: Microstructural competition at low speed. Acta Mater. 2009, 57, 56–68. [Google Scholar] [CrossRef] [Green Version]
  6. Hui, J.; Feng, Z.; Fan, W.; Yuan, X. The influence of power spinning and annealing temperature on microstructures and properties of Cu-Sn alloy. Mater. Charact. 2018, 144, 611–620. [Google Scholar] [CrossRef]
  7. So, S.; Kim, K.; Lee, S.; Yu, Y.; Lim, H.; Oh, M. Effects of Sn content and hot deformation on microstructure and mechanical properties of binary high Sn content Cu–Sn alloys. Mater. Sci. Eng. A 2020, 796, 140054. [Google Scholar] [CrossRef]
  8. Li, Y.; Zhou, R.; Li, L.; Xiao, H.; Jiang, Y. Microstructure and Properties of Semi-solid ZCuSn10P1 Alloy Processed with an Enclosed Cooling Slope Channel. Metals 2018, 8, 275. [Google Scholar] [CrossRef] [Green Version]
  9. Fan, W.; Hui, J.; XinFeng, Z.; Gao, W.; Xue, C. Effect of different annealing temperatures on microstructures and properties of Cu–Sn Alloy. Mater. Res. Express 2018, 5, 106520. [Google Scholar] [CrossRef]
  10. Scudino, S.; Unterdörfer, C.; Prashanth, K.G.; Attar, H.; Ellendt, N.; Uhlenwinkel, V.; Eckert, J. Additive manufacturing of Cu–10Sn bronze. Mater. Lett. 2015, 156, 202–204. [Google Scholar] [CrossRef]
  11. Li, Y.; Zhou, R.; Li, L.; Xiao, H.; Jiang, Y. Microstructures formation, distribution of tin element and properties of CuSn10P1 alloy during controlled by melt cooling. Mater. Res. Express 2018, 5, 66517. [Google Scholar] [CrossRef]
  12. Li, Y.; Li, L.; Geng, B.; Wang, Q.; Zhou, R.; Wu, X.; Xiao, H. Microstructure characteristics and strengthening mechanism of semisolid CuSn10P1 alloys. Mater. Charact. 2021, 172, 110898. [Google Scholar] [CrossRef]
  13. Yang, J.Y.; Kim, G.H.; Kim, W.J. High-strain-rate solute drag creep in a Cu-22%Sn alloy (Cu17Sn3) with near peritectic composition. Mater. Charact. 2020, 164, 110325. [Google Scholar] [CrossRef]
  14. Hui, J.; Feng, Z.; Fan, W.; Wang, P. Microstructures and mechanical properties of Cu-Sn alloy subjected to elevated-temperature heat deformation. Mater. Res. Express 2018, 5, 46511. [Google Scholar] [CrossRef]
  15. Yang, J.Y.; Kim, W.J. The effect of addition of Sn to copper on hot compressive deformation mechanisms, microstructural evolution and processing maps. J. Mater. Res. Technol. 2020, 9, 749–761. [Google Scholar] [CrossRef]
  16. Wang, Q.; Zhou, R.; Li, Y.; Geng, B. Characteristics of dynamic recrystallization in semi-solid CuSn10P1 alloy during hot deformation. Mater. Charact. 2020, 159, 109996. [Google Scholar] [CrossRef]
  17. Hui, J.; Feng, Z.; Xue, C.; Gao, W. Effects of hot compression on distribution of Σ3n boundary and mechanical properties in Cu–Sn alloy. J. Mater. Sci. 2018, 53, 15308–15318. [Google Scholar] [CrossRef]
  18. McDonald, D.T.; Humphreys, J.F.; Bate, P.S.; Brough, I. Dynamic Recrystallization in Copper and Copper-Tin Alloys. Mater. Sci. Forum 2007, 558–559, 449–456. [Google Scholar] [CrossRef]
  19. Cram, D.G.; Fang, X.Y.; Zurob, H.S.; Bréchet, Y.J.M.; Hutchinson, C.R. The effect of solute on discontinuous dynamic recrystallization. Acta Mater. 2012, 60, 6390–6404. [Google Scholar] [CrossRef]
  20. Wang, Q.; Zhou, R.; Guan, J.; Wang, C. The deformation compatibility and recrystallisation behaviour of the alloy CuSn10P1. Mater. Charact. 2021, 174, 110940. [Google Scholar] [CrossRef]
  21. Li, X.; Ivas, T.; Spierings, A.B.; Wegener, K.; Leinenbach, C. Phase and microstructure formation in rapidly solidified Cu-Sn and Cu-Sn-Ti alloys. J. Alloys Compd. 2018, 735, 1374–1382. [Google Scholar] [CrossRef]
  22. Valloton, J.; Wagnière, J.D.; Rappaz, M. Competition of the primary and peritectic phases in hypoperitectic Cu–Sn alloys solidified at low speed in a diffusive regime. Acta Mater. 2012, 60, 3840–3848. [Google Scholar] [CrossRef] [Green Version]
  23. Bao, Y.W.; Wang, W.; Zhou, Y.C. Investigation of the relationship between elastic modulus and hardness based on depth-sensing indentation measurements. Acta Mater. 2004, 52, 5397–5404. [Google Scholar] [CrossRef]
  24. Feaugas, X. On the origin of the tensile flow stress in the stainless steel AISI 316L at 300 K: Back stress and effective stress. Acta Mater. 1999, 47, 3617–3632. [Google Scholar] [CrossRef]
  25. Kocks, U.F.; Mecking, H. Physics and phenomenology of strain hardening: The FCC case. Prog. Mater. Sci. 2003, 48, 171–273. [Google Scholar] [CrossRef]
  26. Goetz, R.L.; Semiatin, S.L. The Adiabatic Correction Factor for Deformation Heating During the Uniaxial Compression Test. J. Mater. Eng. Perform. 2001, 10, 710–717. [Google Scholar] [CrossRef]
  27. Xiao, G.H.; Tao, N.R.; Lu, K. Effects of strain, strain rate and temperature on deformation twinning in a Cu–Zn alloy. Scr. Mater. 2008, 59, 975–978. [Google Scholar] [CrossRef]
  28. Brasche, F.; Wang, J.; Timokhina, I.; Haase, C.; Lapovok, R.; Molodov, D.A. Mechanical twinning and texture evolution during asymmetric warm rolling of a high manganese steel. Mater. Sci. Eng. A 2019, 764, 138183. [Google Scholar] [CrossRef]
  29. Xuefeng, X.; Tayyeb, A.; Lin, W.; Huanwu, C.; Zhe, Z.; Zixuan, N.; Xiaopin, L.; Anjin, L.; Binbin, Z.; Xingwang, C. Research on dynamic compression properties and deformation mechanism of Ti6321 titanium alloy. J. Mater. Res. Technol. 2020, 9, 11509–11516. [Google Scholar] [CrossRef]
  30. Wang, J.; Li, S.; Ma, H. Evolution of Microstructure, Texture, and Mechanical Properties of As-Extruded ND/ZK60 Composite during Hot Compression Deformation. Metals 2020, 10, 1191. [Google Scholar] [CrossRef]
  31. Xu, D.S.; Wang, H.; Yang, R.; Veyssière, P. Point defect formation by dislocation reactions in TiAl. IOP Conf. Ser. Mater. Sci. Eng. 2009, 3, 12024. [Google Scholar] [CrossRef]
  32. Beyerlein, I.J.; McCabe, R.J.; Tomé, C.N. Effect of microstructure on the nucleation of deformation twins in polycrystalline high-purity magnesium: A multi-scale modeling study. J. Mech. Phys. Solids 2011, 59, 988–1003. [Google Scholar] [CrossRef]
  33. Meyers, M.A.; Vöhringer, O.; Lubarda, V.A. The onset of twinning in metals: A constitutive description. Acta Mater. 2001, 49, 4025–4039. [Google Scholar] [CrossRef]
Figure 1. (a) Schematic diagram of compression test process parameters, (b) schematic diagram of compression and cut samples of deformed samples.
Metals 12 00143 g001
Figure 2. Initial semi-solid CuSn10P1 alloy blanks: (a) SEM image, (b) local magnification, (c) Figure 2 (b) Sn element distribution, (d) Figure 2 (b) P element distribution, (e) Figure 2 (b) Cu element distribution (arrows indicate high Sn solid solution circle regions).
Metals 12 00143 g002
Figure 3. Characteristics of the initial semi-solid CuSn10P1 alloy: (a) 3D microhardness, (b) 3D modulus of elasticity.
Metals 12 00143 g003
Figure 4. True stress–true strain curve for semi-solid CuSn10P1 alloy: (a) at strain rate of 10 s−1 and temperatures of 350−440 °C, (b) at temperature of 350 °C and strain rates of 0.1−10 s−1.
Metals 12 00143 g004
Figure 5. Stress distribution clouds for semi-solid CuSn10P1 alloy copper at different levels of compressive deformation: (a) ε = 0.1, (b) ε = 0.2, (c) ε = 0.3.
Metals 12 00143 g005
Figure 6. Microstructure of semi-solid CuSn10P1 alloy at a strain rate of 10 s−1 and temperature of 350 °C with different true strains (arrows indicate deformation marks): (a) ε = 0.0, (b) ε = 0.1, (c) ε = 0.2, (d) ε = 0.3.
Metals 12 00143 g006
Figure 7. Bright-field transmission electron microscopy images of the semi-solid CuSn10P1 alloy at a strain rate of 10 s −1 and a temperature of 350 °C with different true strains, inset with selected area electron diffraction (SAED) patterns: (a) ε = 0.1, (b) ε = 0.2, and (c) ε = 0.3.
Metals 12 00143 g007
Figure 8. (a) Enlarged image of the white boxed region in Figure 7c, (b) high-resolution transmission electron microscopy (HRTEM) image of the white boxed region in Figure 8a region B (inset is filtered Fourier transformation (FFT) mode), (c) Figure 8b white boxed area of region B corresponding (11 1 )M and (00 2 )T inverse filtered Fourier transformation (IFFT) images, (d) Figure 8b white boxed area of region c corresponding (11 1 )M and (00 2 )T IFFT images.
Metals 12 00143 g008
Figure 9. SEM images of the solid CuSn10P1 alloy at a strain rate of 10 s−1 and isothermal compression at different deformation temperatures, deformed to ε = 0.3: (a) 350 °C, (b) 380 °C (c) 410 °C, (d) 440 °C. (Arrows indicate deformation marks).
Metals 12 00143 g009
Figure 10. Statistics of the percentage of deformation marking area in the semi-solid CuSn10P1 alloy at different temperatures.
Metals 12 00143 g010
Figure 11. Microstructural evolution of the semi-solid CuSn10P1 alloy at 350 °C with different strain rates: (a) ε ˙ = 0.1 s−1, (b) ε ˙ = 1 s−1, (c) ε ˙ = 5 s−1, (d) ε ˙ = 10 s−1 (arrows indicate deformation marks).
Metals 12 00143 g011
Figure 12. Statistics of the percentage of deformation marking area in the semi-solid CuSn10P1 alloy at different strain rates.
Metals 12 00143 g012
Figure 13. Schematic diagram of the evolution of the deformation marks during the medium-temperature compressive deformation of the semi-solid CuSn10P1 alloy.
Metals 12 00143 g013
Table 1. Test results of the energy dispersive spectroscopy (EDS) points at different positions of semi-solid CuSn10P1 alloys (at.%).
ElementelPoints
1234
Cu98.894.475.382.8
Sn1.26.51.217.2
P0023.50
Publisher’s Note: MDPI stays neutral with regard to jurisdictional claims in published maps and institutional affiliations.

