
Using Plane Strain Compression Test to Evaluate the Mechanical Behavior of Magnesium Processed by HPT

 and
and 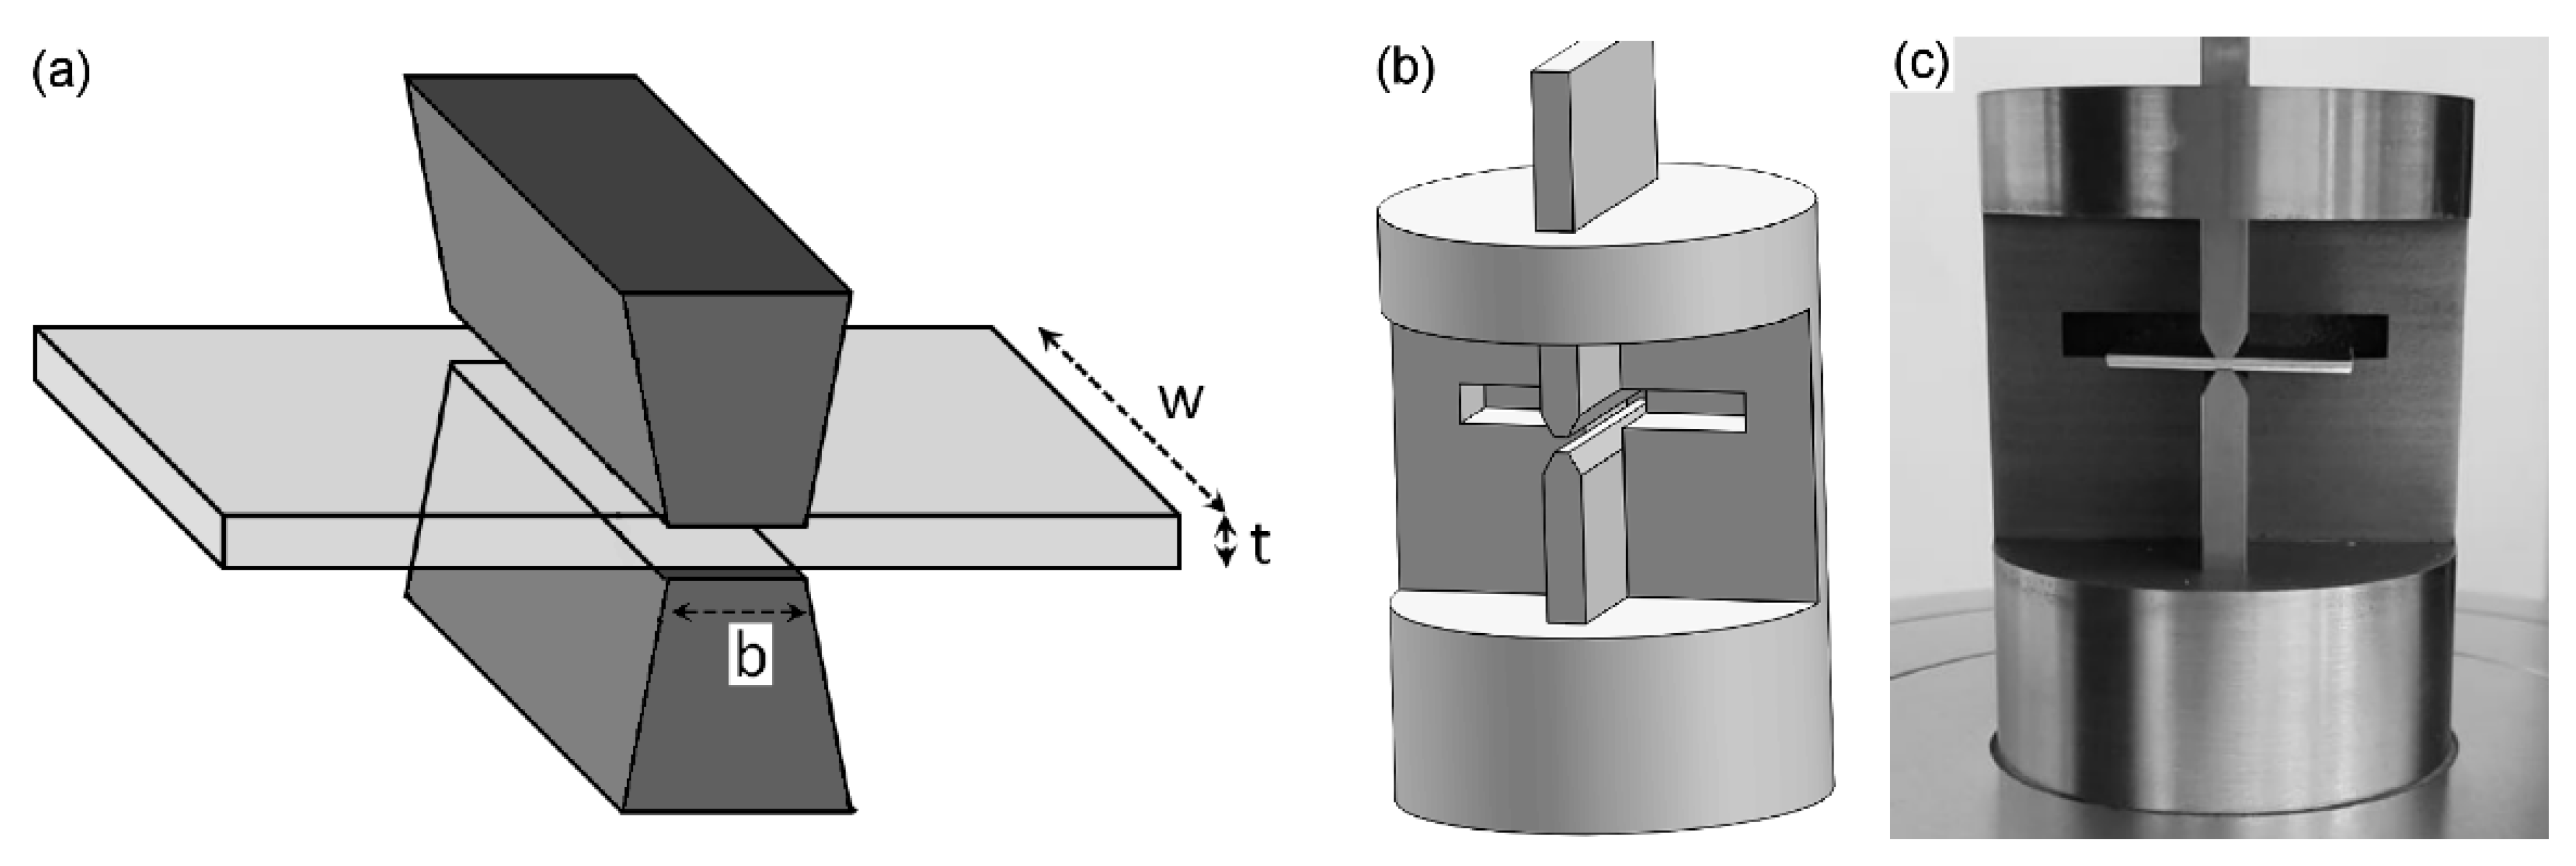
Abstract
:1. Introduction
2. Procedure
2.1. Design of the PSC Tool
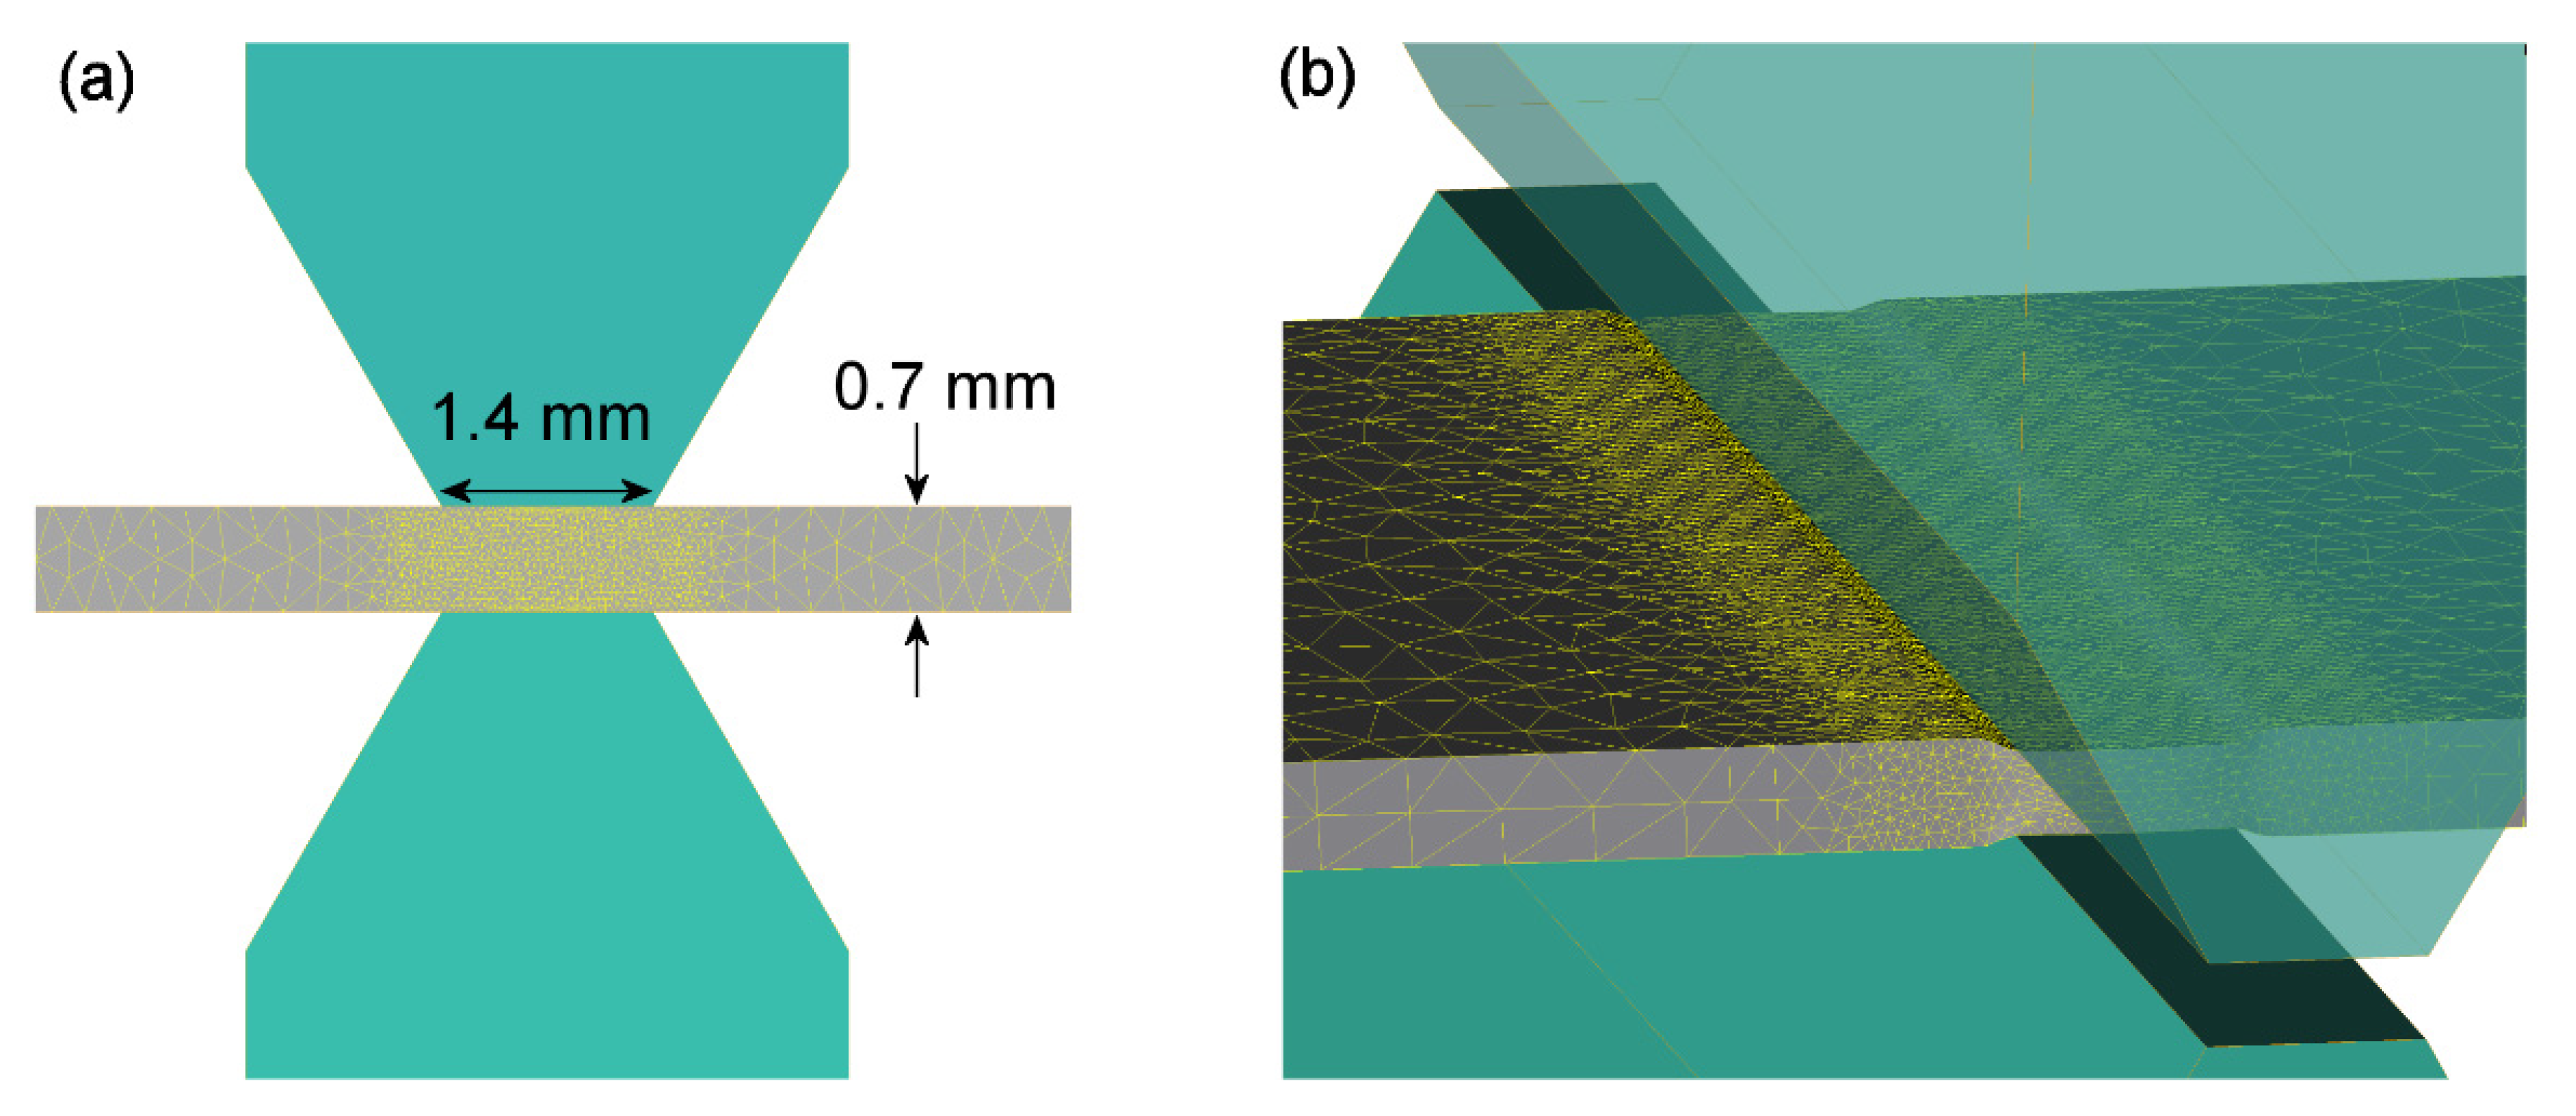
2.2. Finite Element Modeling
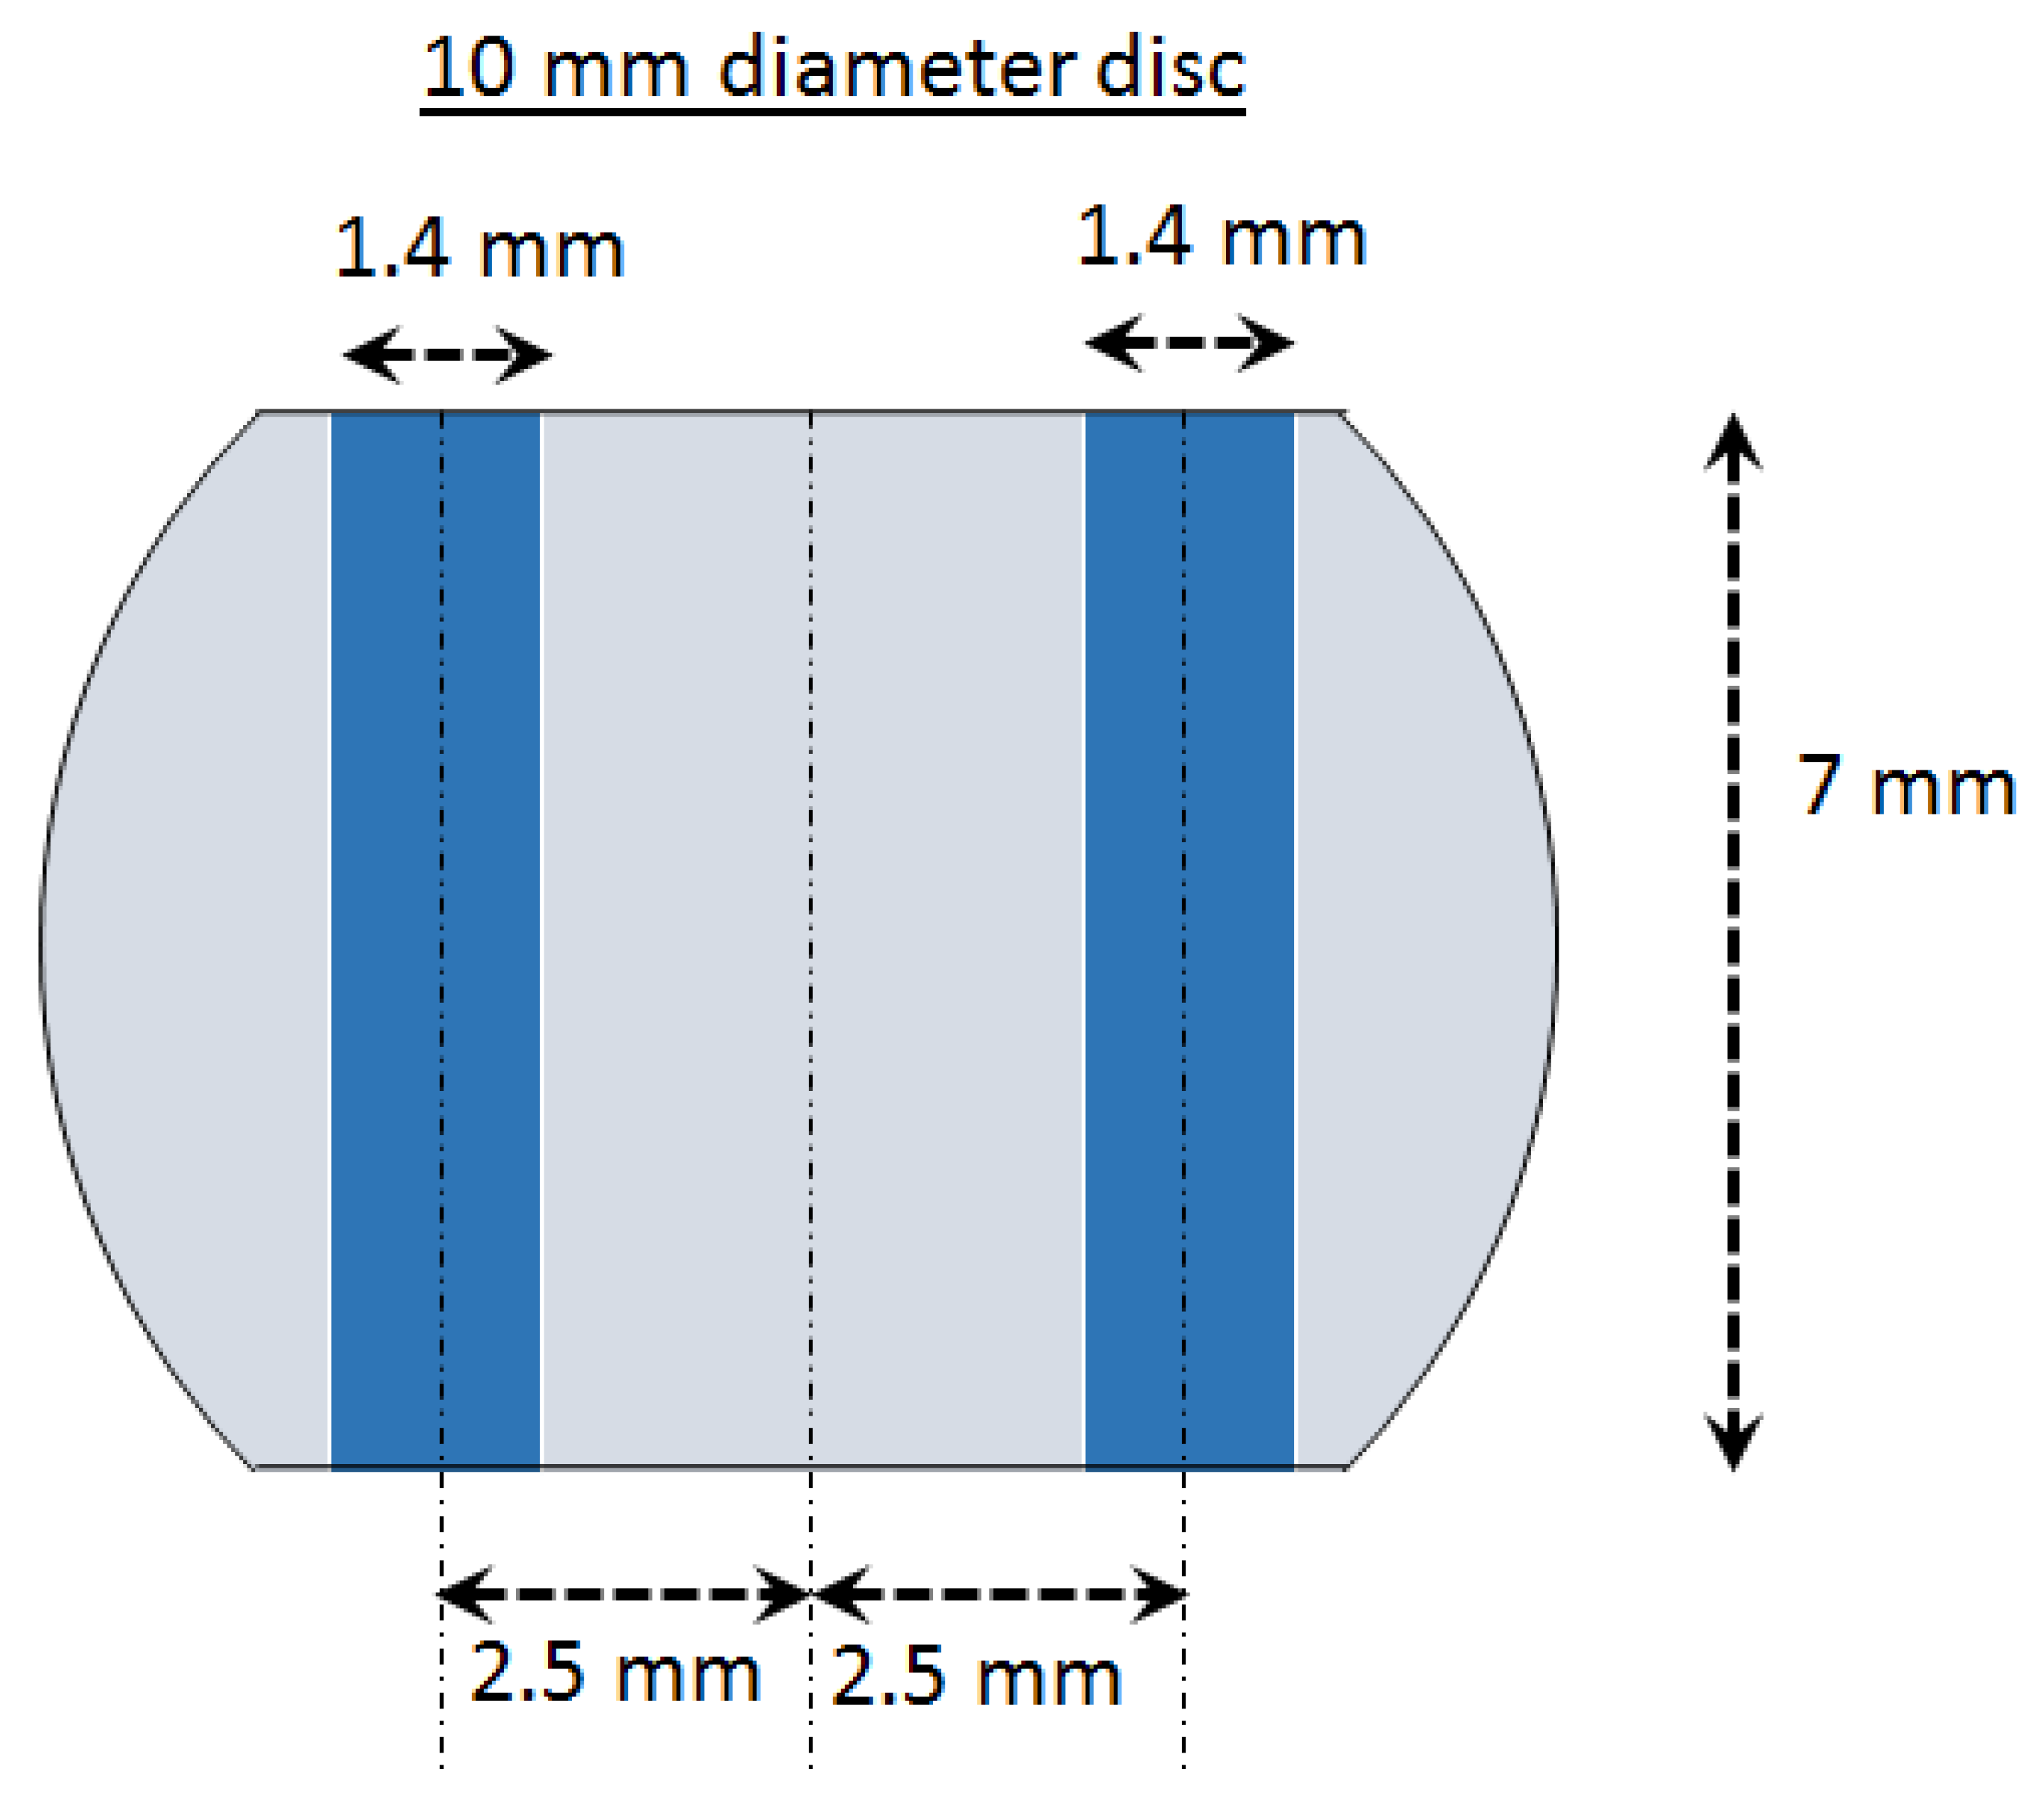
2.3. Experimental Tests in Magnesium
3. Results
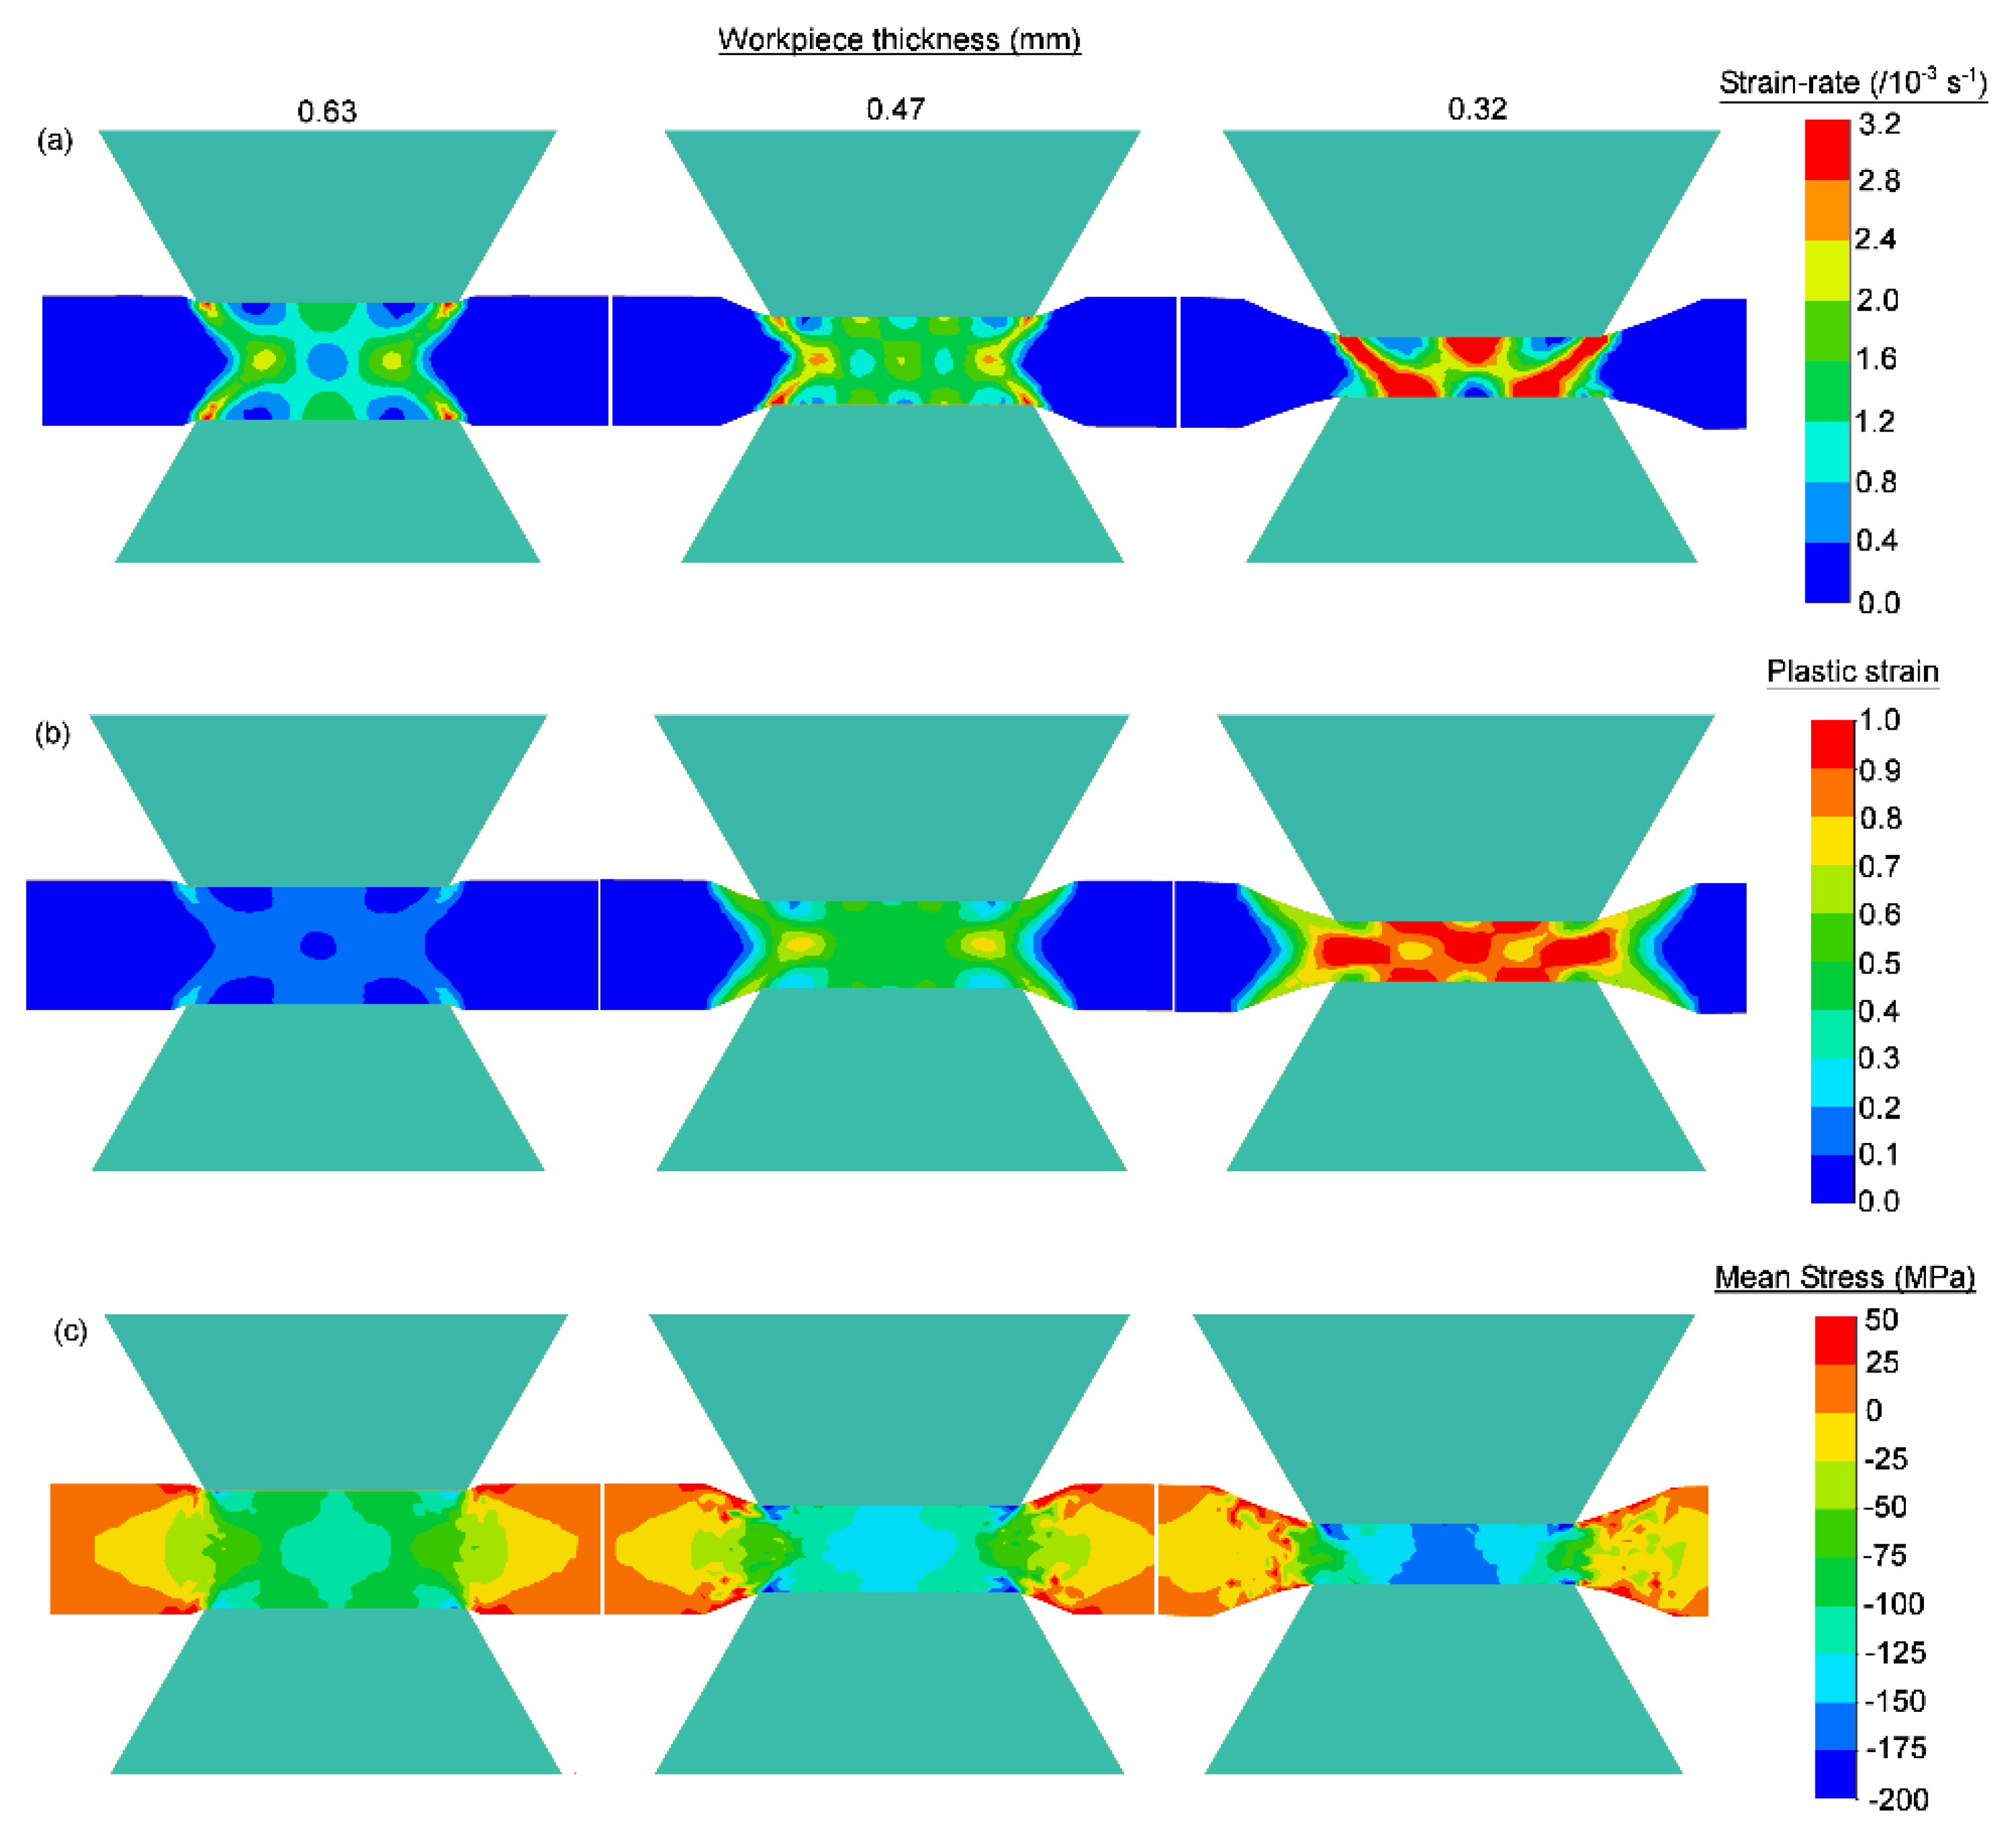
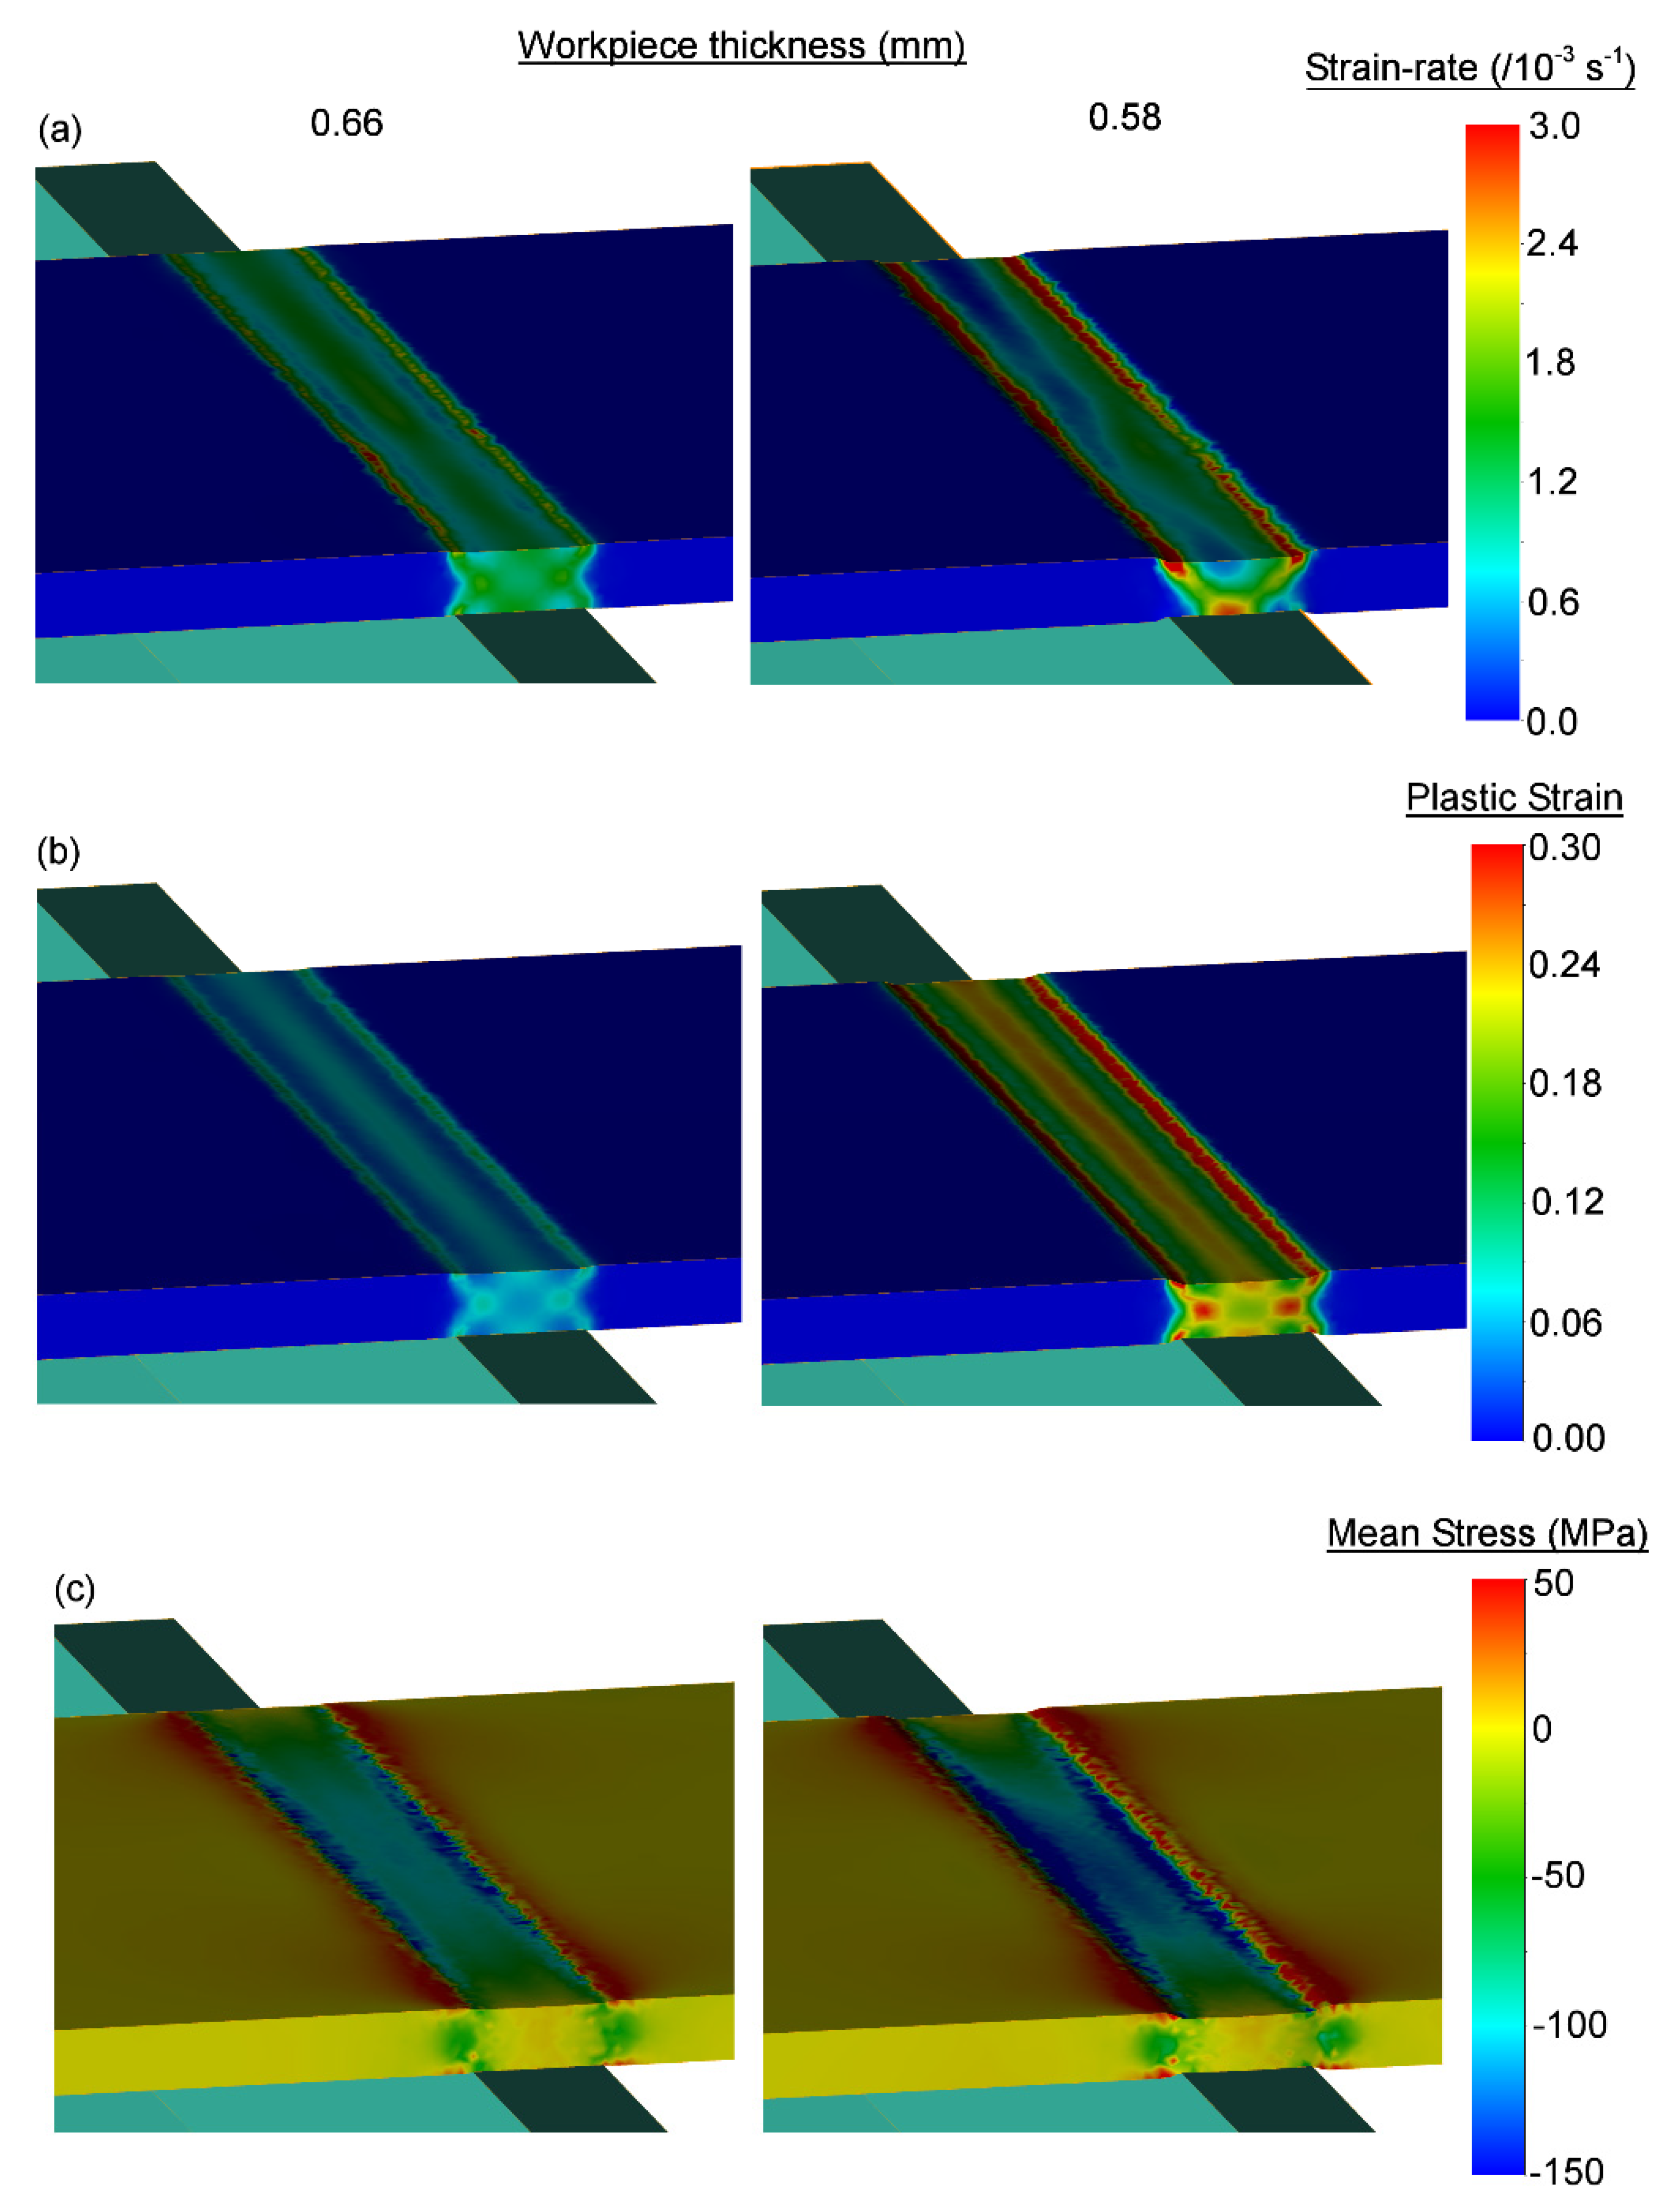
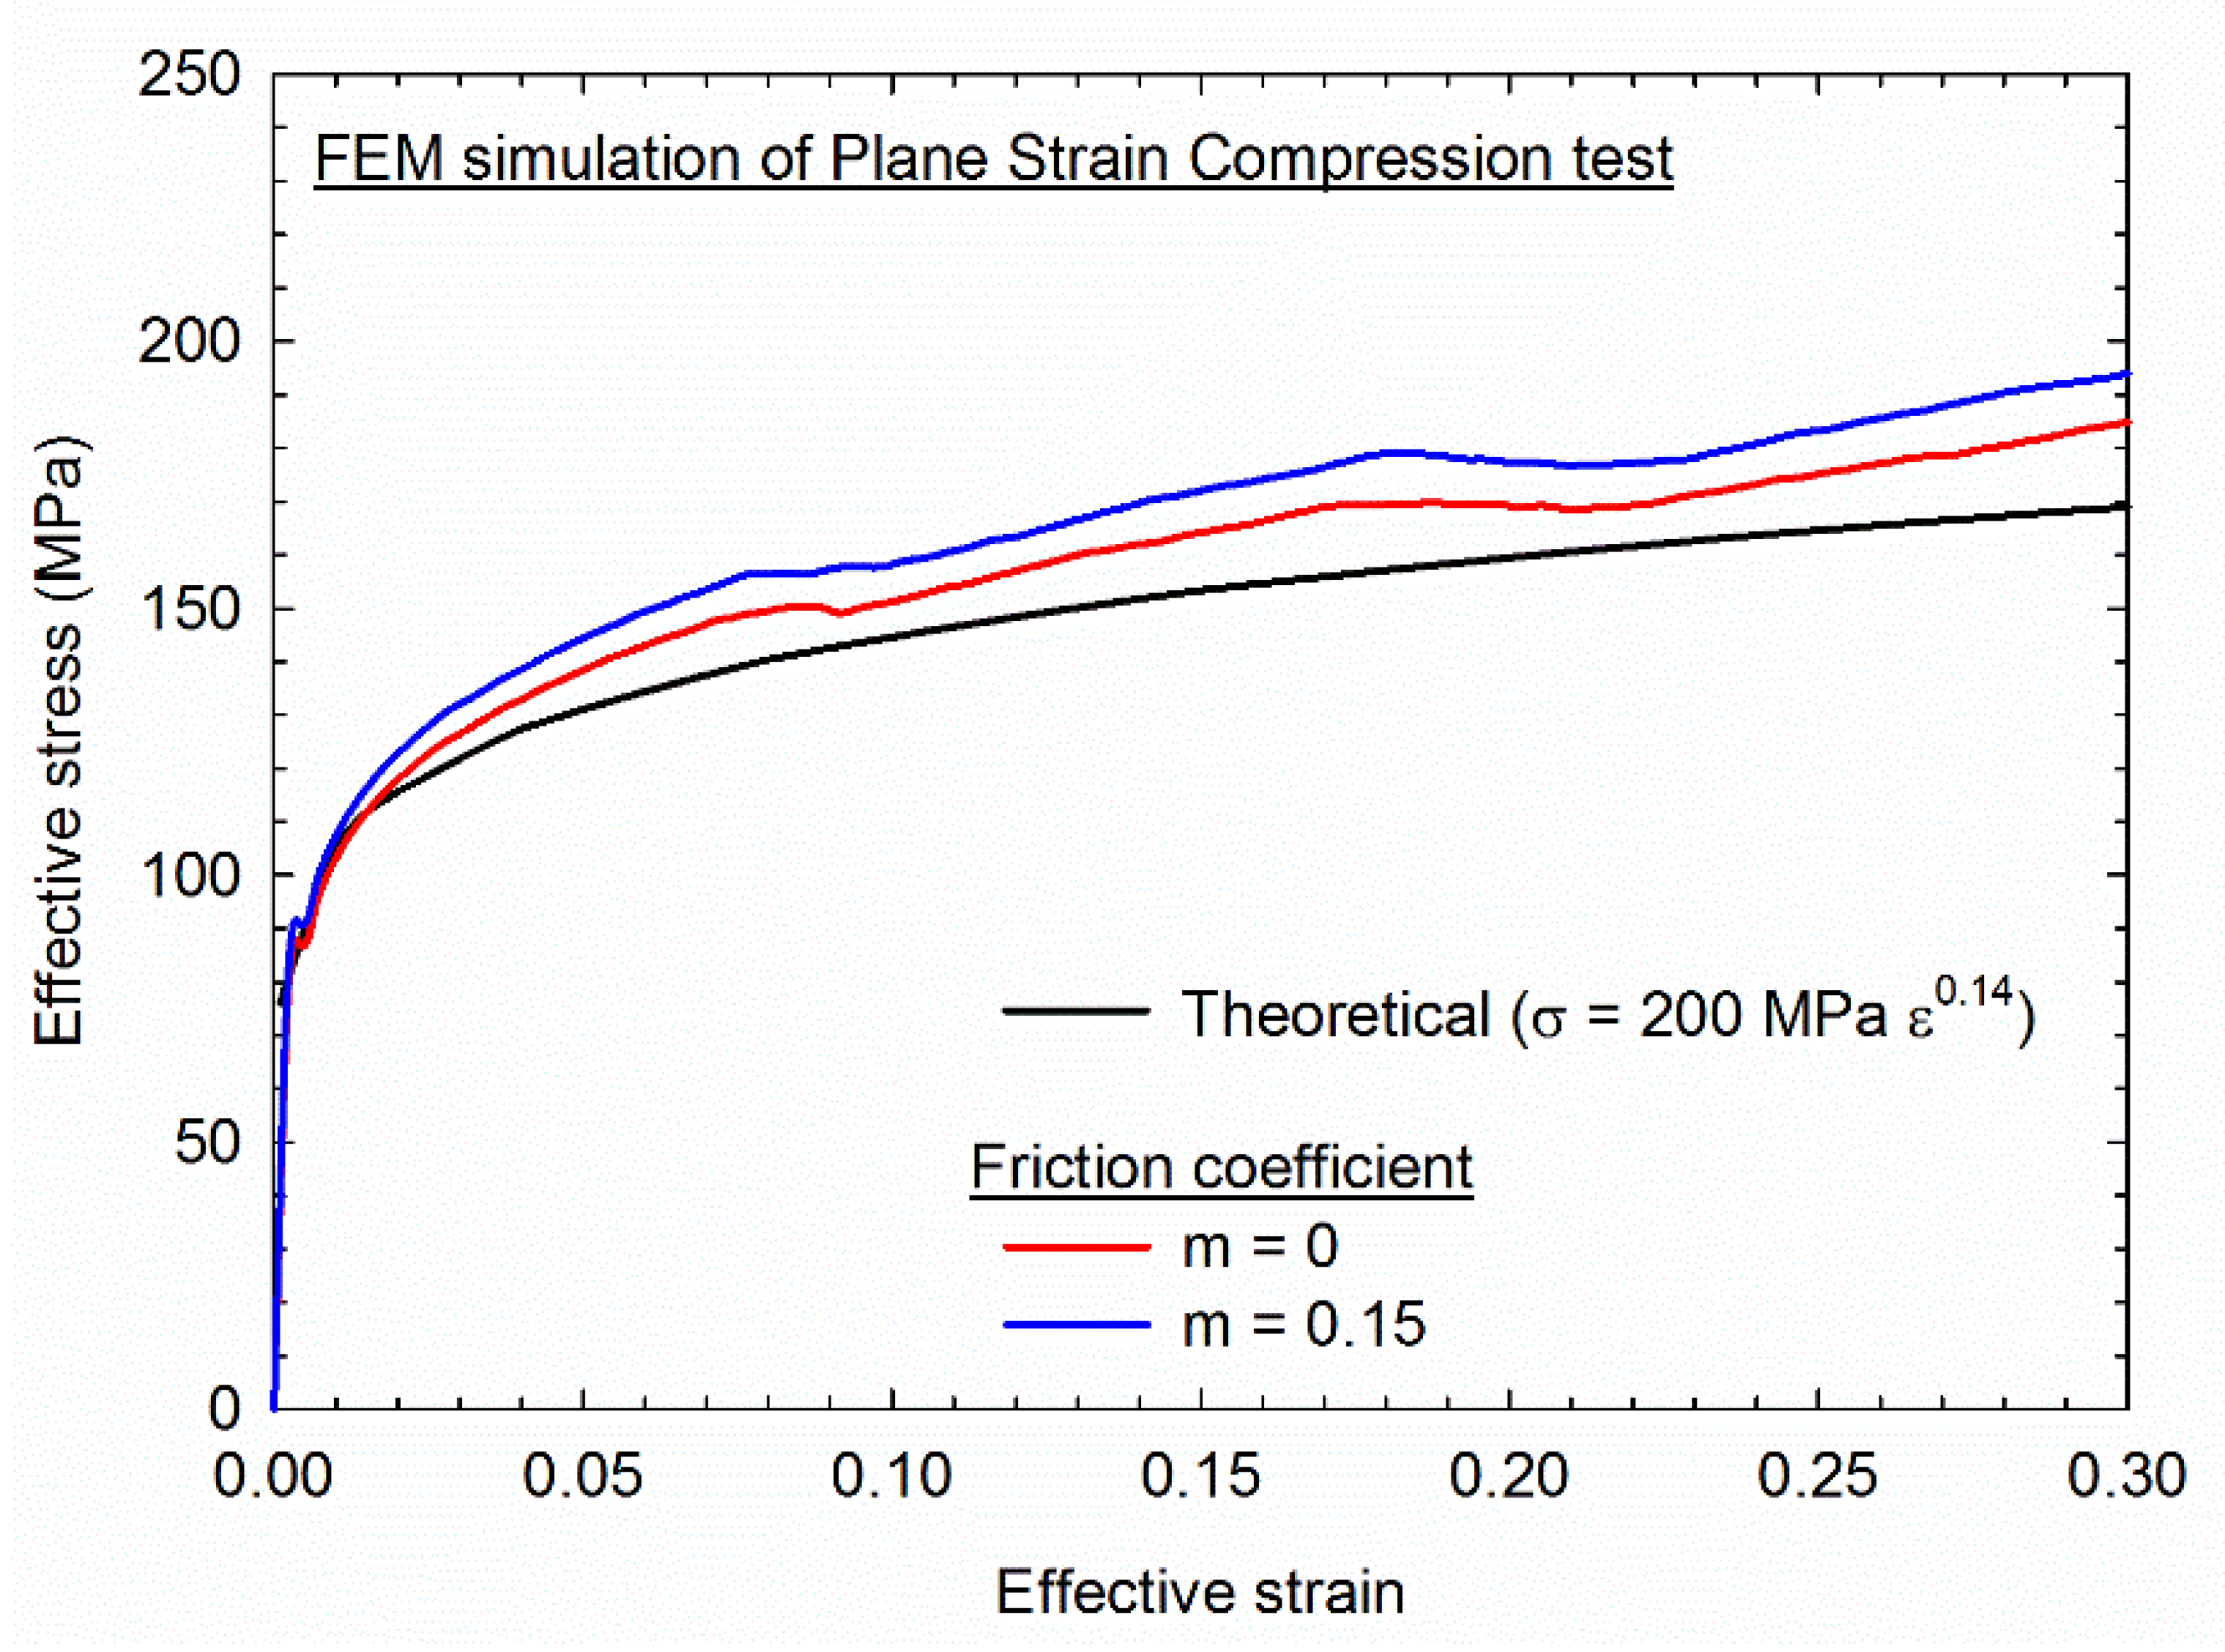
3.1. Finite Element Modeling
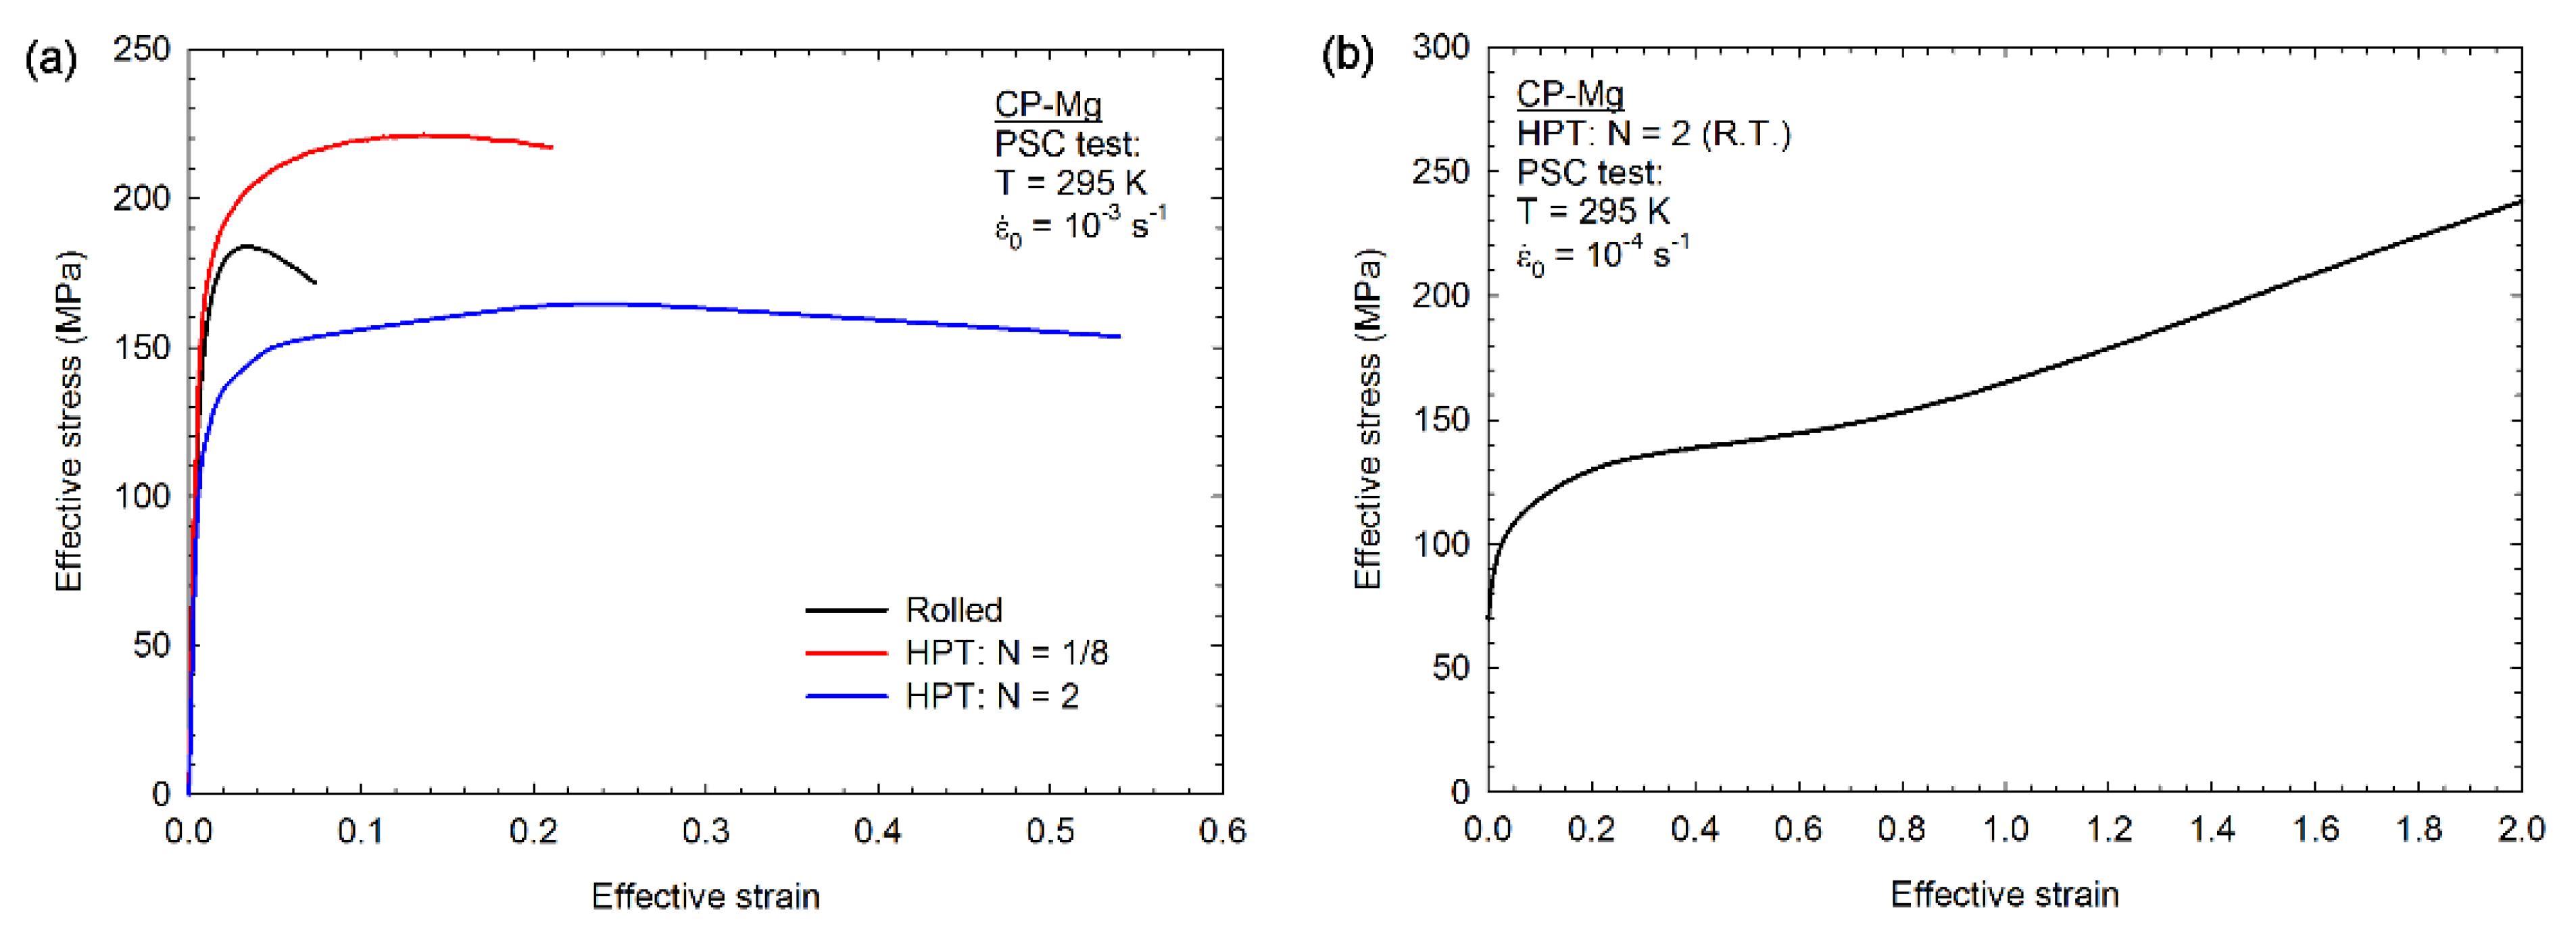
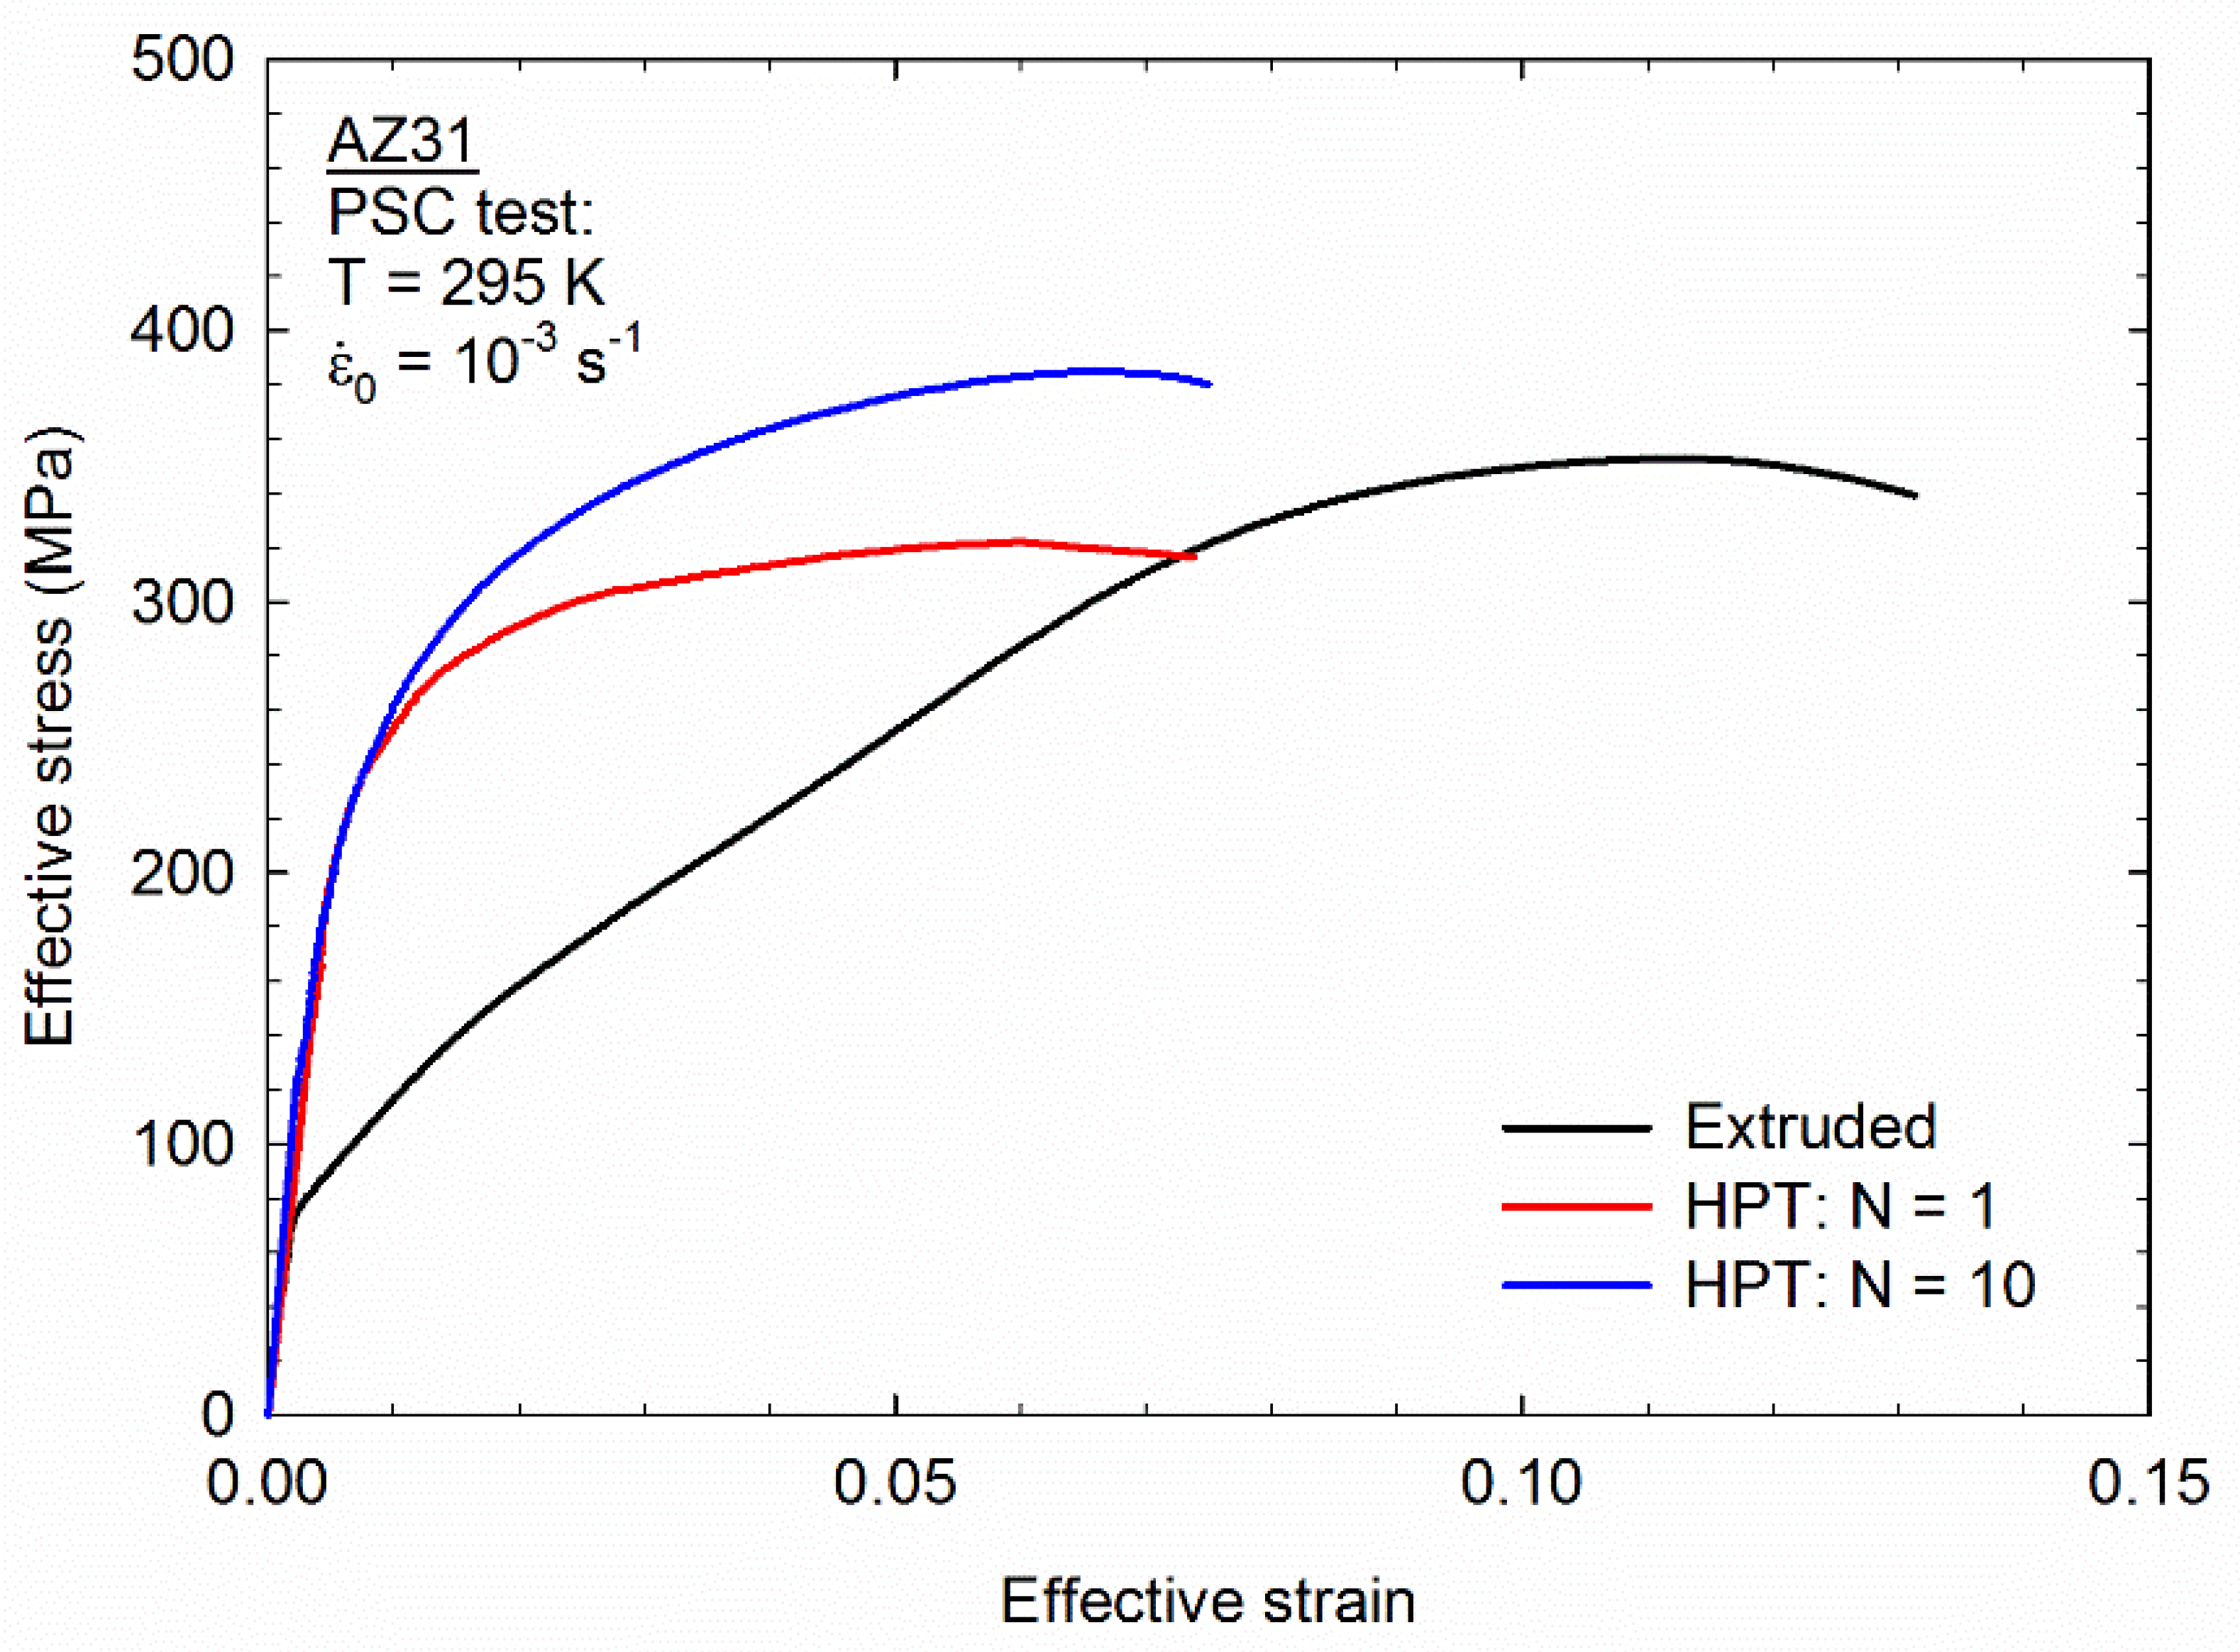
3.2. PSC Tests in Magnesium
4. Discussion
5. Summary and Conclusions
Author Contributions
Funding
Data Availability Statement
Conflicts of Interest
References
- Zhilyaev, A.P.; Langdon, T.G. Using high-pressure torsion for metal processing: Fundamentals and applications. Prog. Mater. Sci. 2008, 53, 893–979. [Google Scholar] [CrossRef]
- Hohenwarter, A.; Bachmaier, A.; Gludovatz, B.; Scheriau, S.; Pippan, R. Technical parameters affecting grain refinement by high pressure torsion. Int. J. Mater. Res. 2009, 100, 1653–1661. [Google Scholar] [CrossRef]
- Hohenwarter, A.; Pippan, R. Sample Size and Strain-Rate-Sensitivity Effects on the Homogeneity of High-Pressure Torsion Deformed Disks. Metall. Mater. Trans. A 2019, 50, 601–608. [Google Scholar] [CrossRef]
- Figueiredo, R.B.; De Faria, G.C.V.; Cetlin, P.R.; Langdon, T.G. Three-dimensional analysis of plastic flow during high-pressure torsion. J. Mater. Sci. 2013, 48, 4524–4532. [Google Scholar] [CrossRef]
- Rathmayr, G.B.; Bachmaier, A.; Pippan, R. Development of a new testing procedure for performing tensile tests on specimens with sub-millimetre dimensions. J. Test. Eval. 2013, 41. [Google Scholar] [CrossRef]
- Figueiredo, R.B.; Langdon, T.G. Deformation mechanisms in ultrafine-grained metals with an emphasis on the Hall-Petch relationship and strain rate sensitivity. J. Mater. Res. Technol. 2021, 14, 137–159. [Google Scholar] [CrossRef]
- Torbati-Sarraf, S.A.; Sabbaghianrad, S.; Langdon, T.G. Using Post-Deformation Annealing to Optimize the Properties of a ZK60 Magnesium Alloy Processed by High-Pressure Torsion. Adv. Eng. Mater. 2018, 20, 1700703. [Google Scholar] [CrossRef] [Green Version]
- Zheng, R.X.; Bhattacharjee, T.; Shibata, A.; Sasaki, T.; Hono, K.; Joshi, M.; Tsuji, N. Simultaneously enhanced strength and ductility of Mg-Zn-Zr-Ca alloy with fully recrystallized ultrafine grained structures. Scr. Mater. 2017, 131, 1–5. [Google Scholar] [CrossRef]
- Ford, H. Researches into the Deformation of Metals by Cold Rolling. Proc. Inst. Mech. Eng. 1948, 159, 115–143. [Google Scholar] [CrossRef]
- Mohebbi, M.S.; Akbarzadeh, A.; Yoon, Y.-O.; Kim, S.-K. Flow stress analysis of ultrafine grained AA 1050 by plane strain compression test. Mater. Sci. Eng. A 2014, 593, 136–144. [Google Scholar] [CrossRef]
- Watts, A.B.; Ford, H. An Experimental Investigation of the Yielding of Strip between Smooth Dies. Proc. Inst. Mech. Eng. 1953, 167, 448–464. [Google Scholar] [CrossRef]
- QForm 10.1.3. Available online: https://www.qform3d.com/ (accessed on 16 December 2021).
- Figueiredo, R.B.; Cetlin, P.R.; Langdon, T.G. Using finite element modeling to examine the flow processes in quasi-constrained high-pressure torsion. Mater. Sci. Eng. A 2011, 528, 8198–8204. [Google Scholar] [CrossRef]
- Figueiredo, R.B.; Pereira, P.H.R.; Aguilar, M.T.P.; Cetlin, P.R.; Langdon, T.G. Using finite element modeling to examine the temperature distribution in quasi-constrained high-pressure torsion. Acta Mater. 2012, 60, 3190–3198. [Google Scholar] [CrossRef]
- Dieter, G.E. Mechanical Metallurgy, 3rd ed.; McGraw-Hill Book Company: London, UK, 1988. [Google Scholar]
- Sae-Eaw, N.; Aue-U-Lan, Y. Mechanical property determination for combined sheet and bulk metal forming process by plane strain compression test. Mater. Today Proc. 2018, 5, 9376–9383. [Google Scholar] [CrossRef]
- Gelin, J.C.; Ghouati, O.; Shahani, R. Modelling the plane strain compression test to obtain constitutive equations of aluminium alloys. Int. J. Mech. Sci. 1994, 36, 773–796. [Google Scholar] [CrossRef]
- Pietrzyk, M.; Lenard, J.G.; Dalton, G.M. A Study of the Plane Strain Compression Test. CIRP Ann. 1993, 42, 331–334. [Google Scholar] [CrossRef]
- Figueiredo, R.B.; Pereira, P.H.R.; Langdon, T.G. Effect of Numbers of Turns of High-Pressure Torsion on the Development of Exceptional Ductility in Pure Magnesium. Adv. Eng. Mater. 2020, 22, 1900565. [Google Scholar] [CrossRef]
- Silva, C.L.P.; Oliveira, A.C.; Costa, C.G.F.; Figueiredo, R.B.; de Fátima Leite, M.; Pereira, M.M.; Lins, V.F.C.; Langdon, T.G. Effect of severe plastic deformation on the biocompatibility and corrosion rate of pure magnesium. J. Mater. Sci. 2017, 52, 5992–6003. [Google Scholar] [CrossRef] [Green Version]
- Silva, C.L.P.; Camara, M.A.; Hohenwarter, A.; Figueiredo, R.B. Mechanical Behavior and In Vitro Corrosion of Cubic Scaffolds of Pure Magnesium Processed by Severe Plastic Deformation. Metals 2021, 11, 1791. [Google Scholar] [CrossRef]
- Figueiredo, R.B.; Sabbaghianrad, S.; Giwa, A.; Greer, J.R.; Langdon, T.G. Evidence for exceptional low temperature ductility in polycrystalline magnesium processed by severe plastic deformation. Acta Mater. 2017, 122, 322–331. [Google Scholar] [CrossRef] [Green Version]
- Silva, C.L.P.; Soares, R.B.; Pereira, P.H.R.; Figueiredo, R.B.; Lins, V.F.C.; Langdon, T.G. The Effect of High-Pressure Torsion on Microstructure, Hardness and Corrosion Behavior for Pure Magnesium and Different Magnesium Alloys. Adv. Eng. Mater. 2019, 21, 1801081. [Google Scholar] [CrossRef]
- Barnett, M.R.; Keshavarz, Z.; Beer, A.G.; Atwell, D. Influence of grain size on the compressive deformation of wrought Mg–3Al–1Zn. Acta Mater. 2004, 52, 5093–5103. [Google Scholar] [CrossRef]
- Figueiredo, R.B.; Langdon, T.G. Processing Magnesium and Its Alloys by High-Pressure Torsion: An Overview. Adv. Eng. Mater. 2019, 21, 1801039. [Google Scholar] [CrossRef] [Green Version]
- Straska, J.; Janecek, M.; Gubicza, J.; Krajnak, T.; Yoon, E.Y.; Kim, H.S. Evolution of microstructure and hardness in AZ31 alloy processed by high pressure torsion. Mater. Sci. Eng. A 2015, 625, 98–106. [Google Scholar] [CrossRef]
- Huang, Y.; Figueiredo, R.B.; Baudin, T.; Brisset, F.; Langdon, T.G. Evolution of strength and homogeneity in a magnesium AZ31 alloy processed by high-pressure torsion at different temperatures. Adv. Eng. Mater. 2012, 14, 1018–1026. [Google Scholar] [CrossRef]
- Tabor, D. A Simple Theory of Static and Dynamic Hardness. Proc. R. Soc. Lond. Ser. A-Math. Phys. Sci. 1948, 192, 247–274. [Google Scholar] [CrossRef]
- Green, A.P. XCII. A theoretical investigation of the compression of a ductile material between smooth flat dies. Lond. Edinb. Dublin Philos. Mag. J. Sci. 1951, 42, 900–918. [Google Scholar] [CrossRef]
- Kowalski, B.; Lacey, A.J.; Sellars, C.M. Correction of plane strain compression data for the effects of inhomogeneous deformation. Mater. Sci. Technol. 2003, 19, 1564–1570. [Google Scholar] [CrossRef]


Publisher’s Note: MDPI stays neutral with regard to jurisdictional claims in published maps and institutional affiliations. |
© 2022 by the authors. Licensee MDPI, Basel, Switzerland. This article is an open access article distributed under the terms and conditions of the Creative Commons Attribution (CC BY) license (https://creativecommons.org/licenses/by/4.0/).
Share and Cite
Carvalho, A.P.; Reis, L.M.; Pinheiro, R.P.R.P.; Pereira, P.H.R.; Langdon, T.G.; Figueiredo, R.B. Using Plane Strain Compression Test to Evaluate the Mechanical Behavior of Magnesium Processed by HPT. Metals 2022, 12, 125. https://doi.org/10.3390/met12010125
Carvalho AP, Reis LM, Pinheiro RPRP, Pereira PHR, Langdon TG, Figueiredo RB. Using Plane Strain Compression Test to Evaluate the Mechanical Behavior of Magnesium Processed by HPT. Metals. 2022; 12(1):125. https://doi.org/10.3390/met12010125
Chicago/Turabian StyleCarvalho, Amanda P., Leonardo M. Reis, Ravel P. R. P. Pinheiro, Pedro Henrique R. Pereira, Terence G. Langdon, and Roberto B. Figueiredo. 2022. "Using Plane Strain Compression Test to Evaluate the Mechanical Behavior of Magnesium Processed by HPT" Metals 12, no. 1: 125. https://doi.org/10.3390/met12010125