Article

Prediction of Upper Surface Roughness in Laser Powder Bed Fusion

1
George W. Woodruff School of Mechanical Engineering, Georgia Institute of Technology, 801 Ferst Drive NW, Atlanta, GA 30332, USA
2
School of Materials Science and Engineering, Georgia Institute of Technology, 771 Ferst Drive NW, Atlanta, GA 30332, USA
*
Authors to whom correspondence should be addressed.
Metals 2022, 12(1), 11; https://doi.org/10.3390/met12010011
Submission received: 21 October 2021 / Revised: 30 November 2021 / Accepted: 7 December 2021 / Published: 22 December 2021
(This article belongs to the Special Issue Innovations in Metal Additive Manufacturing)

Abstract

:
In this study, a physics-based analytical method was proposed for the prediction of upper surface roughness in laser powder bed fusion (LPBF). The temperature distribution and molten pool shape in the melting process were first predicted by an analytical thermal model. The cap area of the solidified molten pool was assumed to be half-elliptical. Based on this assumption and the principle of mass conservation, the cap height and the specific profile of the cap area were obtained. The transverse overlapping pattern of adjacent molten pools of upper layer was then obtained, with given hatch space. The analytical expression of the top surface profile was obtained after putting this overlapping pattern into a 2D coordinate system. The expression of surface roughness was then derived as an explicit function of the process parameters and material properties, based on the definition of surface roughness (Ra) in the sense of an arithmetic average. The predictions of surface roughness were then compared with experimental measurements of 316L stainless steel for validation and show acceptable agreement. In addition, the proposed model does not rely on numerical iterations, which ensures its low computational cost. Thus, the proposed analytical method can help understand the causes for roughness in LPBF and guide the optimization of process conditions to fabricate products with good quality. The sensitivity of surface roughness to process conditions was also investigated in this study.

1. Introduction

Laser powder bed fusion (LPBF) metal additive manufacturing has attracted significant interest from academia and various industries due to its superior advantage in fabricating complex products when compared with other traditional manufacturing methods [1]. However, there are still some challenges to have a good control of part quality in LPBF, which hinders the wider application of this kind of manufacturing technique. Surface roughness is a common process-induced defect in metal additive manufacturing processes, which has significant detrimental effects on the mechanical performance of the final products; although, high surface roughness is wanted in some special fields [2,3]. Therefore, an accurate and efficient tool to predict surface roughness is of great importance for the optimization of process conditions and quality control in LPBF.
Researchers have employed experimental measurements, numerical simulations, and analytical models to study the melting process and process-induced defects in metal additive manufacturing. There have been plenty of experimental studies about different aspects of powder bed fusion process. To study the molten pool geometries in LPBF, researchers employed scanning electron microscopy (SEM) to observe the surface morphology of the single tracks [4] and used optical micrographs [4,5,6] to characterize the cross-sections of molten pools. The molten pool length, width, depth, and height can be measured through analysis of the optical micrographs. For surface roughness investigations, Wang et al. [2] used JB-8c type contact stylus roughness meter to measure the surface roughness of parts in LPBF made of 316L stainless steel. The effects of energy density and laser remelting on surface roughness were also studied. Calignano [7] employed a RTP80 roughness tester to measure the surface roughness of parts made of AlSi10Mg in LPBF and found that the surface roughness was mainly caused by process conditions. Mumtaz et al. [3] conducted experiments to study the relationship between process conditions and the final top and side surface roughness of thin wall structures fabricated by powder bed fusion. A Talysurf CLI 2000 apparatus was utilized to measure the surface roughness. Spierings et al. [8] employed a Perthometer type S3P device to measure the surface quality of the parts manufactured by selective laser melting process and investigated the influence of powder bed characteristics on the surface roughness. Although experimental investigations have provided plenty of valuable information for the study of metal additive manufacturing processes, the complex experimental operations and expensive equipment hinder the wide application of these experimental techniques.
To avoid the complex procedure and high cost of experimental equipment, researchers have employed various numerical modeling methods to simulate the metal additive manufacturing processes and predict the temperature distribution [9,10,11], molten pool behavior and shapes [11,12], common defects [13], etc. For investigations about surface morphology, Feng et al. [14] developed a numerical modeling method to simulate the behavior of molten pools and investigate the formation mechanism of the surface profile of overhang structures in LPBF, which was based on the discrete element method and computational fluid dynamics (CFD). Tang et al. [15] employed a CFD-based method to simulate the humping phenomenon and surface morphology of single tracks in LPBF. The physical principles controlling the humping formation were discussed. Although these numerical modeling methods are convenient to conduct and can save the experimental cost, the low computational efficiency is still a main disadvantage of this kind of technique.
Analytical modeling has been widely adopted by researchers as an acceptable alternative for the numerical simulations and experimental characterizations. It can avoid not only the inconvenience and high cost to conduct experimental measurements but also the high computational cost of numerical analyses. Researchers have developed plenty of efficient analytical models to study different phenomena in metal additive manufacturing processes, including the temperature distribution [16], molten pool size [17], lack-of-fusion porosity [18,19], in situ and post-process distortion [20,21], etc. For the prediction of surface morphology of molten tracks and surface roughness of printed parts, Yadroitsev et al. [22] developed an analytical method to check the stability of a single track in LPBF. The instability of the molten pools of single tracks will lead to the occurrence of a balling phenomenon, which will detrimentally influence the surface quality of the final product. Wang et al. [2] derived an analytical expression to calculate the surface roughness of the top surface in LPBF, which was based on the simple assumption of semi-cylindrical molten tracks above the previous layer. However, the method presented in that study could not correlate the final surface roughness directly with process conditions and material properties. The experimentally measured molten pool dimensions were the inputs of that method. To calculate the surface roughness through that method, a researcher has to conduct plenty of measurements of molten pool size, which is expensive and time-consuming.
This study developed a physics-based analytical modeling strategy to predict the upper surface roughness in LPBF. Compared to previous studies, the proposed analytical strategy can correlate the upper surface roughness directly with the process parameters (laser power, scan speed, layer thickness, and hatch space), laser absorptivity, and material properties. It does not rely on the inputs of experimental measurements, which will help the researchers avoid expensive experiments. In addition, no finite element-based numerical analyses are included in this modeling method, which ensure its high computational efficiency. The following are the specific steps of the proposed strategy. The temperature distribution and molten pool geometry in melting process were first predicted by a moving point heat source model. The cap area of the solidified molten pool was assumed to be half-elliptical. The height of the solidified molten pool was then calculated based on the principle of mass conservation. With the half-elliptical assumption, obtained molten pool size, and given process conditions, the overlapping pattern of adjacent molten pool cross-sections in the upper layer was obtained. After putting the overlapping pattern into a 2D coordinate system, the analytical expression of the surface profile of the upper surface was obtained. The surface roughness was then derived based on the surface profile and definition of surface roughness (Ra). The predicted surface roughness under different process conditions was validated against the experimental data of 316L stainless steel in LPBF. The sensitivity of surface roughness to process parameters was discussed.

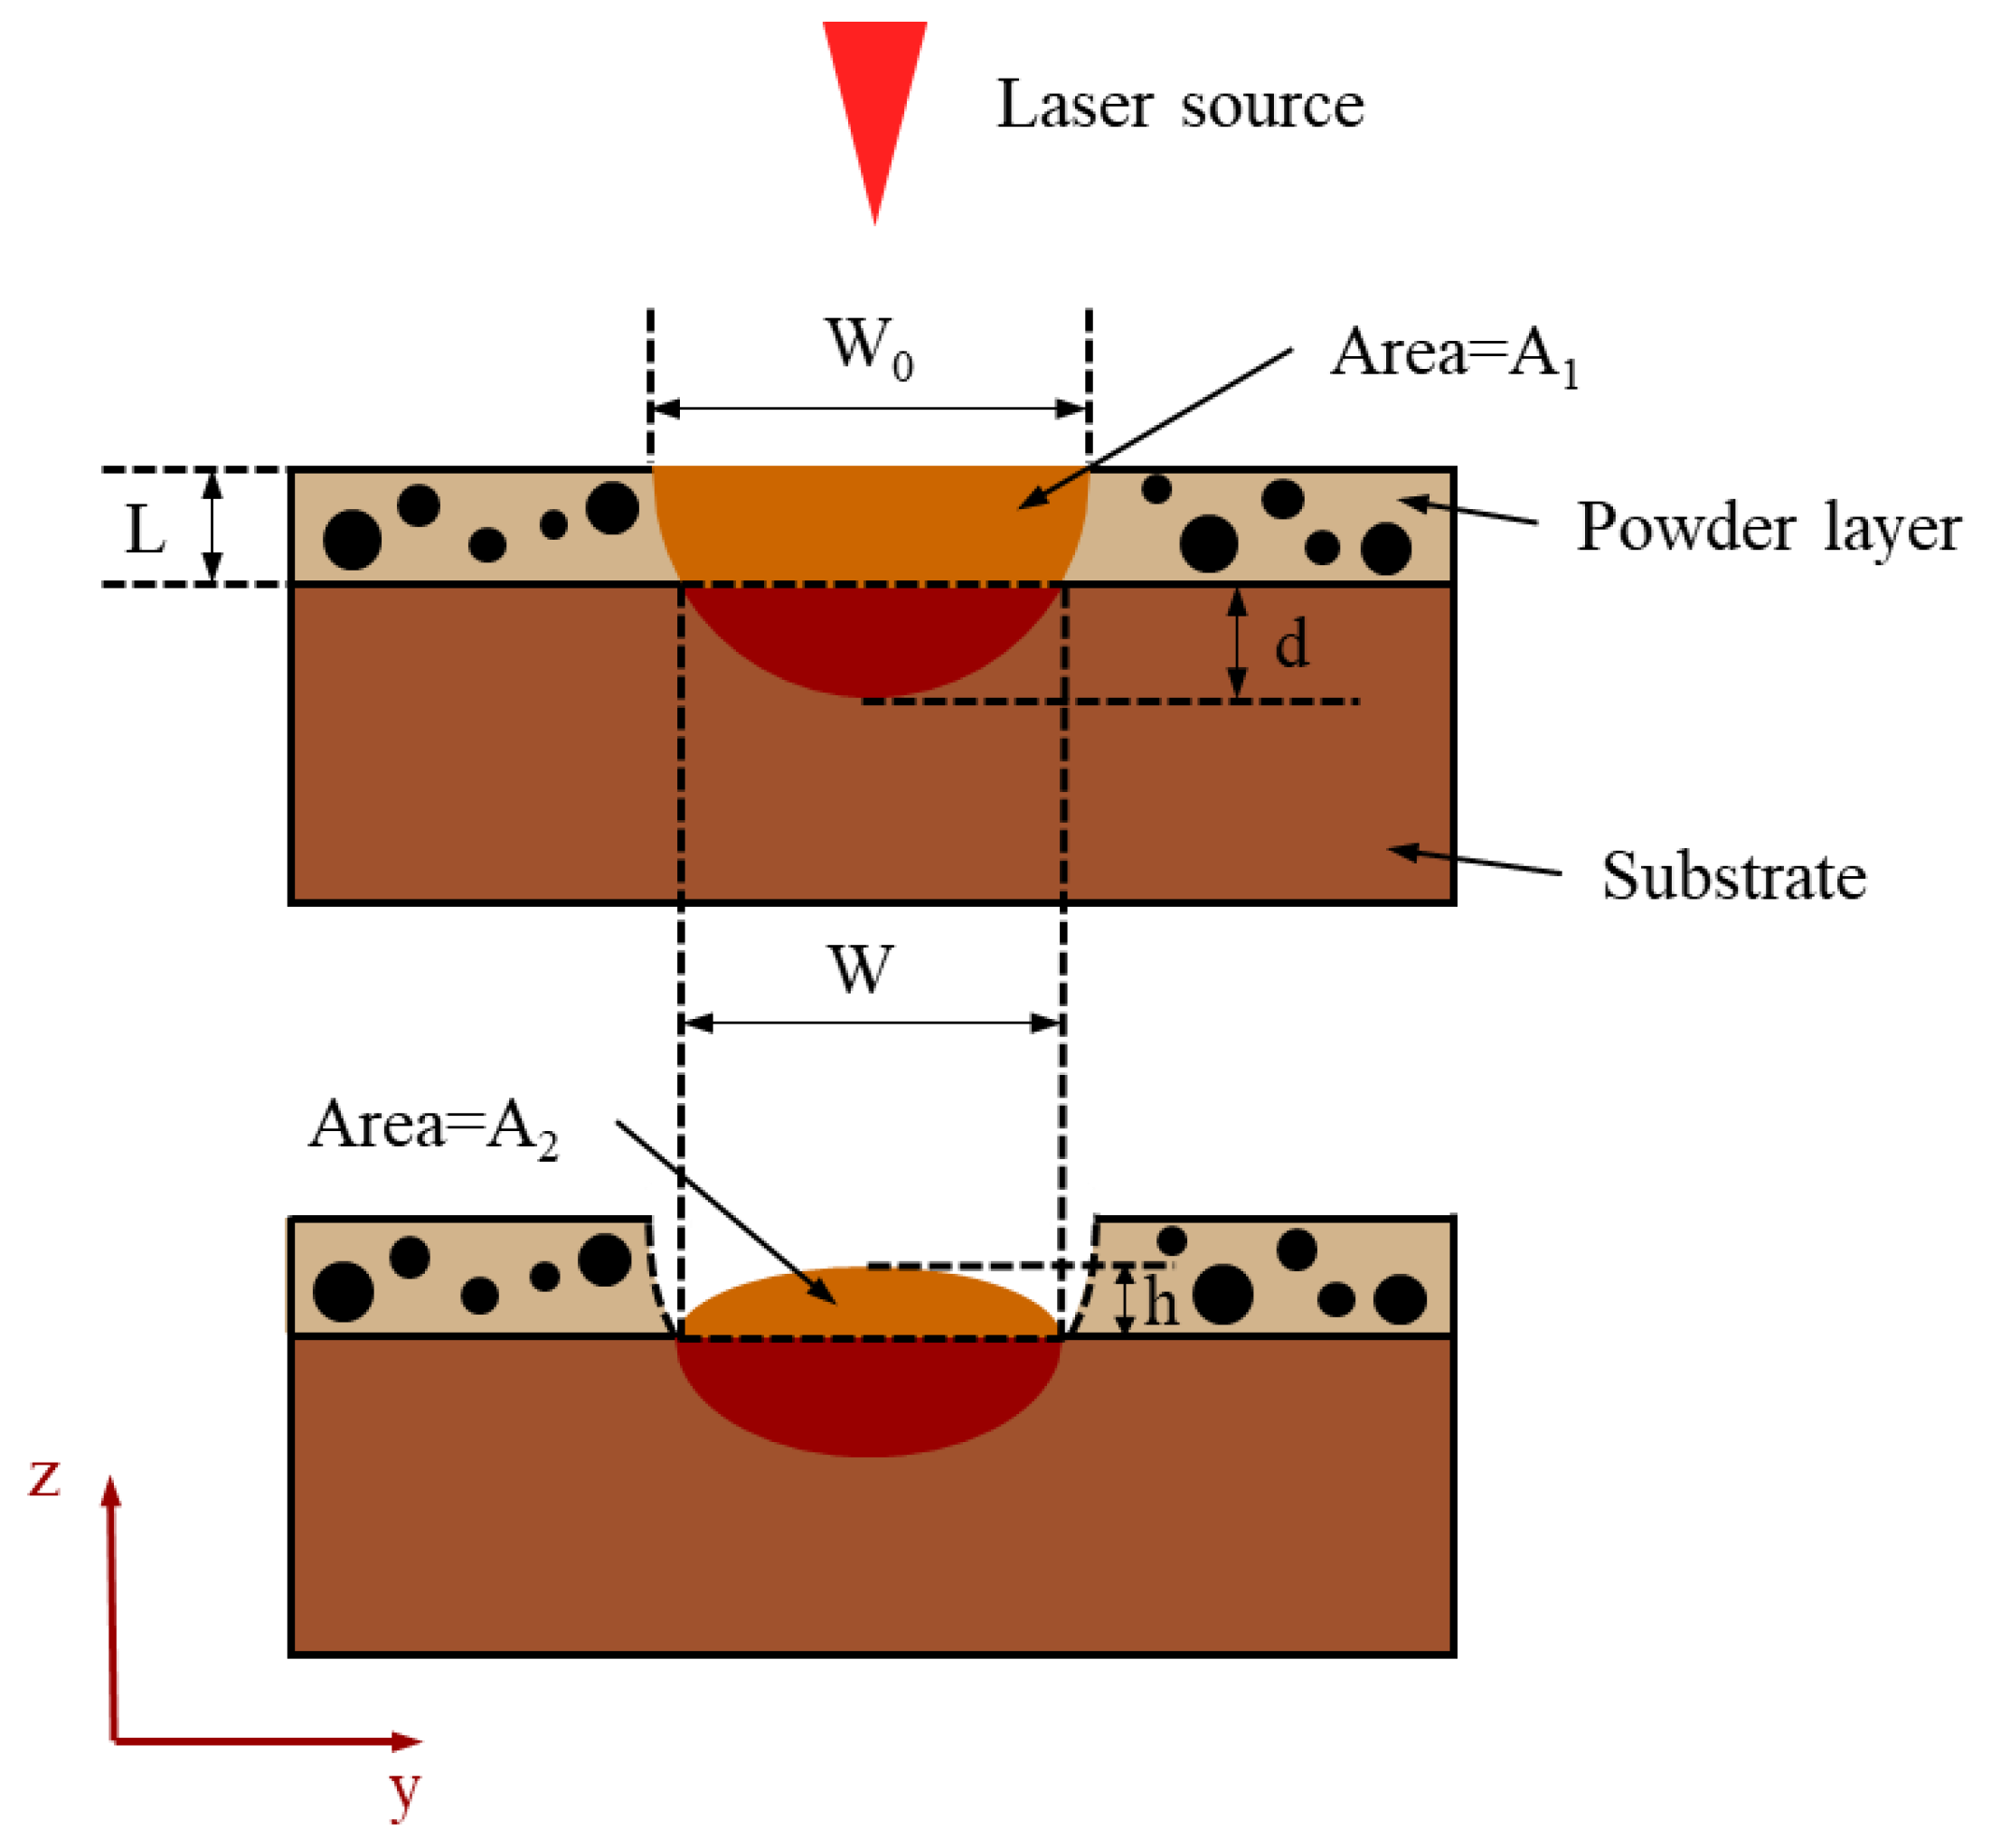
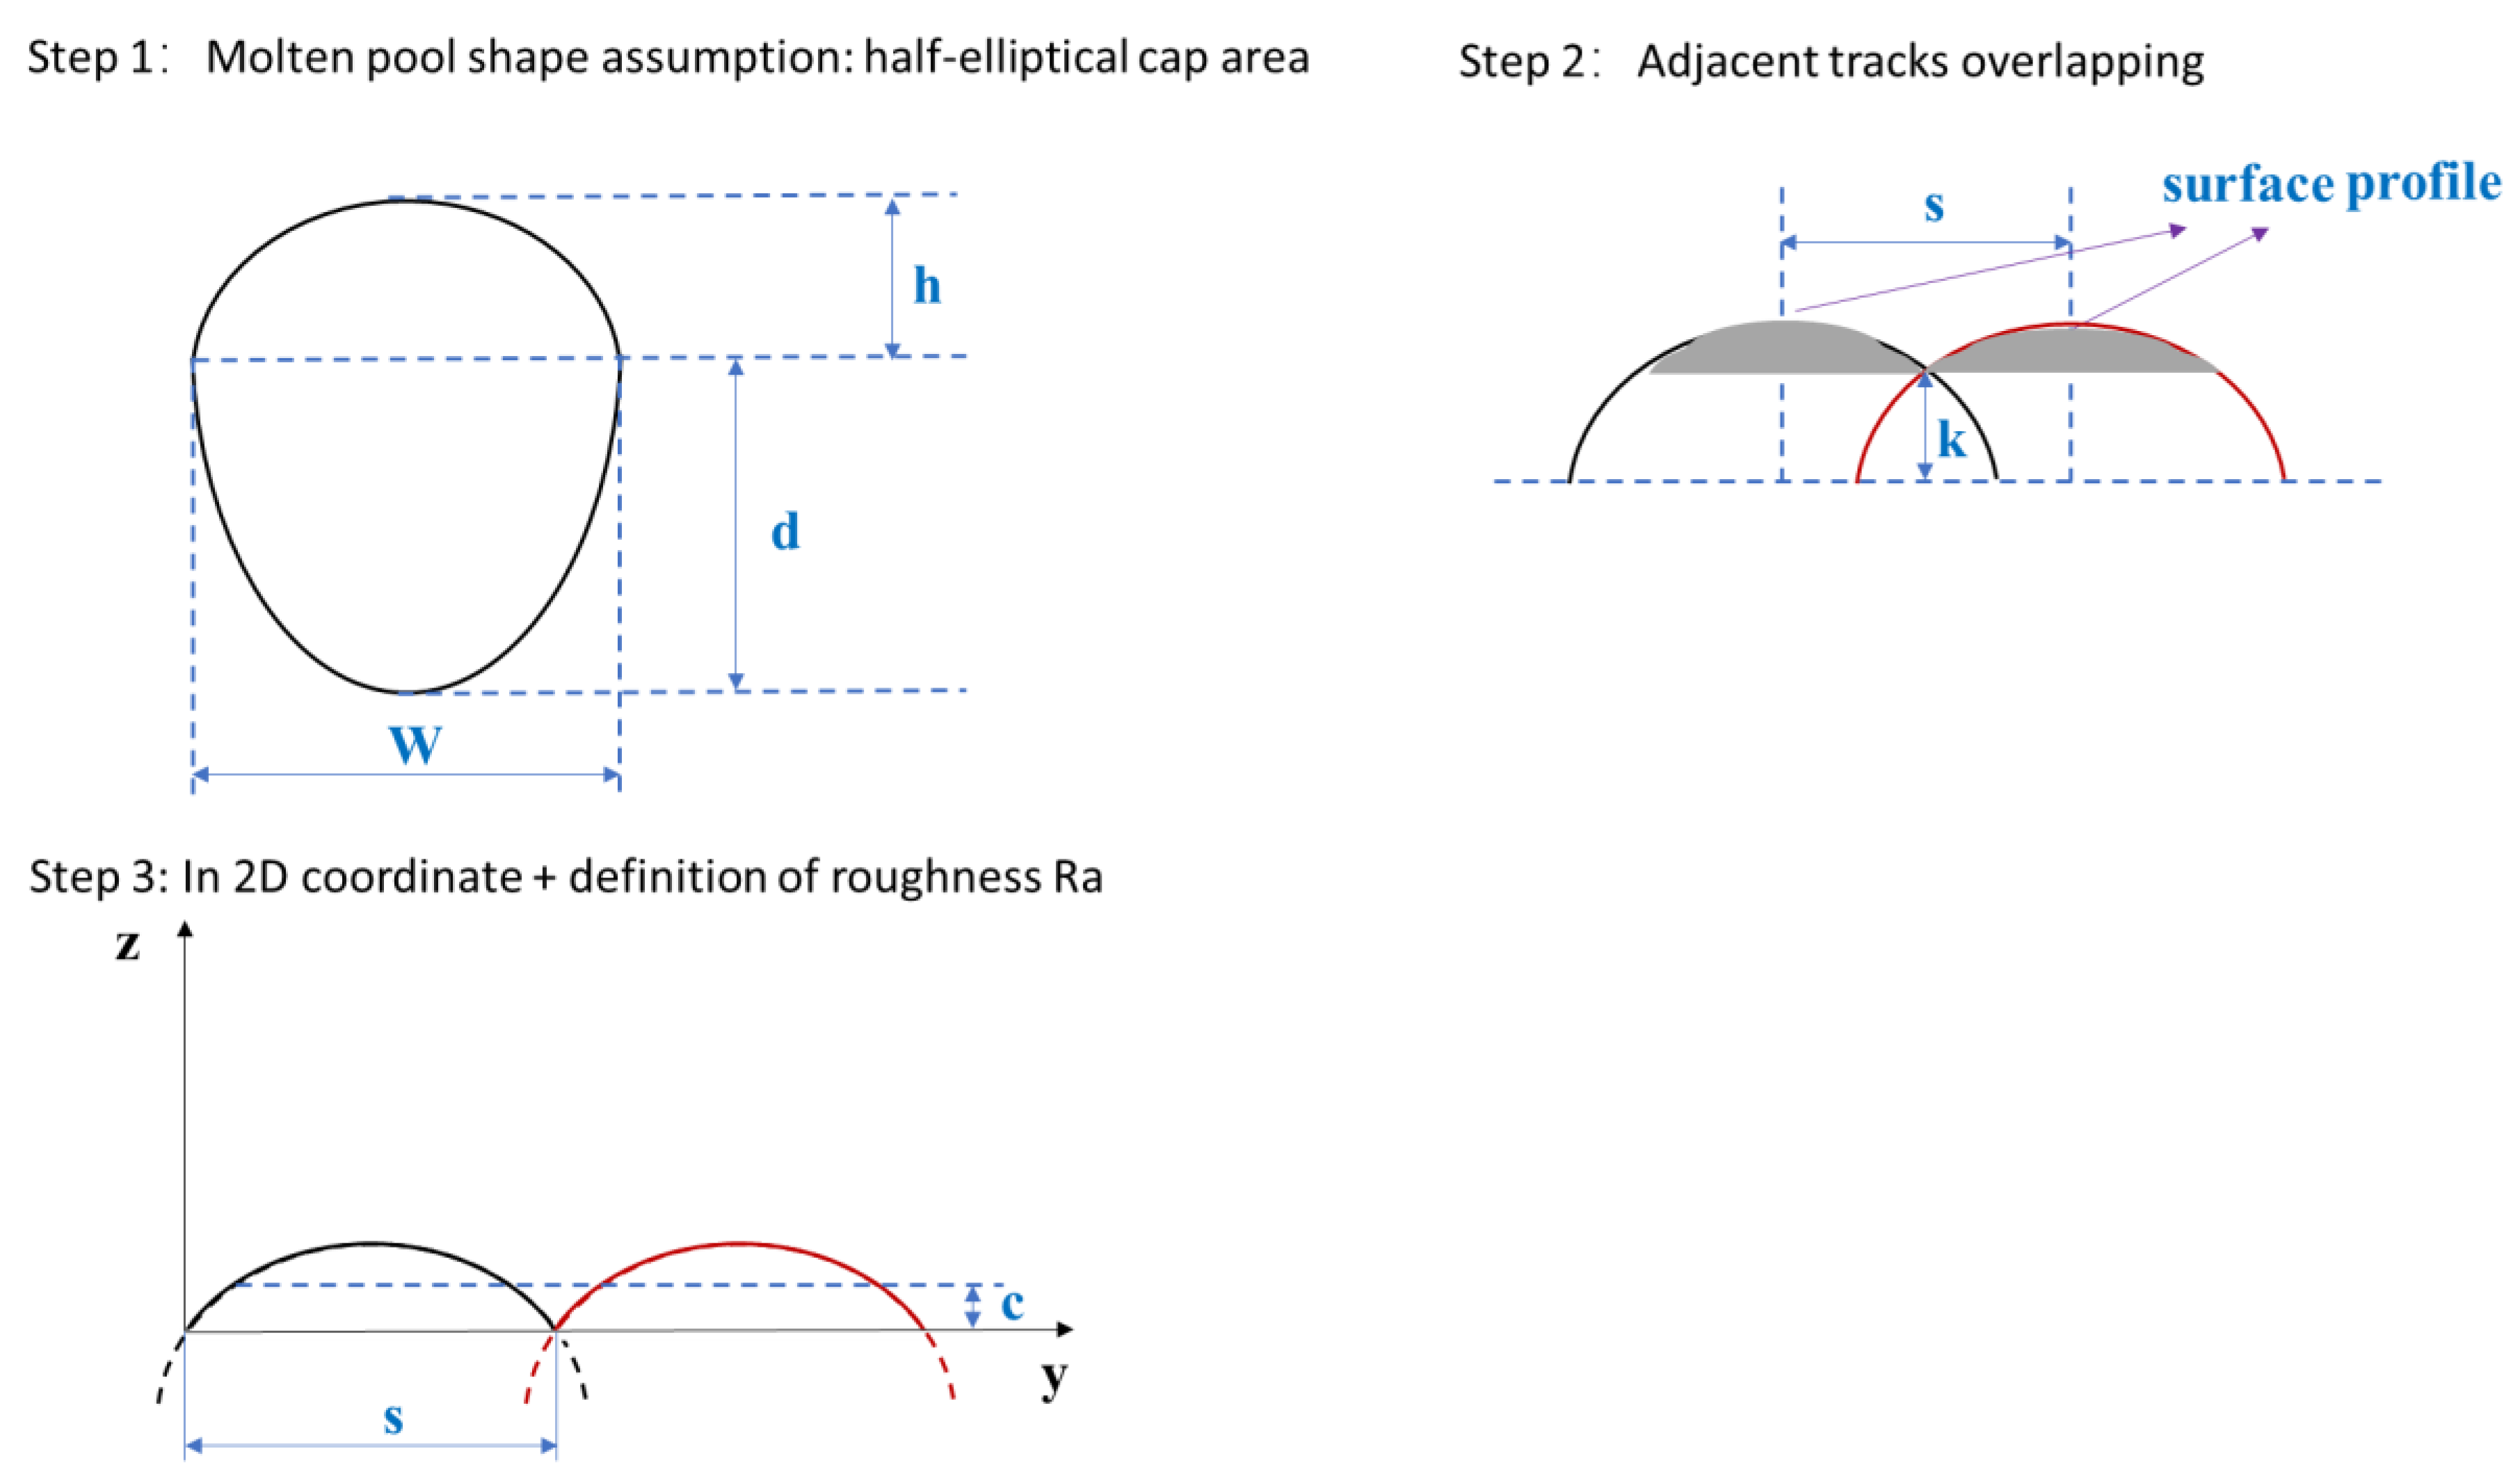
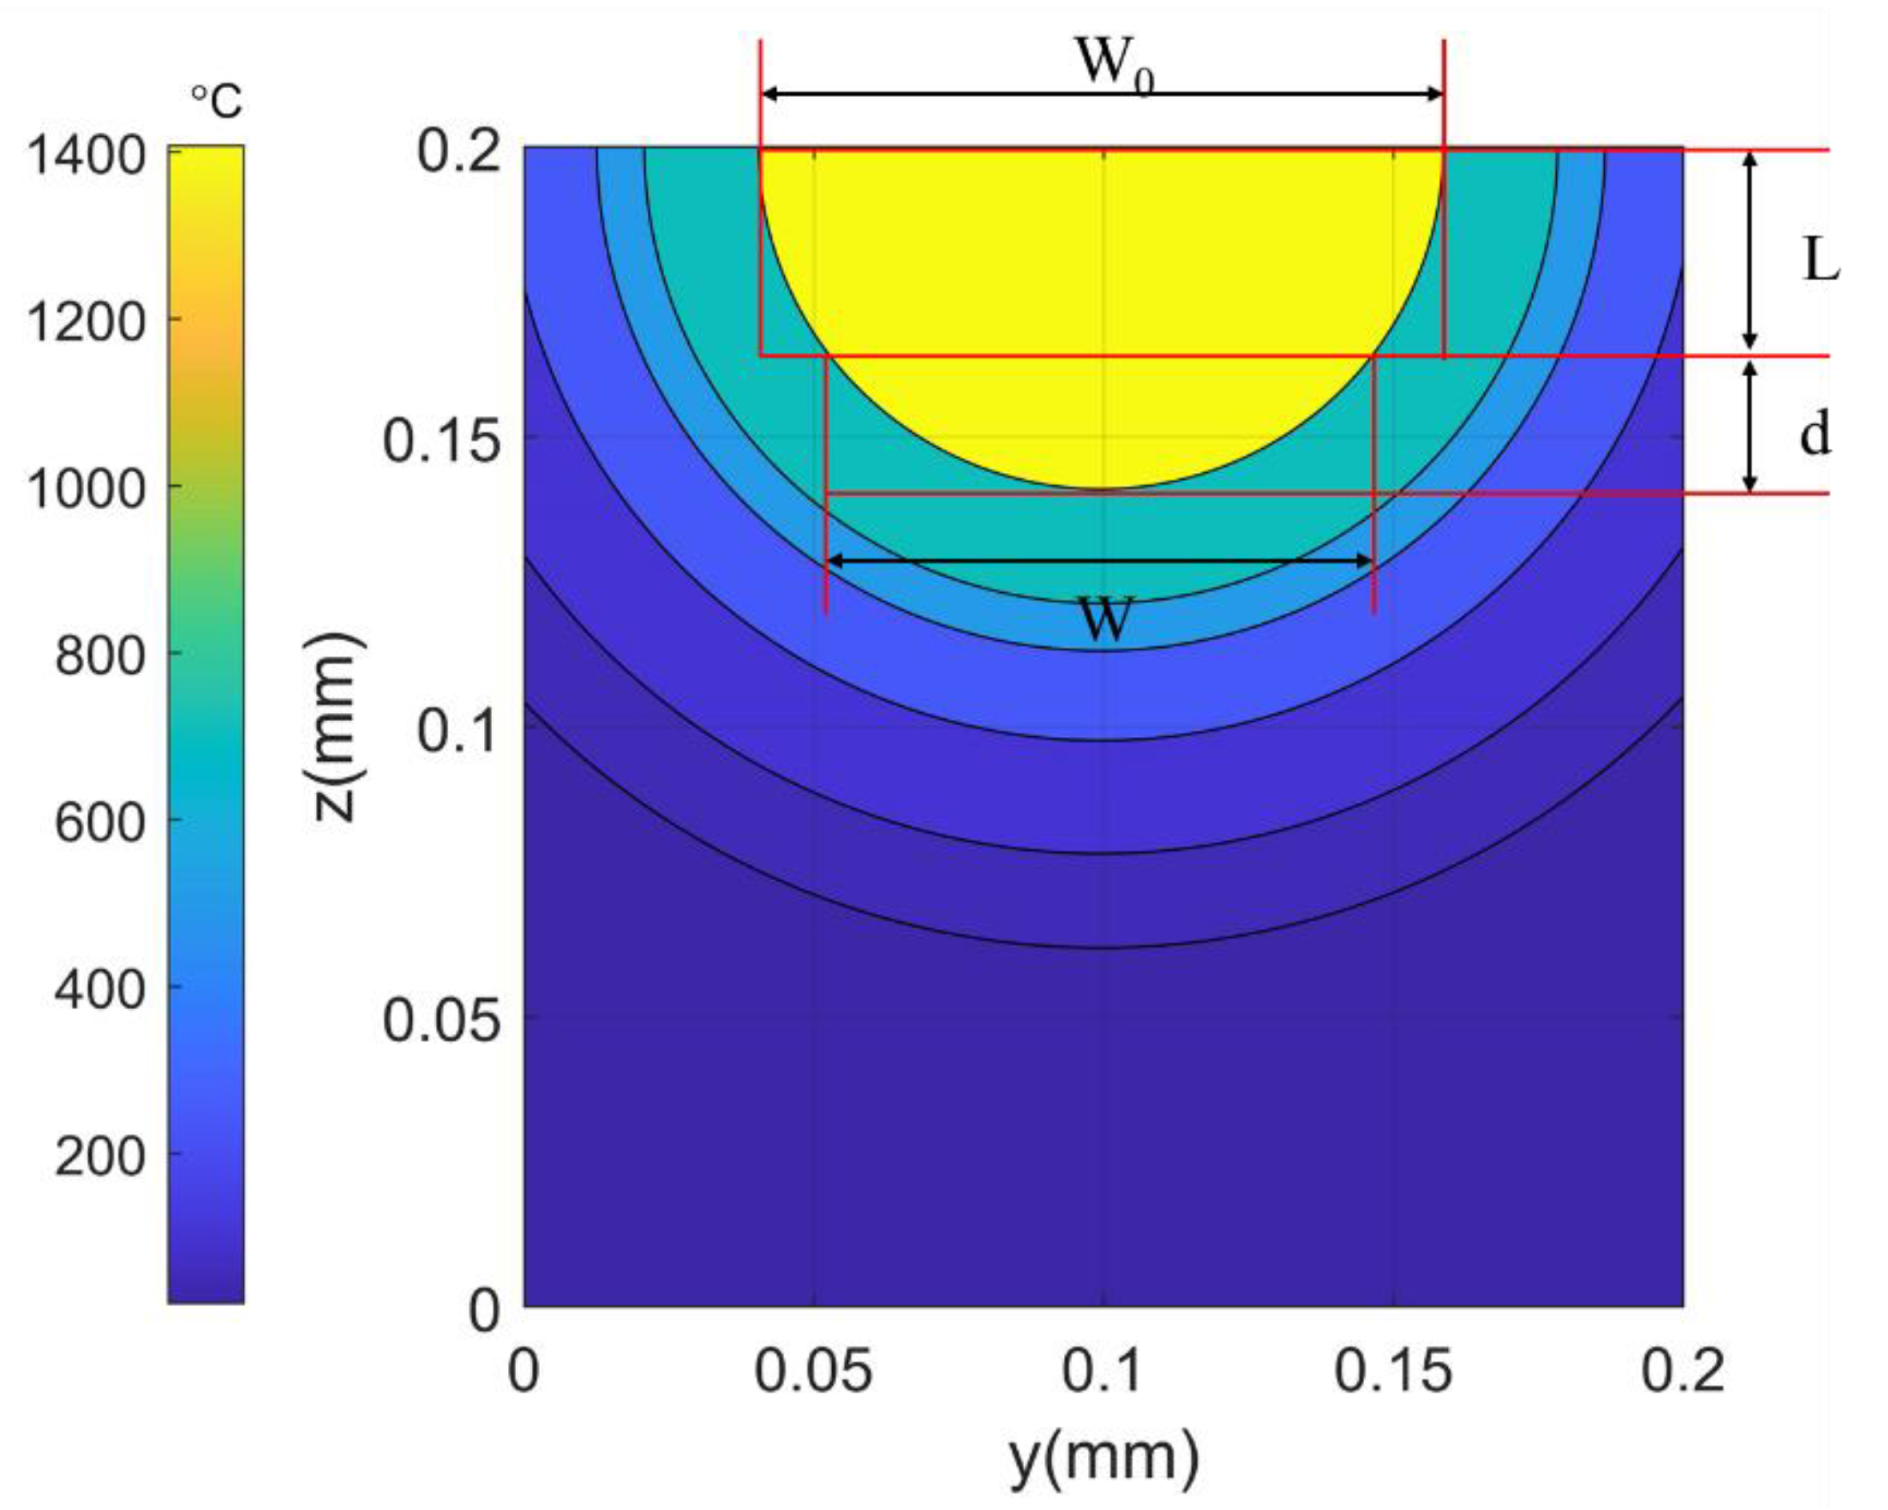
2. Analytical Modeling

A physics-based analytical modeling method was developed in this study to correlate the upper surface roughness in LPBF directly with process parameters (such as laser power, scan speed, layer thickness, hatch space) and material properties. A moving point heat source solution for semi-infinite medium was first employed as a thermal model to calculate the temperature profiles and molten pool shapes in the melting process, with the laser power, scan velocity, and material properties as inputs. The illustration of the liquid molten pool geometry during the melting process is shown in the top schematic of Figure 1, which consists of a top portion and a bottom portion. The moving point heat source model was proposed by Carslaw and Jaeger in [23] based on the assumptions of temperature-independent material properties and steady state. Its closed-form solution can be expressed as
θ p o i n t x , y , z   = P η 2 π K R T m T 0 exp V R + x 2 κ
where P is the power of the laser beam, η represents the laser power absorptivity, V is the scan speed of laser source, and R represents the distance of the calculated point to the laser power source, which can be expressed as R 2 = x 2 + y 2 + z 2 . T m and T 0 represent the melting temperature of material and initial temperature, respectively. κ represents the thermal diffusivity, and it can be determined using thermal conductivity K , density ρ , and specific heat capacity c , based on the relationship κ = K / ρ c . θ p o i n t x , y , z   =   T T 0 / T m T 0 is the dimensionless temperature. x ,   y ,   z denote the coordinate system, with x direction as the laser scanning direction, y direction as the transverse direction, and z direction as build direction. After obtaining the temperature profiles in melting process, the width of powder layer consumption W 0 , molten pool width W , and re-melted depth d were determined by comparing the temperature distribution with the melting point of the material.
After solidification, due to the effects of surface tension, the shape of the molten pool will change. The transverse cross-section of the solidified molten pool consists of a cap area above the previous layer and a remelted area in the previous layer, as observed in experiments [4]. The cap area is made of the newly melted powder layer, while the remelted area is the remelted material in the previous layer or substrate. In this study, the cap area is assumed to be half-elliptical, as shown in the bottom schematic of Figure 1, which approximates most experimentally observed molten pool shapes [18]. Based on the principle of mass conservation, the mass of the newly melted powder layer during the melting process and after solidification will not change. In other words, the mass of the newly melted powder layer during the melting process is the same as the mass of the solidified cap. In this study, the powder packing densification is assumed to be 100%, and the solidified cap is also assumed to have full density. Thus, due to mass conservation, the area of the newly melted powder layer A 1 is equal to the cap area A 2 . Then, based on the area formula of half-ellipse, the cap height h (also called height of solidified molten pool) was calculated as
h = 4 A 2 π · W
The specific steps to derive the analytical expression of surface roughness are shown in Figure 2. In Step 1, based on the values of predicted molten pool width W and calculated cap height, the specific profile of the half-elliptical cap area was determined. The overlapping pattern of adjacent tracks was then obtained by plotting multiple transverse cross-sections of molten pools on a transverse cross-section of the upper layer, as shown in Step 2 of Figure 2. The distance between two adjacent molten tracks is the value of hatch space. Based on the geometrical relationships, the intersection height k of adjacent molten tracks was then derived as
k = 2 h W · W 2 2 s 2 2
For uni-directional scanning strategy of LPBF, the surface profile of the upper layer in the transverse direction (the direction that is perpendicular to the scanning direction) will be a periodical undulation pattern, which means that the length and width of the parts have no influence on the expression of the top surface profile. After putting the overlapping pattern in a 2D coordinate system, the surface profile can be expressed as a function of the coordinates. The height of the mean line of the surface profile was then derived, which can be expressed as
c = 1 s · 0 s 2 h W · W 2 2 ( x s 2 ) 2 d x k                      = 2 h s W ·   W 2 8 arcsin s + 2 x W + 1 2 sin 2 arcsin s + 2 x W | 0 s k
It should be noted that the height of the mean line of a surface profile represents the average height of the whole surface profile along a sampling length. In other words, the surface profile in the sampling length is bisected by the mean line, and the areas above and below the mean line are equal. Based on the definition of Ra value in [24,25], which is the arithmetic average value of the absolute distance from the surface profile to the mean line in the vertical direction, the expression of surface roughness was then derived as
R a = 1 s · 0 s y c d x = 1 s · 0 s 2 h W · W 2 2 ( x s 2 ) 2 1 s · 0 s ( 2 h W · W 2 2 ( x s 2 ) 2 ) d x d x
In Equations (3)–(5) and Figure 2, h denotes the cap height, d   denotes re-melted depth, W represents the molten pool width, and s is the hatch space. k represents the intersection height of adjacent melting tracks as measured from the base of the cap area. c   represents the height of mean line of the surface profile. y ,   z in Figure 2 represent the transverse direction and build direction, respectively. It should be noted that Equations (4) and (5) were calculated through the symbolic integration function in Matlab software.

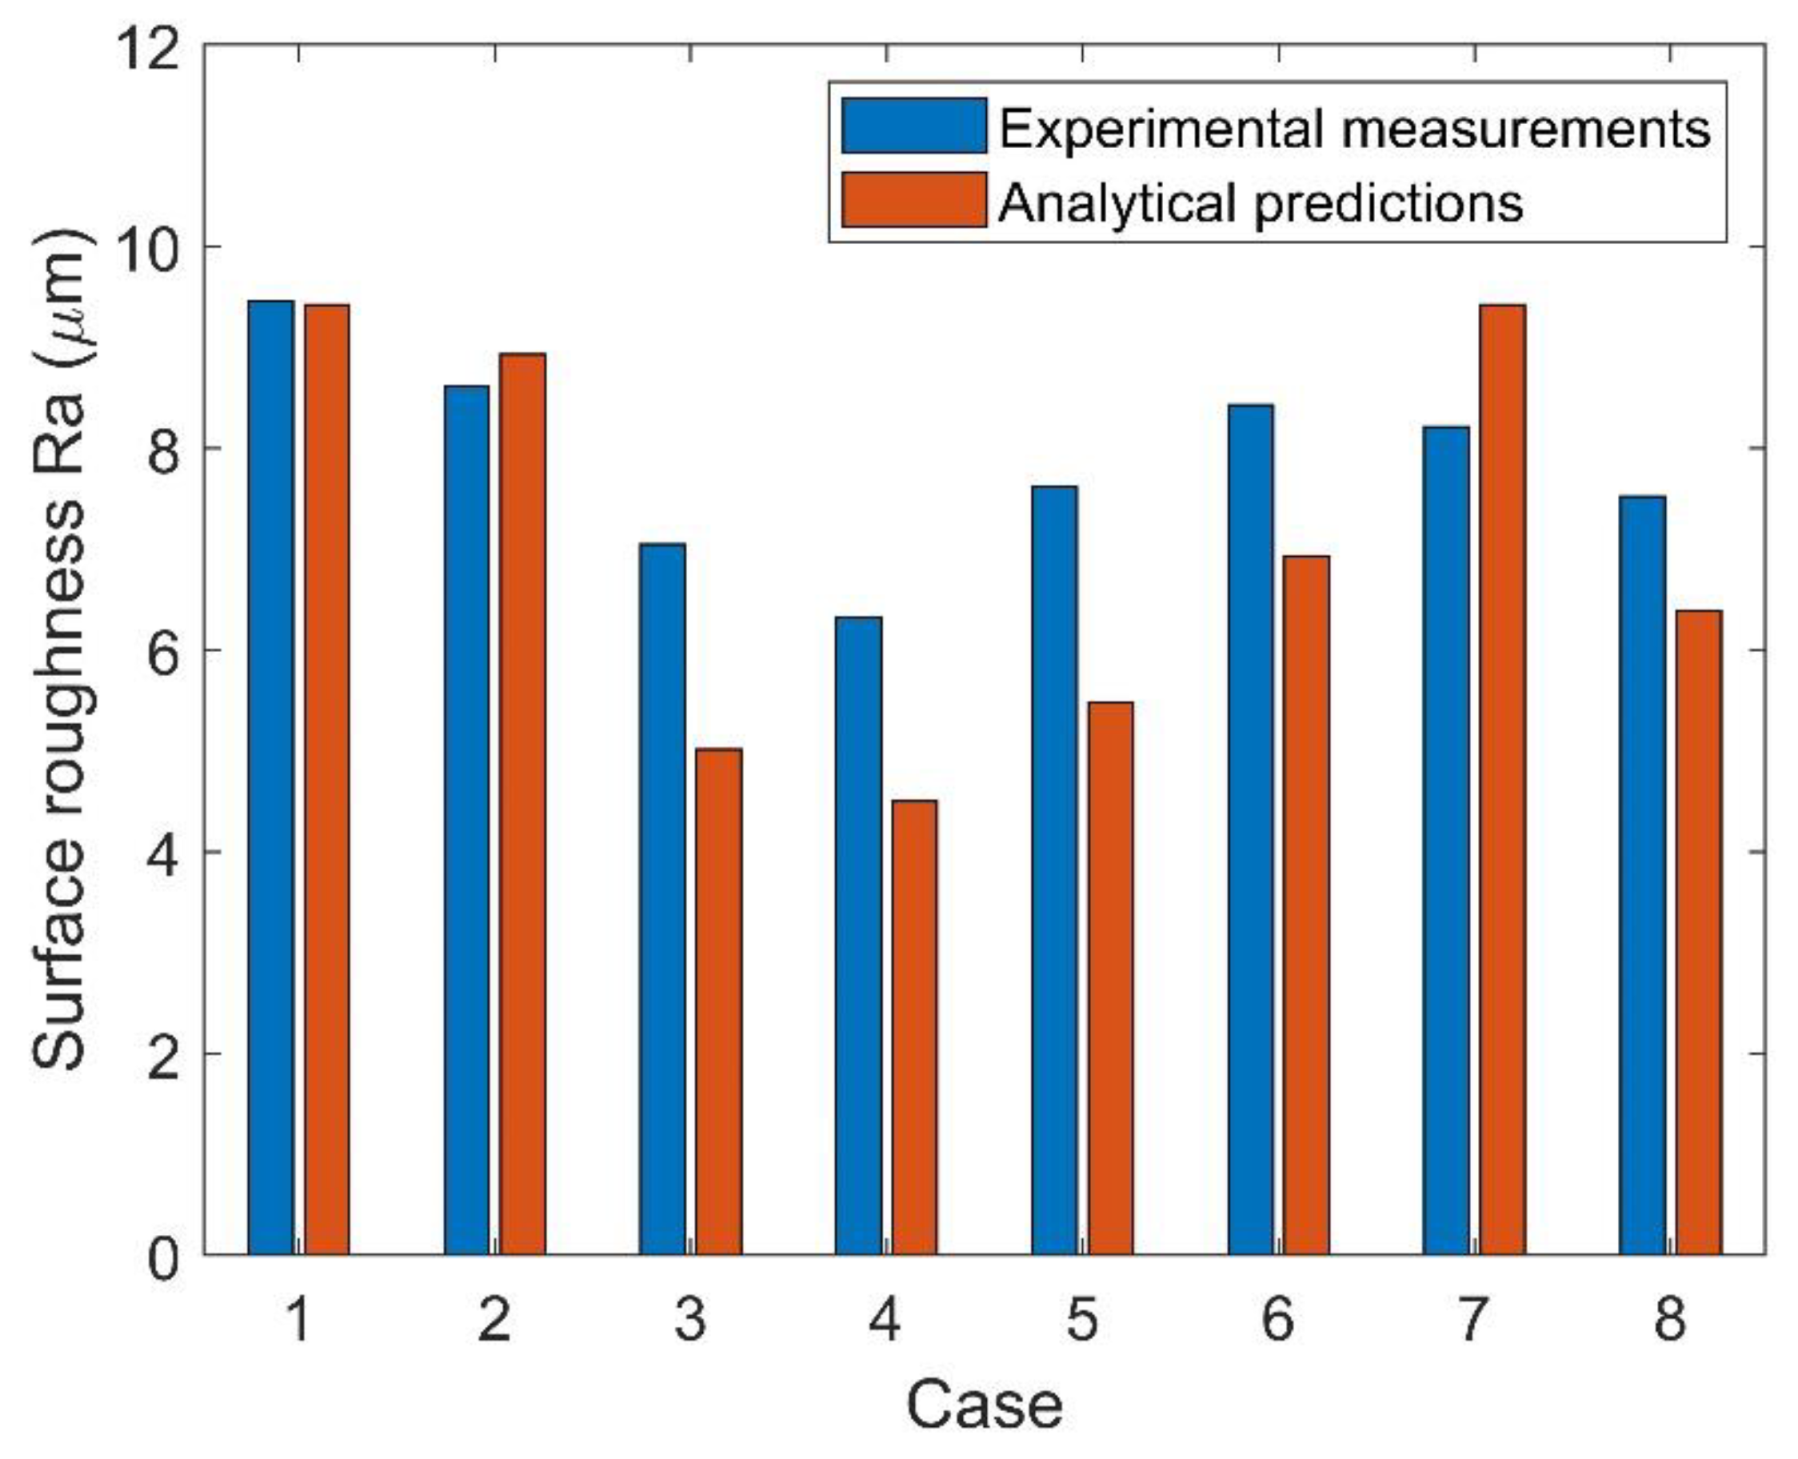
3. Experimental Validation and Analysis

This study developed an analytical model to correlate the upper surface roughness in LPBF with process conditions and material properties directly, without including any finite element-based numerical methods. The predicted results of upper surface roughness under various combinations of process conditions were validated against the experimental measurements of 316L stainless steel reported in [2]. The material properties of SS 316L are shown in Table 1. Thermal conductivity and heat capacity are assumed to be temperature-independent in this study, as required by the basic assumptions of the moving point heat source model. The laser power absorptivity employed in the modeling is 0.3, which was reported in the literature [18]. It has been reported that laser absorptivity in LPBF is influenced by many parameters, such as the characteristics of the laser source, properties of the powder bed, and process conditions of LPBF [26]. The process parameters employed in the modeling are shown in Table 2, including the laser power, scan speed, hatch space, and energy density. The scanning strategy is uni-directional for this study. The initial temperature is 293 K. It should be noted that the energy density [6] E of each case was defined as
E = P V × s × L
The temperature profiles during the melting process were first predicted using the moving point heat source model. Figure 3 shows the temperature distribution of Case 5. After comparing the temperature distribution with the melting temperature of the material, the shapes of the molten pool in the melting process were then determined. For example, the yellow portion in Figure 3 represents the transverse cross-section of the molten pool for Case 5, in which the temperature is above the melting point. Based on the temperature profiles and molten pool shapes, the width of the powder consumed band, molten pool width after solidification, and the re-melted depth were obtained, as illustrated in Figure 3. The surface roughness under different combinations of process conditions were then calculated through Equations (3)–(5).
The comparison between predicted upper surface roughness and experimental results is shown in Figure 4. It can be observed that the predictions have an acceptable agreement with the experimental data. The sensitivity of surface roughness to scan speed and laser power can be seen in Figure 5a,b, respectively. The surface roughness will increase with the scan speed and decrease with laser power. When the other parameters are not changed, increasing the scan speed or decreasing the laser power will decrease the energy density and thus decrease the molten pool size, which will lead to a lower overlapping of molten pools and higher surface roughness. The sensitivity of surface roughness to hatch space is shown in Figure 5c. It can be observed from this figure that the surface roughness will increase with hatch space. When the hatch space becomes larger, the overlapping between adjacent melting tracks will decrease, which will lead to the lower intersection height k and a higher surface roughness.
The presented analytical modelling strategy has shown its acceptable accuracy in the prediction of surface roughness. In addition, the computational efficiency of the proposed method is high because no iteration-based calculations are included in this method. In future studies, the proposed modeling method can be improved by considering more process parameters in LPBF, such as the laser spot size, atmosphere, and scanning strategy. The laser spot size will affect the laser absorptivity [26], which will then affect the molten pool geometries and finally affect the surface roughness. The oxygen in the atmosphere will influence the formation of balling defects [28], which will lead to poor surface quality of the final product in LPBF. When using a complex scanning strategy in LPBF, the overlapping pattern of molten pools in multiple scan tracks and layers will be more complex, and the proposed model needs to be improved to a 3D model to calculate three-dimensional surface texture (Sa). The consideration of these process parameters in future models will increase the predictive accuracy and make the model more useful.

4. Conclusions

In this study, a physics-based analytical modeling method was developed to predict the upper surface roughness of parts made by laser powder bed fusion (LPBF) process. A moving point heat source solution for semi-infinite medium was employed to calculate the temperature profiles in the melting process. The molten pool width and newly melted area of powder layer were obtained by comparing the temperature distribution with the melting temperature of the material. The cross-sectional cap shape of a solidified melting track was assumed to be half-elliptical. The molten pool height was then obtained based on the principle of mass conservation. With the half-elliptical assumption and obtained molten pool size, as well as process conditions, the overlapping pattern of multiple molten pool cross-sections of adjacent melting tracks was determined. The analytical expression of the overlapping pattern was obtained by putting it in a 2D coordinate system. Based on the overlapping pattern and the definition of surface roughness, the analytical expression of upper surface roughness (Ra) was derived.
The predicted results of surface roughness under different combinations of process conditions were compared with experimental measurements of 316L stainless steel to validate the predictive accuracy of the proposed analytical model. The predicted results show acceptable agreement with experimental data. From the sensitivity analyses, it can be found that the upper surface roughness shows an increasing trend with hatch space and scan speed, and a decreasing trend with laser power. The proposed analytical method in this study does not include any numerical iterations, so it can work as an efficient prediction tool for surface roughness in LPBF. In addition, the presented modeling method can be a good basis for the future research of modeling techniques for additive manufacturing processes.

Author Contributions

Conceptualization, W.W.; Methodology, W.W.; Software, W.W.; Validation, W.W.; Formal Analysis, W.W.; Investigation, W.W.; Resources, W.W., H.G. and S.Y.L.; Data Curation, W.W.; Writing—Original Draft Preparation, W.W.; Writing—Review and Editing, W.W., H.G. and S.Y.L.; Visualization, W.W., H.G. and S.Y.L.; Supervision, H.G. and S.Y.L.; Project Administration, H.G. and S.Y.L. All authors have read and agreed to the published version of the manuscript.

Funding

This research received no external funding.

Institutional Review Board Statement

Not applicable.

Informed Consent Statement

Not applicable.

Data Availability Statement

Not applicable.

Conflicts of Interest

The authors declare no conflict of interest.

References

  1. Cunningham, R.; Zhao, C.; Parab, N.; Kantzos, C.; Pauza, J.; Fezzaa, K.; Tao, S.; Rollett, A.D. Keyhole threshold and morphology in laser melting revealed by ultrahigh-speed X-ray imaging. Science 2019, 363, 849–852. [Google Scholar] [CrossRef] [PubMed]
  2. Wang, D.; Liu, Y.; Yang, Y.; Xiao, D. Theoretical and experimental study on surface roughness of 316L stainless steel metal parts obtained through selective laser melting. Rapid Prototyp. J. 2016, 22, 706–716. [Google Scholar] [CrossRef]
  3. Mumtaz, K.; Hopkinson, N. Top surface and side roughness of Inconel 625 parts processed using selective laser melting. Rapid Prototyp. J. 2009, 2, 96–103. [Google Scholar] [CrossRef]
  4. Dilip, J.J.S.; Zhang, S.; Teng, C.; Zeng, K.; Robinson, C.; Pal, D.; Stucker, B. Influence of processing parameters on the evolution of melt pool, porosity, and microstructures in Ti-6Al-4V alloy parts fabricated by selective laser melting. Prog. Addit. Manuf. 2017, 2, 157–167. [Google Scholar] [CrossRef] [Green Version]
  5. Scime, L.; Beuth, J. Melt pool geometry and morphology variability for the Inconel 718 alloy in a laser powder bed fusion additive manufacturing process. Addit. Manuf. 2019, 29, 100830. [Google Scholar] [CrossRef]
  6. Gong, H.; Rafi, K.; Gu, H.; Ram, G.D.J.; Starr, T.; Stucker, B. Influence of defects on mechanical properties of Ti–6Al–4 V components produced by selective laser melting and electron beam melting. Mater. Design 2015, 86, 545–554. [Google Scholar] [CrossRef]
  7. Calignano, F. Investigation of the accuracy and roughness in the laser powder bed fusion process. Virtual Phys. Prototyp. 2018, 13, 97–104. [Google Scholar] [CrossRef]
  8. Spierings, A.B.; Herres, N.; Levy, G. Influence of the particle size distribution on surface quality and mechanical properties in AM steel parts. Rapid Prototyp. J. 2011, 17, 195–202. [Google Scholar] [CrossRef] [Green Version]
  9. Li, R.; Yusheng, S.; Jinhui, L.; Huashan, Y.; Wenxian, Z. Effects of processing parameters on the temperature field of selective laser melting metal powder. Powder Metall. Met. Ceram. 2009, 48, 186–195. [Google Scholar] [CrossRef]
  10. Karayagiz, K.; Elwany, A.; Tapia, G.; Franco, B.; Johnson, L.; Ma, J.; Karaman, I.; Arróyave, R. Numerical and experimental analysis of heat distribution in the laser powder bed fusion of Ti-6Al-4V. IISE Trans. 2019, 51, 136–152. [Google Scholar] [CrossRef]
  11. Lee, Y.S.; Zhang, W. Modeling of heat transfer, fluid flow and solidification microstructure of nickel-base superalloy fabricated by laser powder bed fusion. Addit. Manuf. 2016, 12, 178–188. [Google Scholar] [CrossRef] [Green Version]
  12. Foroozmehr, A.; Badrossamay, M.; Foroozmehr, E.; Golabi, S. Finite element simulation of selective laser melting process considering optical penetration depth of laser in powder bed. Mater. Design 2016, 89, 255–263. [Google Scholar] [CrossRef]
  13. Mukherjee, T.; DebRoy, T. Mitigation of lack of fusion defects in powder bed fusion additive manufacturing. J. Manuf. Processes 2018, 36, 442–449. [Google Scholar] [CrossRef]
  14. Feng, S.; Kamat, A.M.; Sabooni, S.; Pei, Y. Experimental and numerical investigation of the origin of surface roughness in laser powder bed fused overhang regions. Virtual Phys. Prototyp. 2021, 16, 1–19. [Google Scholar] [CrossRef]
  15. Tang, C.; Le, K.Q.; Wong, C.H. Physics of humping formation in laser powder bed fusion. Int. J. Heat Mass Transf. 2020, 149, 119172. [Google Scholar] [CrossRef]
  16. Promoppatum, P.; Yao, S.C. Analytical evaluation of defect generation for selective laser melting of metals. Int. J. Adv. Manuf. Technol. 2019, 103, 1185–1198. [Google Scholar] [CrossRef]
  17. Ning, J.; Mirkoohi, E.; Dong, Y.; Sievers, D.E.; Garmestani, H.; Liang, S.Y. Analytical modeling of 3D temperature distribution in selective laser melting of Ti-6Al-4V considering part boundary conditions. J. Manuf. Processes 2019, 44, 319–326. [Google Scholar] [CrossRef]
  18. Tang, M.; Pistorius, P.C.; Beuth, J.L. Prediction of lack-of-fusion porosity for powder bed fusion. Addit. Manuf. 2017, 14, 39–48. [Google Scholar] [CrossRef]
  19. Wang, W.; Ning, J.; Liang, S.Y. Prediction of lack-of-fusion porosity in laser powder-bed fusion considering boundary conditions and sensitivity to laser power absorption. Int. J. Adv. Manuf. Technol. 2021, 112, 61–70. [Google Scholar] [CrossRef]
  20. Wang, W.; Ning, J.; Liang, S.Y. In-Situ Distortion Prediction in Metal Additive Manufacturing Considering Boundary Conditions. Int. J. Precis. Eng. Manuf. 2021, 22, 909–917. [Google Scholar] [CrossRef]
  21. Ning, J.; Praniewicz, M.; Wang, W.; Dobbs, J.R.; Liang, S.Y. Analytical modeling of part distortion in metal additive manufacturing. Int. J. Adv. Manuf. Technol. 2020, 107, 49–57. [Google Scholar] [CrossRef]
  22. Yadroitsev, I.; Gusarov, A.; Yadroitsava, I.; Smurov, I. Single track formation in selective laser melting of metal powders. J. Mater. Process. Technol. 2010, 210, 1624–1631. [Google Scholar] [CrossRef]
  23. Carslaw, H.S.; Jaeger, J.C. Conduction of Heat in Solids; No. 536.23; Clarendon Press: Oxford, UK, 1959. [Google Scholar]
  24. Whitehouse, D.J. Surfaces and their Measurement; CRC Press: Boca Raton, FL, USA, 2002. [Google Scholar]
  25. Bhushan, B. Surface Roughness Analysis and Measurement Techniques. In Modern Tribology Handbook, Two Volume Set; CRC Press: Boca Raton, FL, USA, 2000; pp. 79–150. [Google Scholar]
  26. Trapp, J.; Rubenchik, A.M.; Guss, G.; Matthews, M.J. In situ absorptivity measurements of metallic powders during laser powder-bed fusion additive manufacturing. Appl. Mater. Today 2017, 9, 341–349. [Google Scholar] [CrossRef]
  27. Zhang, Y.; Zhang, J. Modeling of solidification microstructure evolution in laser powder bed fusion fabricated 316L stainless steel using combined computational fluid dynamics and cellular automata. Addit. Manuf. 2019, 28, 750–765. [Google Scholar] [CrossRef]
  28. Li, R.; Liu, J.; Shi, Y.; Wang, L.; Jiang, W. Balling behavior of stainless steel and nickel powder during selective laser melting process. Int. J. Adv. Manuf. Technol. 2012, 59, 1025–1035. [Google Scholar] [CrossRef]
Figure 1. Illustration of the molten pool in melting process (top) and after solidification (bottom). W 0 represents the width of powder consumed band. W represents the molten pool width after solidification. h denotes the cap height (molten pool height after solidification). L represents the layer thickness. d denotes the re-melted depth.
Metals 12 00011 g001
Figure 2. Steps to derive the analytical expression of surface roughness Ra.   h denotes the cap height, d   denotes the re-melted depth, W represents the molten pool width, and s is the hatch space. k represents the intersection height of adjacent melting tracks as measured from the base of the cap area. c   represents the height of mean line of the surface profile. y ,   z represent the transverse direction and build direction, respectively.
Metals 12 00011 g002
Figure 3. Temperature distribution in y-z plane. Laser power is 500 W. Scan speed is 400 mm/s. Hatch space is 80 µm. Layer thickness is 35 µm. The yellow portion represents the molten pool transverse cross-section. W 0 represents the width of powder consumed band. W represents the molten pool width after solidification. L represents the layer thickness. d denotes the remelted depth.
Metals 12 00011 g003
Figure 4. Comparison between predicted and measured surface roughness Ra.
Metals 12 00011 g004
Figure 5. Sensitivity analyses. (a) Sensitivity to scan speed. Laser power is 150 W. Hatch space is 80 µm. (b) Sensitivity to laser power. Scan speed is 400 mm/s. Hatch space is 80 µm. (c) Sensitivity to hatch space. Laser power is 150 W. Scan speed is 400 mm/s. Layer thickness is 35 µm for all sensitivity analyses.
Metals 12 00011 g005
Table 1. Material properties of SS316L [18,27].
NameSymbolValueUnit
Density ρ 7800kg/m3
Thermal conductivity K 14 W / m · K
Specific heat c p 460 J / kg · K
Melting point T m 1678K
Absorptivity η 0.31
Table 2. Validation of predicted results against experimental data. The layer thickness is 35 µm.
CasePower (W)Scan
Velocity (mm/s)
Hatch Space (µm)Energy
Density
(J/mm3)
Calculated
Molten Pool
Width
(µm)
Calculated
Molten Pool
Height (µm)
Measured
Roughness (µm) [2]
Predicted
Roughness (µm)
Absolute
Percentage
Error
(%)
11004008089.381549.59.40.4
21507007087.573568.68.93.7
315040090119.0111507.15.028.9
415045080119.0104506.34.528.8
515050080107.196517.65.528.0
61505508097.489528.46.917.7
71506008089.381548.29.414.7
815060070102.081547.56.415.0
Publisher’s Note: MDPI stays neutral with regard to jurisdictional claims in published maps and institutional affiliations.

