This section is organized in two main parts. In the first part, we make use of the principal strain space and focus on material flow and failure by cracking in incremental tube expansion. Results obtained from conventional tube expansion are included for comparison purposes. In the second part, we discusses the application of different integral forms of stress triaxiality in the effective strain vs. stress triaxiality space to solve an apparent contradiction: on one hand, the in-plane strains of incremental tube expansion exceed the threshold admissible values of the FFL, which were previously determined by means conventional tube forming processes, and on the other hand, the FFL is a material property, and therefore, its threshold values cannot be surpassed and must be independent of any type of applied loading.
3.1. Material Flow and Cracking
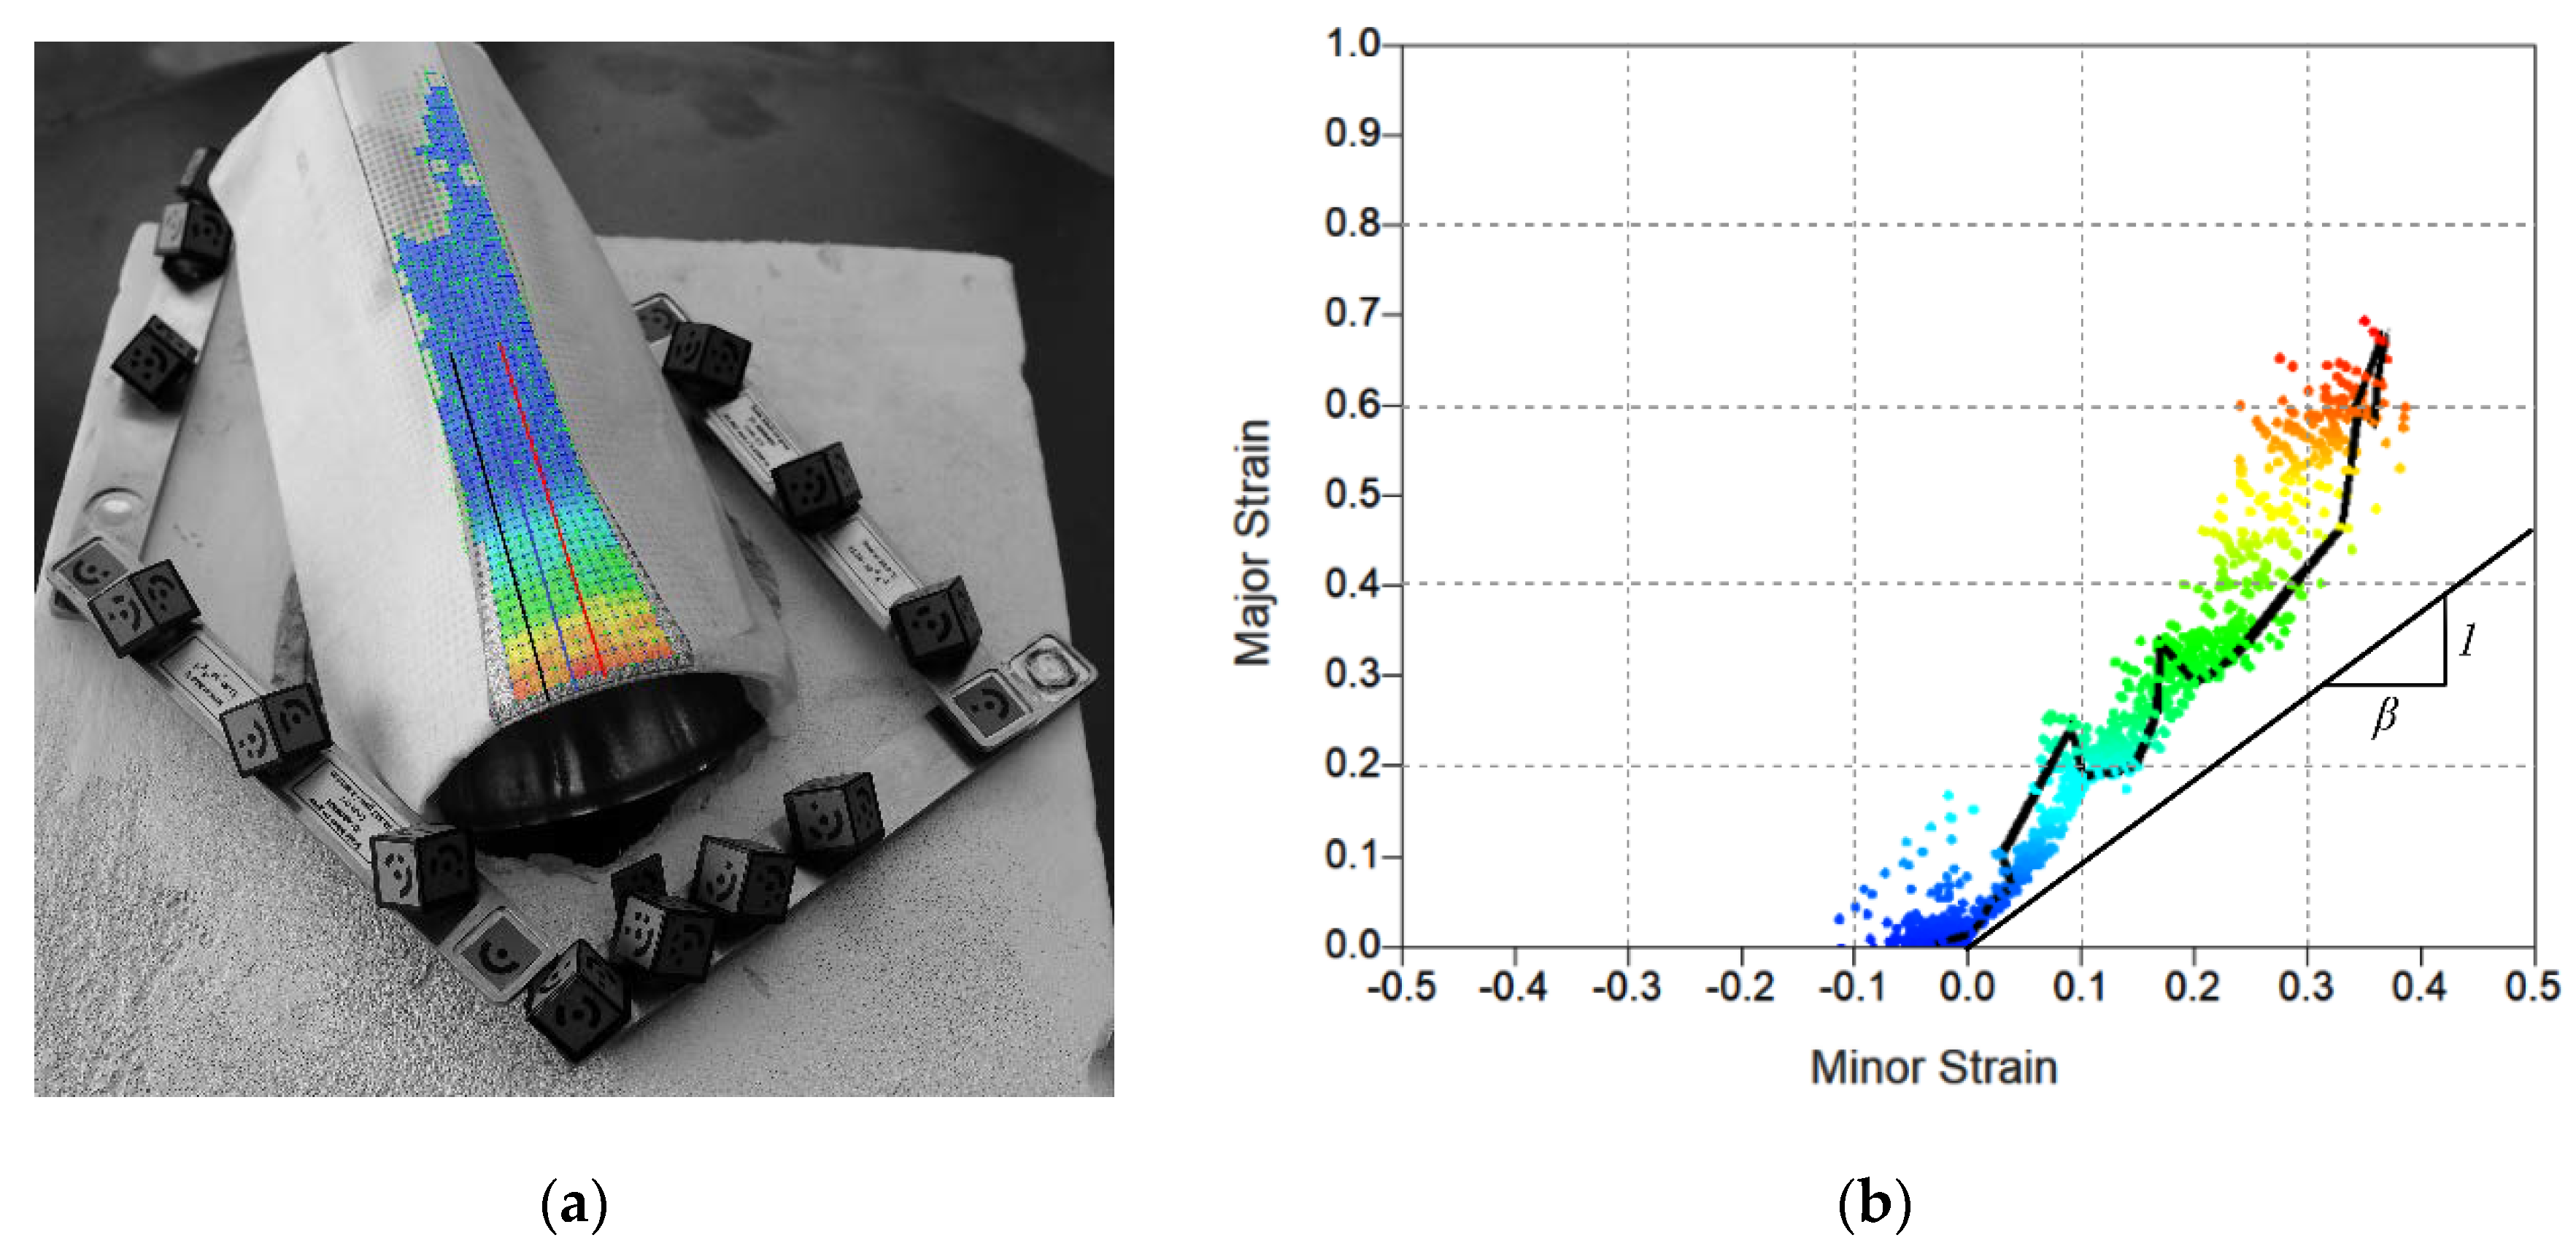
Figure 8 shows the experimental in-plane strains along the longitudinal cross sections of the incremental tube expansion specimens in principal strain space. The results were obtained by ARGUS
® (refer to the open triangular markers) for three test repetitions consisting of eight forming stages each. Numerical predictions obtained by finite element modelling with DEFORM™-3D are enclosed and confirm that incremental tube expansion subject the material to biaxial stretching conditions.
The in-plane strains at the onset of fracture by tension are represented by the solid black triangular marker and its determination involved measuring the tube wall thickness at the vicinity of the incipient cracking zone and calculating the through-thickness strain at fracture to obtain the ‘gauge length’ strains .
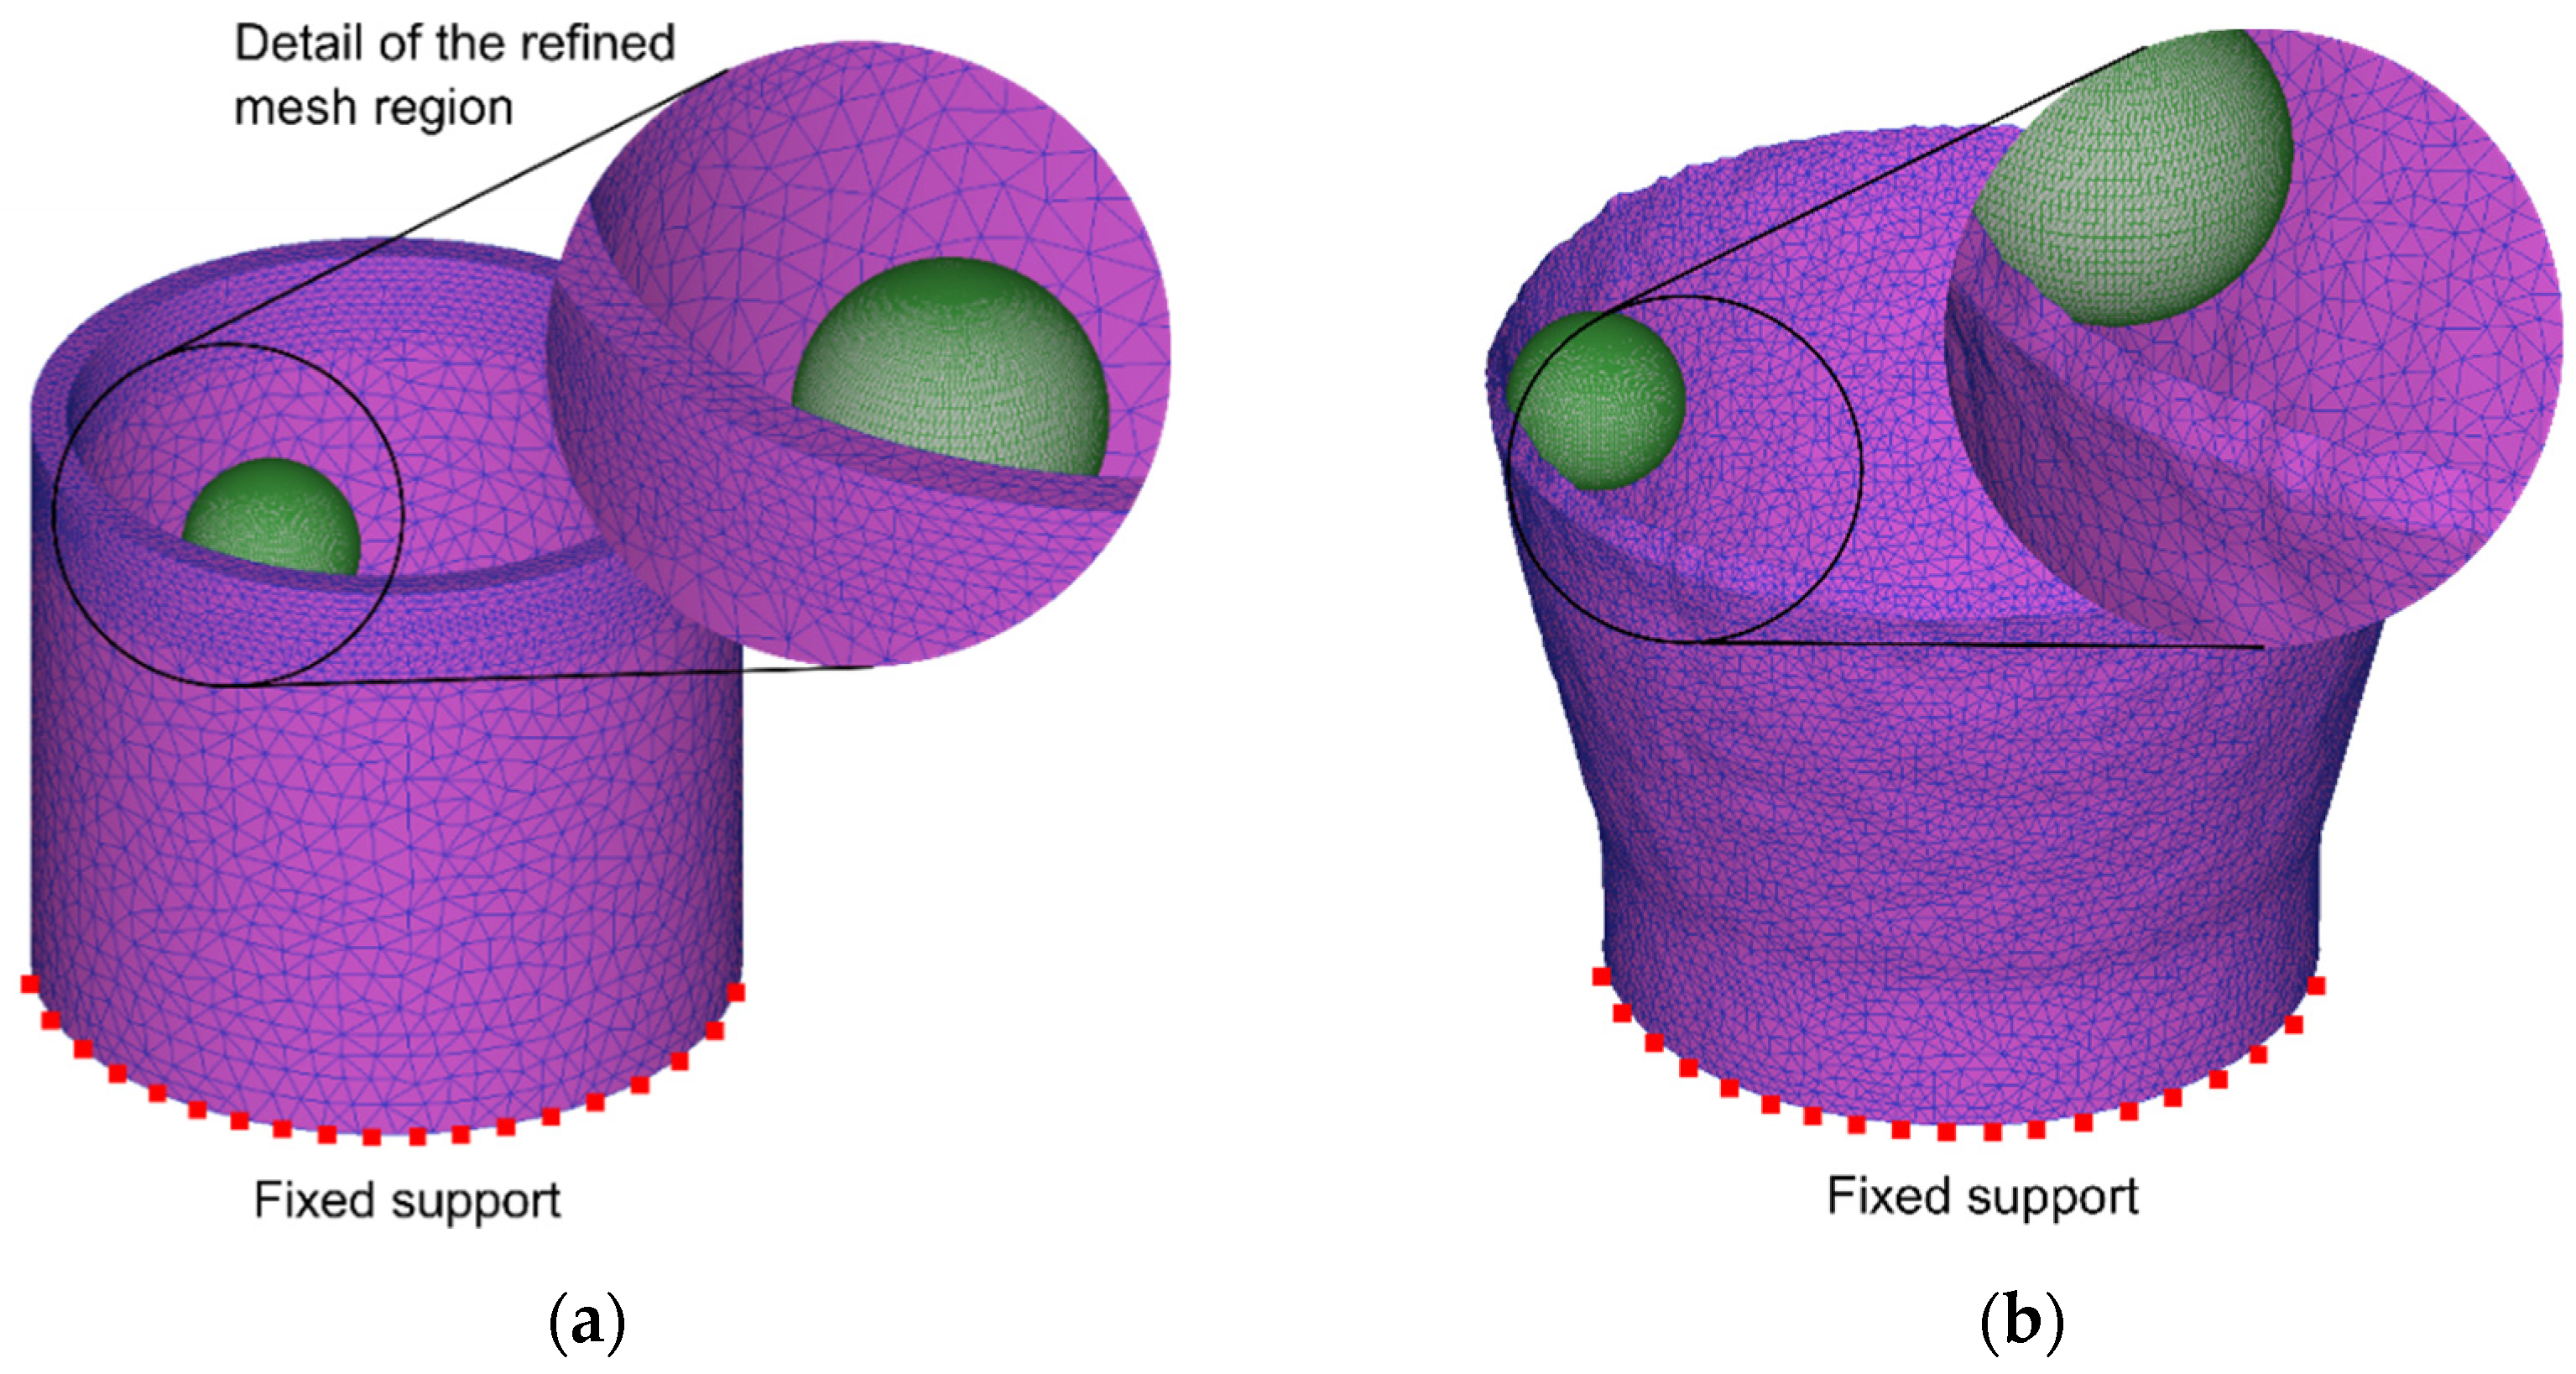
This alternative procedure was necessary because neither ARGUS® nor DEFORM™-3D could provide the in-plane strains at fracture. In fact, the application of circle grids with very small diameters to obtain the in-plane strains in the cracked region by means of ARGUS® is not feasible because it creates measurement problems and delivers values that cannot be considered fracture strains due to inhomogeneous material deformation around the cracks. Similar problems exist in finite element modelling with the use of very refined meshes in the regions where the cracks are likely to be triggered, plus the additional difficulty resulting from these results being sensitive to mesh size.
Under these circumstances, the authors had to measure the tube wall thickness in a NICON
® SMZ800 optical microscope equipped with a NIS-Elements
® D software version 5.11.01.
Figure 9 shows a longitudinal cross-section detail after completion of the incremental tube expansion process with the corresponding evolution of thickness along the longitudinal direction (starting from the upper tube end). As seen, two different regions may be distinguished: (i) a first region (labeled as “I”) located near the upper tube end that is characterized by a sharp decrease in wall thickness and (ii) a second region (labelled as “II”), in which the wall thickness progressively increases, as the distance to the upper tube end increases and approaches the undeformed region (not subjected to incremental expansion), along which the tube wall thickness
mm remained unchanged.
Two main conclusions can be inferred from
Figure 9: (i) failure by cracking is not preceded by necking and (ii) failure by cracking is related to a sharp decrease in the tube wall thickness in a small region “I” subjected to a great amount of straining. As seen, there is no localized thickness reduction in the detail of the tube section after the last forming stage of incremental expansion. This observation combined with the monotonic increase in the strain loading path up to fracture shown in
Figure 8 (refer to the black triangular markers) allow concluding that failure occurs without previous necking.
A closer observation of the tube wall thickness within region “I” confirms the existence of micro-cracks along its length, as it was previously stated by Cristino et al. [
16], and justifies the reason why the experimental determination of the “gauge length” strains
at fracture was made at point “A” (
Figure 9) located 1.5 mm away from the upper tube end, in the transition between regions “I” and “II”.
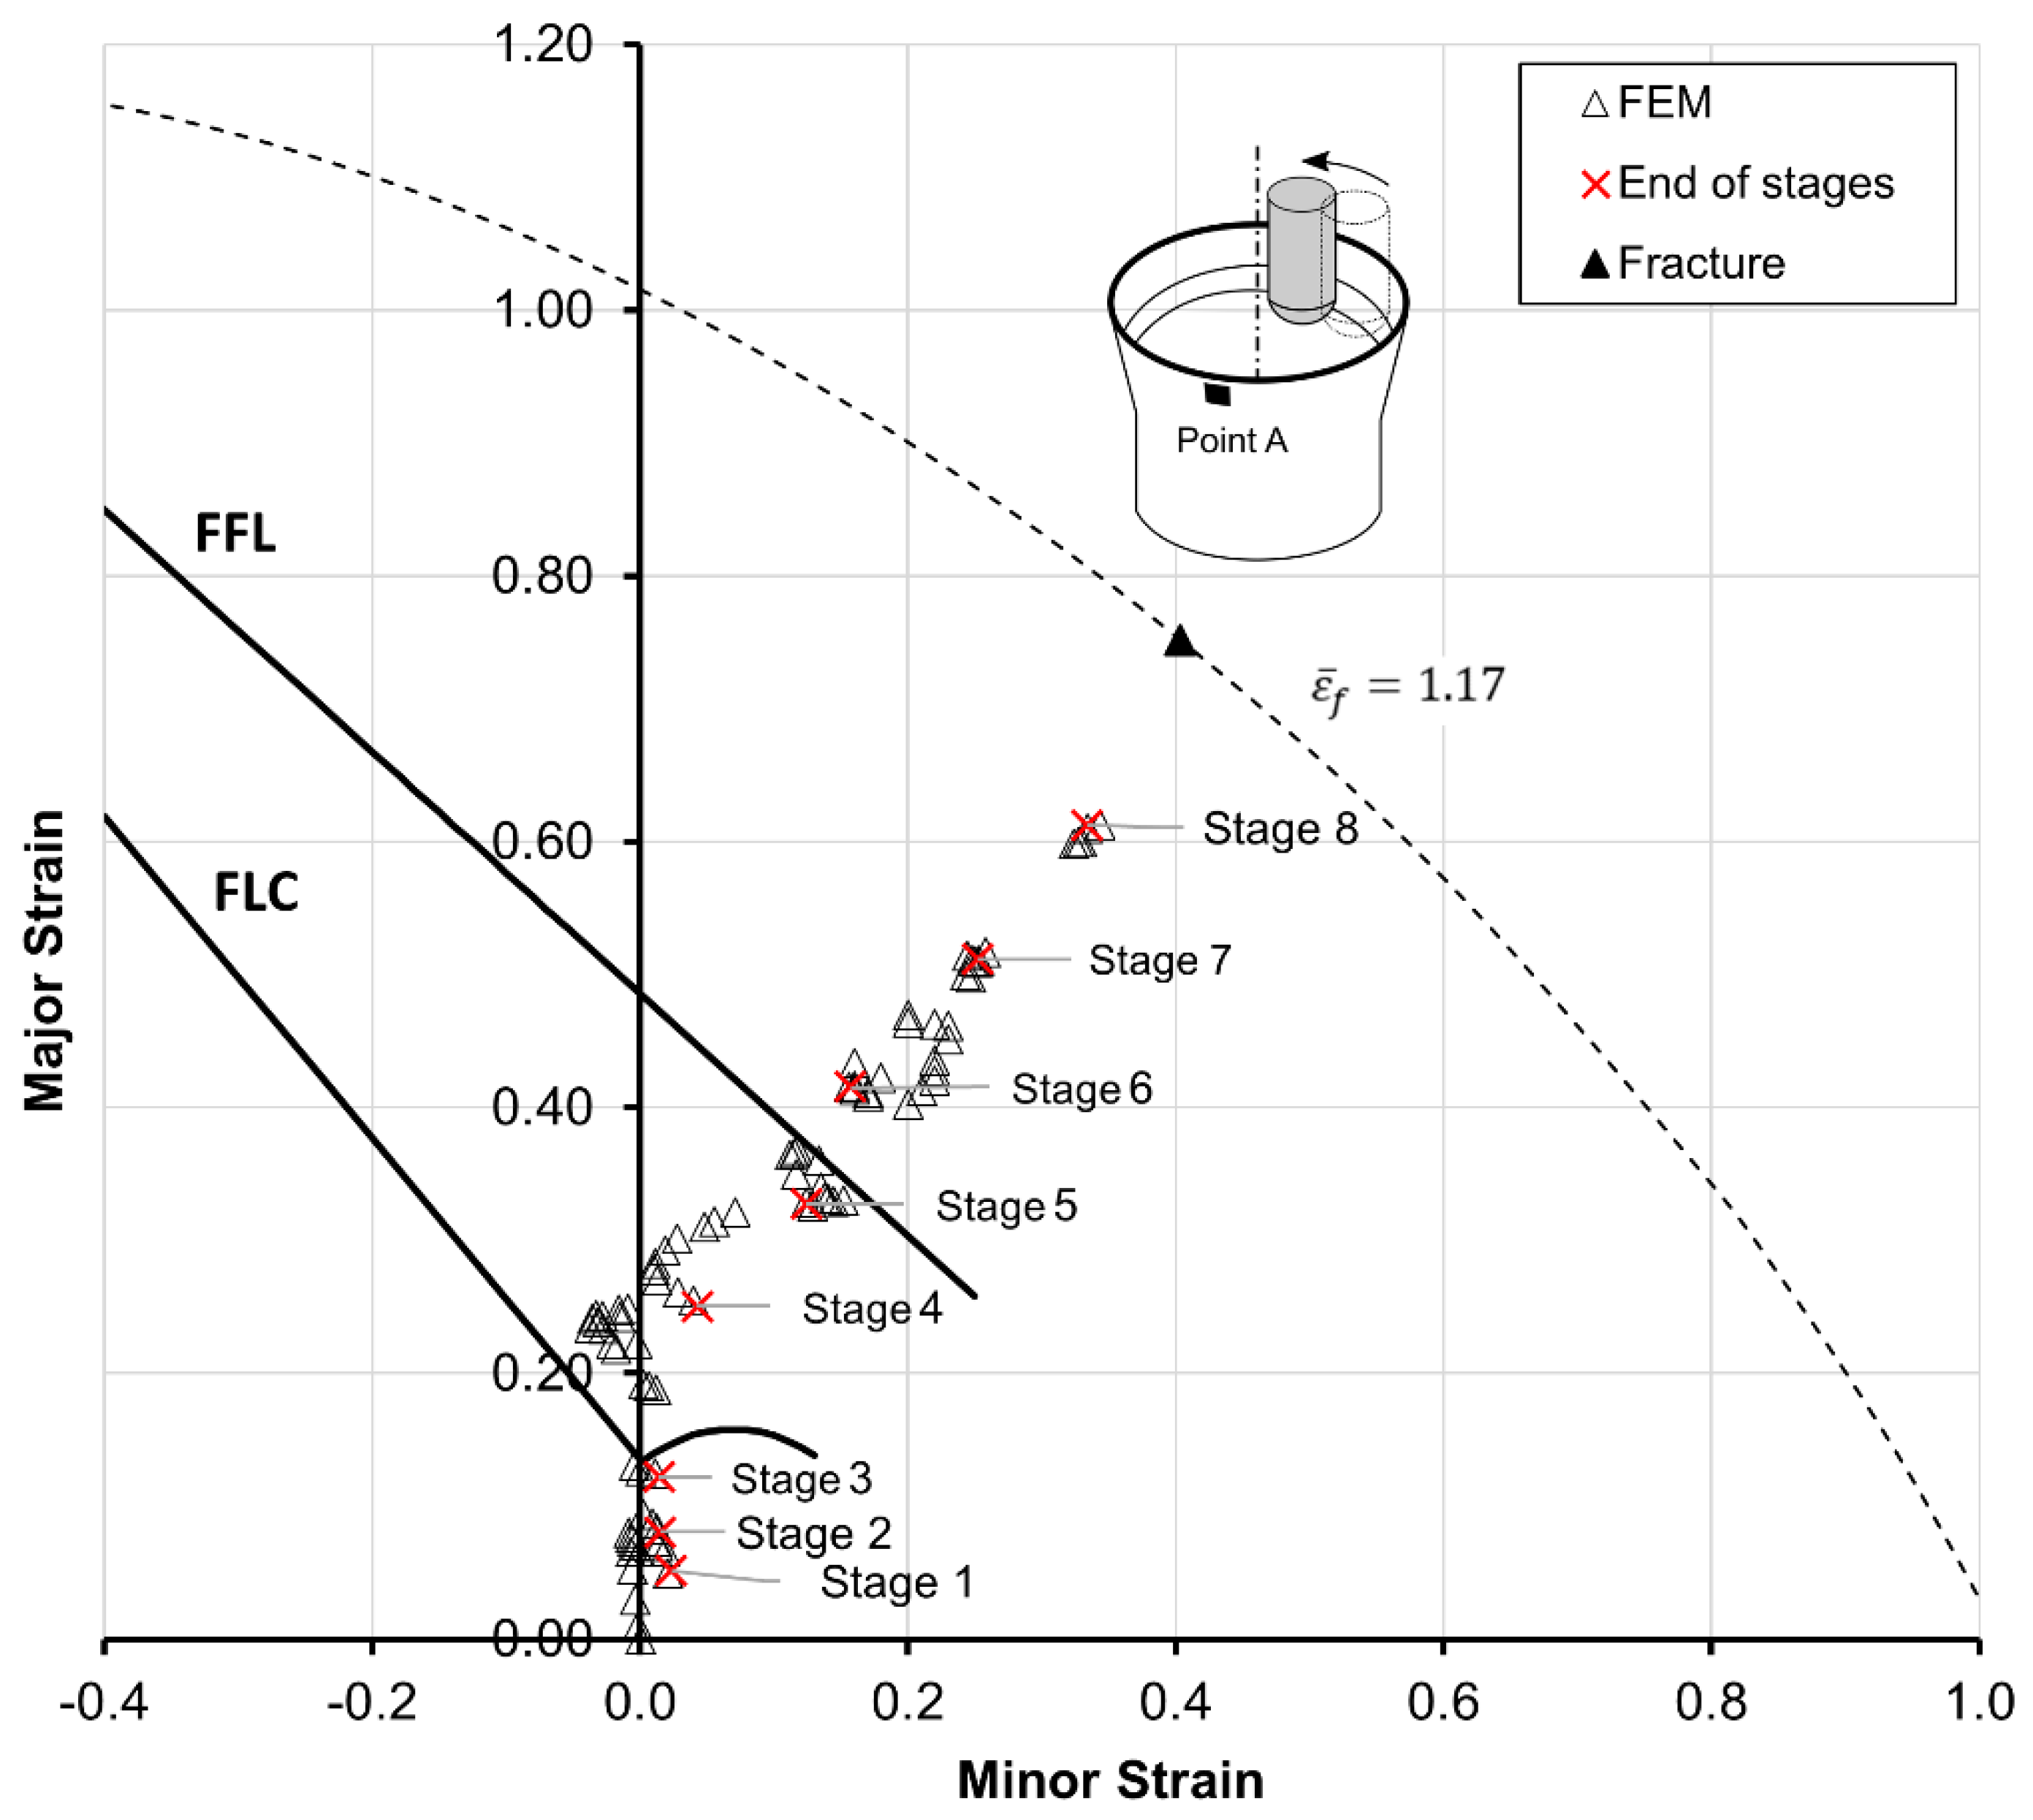
The finite element predicted evolution of the in-plane strains at point “A” for each individual stage of the incremental tube expansion process is shown in
Figure 10. As mentioned before, the “gauge length” strains
at fracture (refer to the black solid triangular marker) were not obtained by finite elements and their determination made use of the tube wall thickness value at point “A” (
Figure 9b) to calculate the through-thickness strain
at fracture.
Then, assuming material incompressibility and the final slope
of the strain loading path to remain identical to that of the last piecewise linear path obtained by ARGUS
® (
Figure 8), it was possible to determine the ‘gauge length’ strains
at fracture, as follows:
The corresponding effective strain at fracture
was obtained from Equation (4) and defines a dashed ellipse of constant effective strain values in principal strain space (refer to both
Figure 8 and
Figure 9).
The comparison of the results obtained for incremental tube expansion against those obtained for conventional tube expansion with a rigid tapered conical punch [
9,
10,
11,
12] allowed identifying two main differences regarding material flow and cracking. First, incremental tube expansion is performed under biaxial stretching conditions, whereas conventional tube expansion subjects the material to near pure tension. Second, both processes fail by tensile stresses (opening mode I), but while fracture in incremental tube expansion is not preceded by necking, that is not the case in conventional tube expansion, in which fracture is preceded by localized necking.
Even though all the experimental and theoretical results presented in this section are consistent and compatible, there is a fundamental problem arising from the fact that in-plane strains of incremental tube expansion are far greater than the threshold admissible values given by the FFL. Because the FFL is a material property, whose values cannot be surpassed, Cristino et al. [
16] put forward the possibility of the FFL having an upward curvature in the first quadrant of principal strain space to accommodate the values in excess (i.e., to accommodate the in-plane strains located above the straight line falling from left to right), but they did not provide evidence for this type of tube material.
In connection to this, it is worth noticing that recent published works in incremental sheet forming also report the existence of strain paths that go beyond the FFL determined by means of conventional sheet forming tests with proportional strain paths [
22].
The following section focuses on this problem and aims at providing an explanation for the reason why the critical strains of incremental tube expansion at fracture are far superior to those of conventional tube expansion that is simultaneously compatible with the FFL being a material property, whose threshold values cannot be surpassed by any type of loading. The explanation will make use of the effective strain vs. stress triaxiality space instead of the principal strain space.
3.2. FFL and Stress Triaxiality under Non-Proportional Paths
Damage accumulation associated to growth and coalescence of voids subjected to tensile normal stresses (Mode I) accounts for the dilatational effects related to stress triaxiality
, in the form of a weighted integral form of the effective plastic strain [
23,
24,
25].
The critical damage at the onset of fracture (FFL) corresponds to the maximum admissible accumulated value of effective strain for a given strain path.
The accumulation of damage
in principal strain space often distinguishes between two different types of strain paths: (i) linear, proportional strain paths (
Figure 11a) and (ii) non-proportional strain paths, which are often discretized through a series of piecewise linear strain paths for calculation purposes (
Figure 11b).
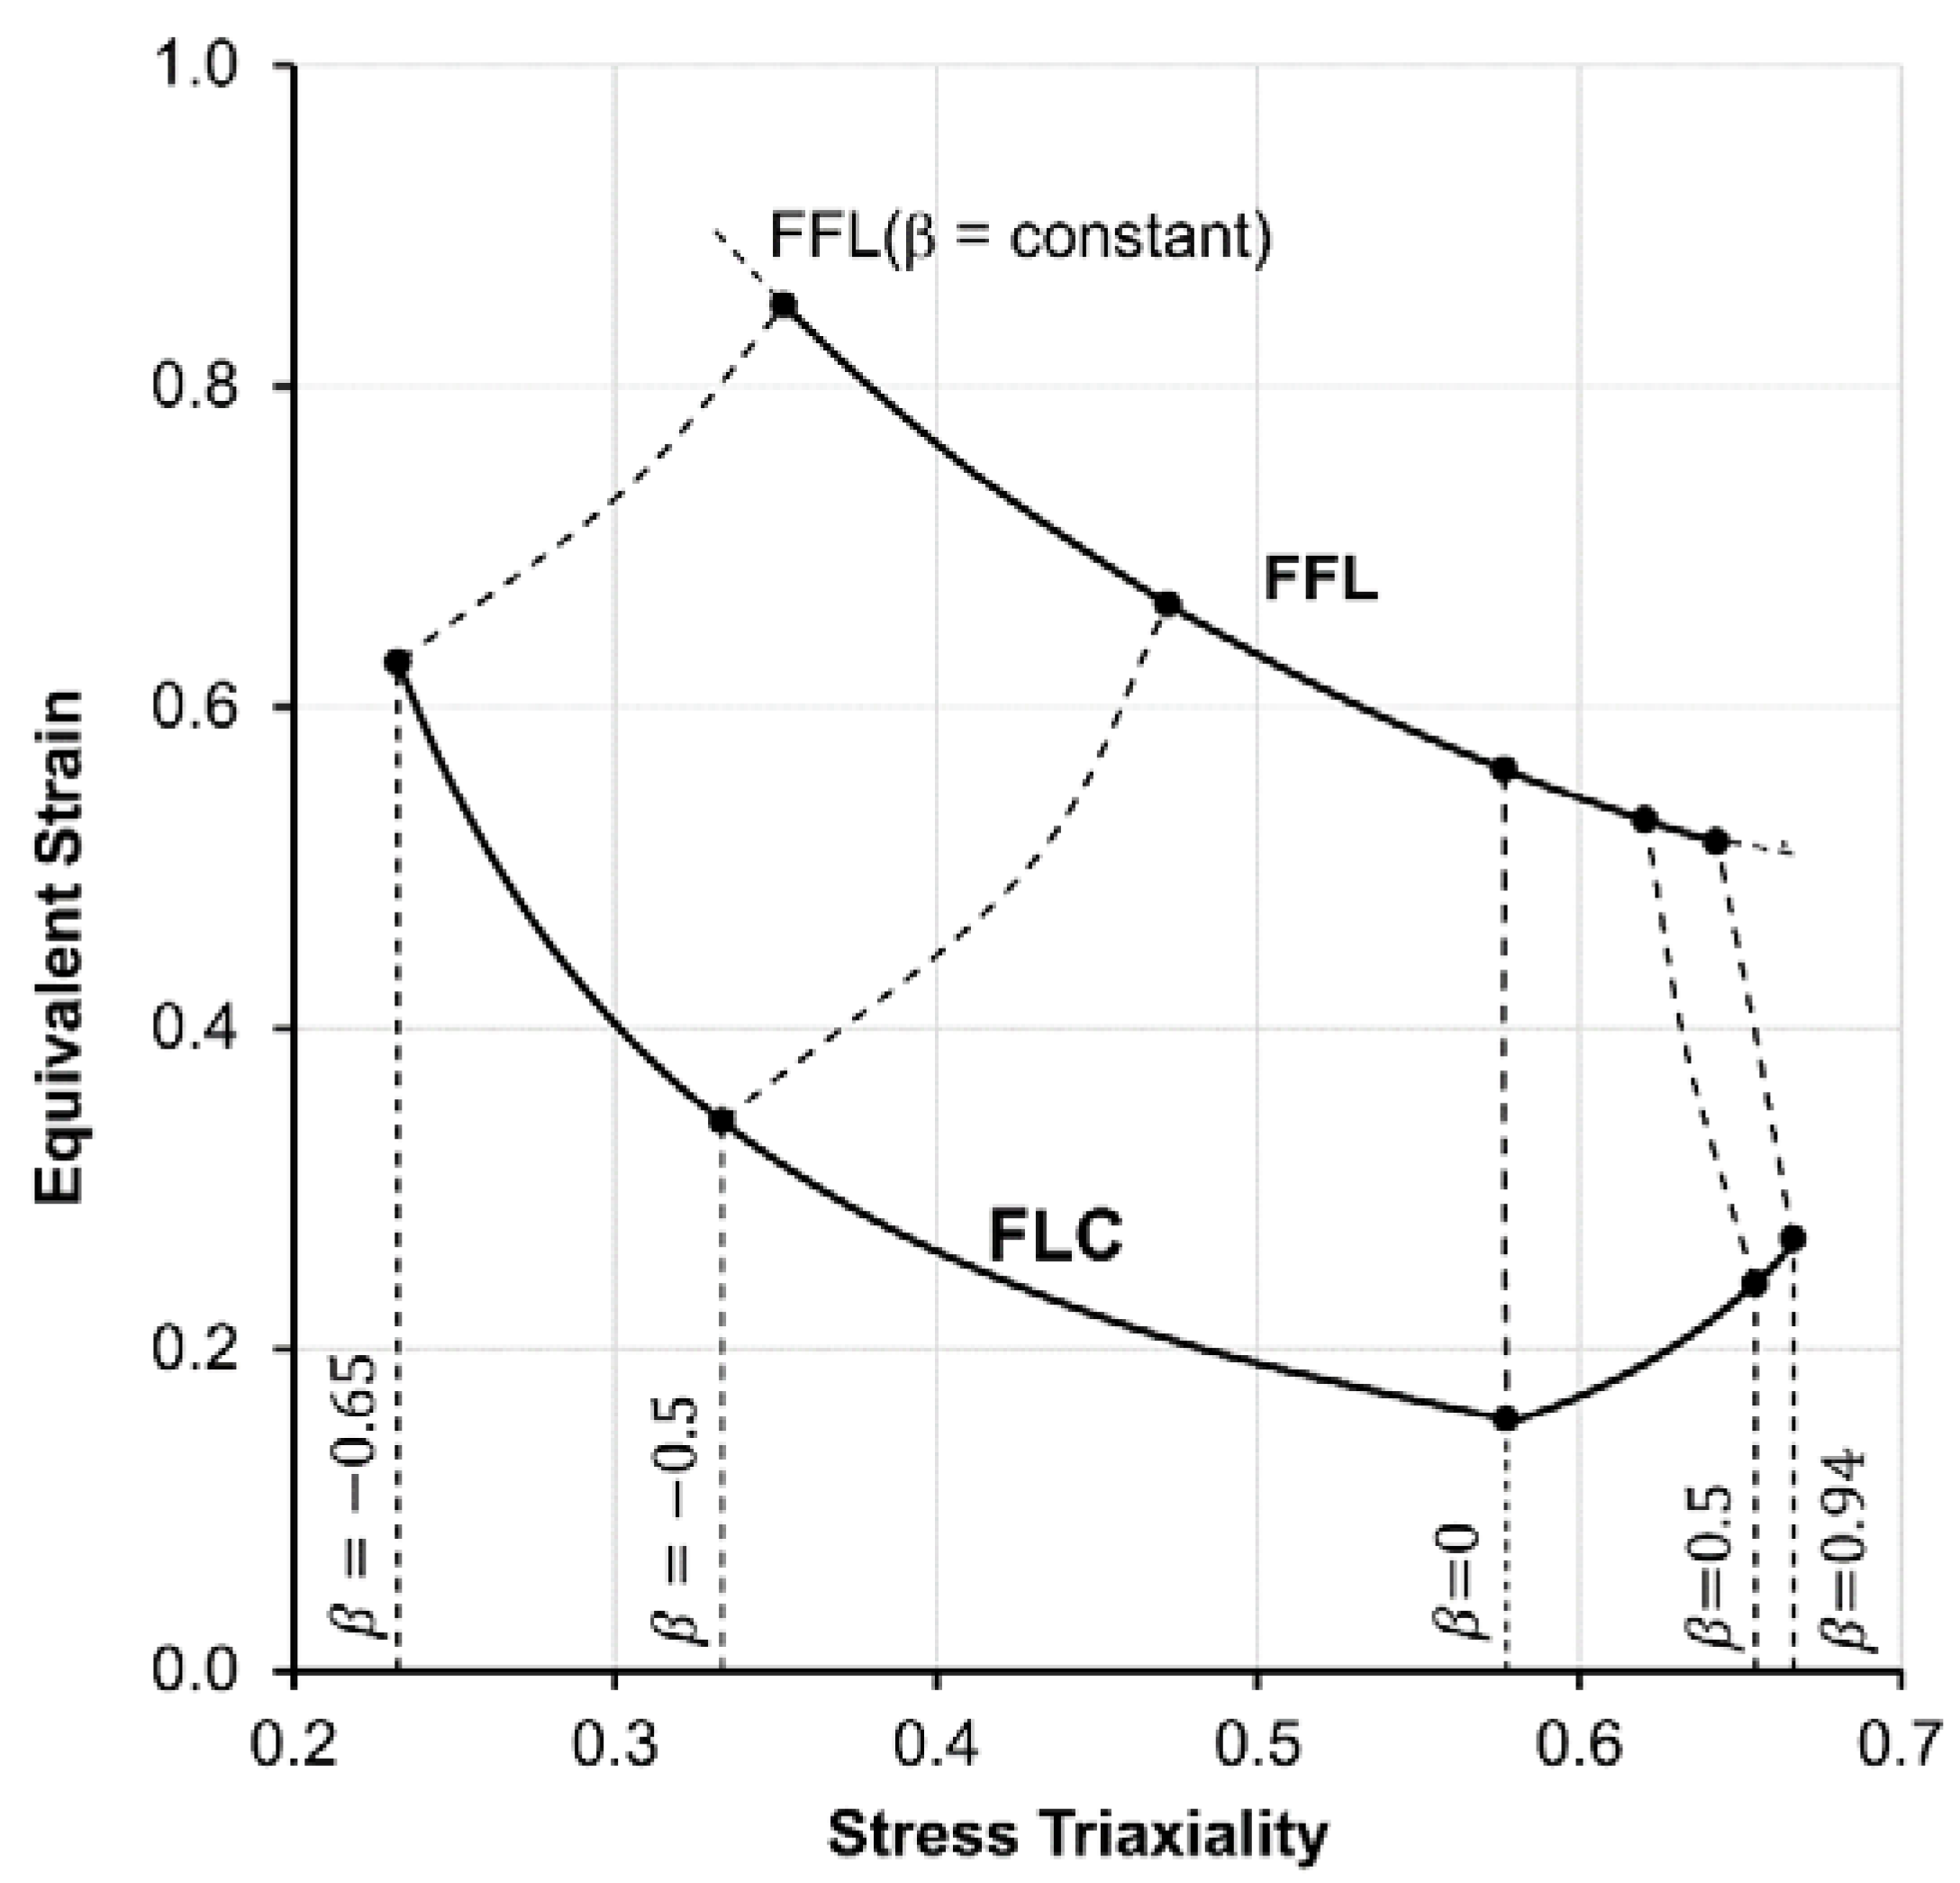
As shown in
Figure 11c, the application of Equations (3) and (4) to linear, proportional strain paths, characterized by a constant slope
(
Figure 11a), gives rise to vertical lines
in the effective strain vs. stress triaxiality space. In contrast, the application of Equations (3) and (4) to non-proportional, piecewise linear strain paths with different slopes
, gives rise to piecewise linear evolutions
(hereafter referred to as
based evolutions) in the effective strain vs. stress triaxiality space.
The experimental strain paths disclosed in
Figure 8 allow concluding that tube expansion by a rigid tapered conical punch subject the material to linear, proportional (or near proportional) strain paths, whereas incremental tube expansion subjects the material to non-proportional strain paths. The picture inserts of
Figure 11a,b are drawn in accordance with this conclusion.
However, the strain paths determined by CGA using the automatic measurement system ARGUS
® must be seen as static results obtained at the end of the incremental tube expansion process (
Figure 8), or at the end of each intermediate forming stage (
Figure 10). Full characterization of the non-proportional strain paths of incremental tube forming with detailed information on the cyclic oscillations from shearing to biaxial stretching, as the single point hemispherical tool approaches, contacts and moves away from a specific location of the incrementally expanded tube surface can only be obtained through finite element modelling.
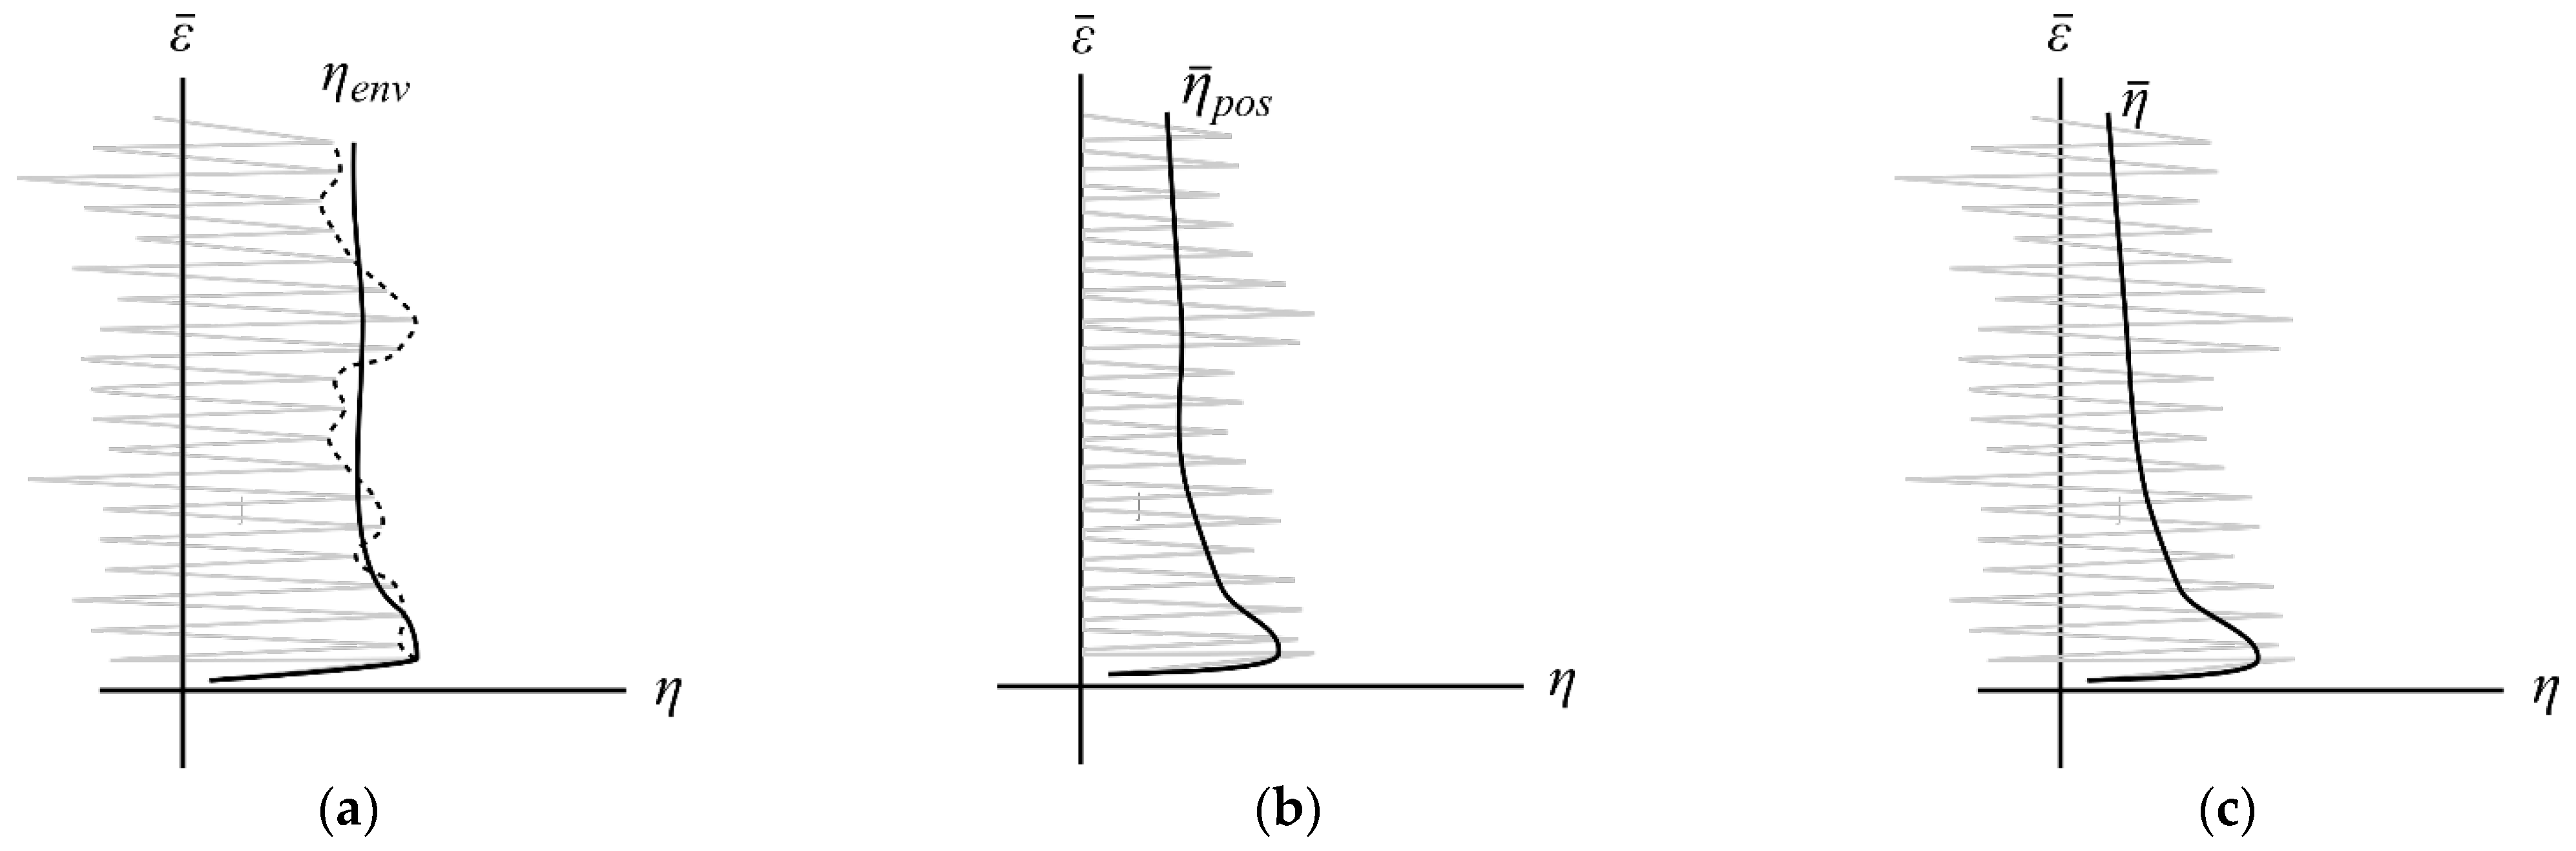
Figure 12 provides a schematic representation of a finite element computed non-proportional, cyclic path undergone by a specific tube location in the effective strain vs. stress triaxiality space. Three different evolutions
are considered as a result of the following three approaches to account for the accumulation of damage
in non-proportional, cyclic paths:
(a) The envelope stress triaxiality
based approach (
Figure 12a).
where
stands for the peak values of the stress triaxiality ratio at each cycle (circular path) of the forming tool.
(b) The average positive stress triaxiality
based approach (
Figure 12b).
where
corresponds to the Macaulay bracket to prevent accumulation of negative damage.
(c) The average stress triaxiality
based approach (
Figure 12c), where
of Equation (9).
where
of Equation (9).
The three evolutions resulting from these approaches are identical in case of linear, proportional strain paths because in such loading conditions, .
Figure 13 shows the finite element non-proportional, cyclic path of incremental tube forming experienced by point A of
Figure 9 and the three different
evolutions that result from the integral forms of stress triaxiality
,
and
given by Equations (10)–(12). The linear piecewise
based evolution resulting from the experimental in-plane strains obtained by ARGUS
® and by the linear, proportional, equal biaxial stretching
based evolution are included for comparison purposes.
As seen, the reference evolution based on a linear, proportional, equal biaxial stress triaxiality ratio consists of a vertical line that extends up to an effective strain value at fracture located far above the FFL. The other reference evolution based on a linear piecewise approximation of the experimental in-plane strains measured by ARGUS® is not very much different from that based on . Major differences between the two evolutions are found in the forming stages 2 to 5 due to a shift in the linear piecewise based evolution towards plane strain.
Still, the onset of fracture at is nearly identical to that of the based evolution and, therefore, far above the FFL. In fact, because the linear piecewise based evolution is built upon a direct transformation of the experimental strain paths from principal strain space to the effective strain vs. stress triaxiality space, it is understandable that the surpass of the FFL must occur in both spaces.
More important to our discussion are the
evolutions obtained for the integral forms of stress triaxiality given by
,
and
(refer to Equations (10)–(12)). As can be seen, the three evolutions reach the effective strain at fracture (
) very far from the FFL. In particular, the evolution of
cuts the FFL at stress triaxiality values around 0.4, suggesting that the fracture should occur much earlier than it does. The other two (
and
) reach the fracture for values of stress triaxiality below 0.2 (i.e., in-between pure tension and pure shear) without crossing the FFL and in good agreement with a possible extrapolation of the FFL to the left side. The difference between the
and
based evolutions is not relevant for incremental tube expansion and derives from discharging, or accounting for, the accumulation of negative damage. Although discharging negative damage is commonly executed in cold forming, there are studies recently published pointing to cut-off values of stress triaxiality up to −0.6 for the cold forming of aluminum alloys under quasi-static loading [
26]. According to this and taking into account that the instantaneous stress triaxiality in the incremental tube forming oscillates between −0.6 to 0.6 (see
Figure 13), the use of the average stress triaxiality
takes on a greater physical sense.
Taking the integral form of stress triaxiality
(i.e., the average stress triaxiality given by Equation (12)) into consideration, it is now important to check if the compatibility between the FFL and the above-mentioned reason for the critical in-plane strains of incremental tube expansion at fracture being far greater than those of conventional tube expansion also applies to the latter. For this purpose, we computed the
evolution for conventional tube expansion directly from the average stress triaxiality
and plotted the results in
Figure 14. The instantaneous stress triaxiality (
) in the conventional tube expansion is also shown.
Two interesting results can be drawn. On the one hand, the level of average stress triaxiality in the conventional process at fracture (
) is very well above the one obtained in the incremental process (
). As suggested by Martinez-Donaire et al. [
18], this difference, also observed in other incremental forming processes [
27], results in a greater resistance to accumulate damage in the incremental process than in the conventional one, requiring higher levels of strain to trigger the ductile fracture. On the other hand, results also show a near coincidence of the instantaneous and the average stress triaxiality-based evolutions (
) in the conventional process. This also makes sense and is compatible with the widely popular application of McClintock’s ductile damage criterion [
23] to determine the onset of cracking by tension in conventional tube forming processes [
12]. These results confirm the validity of the overall approach for both non-proportional, cyclic paths of incremental tube expansion and near proportional paths of conventional tube expansion.


 ,
, 


