Article

Cryogenic Deformation Behavior and Microstructural Characteristics of 2195 Alloy

1
Light Alloy Research Institute, Central South University, Changsha 410083, China
2
State Key Laboratory of High Performance and Complex Manufacturing, Central South University, Changsha 410083, China
*
Author to whom correspondence should be addressed.
Metals 2021, 11(9), 1406; https://doi.org/10.3390/met11091406
Submission received: 30 June 2021 / Revised: 30 July 2021 / Accepted: 3 September 2021 / Published: 6 September 2021
(This article belongs to the Special Issue Structure and Properties of Aluminium Alloys 2023)

Abstract

:
Cryogenic deformation can improve the strength and plasticity of Al–Li alloy, although the underlying mechanism is still not yet well understood. The effects of cryogenic temperature on the tensile properties and microstructure of an Al–Cu–Li alloy were investigated by means of tensile property test, roughness measurement, scanning electron microscope (SEM), optical microscope (OM), electron backscatter diffraction (EBSD), and transmission electron microscope (TEM). The results indicated that the strength and elongation of the as-annealed (O-state) and solution-treated (W-state) alloys increased with the decrease in deformation temperature, where the increasing trend of elongation of the W-state alloy was more significant than that of the O-state alloy. In addition, a temperature range was observed at approximately 178 K that caused the strength of the W-state alloy to slightly decrease. The decrease in temperature inhibited the dynamic recovery of the Al–Cu–Li alloy, which increased the dislocation density and the degree of work hardening, thus improving the strength of the alloy. At cryogenic temperatures, the internal grain structure was more involved in the deformation and the overall deformation was more uniform, which caused the alloy to have higher plasticity. This study provides a theoretical basis for the cryogenic forming of Al–Li alloy.

1. Introduction

Al–Li alloys have a high specific stiffness and strength [1,2]. Due to the demand for lightweight structural materials for the aerospace industry, Al–Li alloys have become a hot research topic [3]. Third-generation Al–Cu–Li alloys, such as 2195 Al–Li alloy, which has a high strength, demonstrate low fatigue crack growth rates, good high-temperature and low-temperature properties, and are preeminent structural materials for aerospace applications [4,5]. At present, the common processing technologies for Al–Cu–Li alloys are room temperature processing or hot processing. In many cases, the strength and formability of Al–Cu–Li alloys produced by these traditional processing technologies cannot simultaneously meet the requirements of the aerospace industry, which limits their application.
Cryogenic forming generally refers to the process of forming at the temperature of liquid nitrogen (77 K) [6]. Aluminum is a face-centered cubic lattice material, which is different from cryogenic temperature brittleness of steel. Aluminum alloys have been proven to not change from toughness to brittleness at cryogenic temperatures. On the contrary, aluminum alloys tend to increase plasticity and toughness at cryogenic temperatures [7,8]. Cryogenic forming can significantly improve the strength and plasticity of aluminum alloy materials simultaneously [9,10,11], which is expected to become a revolutionary processing technology. Kumar et al. [12,13,14] studied the difference in tensile properties between cryogenic rolling and room-temperature rolling and found that the yield strength and tensile strength of cryogenic-rolled alloys were significantly higher than those of room-temperature-rolled alloys. Shi et al. [15] attributed this result to the inhibition of dynamic recovery during deformation in a cryogenic environment, which was beneficial for obtaining a higher dislocation density. Xu et al. [16,17] studied the tensile properties and surface characteristics of 6000 series aluminum alloy at room and cryogenic temperatures and found that deformation at 77 K significantly improved the strength and elongation of the alloy. This was due to a higher strain hardening exponent and more uniform deformation mode at cryogenic temperatures. Park and Niewczas [18] studied the plastic deformation of commercial purity aluminum and AA5754 alloy at 4.2 K, 78 K, and 295 K. The two materials showed flow instabilities at 4.2 K and 295 K, while the flow instability was suppressed at 78 K, showing uniform deformation. The mean free path was used to reflect the substructure. It was suggested that fracturing at cryogenic temperatures was caused by the collapse of the dislocation grid under high stress. However, the state of dislocation evolution during deformation at different temperatures has not yet been described. Zhemchuzhnikova et al. [19] studied the mechanical properties and fracture behavior of as-cast and hot-rolled 1575C Al alloy from 77 to 295 K. It was found that the strength of the as-cast alloy increased continuously with a decrease in temperature. However, the strength of the hot-rolled alloy initially decreased and then increased, while the elongation increased continuously. In addition, the PLC (Portevin-Le Chatelier) effect that describes the zigzag fluctuation in the tensile curve, gradually decreased and disappeared with a decrease in temperature. However, the author did not provide a specific explanation for this phenomenon. At present, the explanation for the influence mechanism of cryogenic temperatures on the mechanical properties and deformation behavior of Al–Cu–Li alloy is incomplete. Therefore, it is necessary to study the deformation behavior of Al–Cu–Li alloys at cryogenic temperatures. In this study, 2195 Al–Li alloy was tensile-tested at different deformation temperatures to determine its mechanical properties and study deformation behavior at cryogenic temperatures, and to explore the mechanism for the influence of cryogenic forming on the microstructure and properties of 2195 Al–Li alloy to provide a basic theoretical basis for the cryogenic forming of other Al–Li alloys.

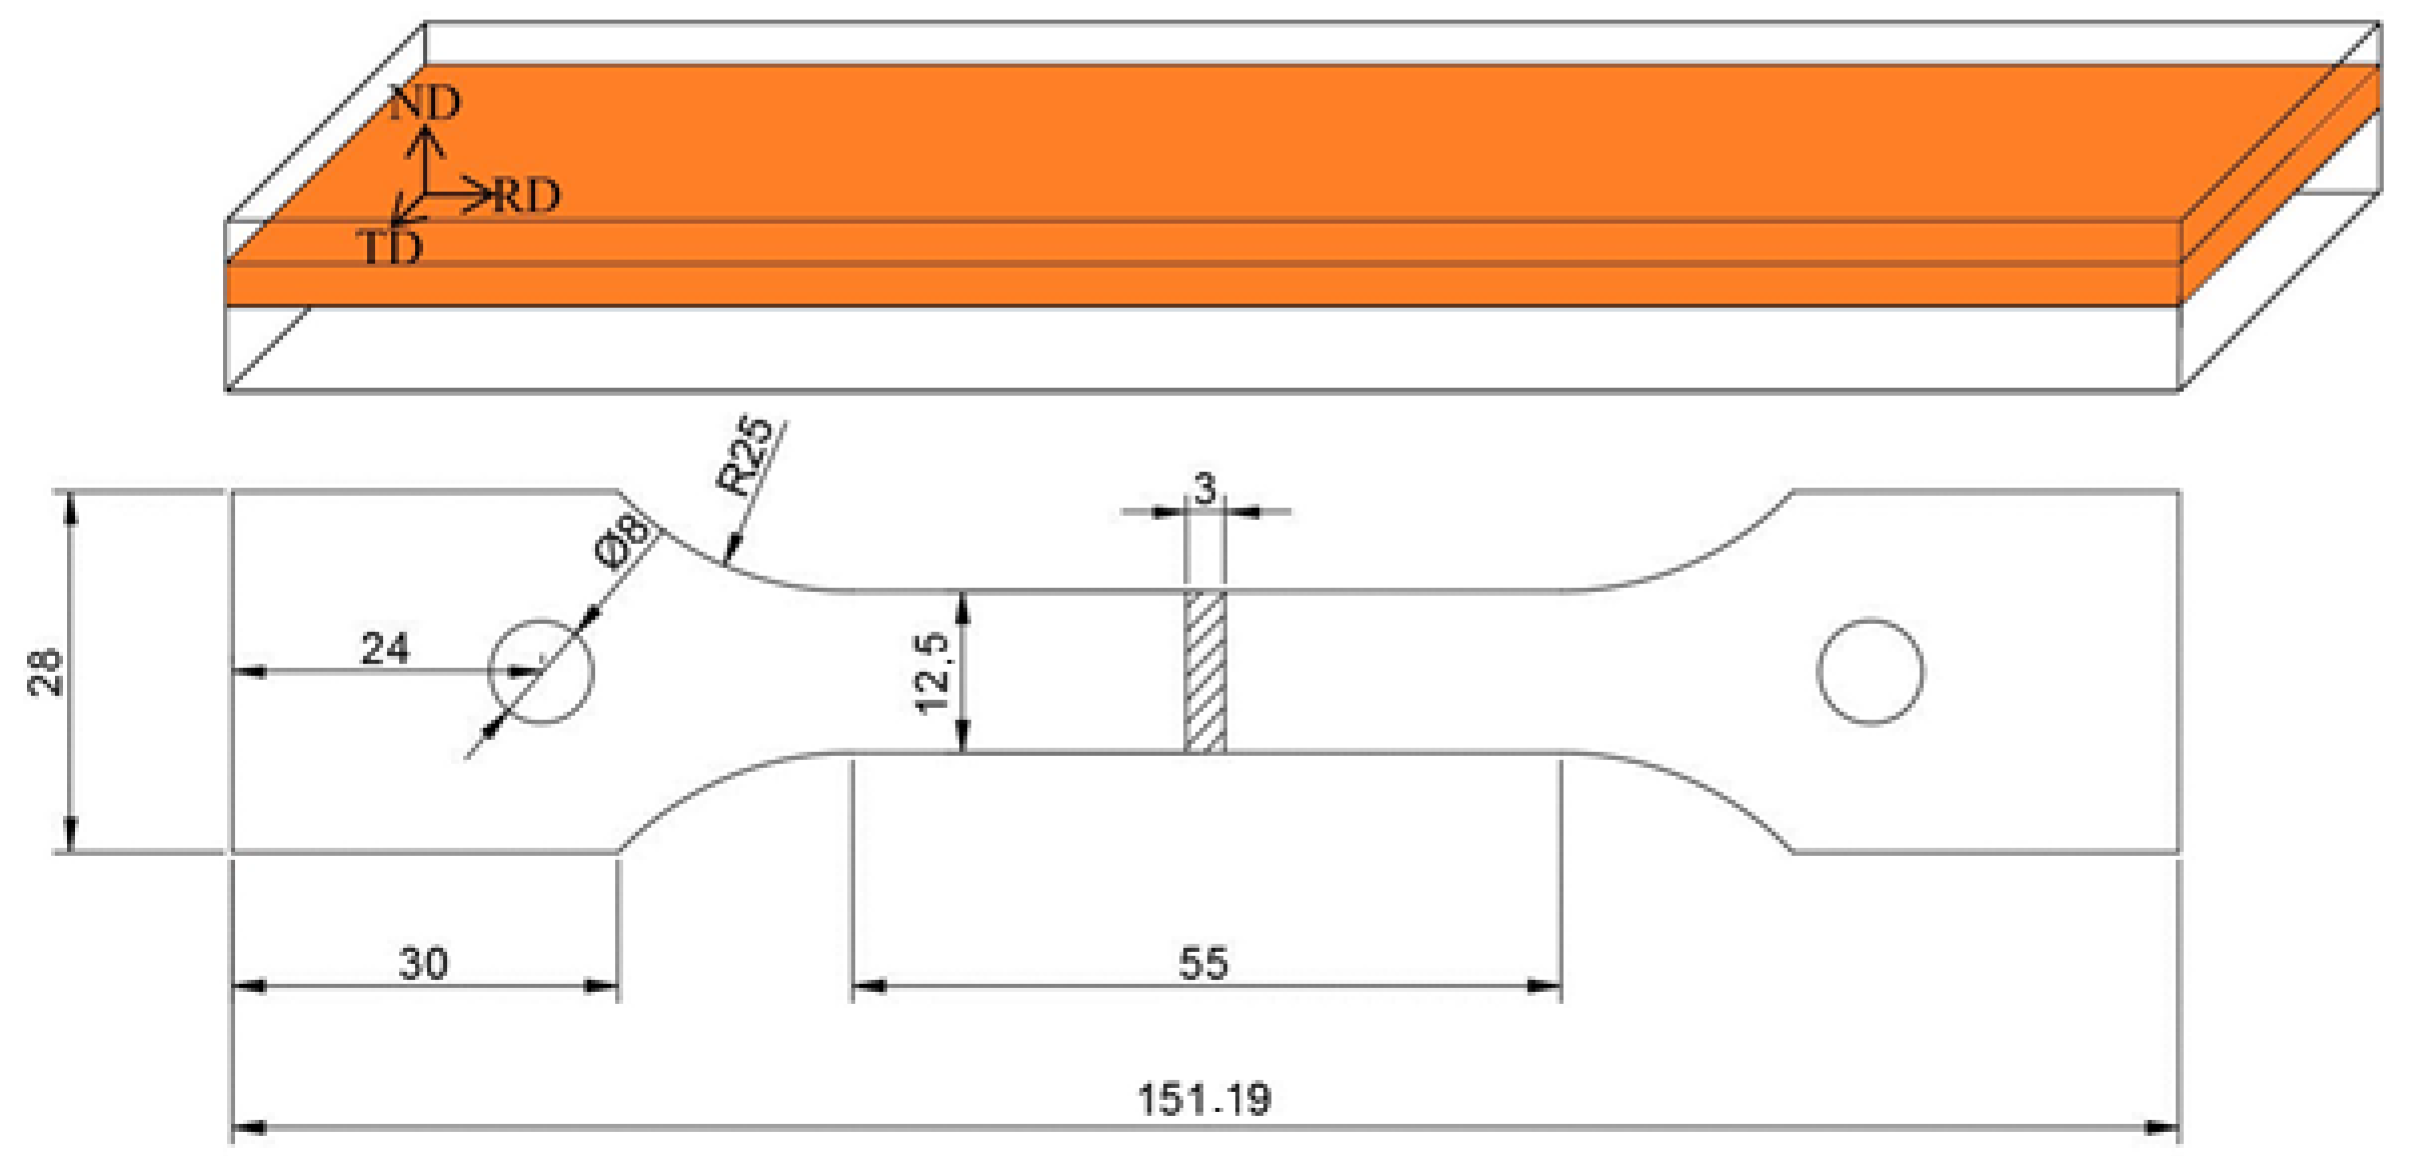
2. Materials and Experiments

Al–Cu–Li alloy (AA2195), as-annealed (O-state), rolled plates were used in this study, and the chemical composition of this alloy was 4.1% Cu, 0.9% Li, 0.04% Mn, 0.28% Mg, 0.26% Ag, and 0.13% Zr (wt %), and were Al balanced. The O-state samples were obtained after annealing at 40 °C for 2 h. The solution-treated (W-state) samples were prepared from the O-state plates after solution treatment at 510 °C for 1 h and quenched in water. Figure 1a,b shows STEM images of undeformed O-state and W-state 2195 alloys, respectively. It is observed that there are few dislocations and a small amount of β’ phases in the undeformed O-state and W-state alloys. Figure 1c and Figure 1d shows EBSD maps of undeformed O-state and W-state 2195 alloys, respectively. The O-state is dominated by low-angle angle boundaries, as shown in Figure 1c. The W-state is dominated by high-angle angle boundaries, as shown in Figure 1d.
The tensile specimens used in the uniaxial tensile test were prepared along the plate rolling direction. That is, the drawing axis was parallel to the rolling direction (RD), the sample width direction was parallel to the transverse direction (TD), and the sample thickness direction was parallel to the normal direction (ND), as shown in Figure 2. The samples were prepared according to ISO 15579: 2000 standard. Tensile tests were carried out at 77 K, 98 K, 138 K, 178 K, 218 K, 258 K, and 298 K. Three parallel tests were carried out for each temperature. To prevent natural aging of the W-state alloy, we carried out the test immediately after water quenching. Five parallel specimens were prepared at each deformation temperature. To ensure the experimental temperature, we carried out a tensile test after reaching the set temperature and holding for 10 min. The mechanical properties (yield strength (σ0.2), tensile strength (σb), and elongation (δ)) of the tensile samples were measured using a CSS-44100 electronic universal testing machine. The deformation rate of the chuck was 1 × 10⁻³ s−1, and the measured value of the properties was the average value of the remaining samples after removing the fluctuating experimental data. For the fracture specimen, the fracture morphology was analyzed using a Zeiss Evo MA10 scanning electron microscope (Zeiss, oberkochen, Germany).
In addition, one group of tensile specimens was prepared for the O-state and W-state alloys. The microstructures of the alloys with the same deformation amount (0.12 engineering strain) at different deformation temperatures were observed by optical microscopy (OM), electron backscatter diffraction (EBSD), and transmission electron microscopy (TEM). Samples for OM were obtained by a constant-strain tensile test after removing the surface deformation layer by mechanical and electrolytic polishing, and the surface roughness of the tensile samples was measured using a Mahr PS1 portable surface roughness meter (MAHR, Esslingen, Germany). The ratio of the electropolishing solution was 30% HNO3 + 70% CH3OH, and electropolishing was performed at −20 °C. EBSD samples were sampled at the standard distance of the OM samples and prepared according to the above polishing system. The TEM sample was ground to 100 μm using EBSD samples and then made into a small disk with a diameter of 3 mm. Then, electropolishing was performed using a Tenupol 5 machine (Struers, Copenhagen, Denmark) with a solution of 30% nitric acid and 70% methanol at −30 °C to −20 °C and 15 to 20 V. The OM observations were carried out using an OLYMPUS DSX500 optical digital microscope, the EBSD experiment was carried out using a Zeiss Evo MA10 scanning electron microscope, and the TEM observations were carried out using an F20 field-emission transmission electron microscope (FEI, Hillsboro, OR, USA). These experiments were performed on the plane determined by the TD-RD direction.

3. Results

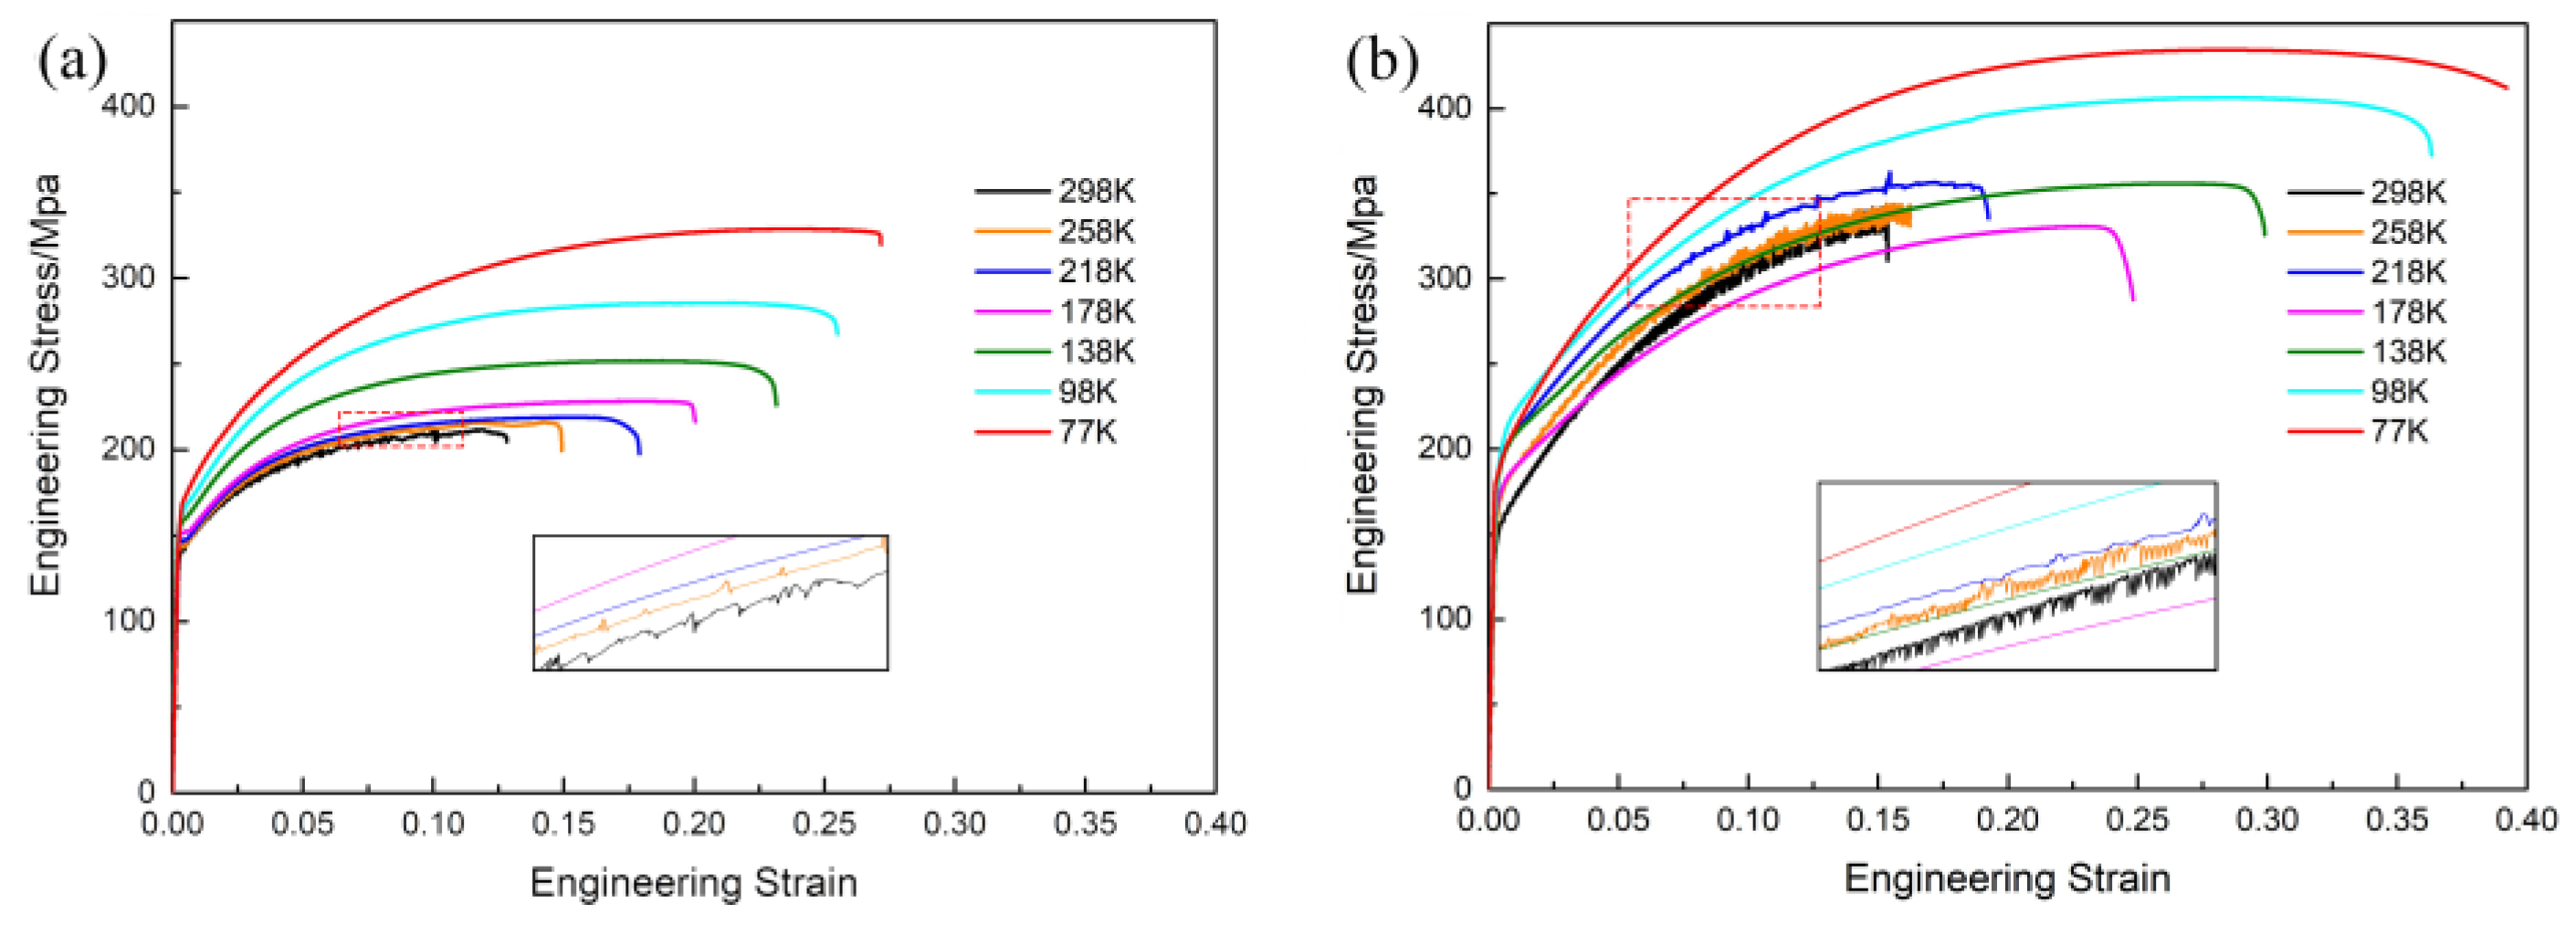
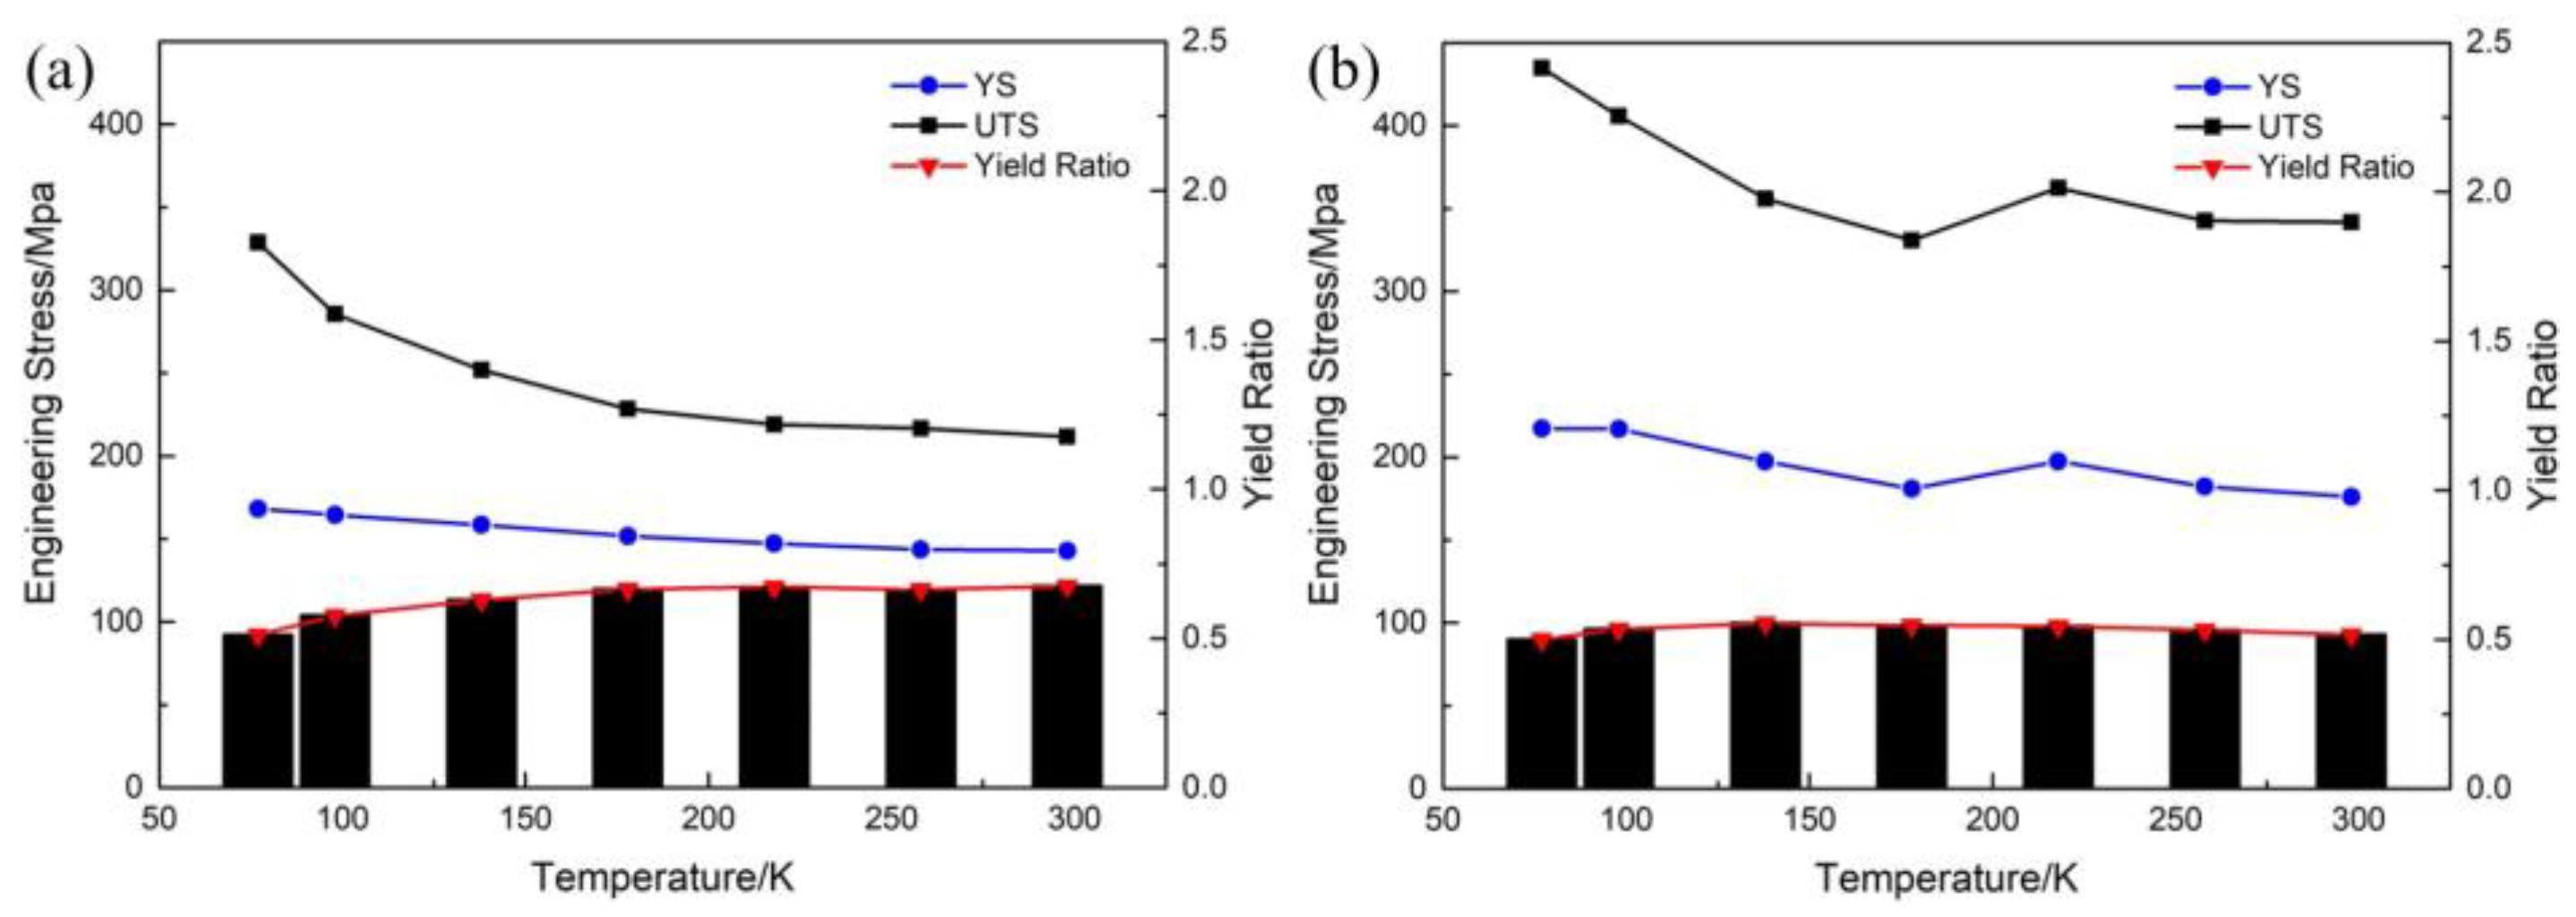
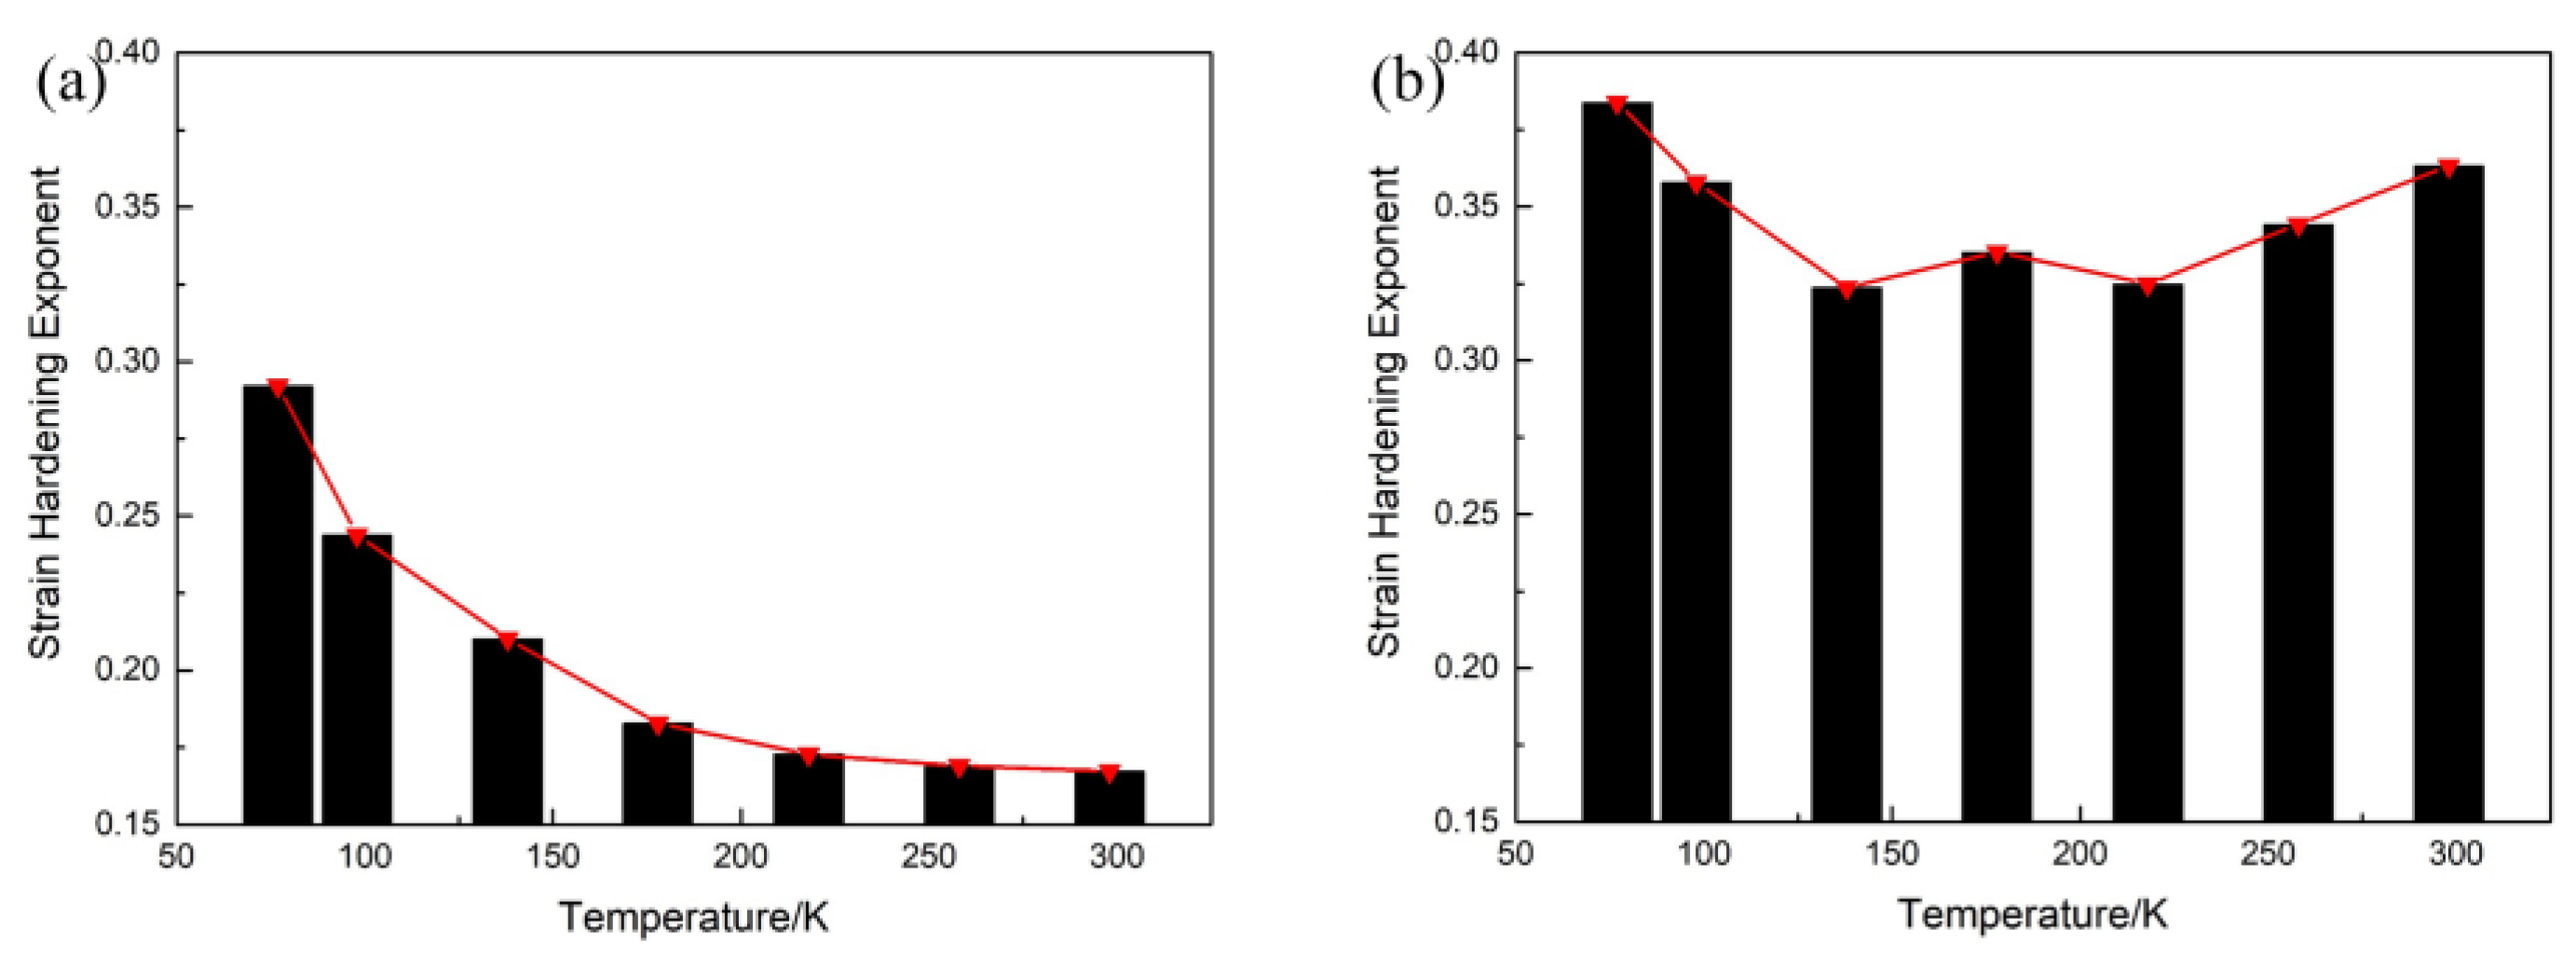
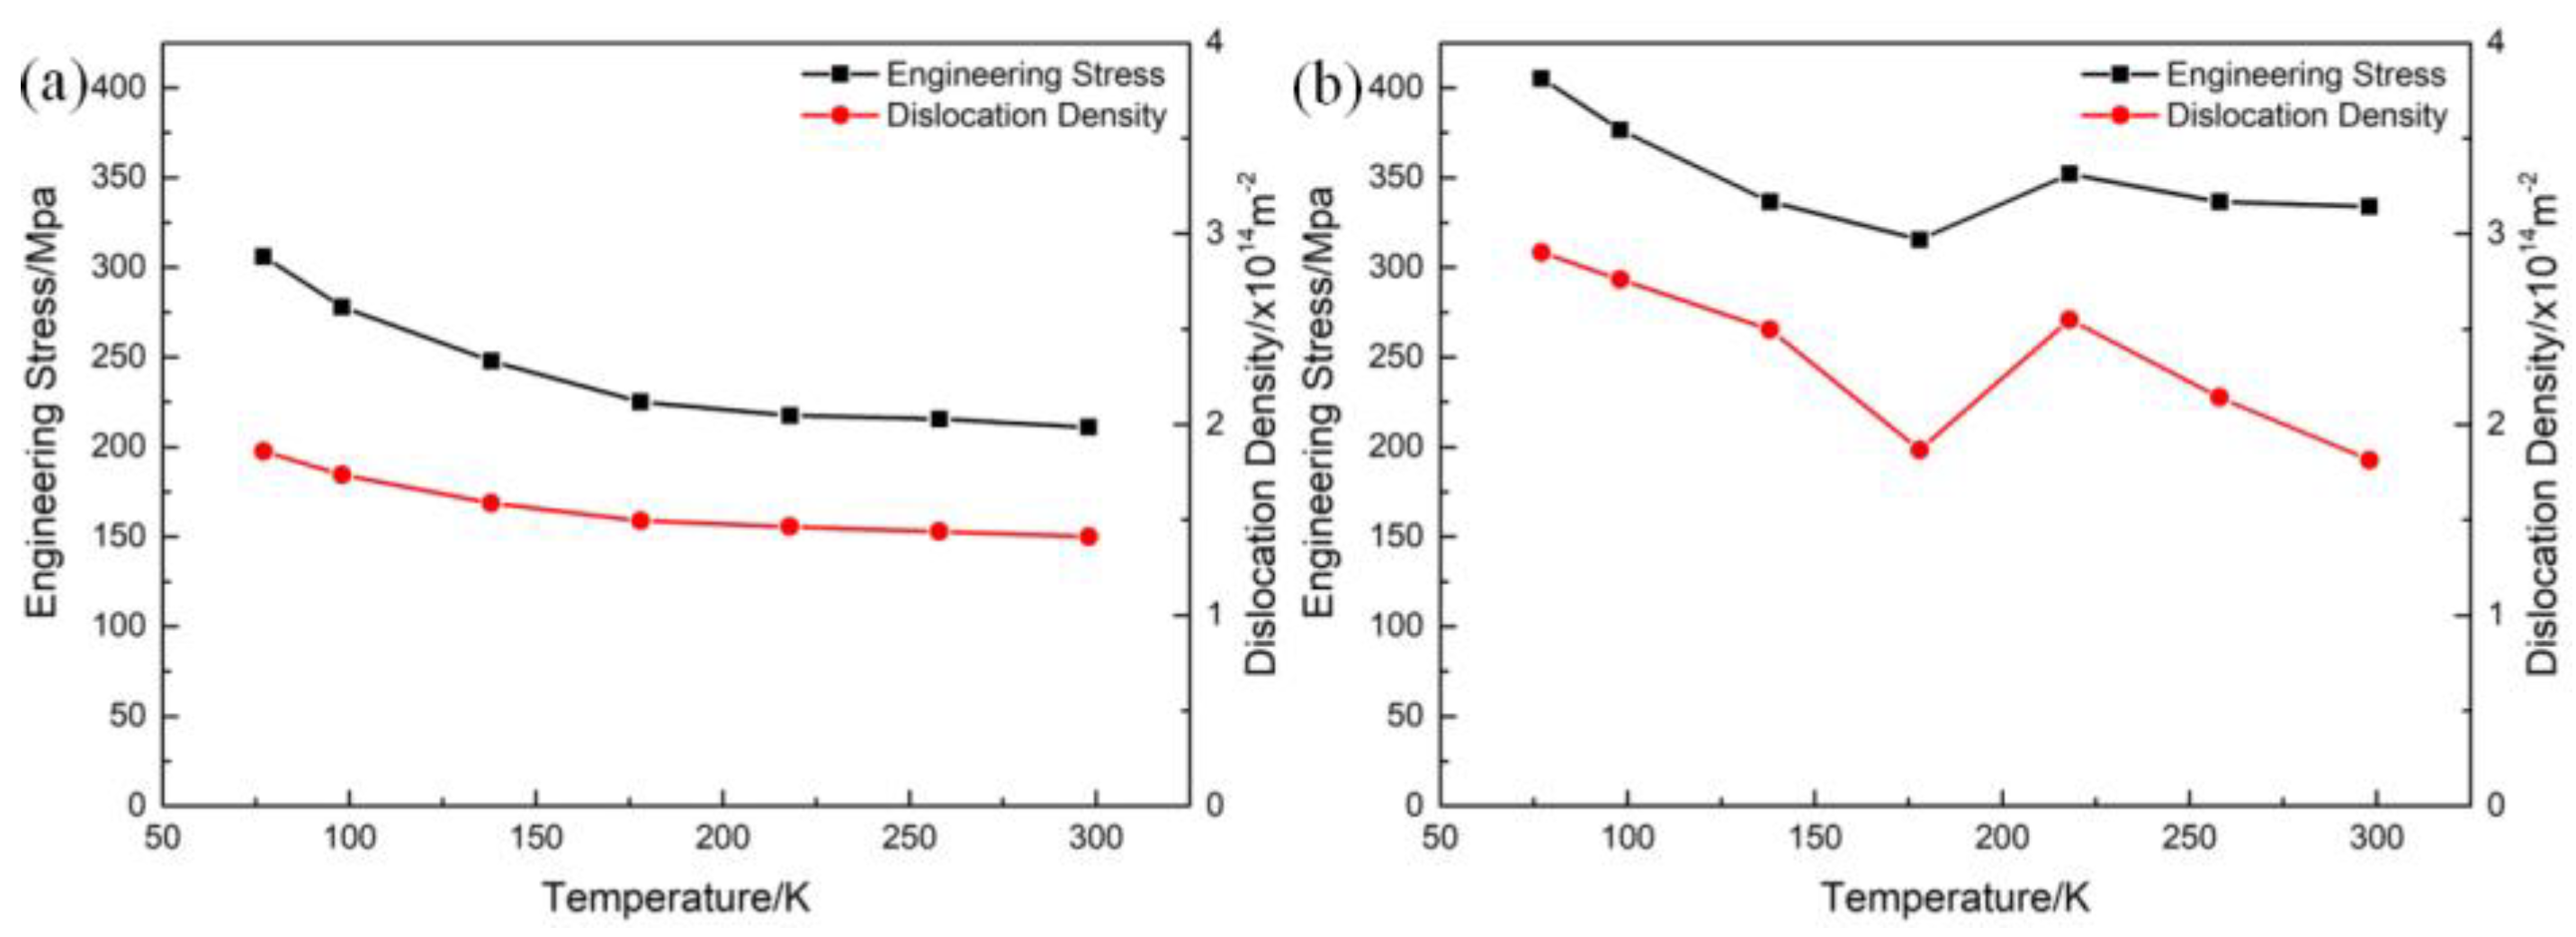
3.1. Mechanical Properties

Figure 3 shows the engineering stress–strain curves of the O-state and W-state 2195 alloys under uniaxial tension at different deformation temperatures. The tensile properties of the two alloys are affected by the deformation temperature. From 298 K to 77 K, the strength and elongation of the O-state and W-state alloys increased with the decrease in deformation temperature. Compared with the mechanical properties at 298 K and 77 K, the tensile strength of the O-state alloy increased from 212 MPa to 329 MPa, and the elongation increased from 12.8% to 27.2%. The tensile strength of the W-state alloy increased from 342 to 435 MPa, and the elongation increased from 15.4% to 39.2%. The elongation of the W-state alloy increased more than that of the O-state alloy when the deformation temperature decreased from 298 to 77 K. A temperature range was identified that decreased the strength of the W-state alloy at approximately 178 K. The tensile strength at 218 K was 363 MPa, while the tensile strength at 178 K was 331 MPa, which was a decrease of 32 MPa. In addition, the lower the deformation temperature, the higher the tensile strength of the two alloys. With the decrease in deformation temperature, the serrated feature in the tensile curve gradually weakened and disappeared. The serrated feature in the tensile curve was closely related to dynamic strain aging, i.e., the dynamic interaction between mobile dislocations and solute atoms [20]. The mobile dislocations are pinned by the solute atoms, which increases the flow stress; when the applied stress exceeds the pinning force, the dislocations are unpinned, which reduces the flow stress. At cryogenic temperature, the diffusion rate of solute atoms in the alloy is reduced, thereby weakening the PLC effect [11].
Figure 4 shows the variation of the yield strength, tensile strength, and yield ratio with deformation temperature. The yield strength ratio is the ratio of the yield strength to the tensile strength. Generally, the lower the yield ratio, the better the plasticity of the material [21]. For the O-state alloy, the yield ratio decreased with the decrease in deformation temperature; the lower the deformation temperature, the more significantly the yield ratio decreased. The yield ratio of the W-state alloy increased slightly at the initial stage of decreasing deformation temperature, but this change was not obvious. When the deformation temperature was lower than 178 K, a reduction in the deformation temperature led to a decrease in the yield ratio. The reduction in deformation temperature likely improved the plasticity of the 2195 alloy, where the improvement was more significant below 178 K.
To characterize the work-hardening behavior of the two alloys, we calculated the strain-hardening exponents according to Equation (1) [22], as shown in Figure 5, where σ is the true stress, K is the strength coefficient, ε is the true strain, and n is the strain-hardening exponent. With the decrease in deformation temperature, the strain-hardening exponent of the O-state alloy gradually increased; the lower the temperature, the more obvious the increase. The strain hardening exponent of the W-state alloy produced a “W” shape, which may have been related to the rate of dislocation storage.
σ = K ε n

3.2. Microstructural Observations

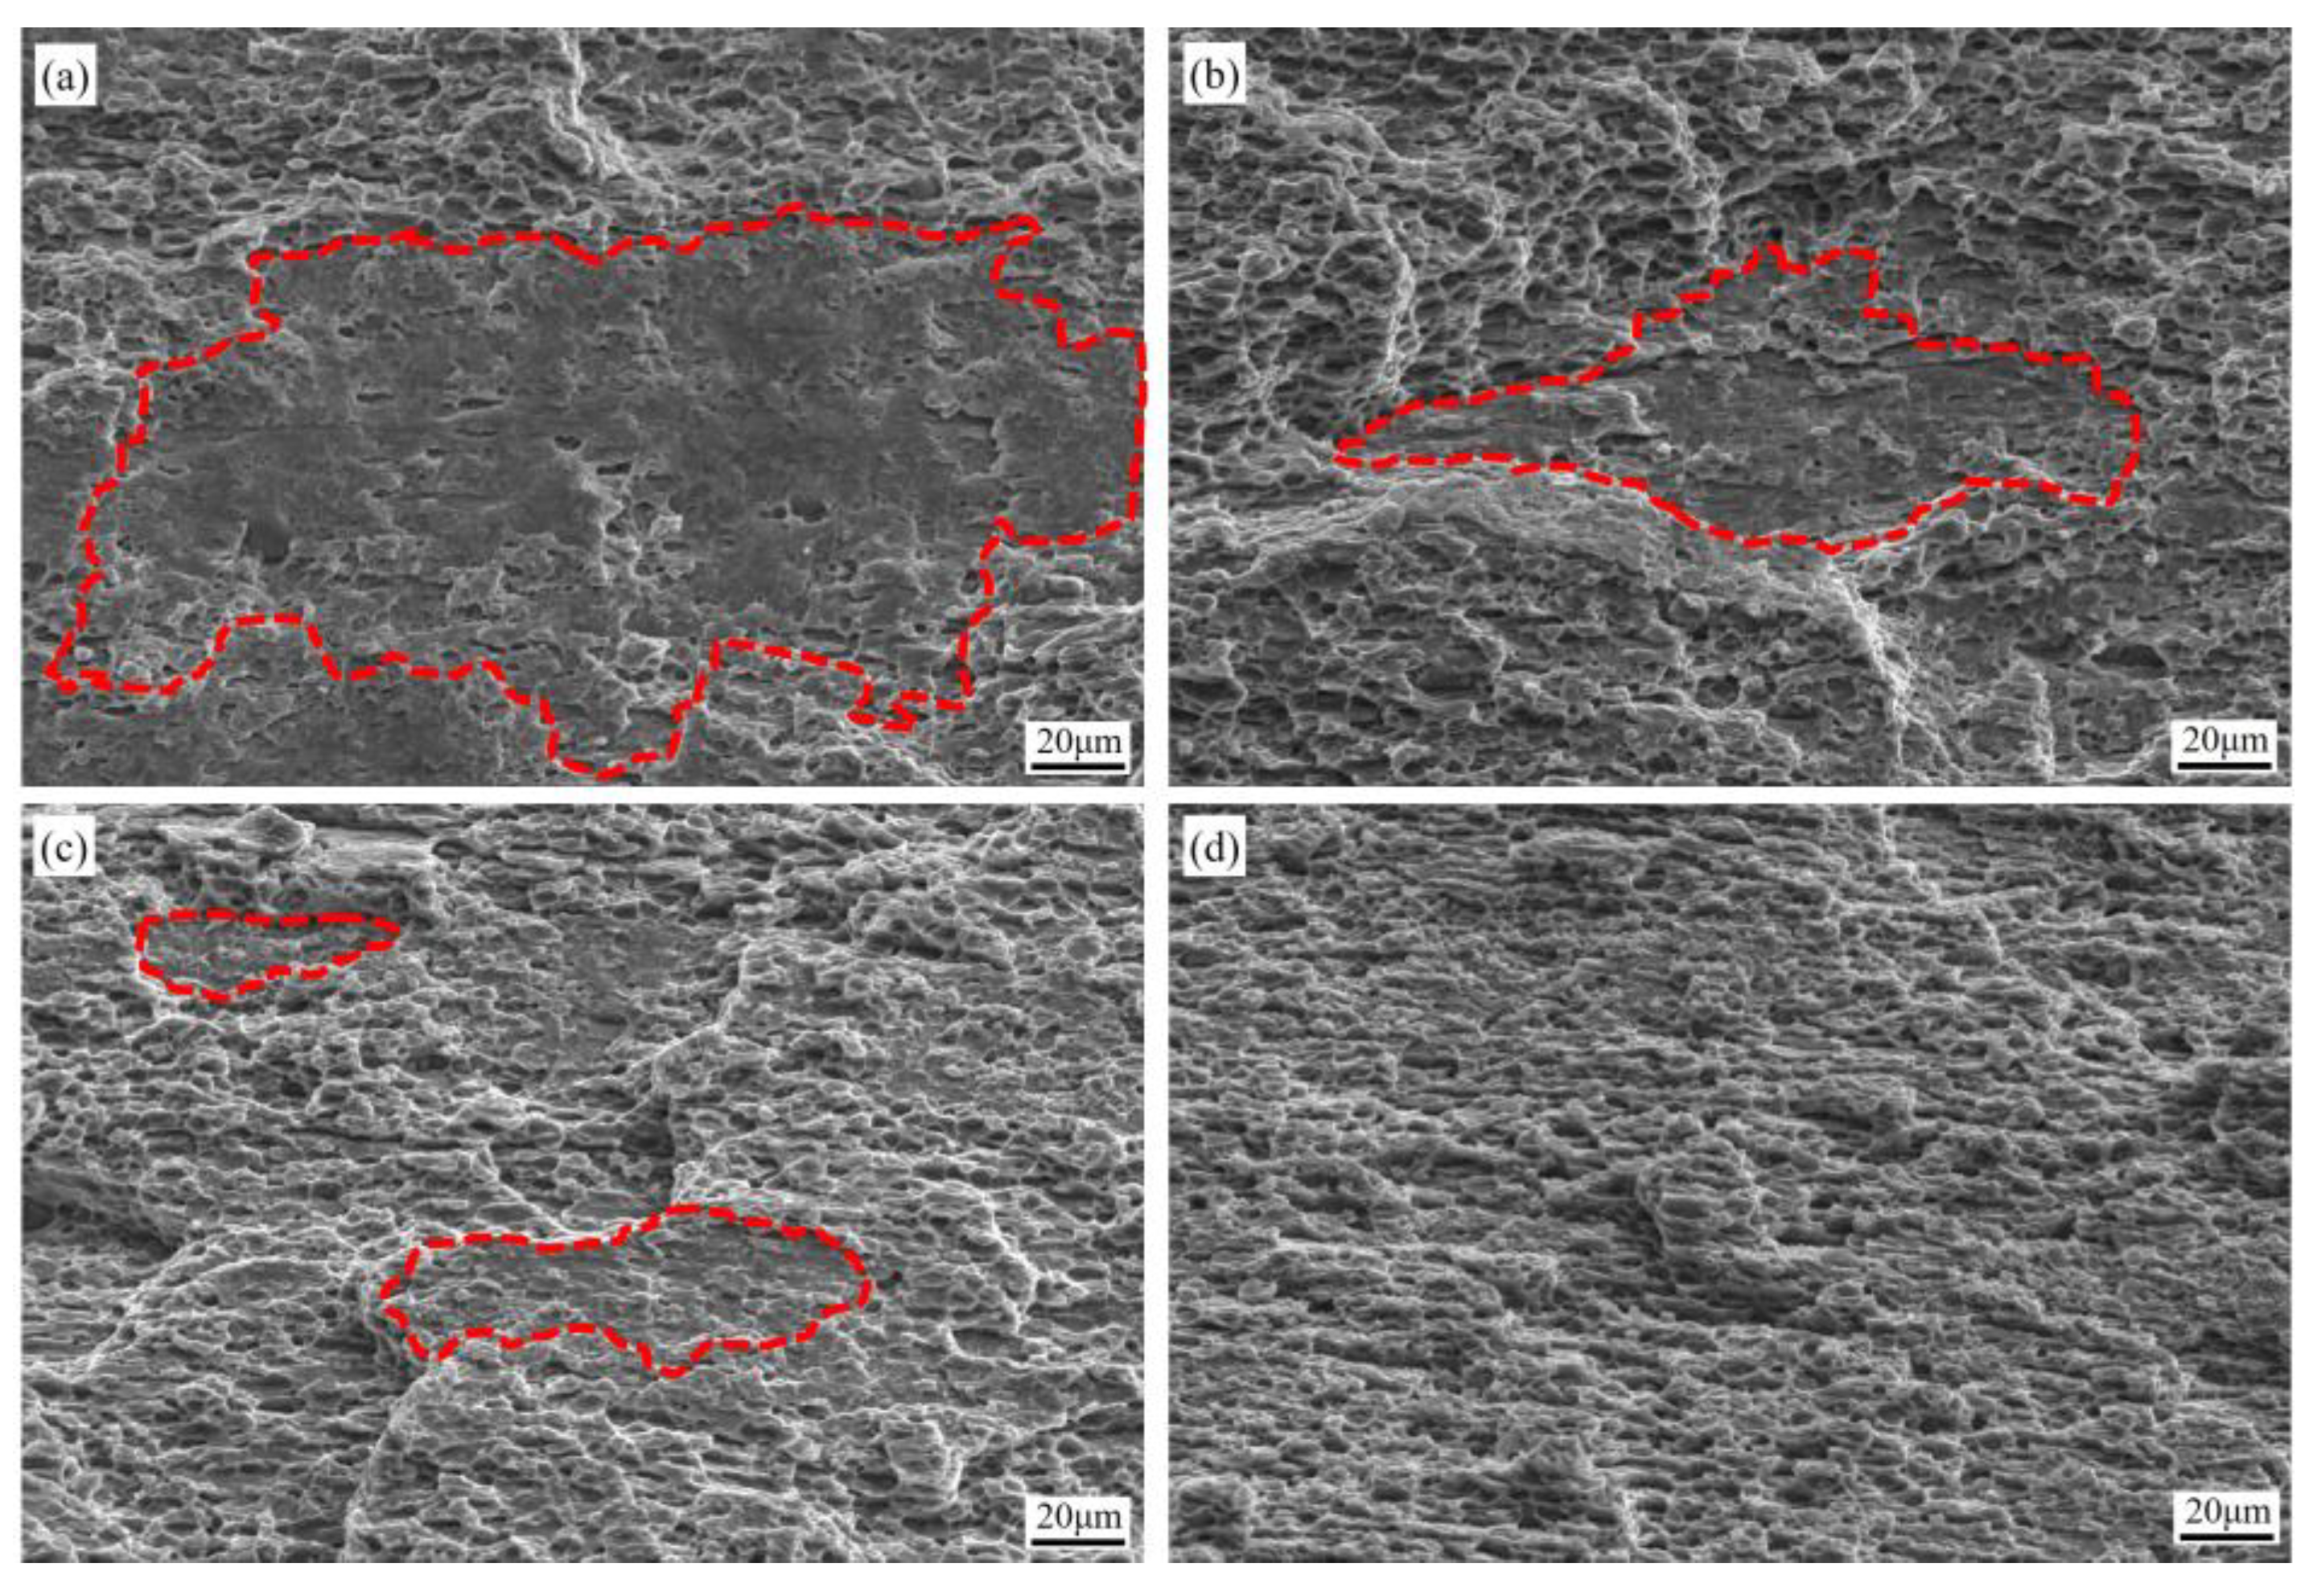
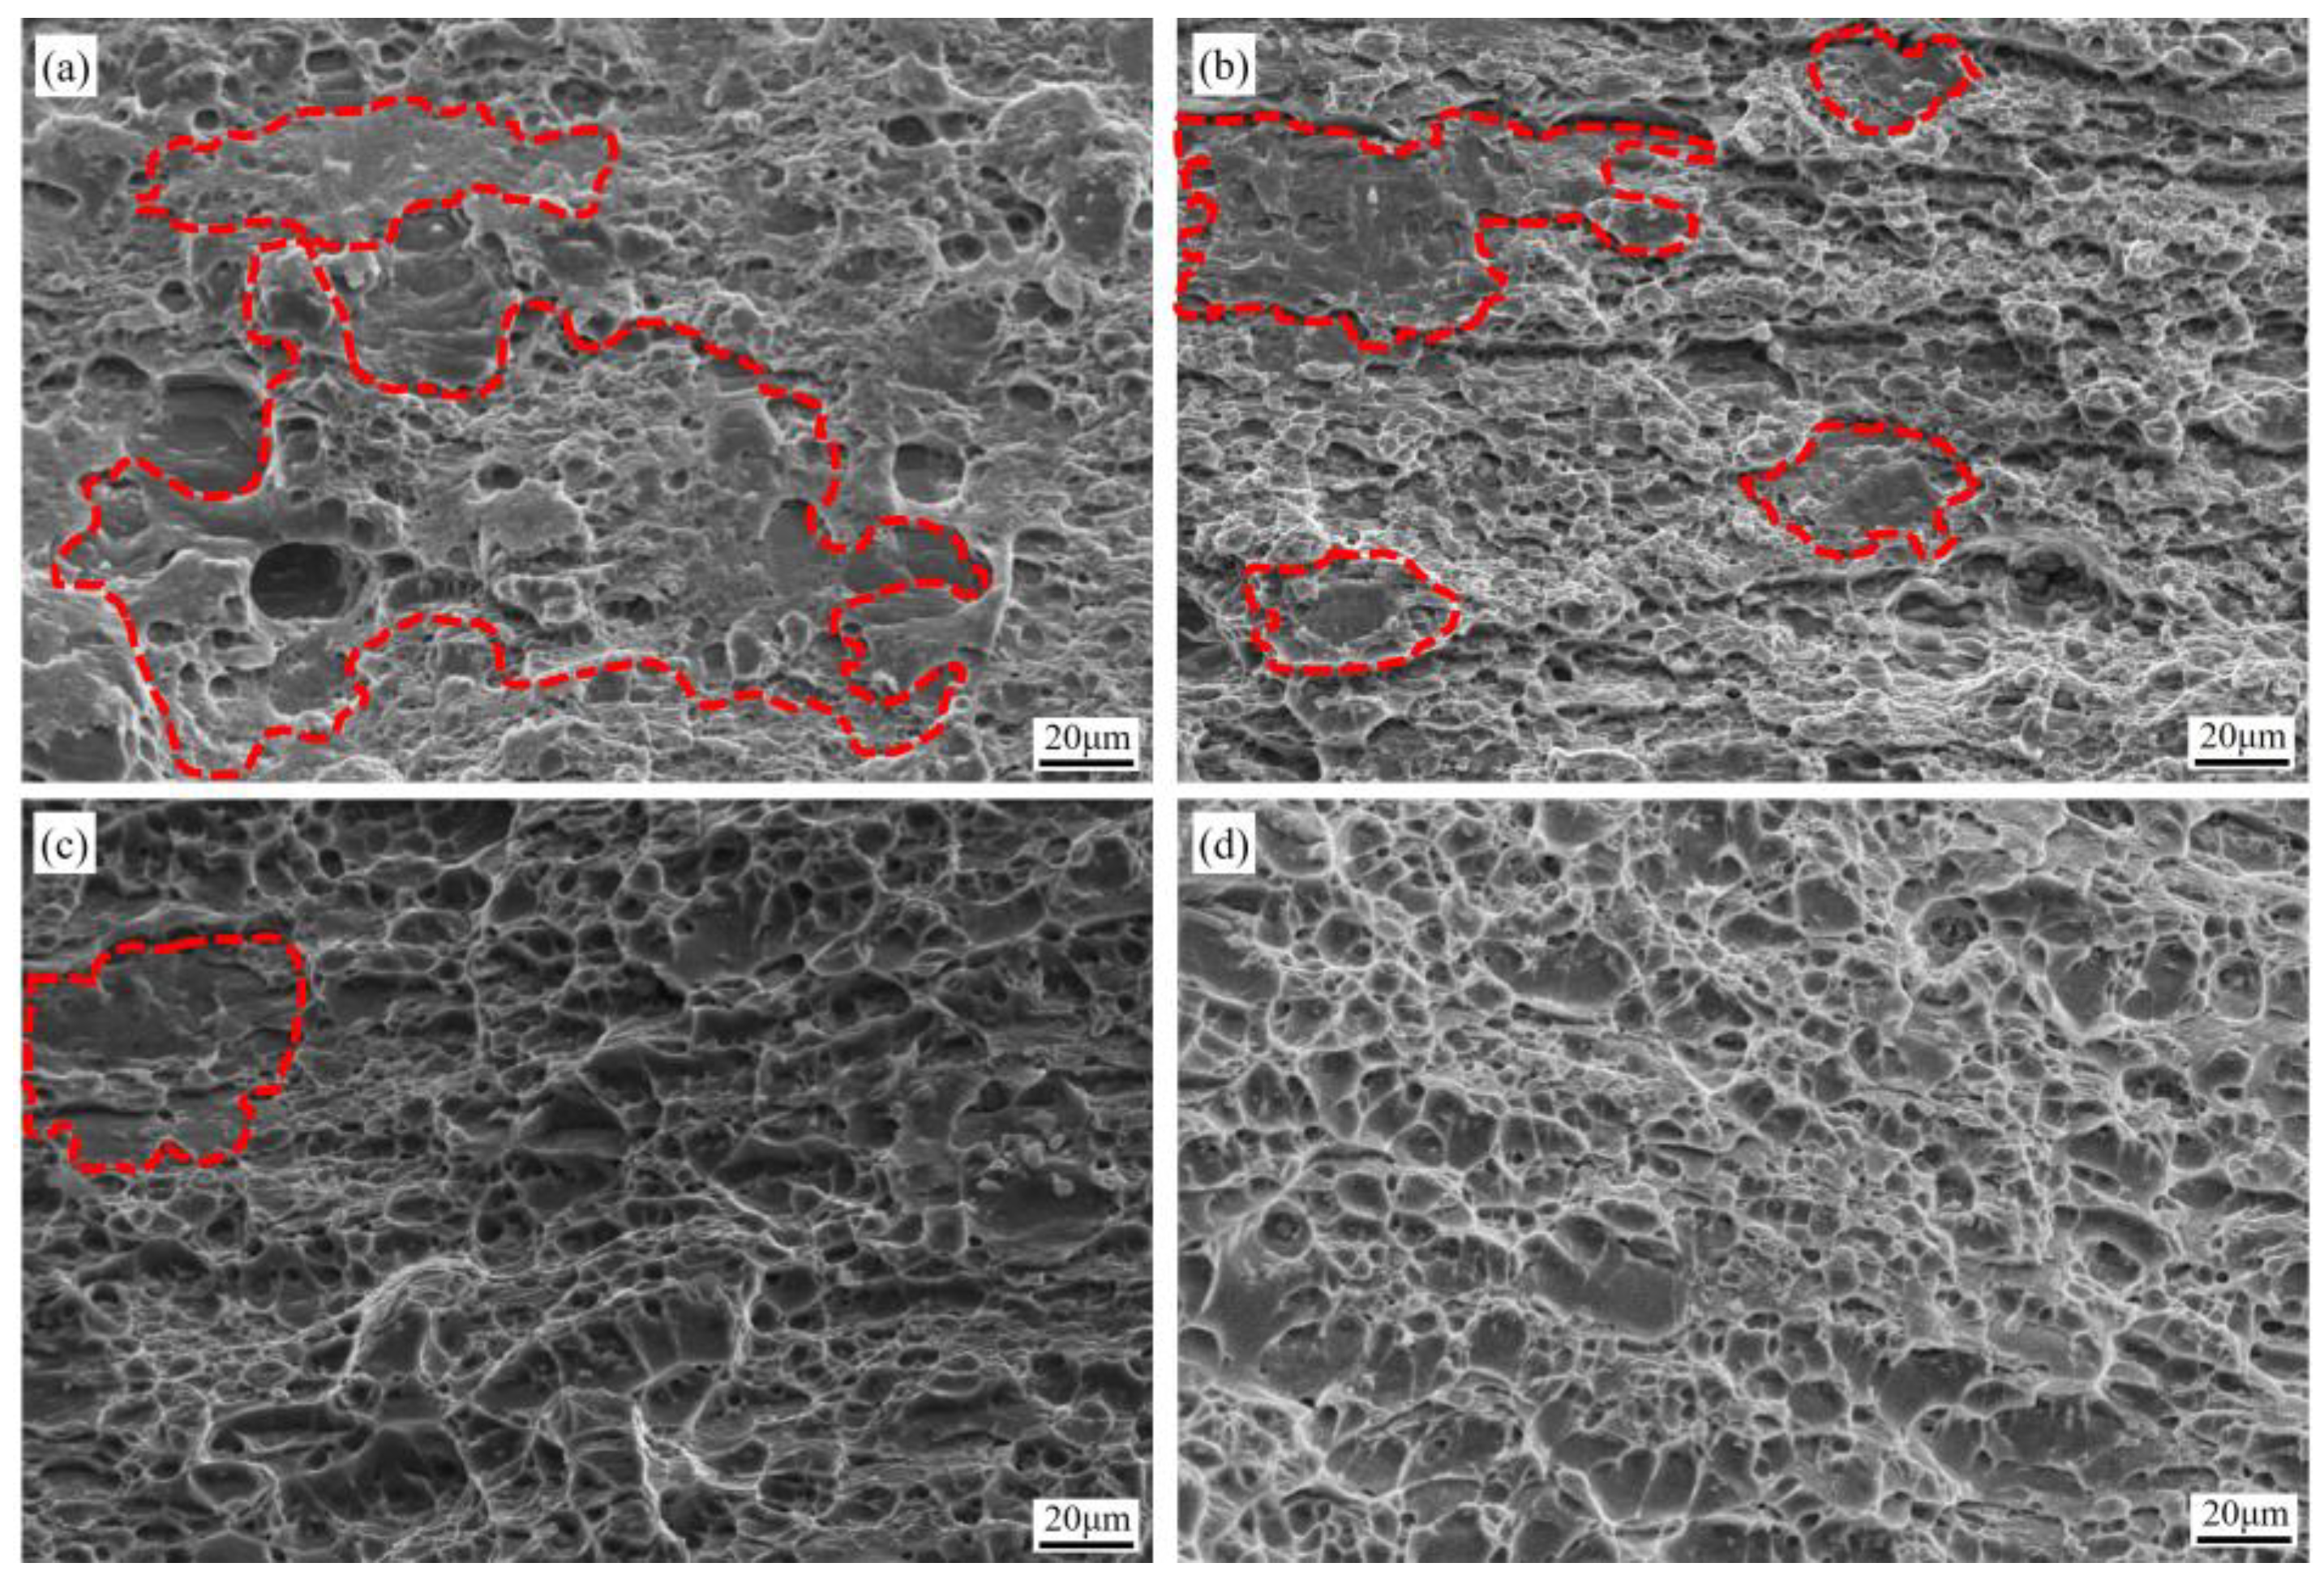
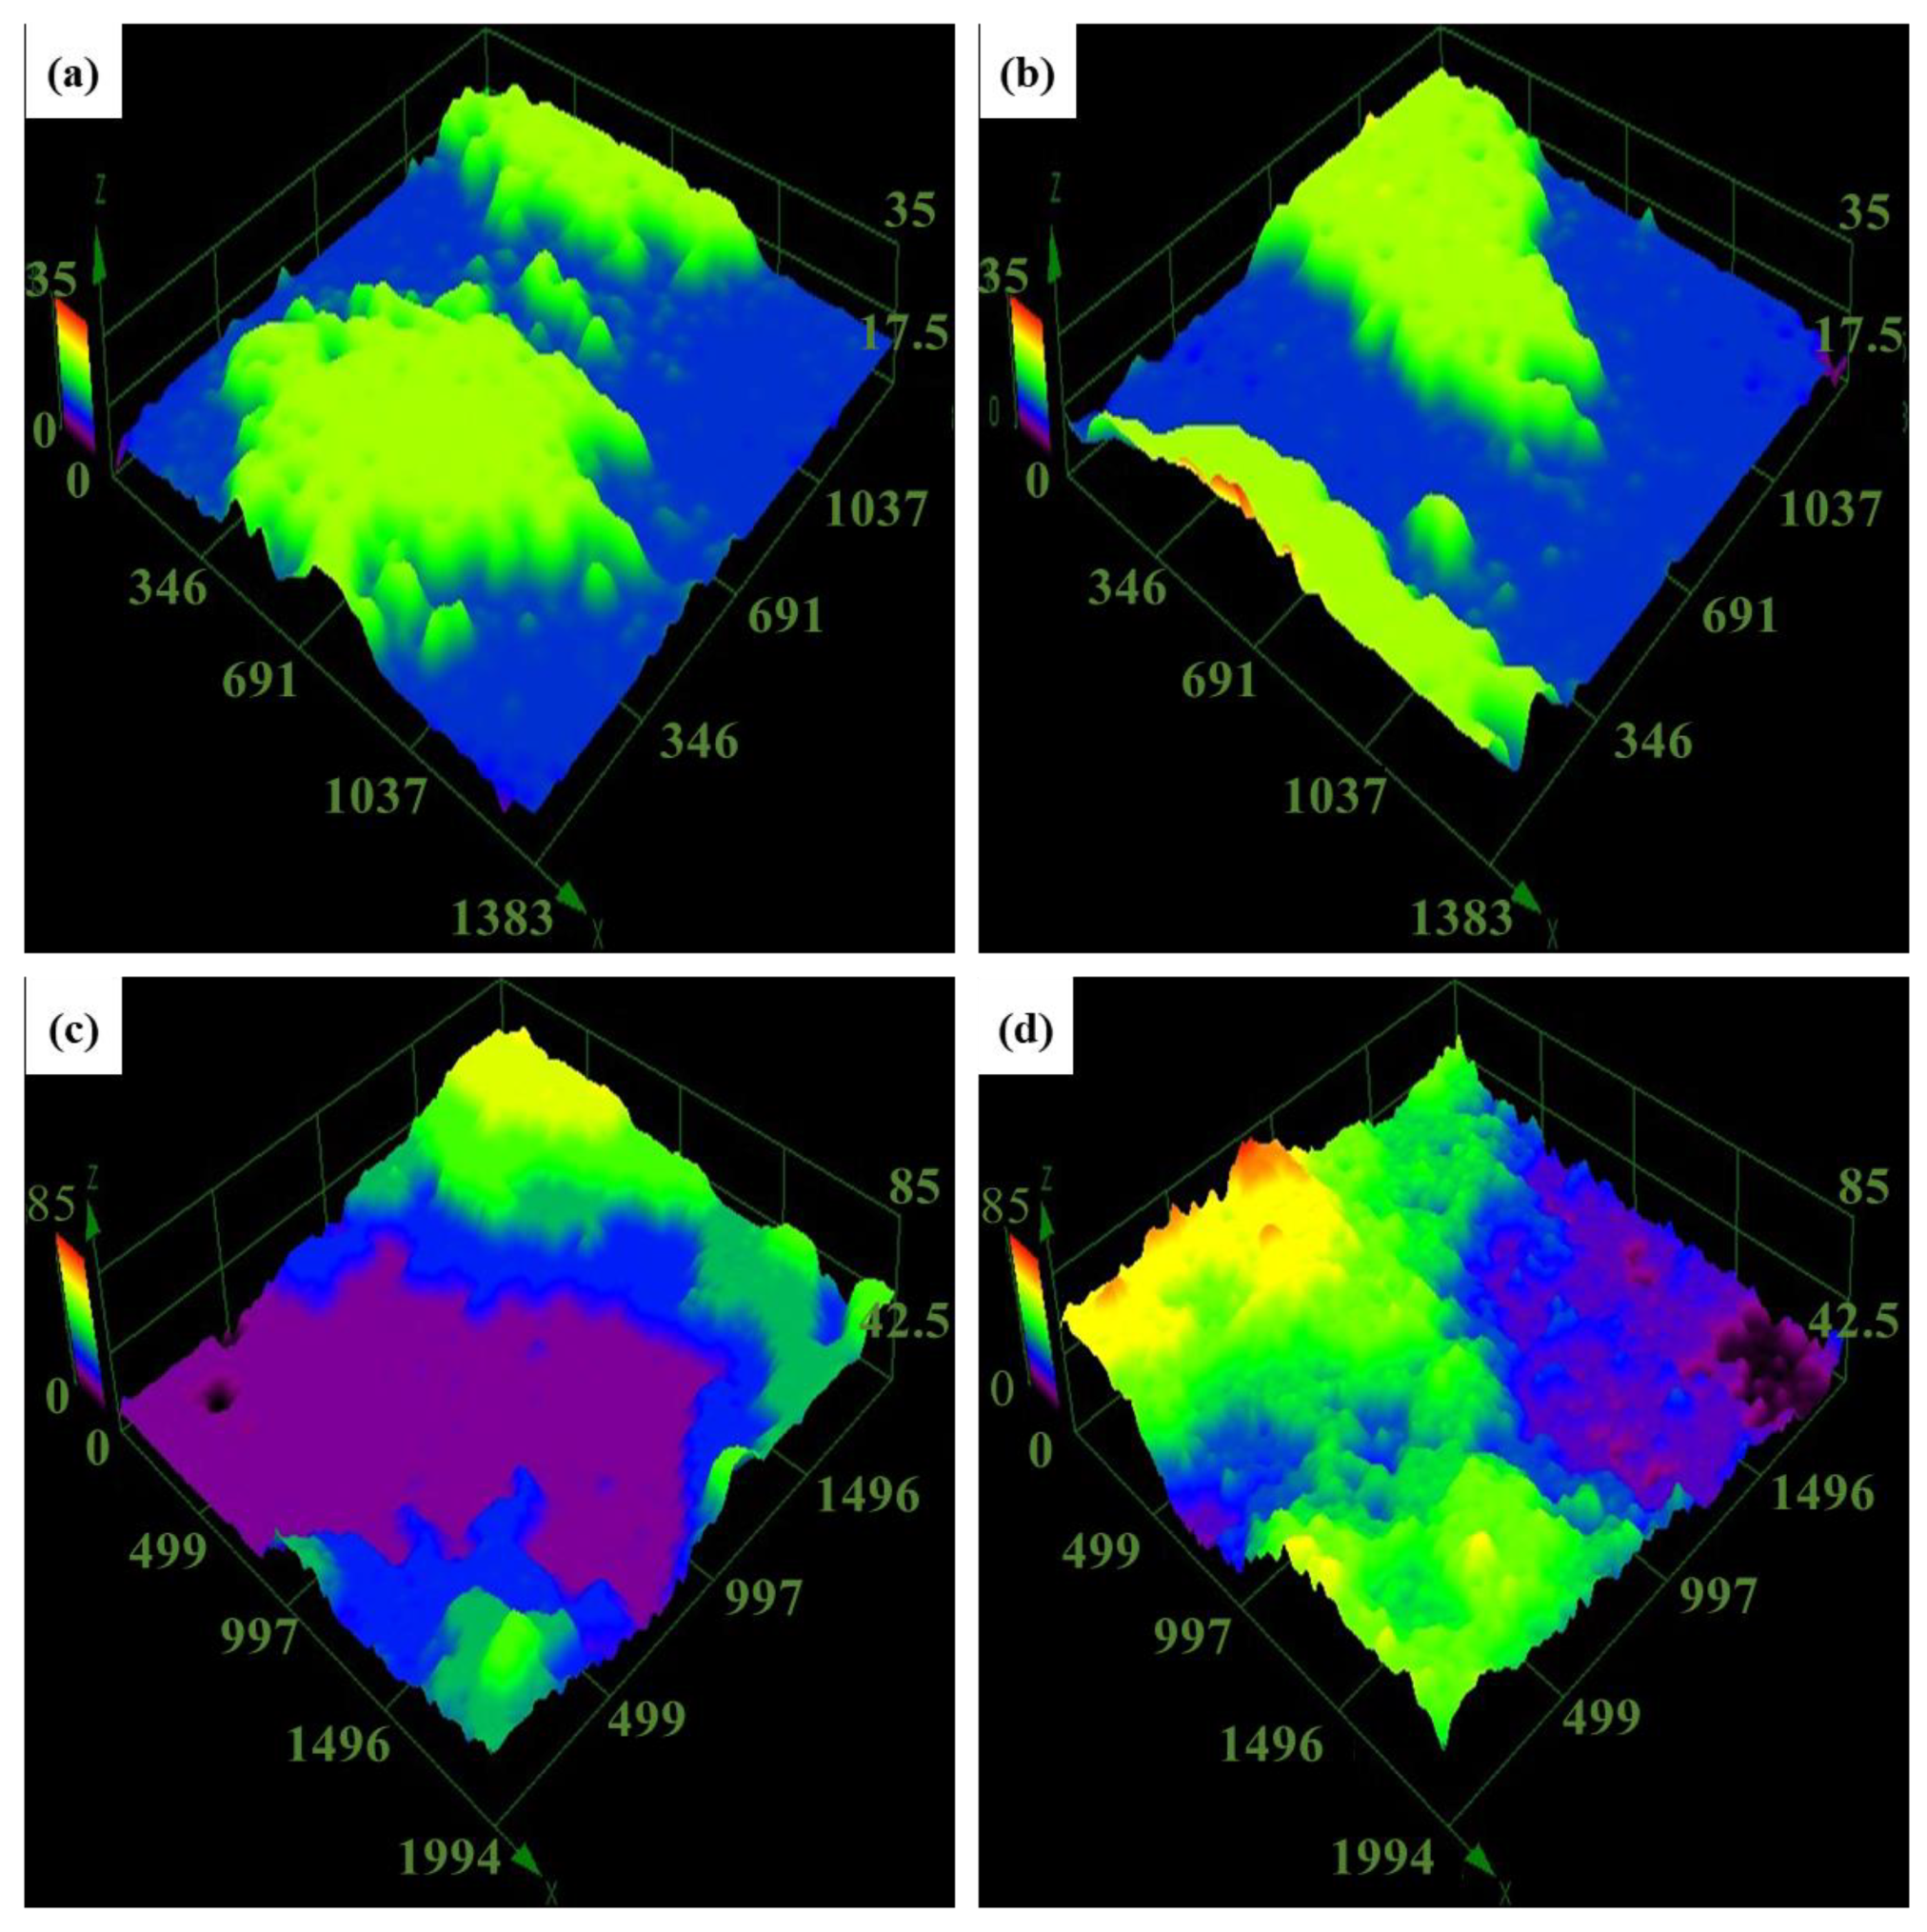
3.2.1. Fracture Surfaces Analyses

To explore the effect of deformation temperature on the fracture behavior at cryogenic temperatures, we selected uniaxial, tensile fracture specimens at 298 K, 218 K, 138 K, and 77 K and observed them under a scanning electron microscope, as shown in Figure 6 and Figure 7. The fracture surface of the O-state alloy deformed at 298 K had an obvious tearing ridge (Figure 6a). With the decrease in deformation temperature, the tearing ridge characteristics gradually weakened (Figure 6b,c), and the fracture surface of the deformed specimen displayed a typical dimple fracture mode at 77 K (Figure 6d). The W-state alloy exhibited similar fracture characteristics (Figure 7). With a decrease in the deformation temperature, the dimple size became larger and more uniform. Compared with the fracture of the O-state alloys, the fracture dimples of the W-state alloys were larger and deeper. This result agreed with the change in the elongation of the material.

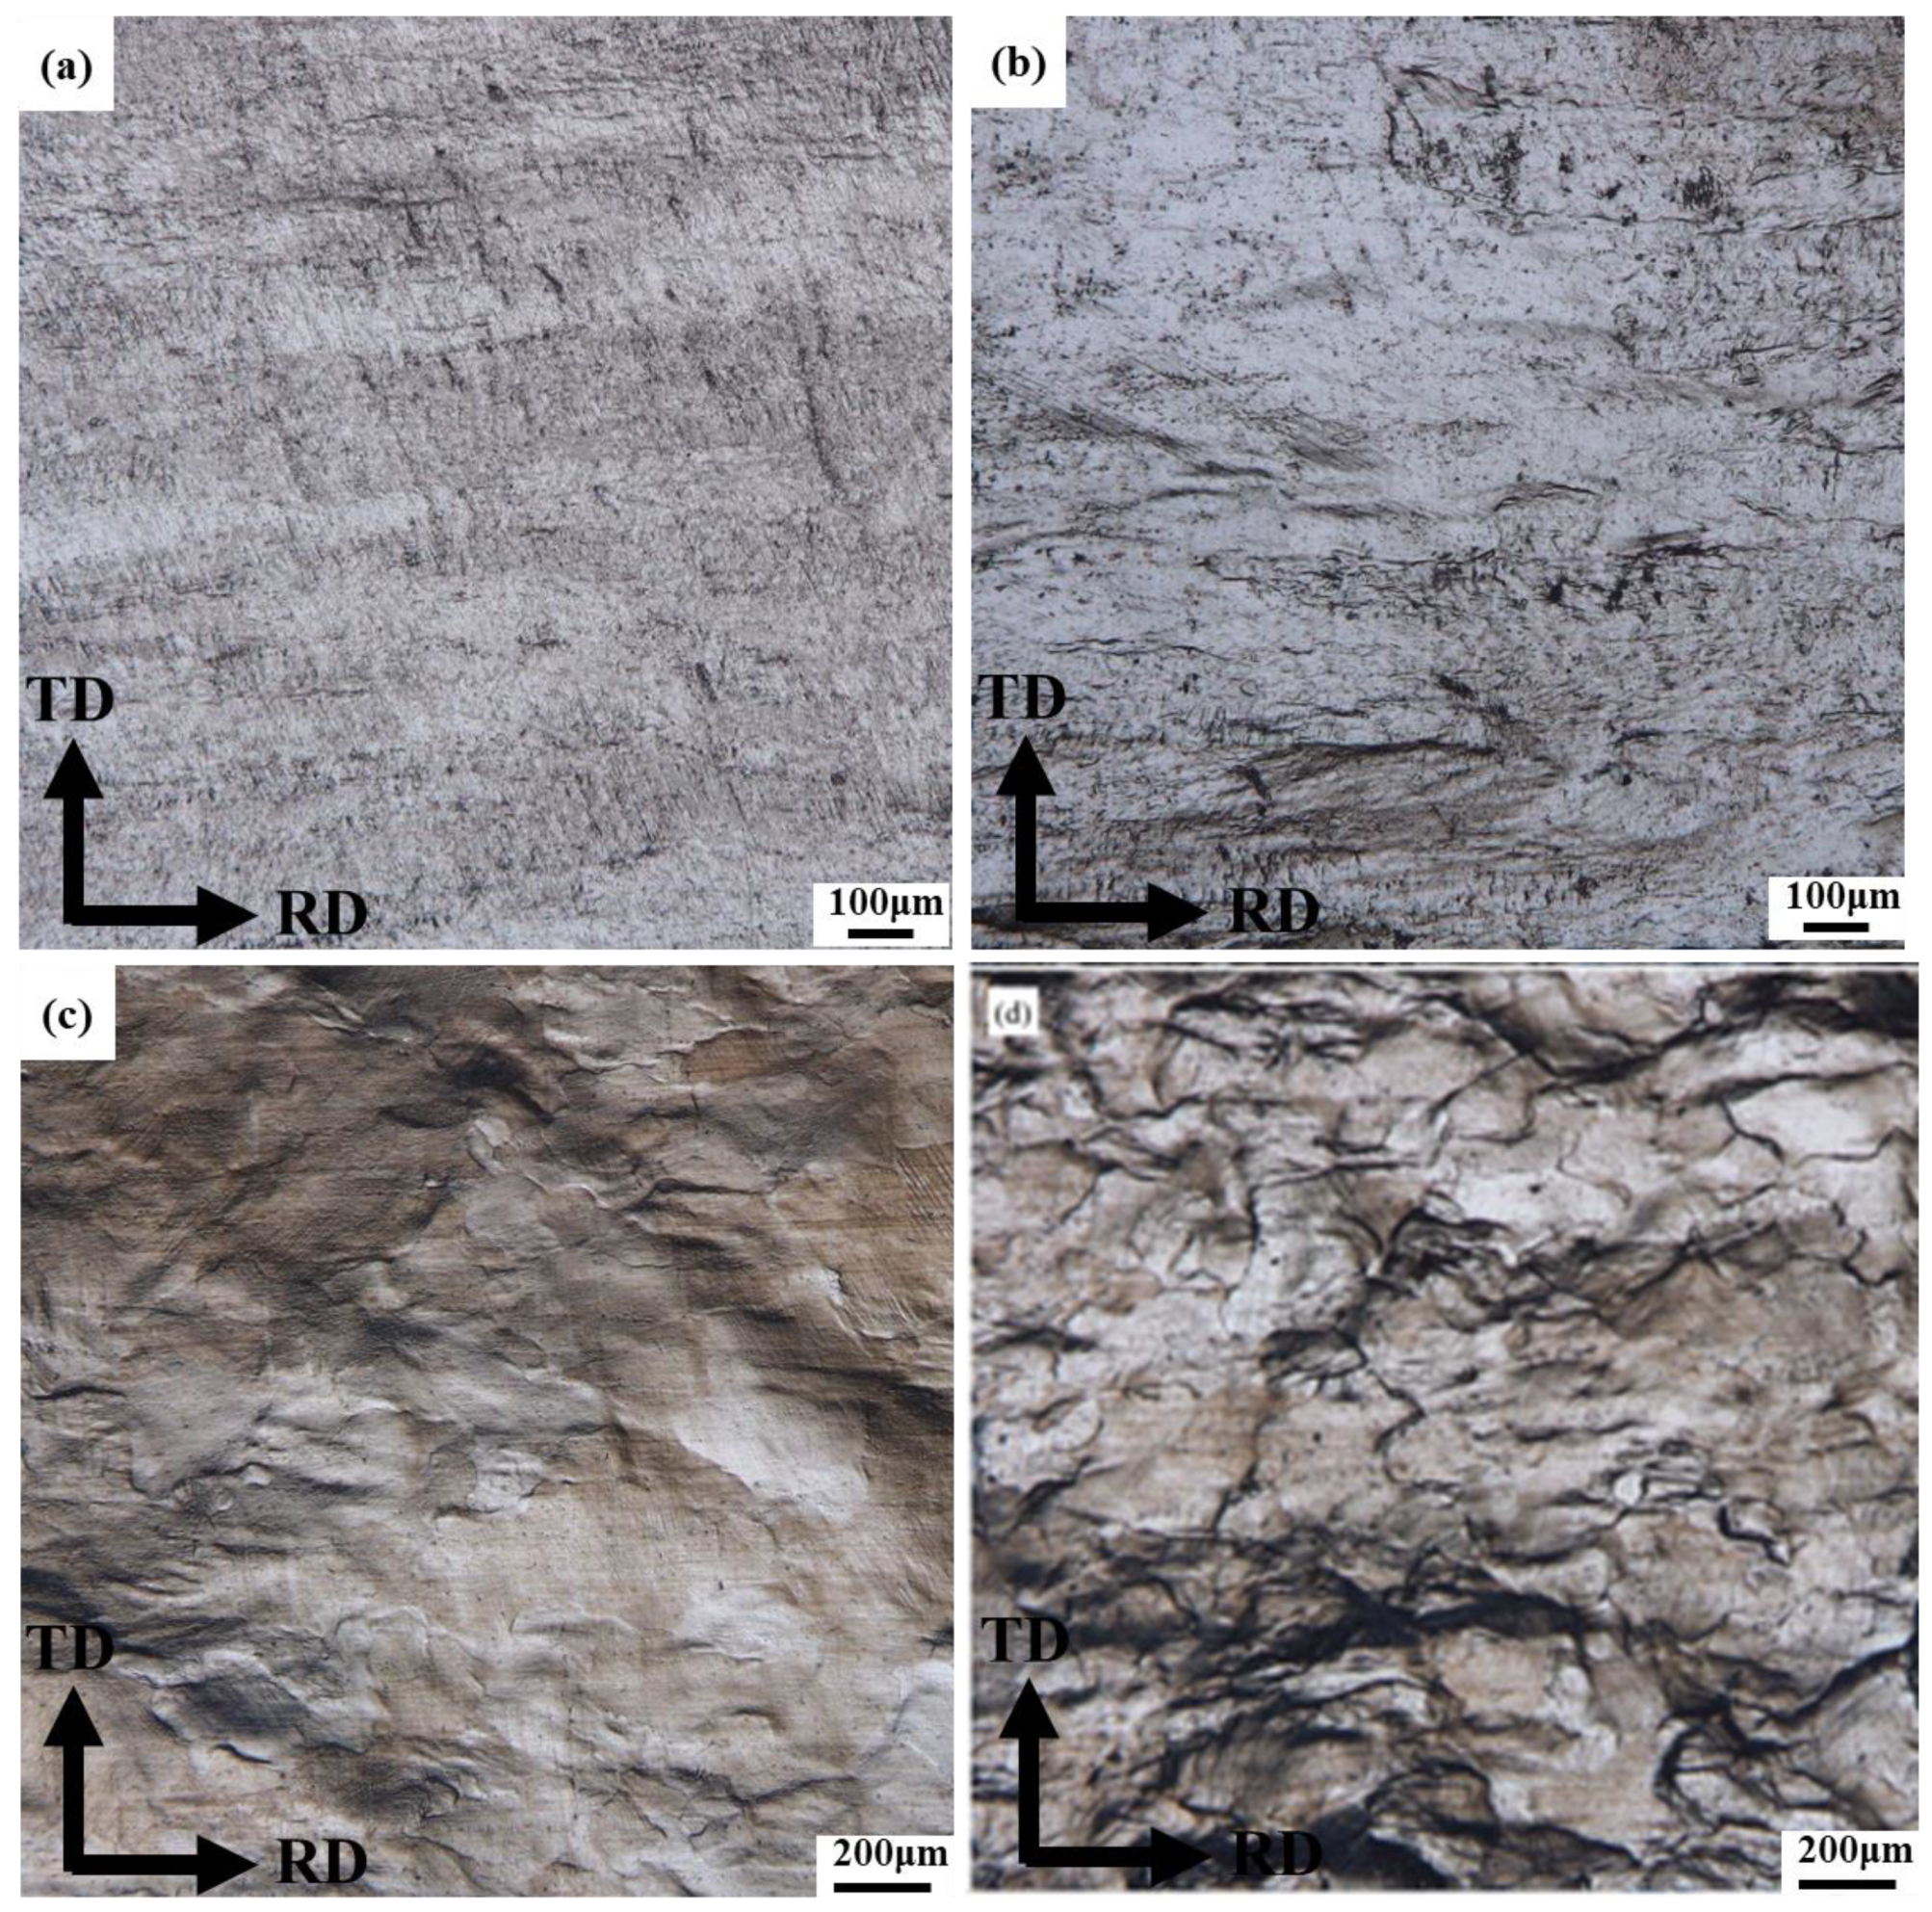
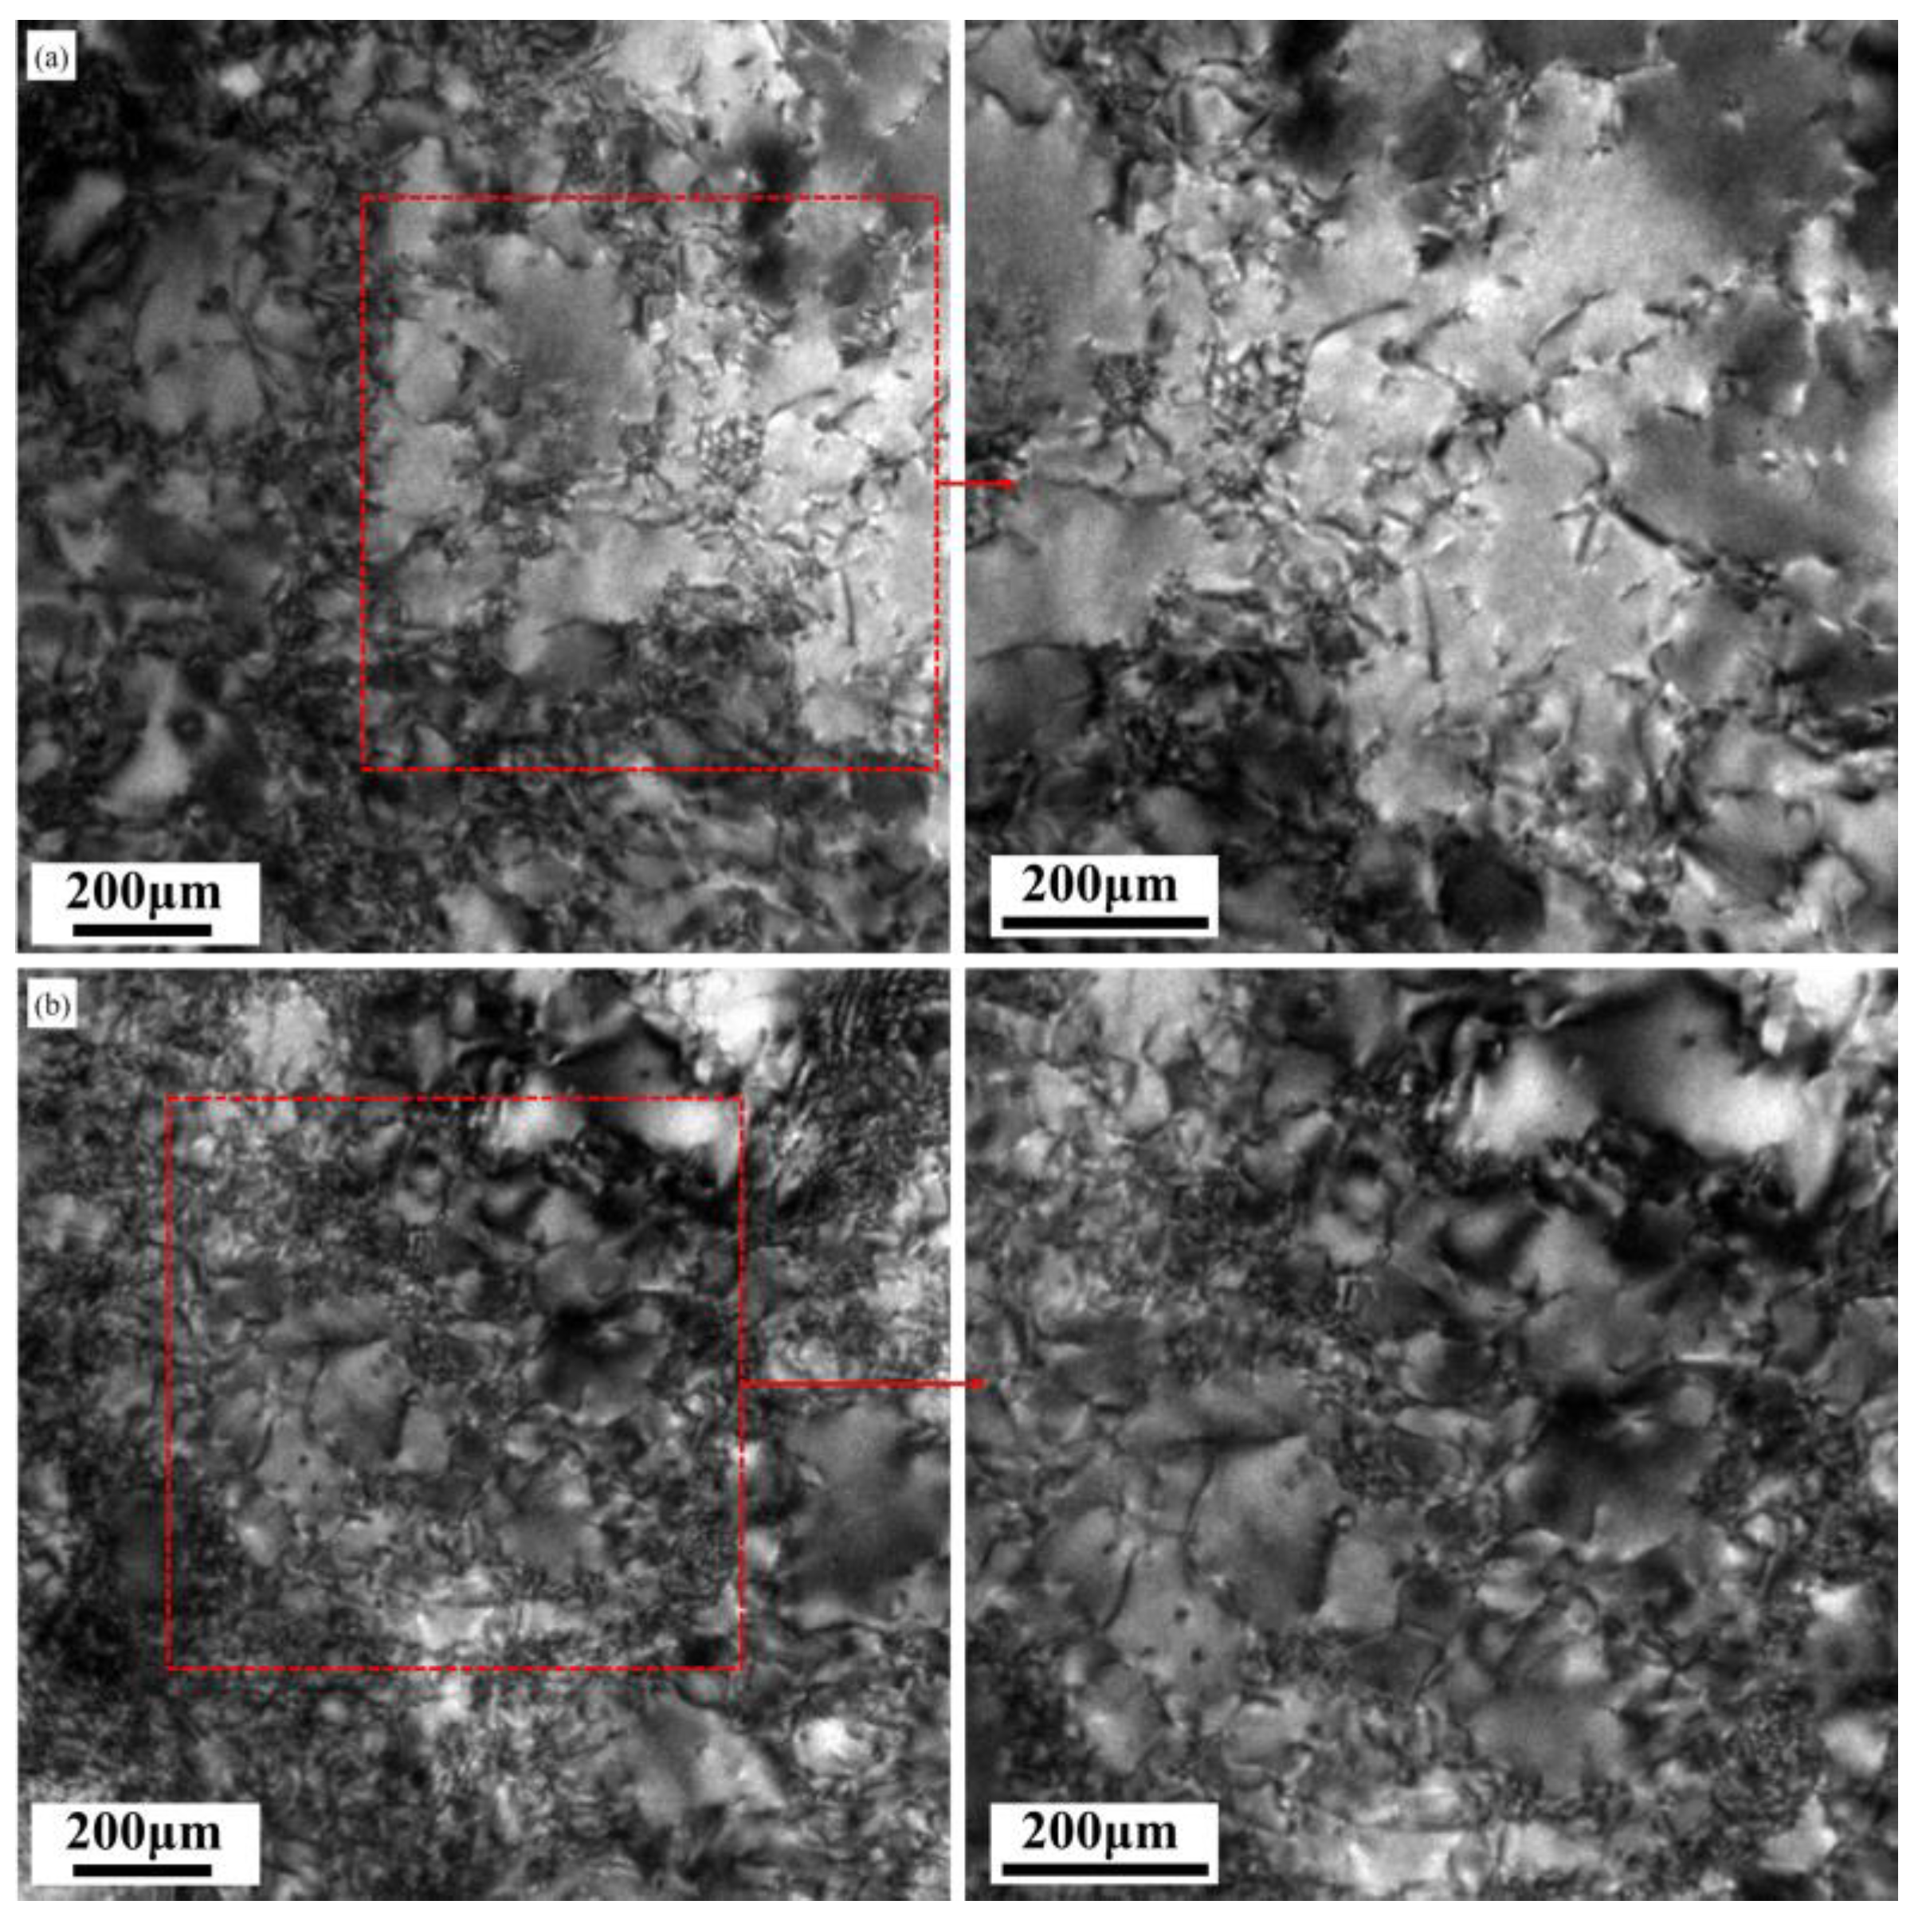
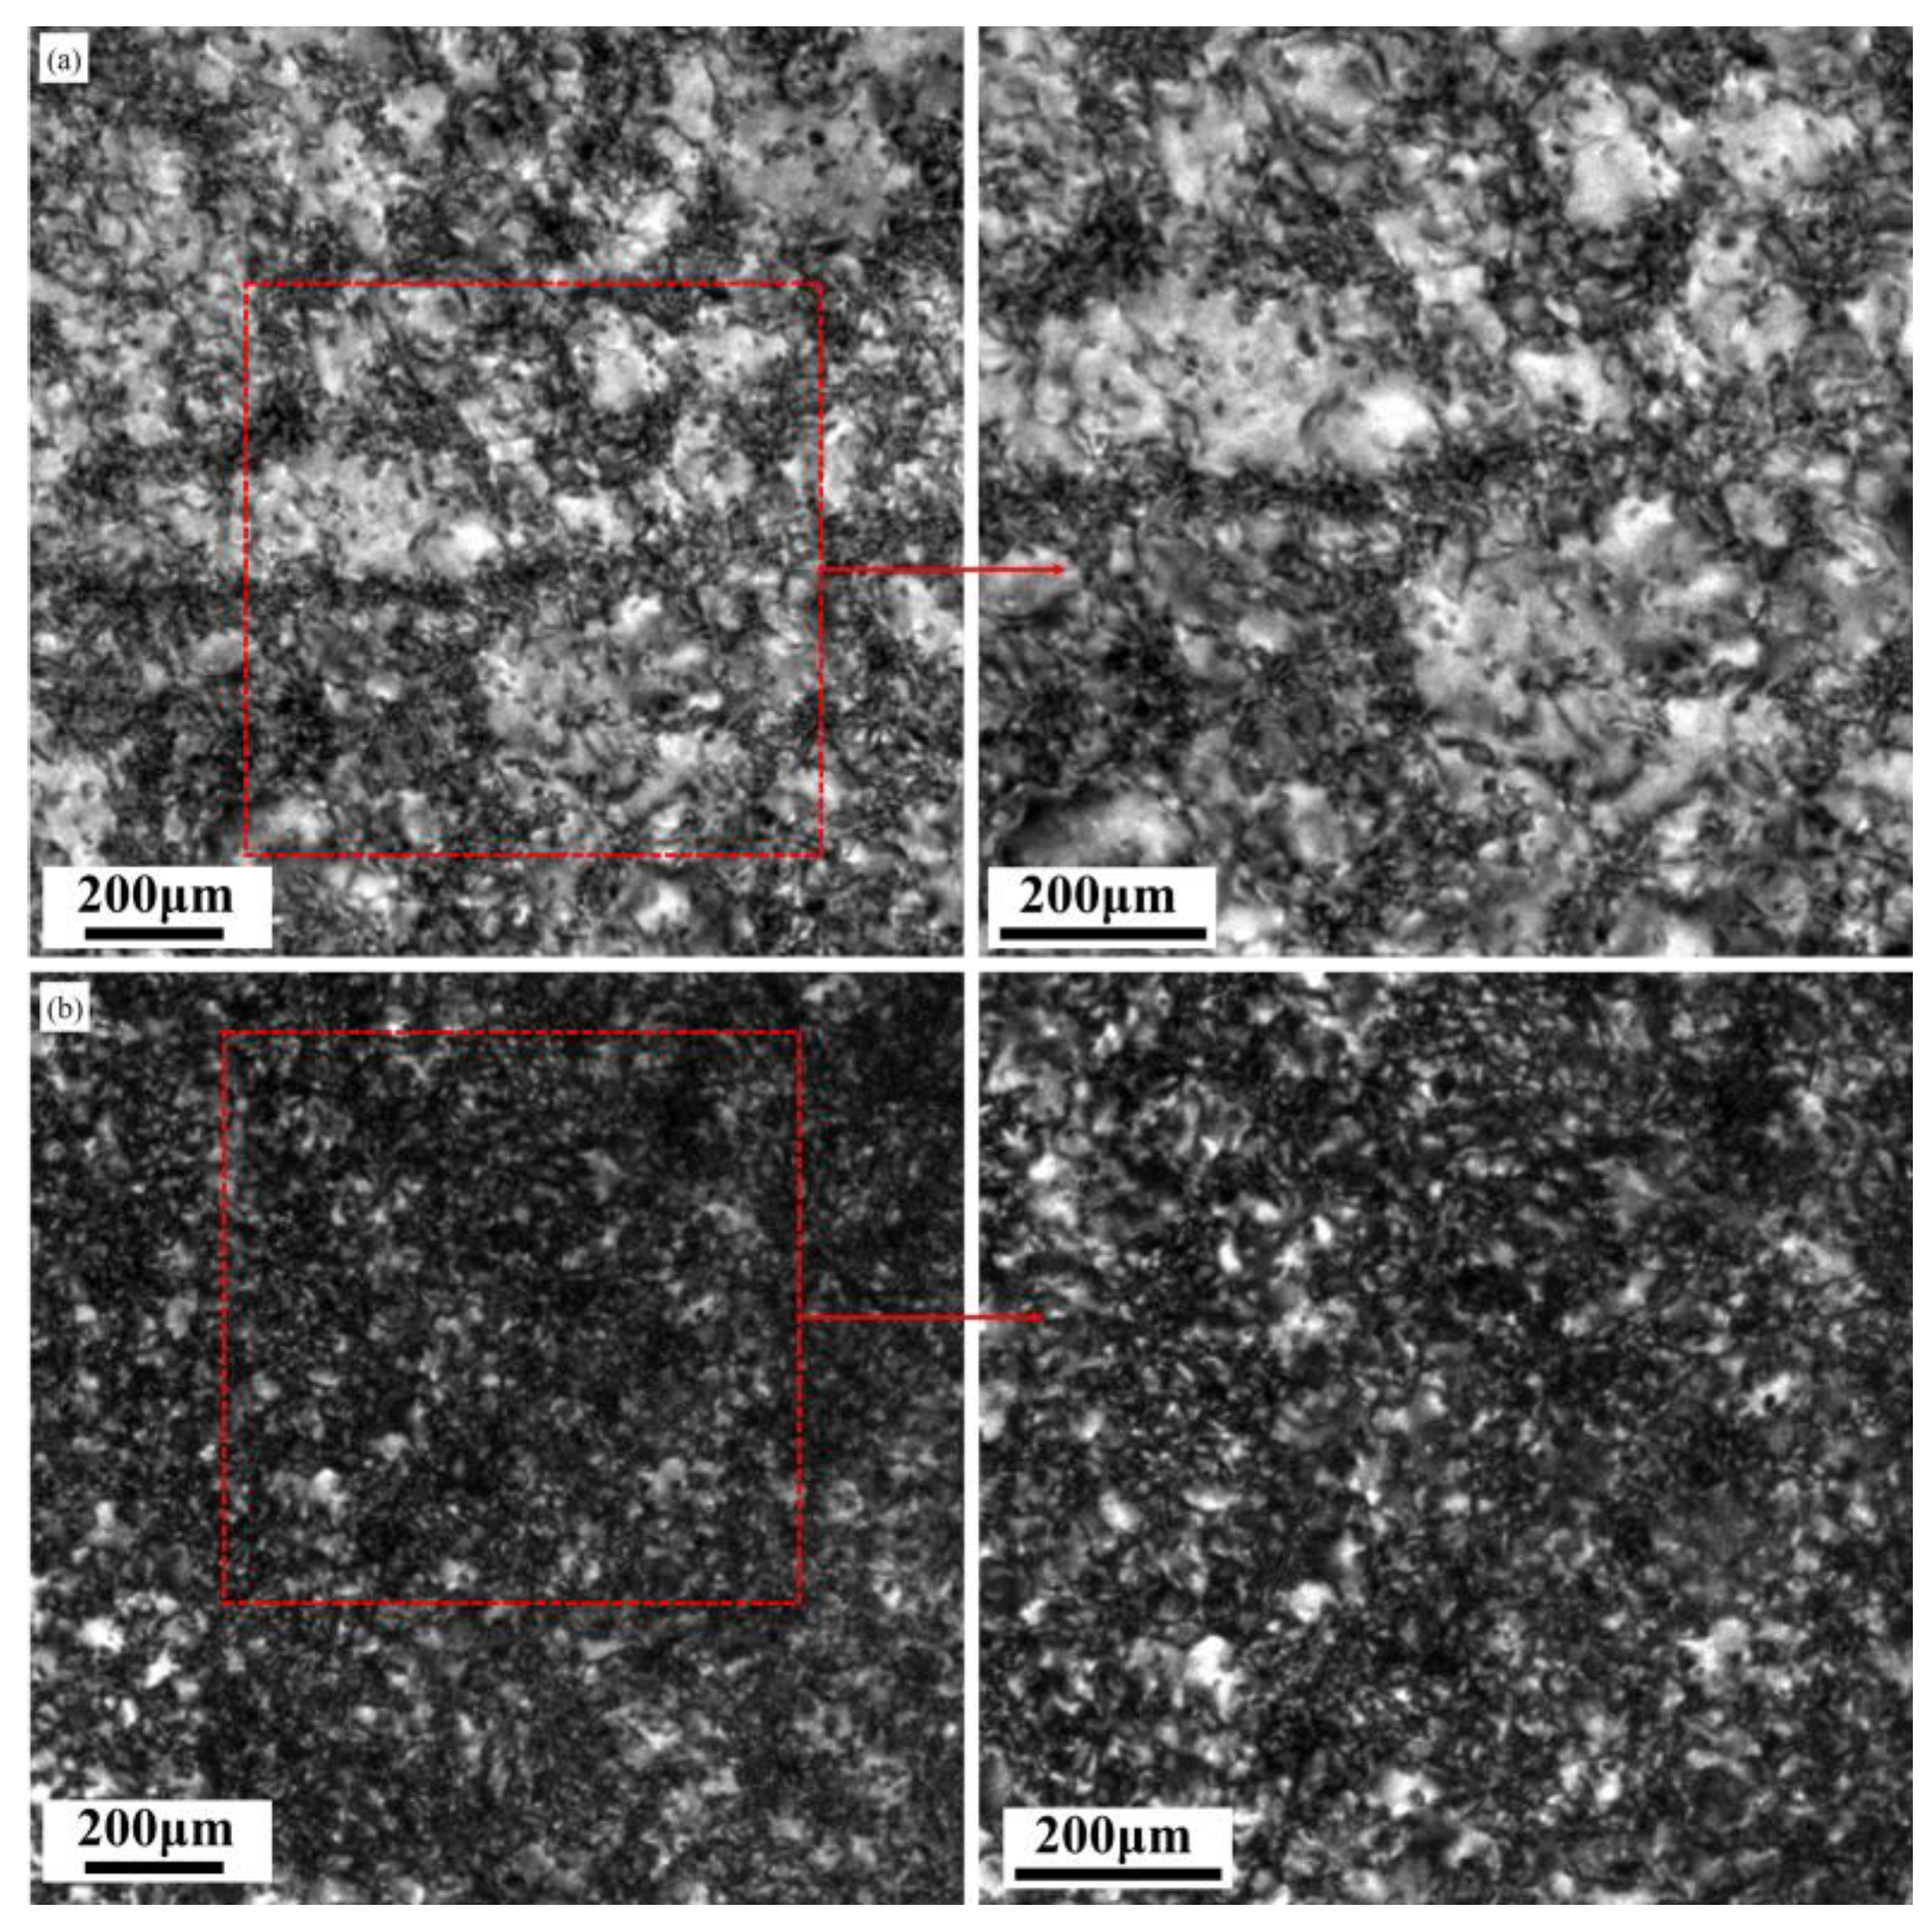
3.2.2. Optical Metallography
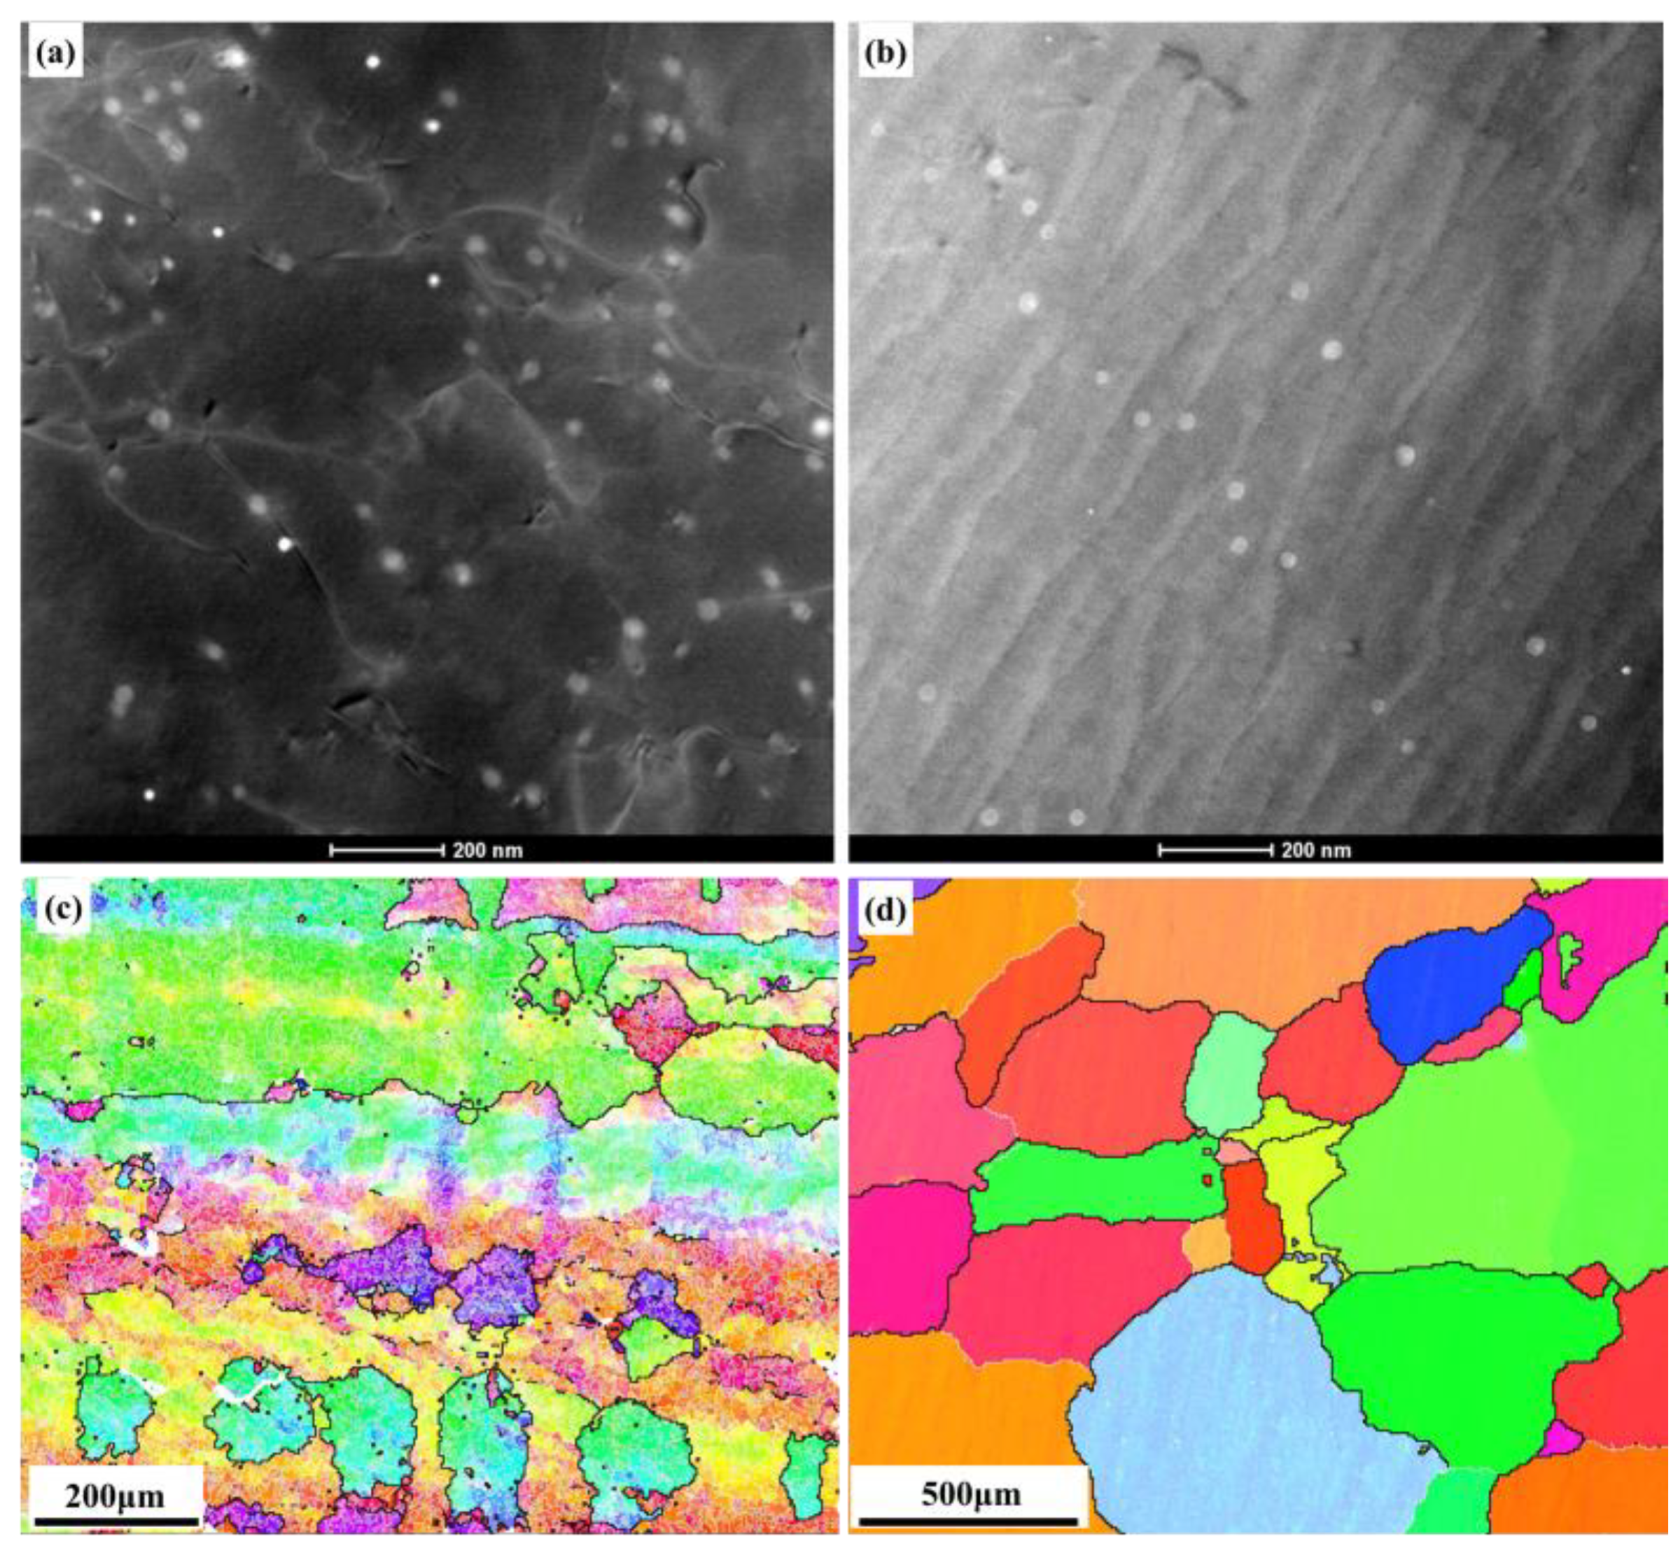
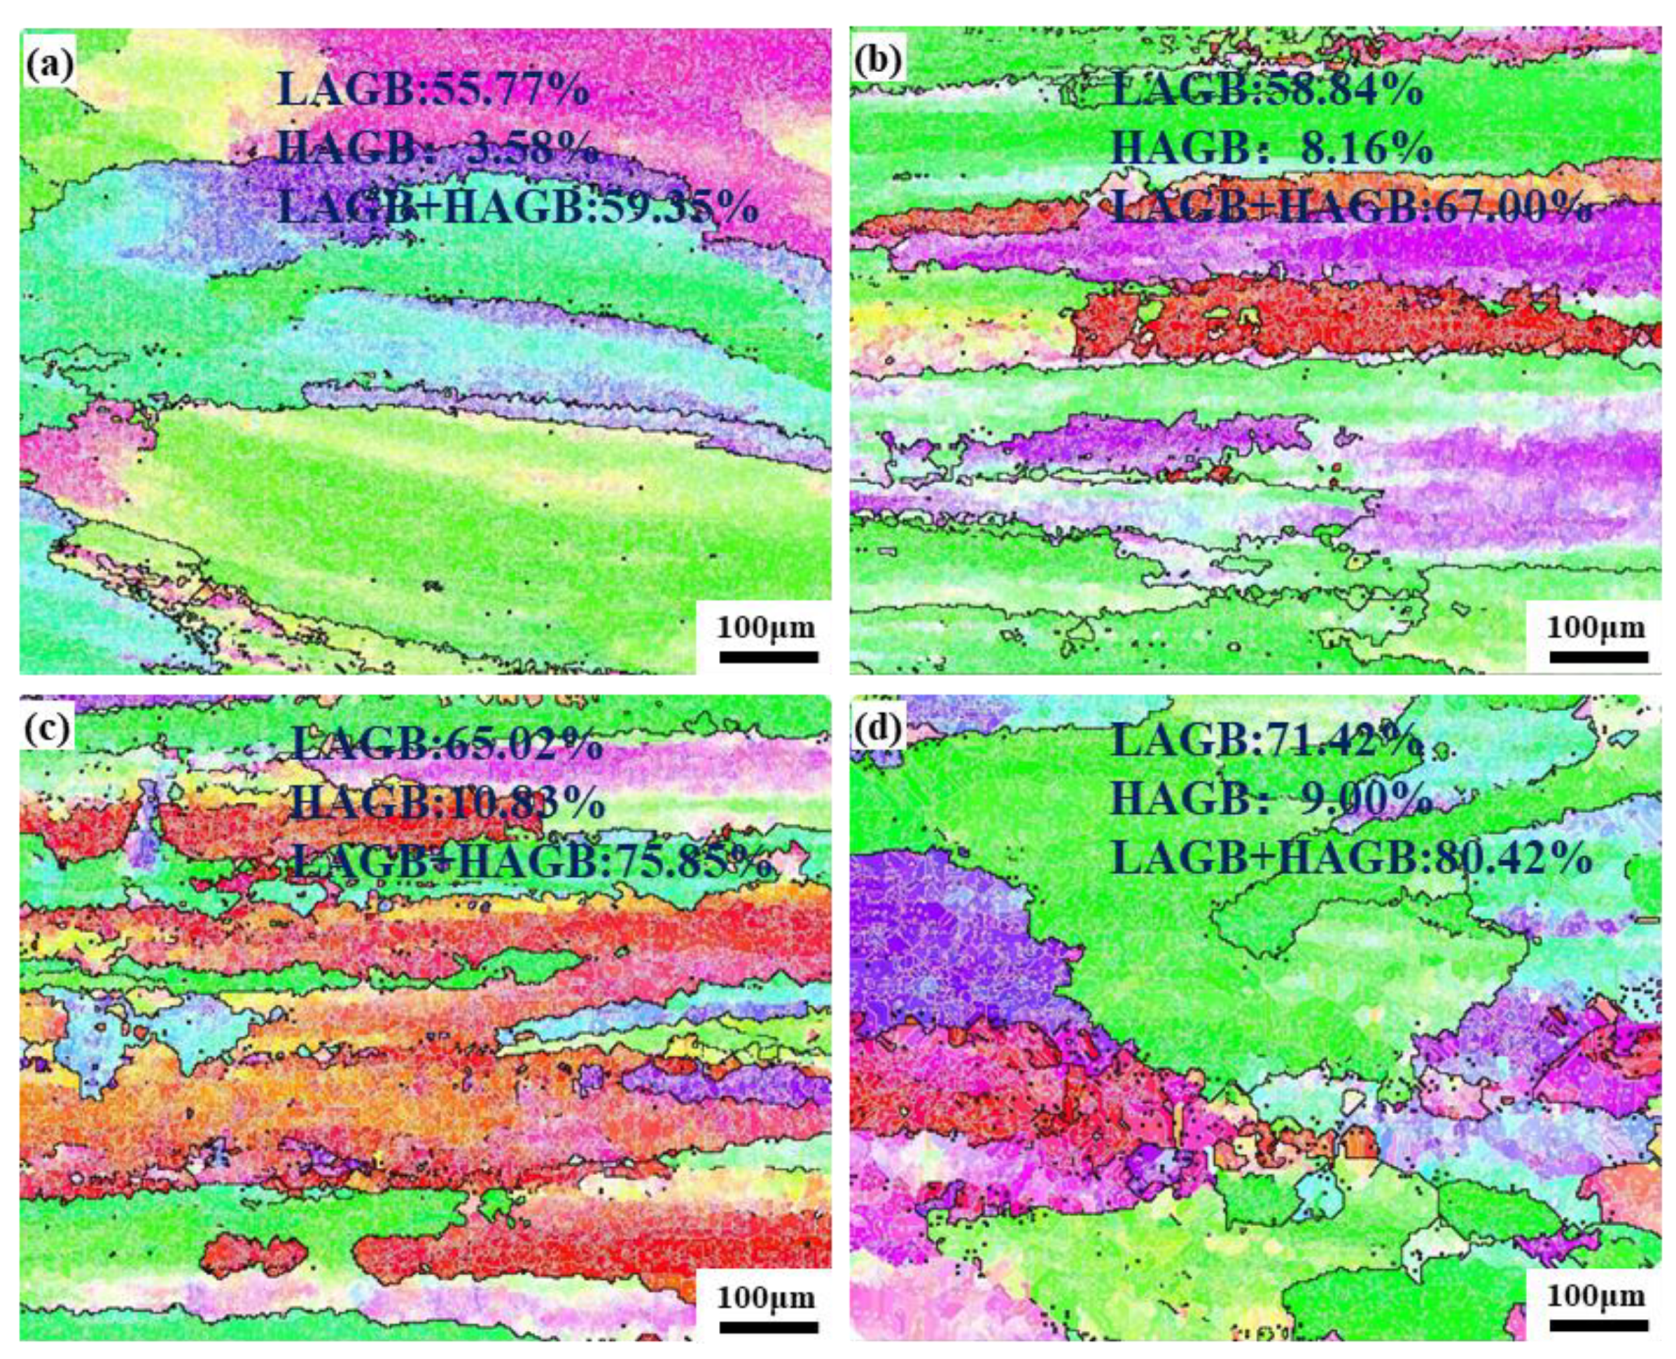
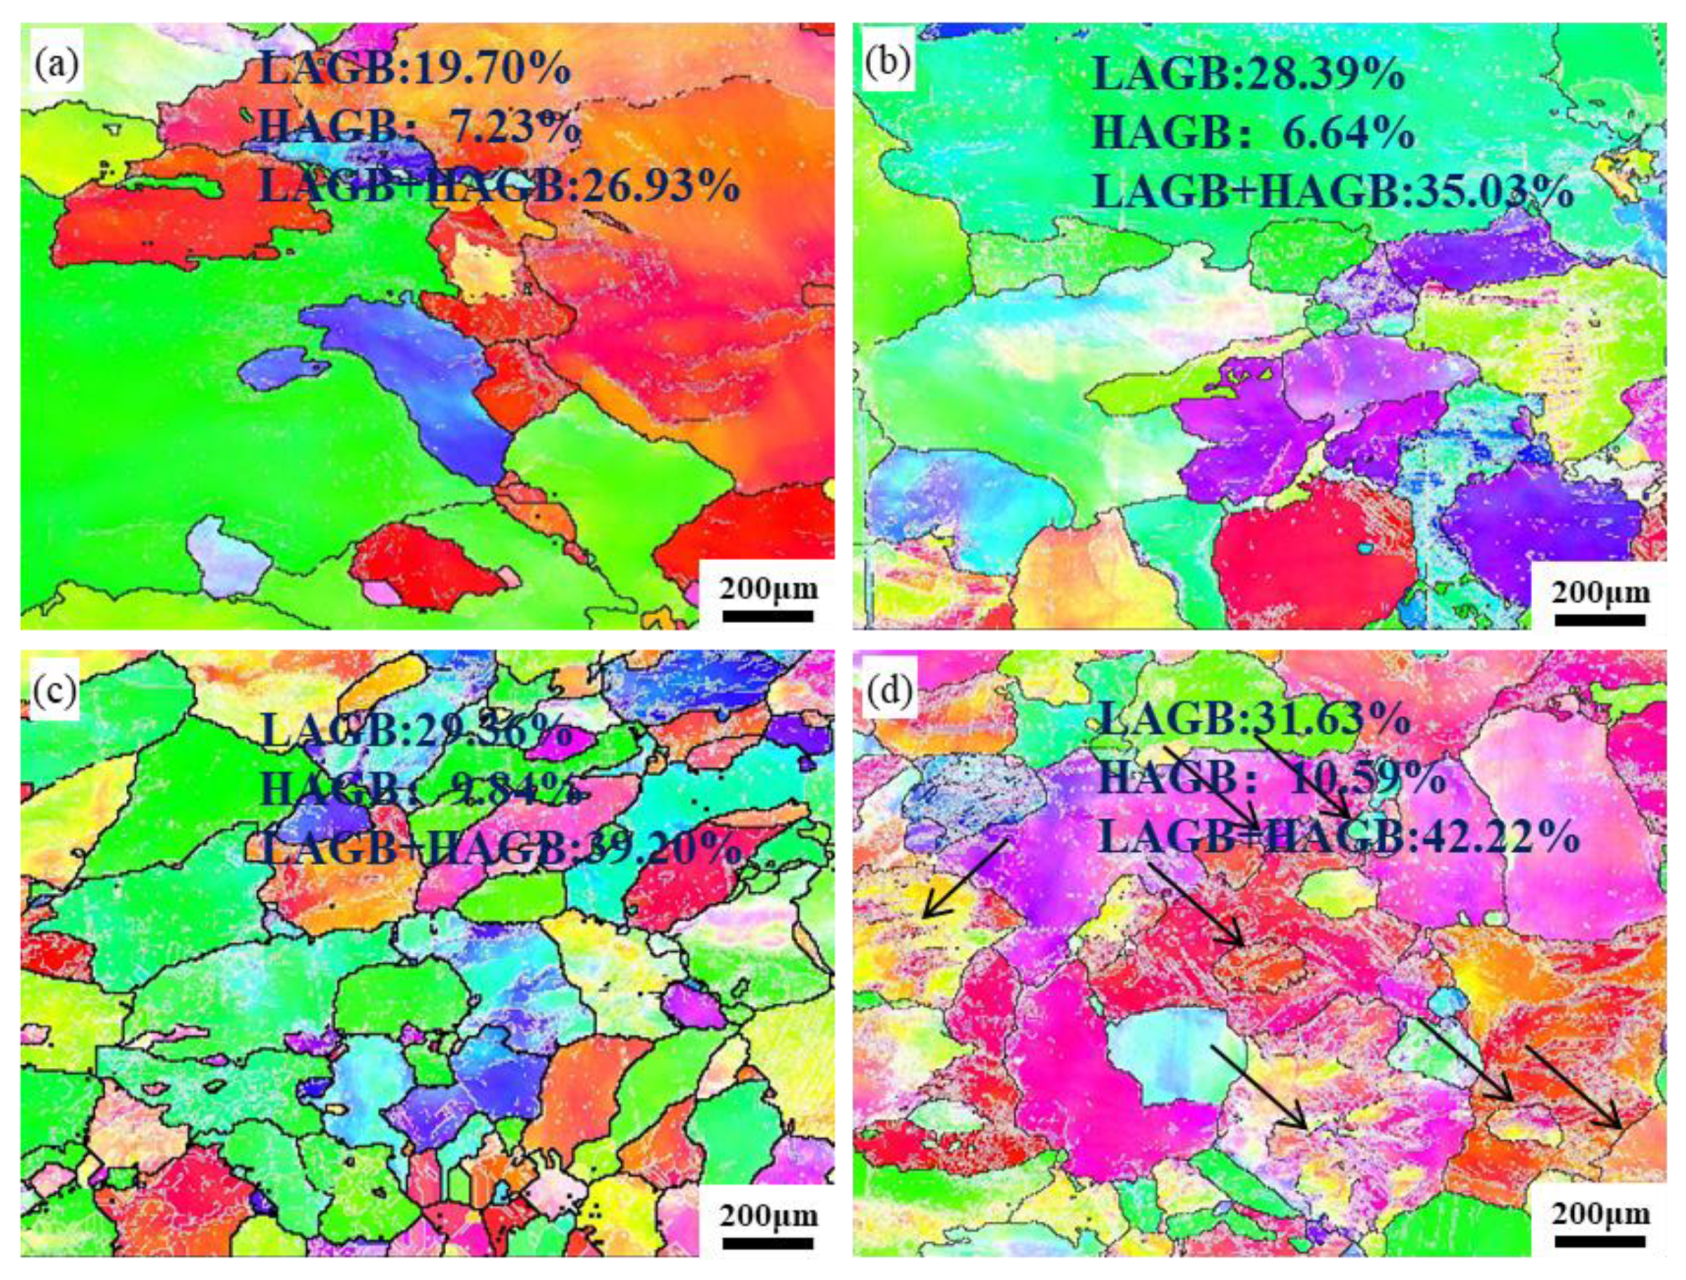
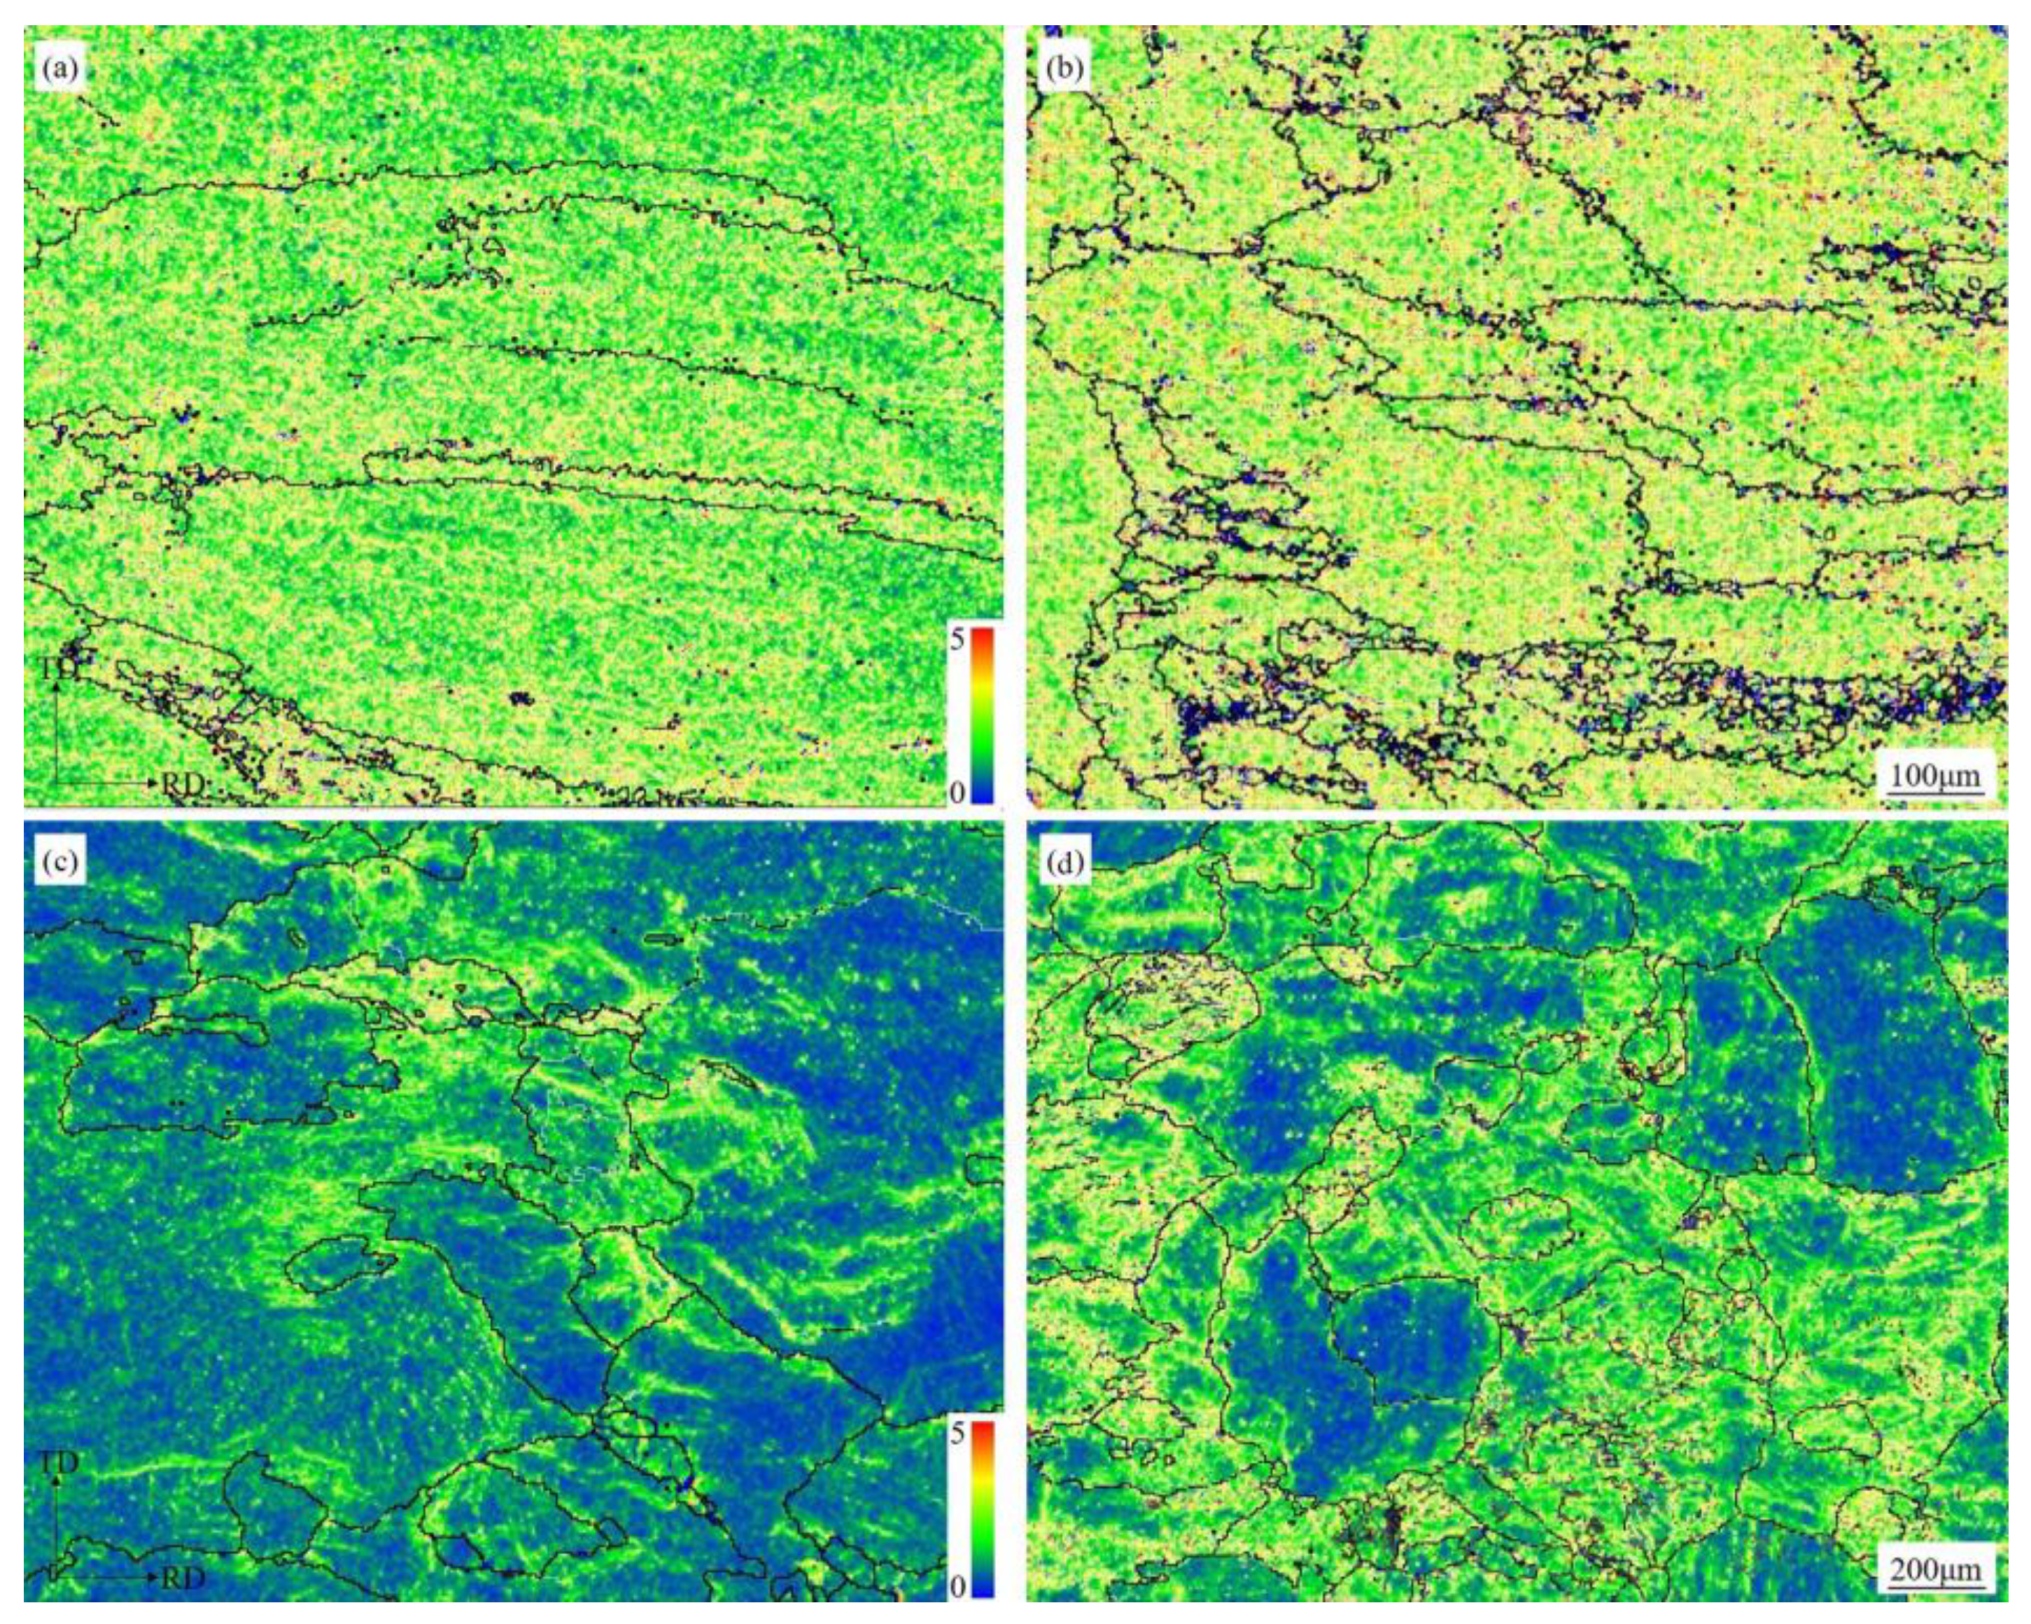
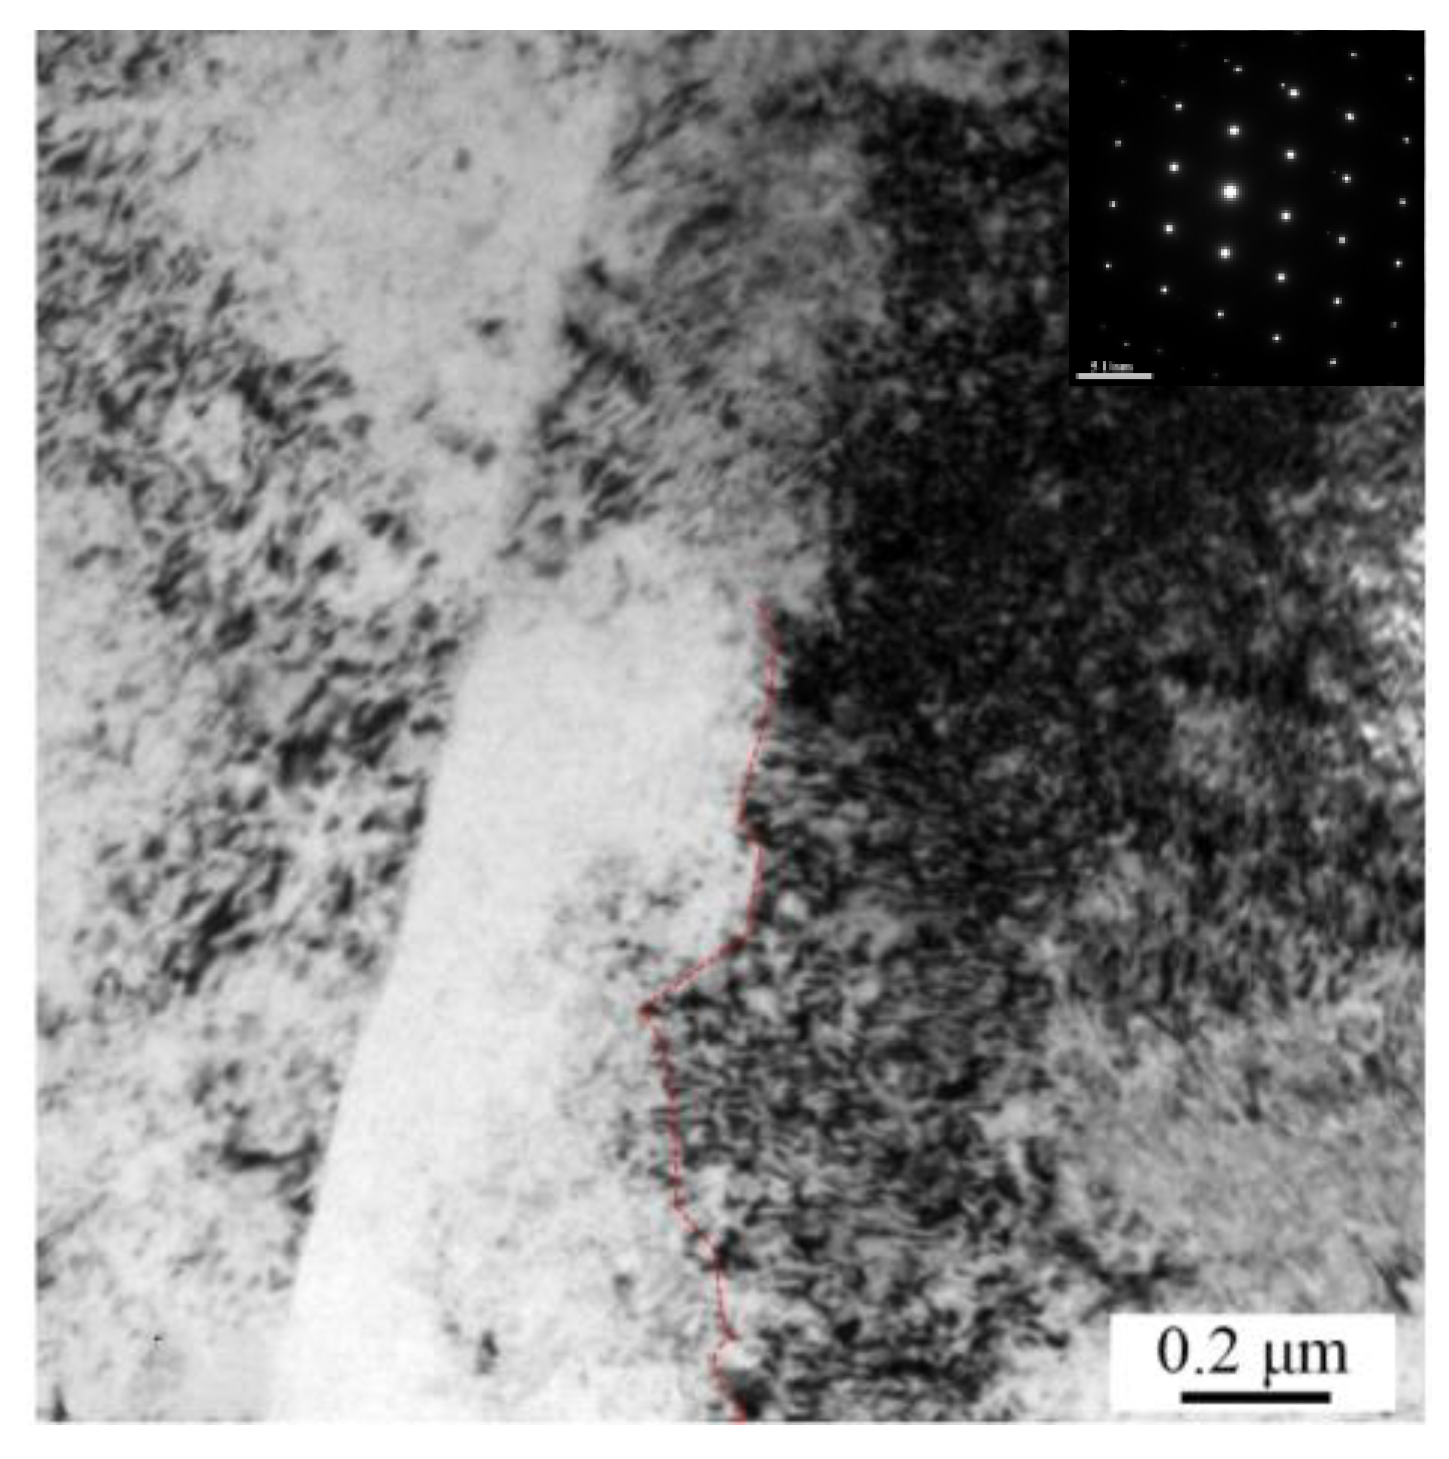
The differences in the deformation mechanisms of 2195 alloy in the two states were compared by observing the metallographic photographs of the tensile specimens at different deformation temperatures. Figure 8 and Figure 9 show the surface metallographic photos and height nephograms of the O-state and W-state alloys after 0.12 strain at 298 K and 77 K, respectively. The surface undulation of the specimen deformed at 77 K was more obvious. From the height nephogram, the height difference between the peak and valley of the deformed sample at 77 K was also higher than that of the deformed sample at 298 K. The height difference between the peak and valley on the surface of the deformed samples at 77 K and 298 K of the W-state alloy was larger than that of the O-state alloy. Quantitative analysis of the surface differences of the tensile specimens under different deformation temperatures was performed by measuring the surface roughness of the specimens, and the results are shown in Table 1. The statistical results of the surface roughness are consistent with those of height nephogram. The decrease in deformation temperature inhibited plane slip during the tensile process, which led to the plastic deformation of the material from the two-dimensional mode of plane slip to the three-dimensional mode of grain deformation.

3.2.3. EBSD

The EBSD results for a strain of 0.12 in the O-state and the W-state are shown in Figure 10 and Figure 11, respectively. In the EBSD images, different colors correspond to different grain misorientations. The larger the color difference, the greater the grain misorientation. The misorientation between 2° and 15° were defined as low-angle grain boundaries (LABGs), and those larger than 15° were defined as the high-angle grain boundaries (HABGs). The deformed O-state and W-state alloys were composed of recrystallized grains, subgrains, and deformed grains, but the proportions were different. The proportion of LABGs and HABGs of O-state and W-state specimens increased with decrease in deformation temperature. This indicates that decrease in deformation temperature will aggravate the deformation inside the alloy grain and increase the intragranular substructure.
Kernel average misorientation (KAM) is a core point composed of the 24 nearest adjacent points. It is used to assign a scalar value to each point to represent its local misorientation, which indicates the degree of deformation at the point. In the EBSD KAM maps, red indicates a large local misorientation, while blue indicates a small local misorientation. Figure 12 shows the KAM distribution of the O-state and W-state specimens tensioned to 0.12 strain at 298 K and 77 K. For the O-state alloy, the local misorientation inside the grain was smaller than that at the grain boundary at 298 K (Figure 12a), whereas there was approximately no difference between the local misorientation between the grain and the grain boundary at 77 K (Figure 12b). For the W-state alloy, at 298 K (Figure 12c), the region with a higher local misorientation was concentrated at the grain boundary, with only a small part inside the grain. At 77 K (Figure 12d), the proportion of large misorientations in the grain increased and the total area increased. The results showed that the grains and grain boundaries deformed simultaneously at 77 K. With the decrease in deformation temperature, the deformation mode changed from two-dimensional plane slip to three-dimensional plastic deformation.

4. Discussion

The strengthening mechanisms of Al–Cu–Li alloys includes fine grain strengthening, solution strengthening, second phase strengthening, and work hardening. Generally speaking, the contribution of solution strengthening of alloys with the same composition has little change [23]. As can be seen from Figure 1, O-state and W-state 2195 alloys had only a small amount of β’ phases. Moreover, the strengthening effect of β’ phase was very limited when β’ phase exists alone [24]. In addition, there was no dynamic precipitation in 2195 alloy at room and cryogenic temperatures. The grain size of O-state and W-state alloys did not change significantly with a decrease in deformation temperature, and therefore the change in grain size had little contribution to the enhancement of strength at cryogenic temperature. It is speculated that the strengthening mechanisms of Al–Cu–Li alloys at cryogenic temperatures mainly come from work hardening.
Work hardening is closely related to dislocation movement. It is generally believed that the dislocation density is positively related to the strength of the alloy. This was determined using Taylor’s formula (Equation (2)) [25]:
σ i σ 0 = M α G b ρ i
where σi is the flow stress of the alloy; σ0 is the yield stress of the alloy; M is the Taylor coefficient, which is 3.0 in the FCC structure; α is the structure coefficient; G is the shear modulus; b is the Burger’s vector, which is 0.286 nm in Al alloys; and ρi is the dislocation density. According to Taylor’s formula, the dislocation density can be used to explain the strength of alloys.
The KAM obtained from EBSD can be used to estimate the geometrically necessary dislocation density, ρGND, of the alloy. The formula (Equation (3)) [26] used is as follows:
ρ GND δ θ D b
where δ is the material constant, equal to 3.0, θ is the average KAM value, and D is the step size of the EBSD maps. The stress at a strain of 0.12 for the O-state alloy and the W-state alloy, respectively, and ρGND calculated by Equation (3), are shown in Figure 13. The variation in stress and ρGND was approximately the same when the strain was constant at different deformation temperatures. Therefore, it was concluded that the dislocation density was the main factor influencing the difference in the strength of the alloys.
To characterize the accumulation of dislocations and the difference in movement mode at different deformation temperatures, we carried out TEM observation experiments on two state alloys when they were deformed at 298 K and 77 K with a strain of 0.12. The results are shown in Figure 14 and Figure 15. The number of dislocations in the alloys deformed at 77 K was significantly larger than that in the alloys deformed at 298 K, which was consistent with the above calculation of dislocation density and tensile strength. The size of the cellular structure formed by dislocation entanglement in the O-state alloy was smaller at 77 K (Figure 14b) than that at 298 K (Figure 14a), while the size of the cellular structure of the W-state alloy decreased more significantly (Figure 15b). The decrease in deformation temperature inhibited the dynamic recovery of the alloy. Dynamic recovery [23] is a process of metal deformation through thermal activation, vacancy diffusion, dislocation motion cancellation, and dislocation rearrangement. The vacancy diffusion coefficient of the alloy is affected by the temperature, as determined by Equation (4) [27]:
D = D 0 exp ( Q R T )
where D is the diffusion coefficient, D0 is the atomic transition constant, Q is the diffusion activation energy, R is the gas constant, and T is the ambient temperature. As the temperature decreased, the vacancy diffusion coefficient of the alloy decreased, limiting diffusion at cryogenic temperatures. In addition, dislocation motion requires a force to overcome the lattice resistance and cross the potential barrier, which is called the Peirls–Nabarro stress. The Peirls–Nabarro stress is a short-range ordered force that is greatly affected by temperature. The lower the temperature, the higher the Peirls–Nabarro stress. Therefore, at cryogenic temperatures, the energy barrier for dislocation motion increased and the dislocation motion was restrained, which made it more difficult for dislocation entanglement to form a cellular structure and inhibited the dynamic recovery of the alloy. This facilitated the accumulation of dislocations in the deformed alloys at cryogenic temperatures, resulting in higher dislocation densities at cryogenic temperatures than at room temperature, thus improving the strength of the alloy. However, at present, there is no reasonable explanation for the phenomenon that the strength of the W-state alloy initially increased, then decreased and increased again, which will be the focus of future research.
Plastic deformation improved at cryogenic temperatures because there was a more uniform deformation mechanism at cryogenic temperatures. At cryogenic temperatures, the inner part of the grain was more involved in the deformation. The influence of temperature on the strength of the intergranular and grain boundaries differed. The strength of the grain boundary increased with the temperature decreased. The results showed that, under the same stress conditions, intragranular deformation was easier than at room temperature. Figure 16 shows a bright-field TEM image of a W-state alloy deformed at 77 K. Many morphologies that differed from the misorientation of the matrix were found, which was in good agreement with the results of the KAM (Figure 7f). In addition, there was no obvious boundary in the parts with different misorientations in the matrix, which indicated a state of slow transition. This showed that one part of the grain deformed relative to the other parts. At cryogenic temperatures, the intragranular deformation of the alloy was obvious, i.e., the fluidity of the grains was better. At low temperatures, both the grain and grain boundaries moved simultaneously. This makes the deformation of the alloy at cryogenic temperatures more uniform; thus, the plasticity of the alloy significantly improved. By comparing the metallographic photographs and roughness (Table 1) of the surfaces of the O-state (Figure 4) and W-state (Figure 5) deformed samples at 298 K and 77 K, it was found that the fluctuation and roughness of the W-state surface were greater than those of the O-state alloy. This showed that the degree of deformation involved inside grain interiors of the W-state alloy was higher than that of the O-state alloy at cryogenic temperatures, leading the plasticity of the W-state alloy to improve more significantly than that of the O-state alloy.

5. Conclusions

(1)
The deformation temperature had a significant effect on the tensile properties of Al–Cu–Li alloys in the O-state and W-state. The strength and elongation of the O-state and W-state alloys increased with the decrease in deformation temperature, where the increasing trend of elongation of the W-state alloy was more significant than that of the O-state alloy. In addition, a temperature range was observed at approximately 178 K that decreased the strength of the W-state alloy. When the deformation temperature was between 298 K and 178 K, the tensile strength of the two states of the alloys did not significantly change; when the deformation temperature was lower than 178 K, the tensile strength of the alloy changed significantly with the decrease in deformation temperature. The decrease in the deformation temperature eliminated the serrated fluctuation in the tensile curve.
(2)
With the decrease in deformation temperature, the dynamic recovery of the alloy was restrained, resulting in a higher dislocation density and higher degree of work hardening. The strength of the alloy was significantly improved by the effects of work hardening.
(3)
In the cryogenic-temperature deformation process, the fluidity in the grain was better and the internal grain structure was more involved in the deformation, which made the deformation mode more uniform at cryogenic temperatures and led to an improvement in the plasticity of the alloy. The deformation temperature of Al–Li alloys should be lower than 178K during cryogenic temperature forming, where better mechanical properties are obtained for alloys processed at lower temperatures.

Author Contributions

Writing—original draft, J.Z.; conceptualization, J.Z. and C.Z.; methodology, J.Z. and W.T.; software, C.Z. and C.W.; validation, C.Z. and C.W.; formal analysis, J.Z. and W.T.; investigation, W.T. and C.Z.; resources, Y.Y.; data curation, C.W.; writing—original draft preparation, J.Z.; writing—review and editing, C.W.; visualization, W.T. and C.W.; supervision, Y.Y.; project administration, Y.Y.; funding acquisition, Y.Y. All authors have read and agreed to the published version of the manuscript.

Funding

This research was funded by National Key R&D Program of China, grant number 2019YFA0708802.

Institutional Review Board Statement

Not applicable.

Informed Consent Statement

Not applicable.

Data Availability Statement

Not applicable.

Conflicts of Interest

The authors declare no conflict of interest.

References

  1. El-Aty, A.A.; Xu, Y.; Guo, X.; Zhang, S.H.; Ma, Y.; Chen, D. Strengthening mechanisms, deformation behavior, and anisotropic mechanical properties of Al-Li alloys: A review. J. Adv. Res. 2018, 10, 49–67. [Google Scholar] [CrossRef] [PubMed]
  2. Zhang, X.S.; Chen, Y.J.; Hu, J.L. Recent advances in the development of aerospace materials. Prog. Aerosp. Sci. 2018, 97, 22–34. [Google Scholar] [CrossRef]
  3. Goebel, J.; Ghidini, T.; Graham, A.J. Stress-corrosion cracking characterisation of the advanced aerospace Al–Li 2099-T86 alloy. Mater. Sci. Eng. A 2016, 673, 16–23. [Google Scholar] [CrossRef]
  4. Rioja, R.J.; Liu, J. The Evolution of Al-Li Base Products for Aerospace and Space Applications. Metall. Mater. Trans. A 2012, 43, 3325–3337. [Google Scholar] [CrossRef]
  5. Pu, Q.Q.; Jia, Z.H.; Kong, Y.P.; Yang, Q.B.; Zhang, Z.Q.; Fan, X.; Zhang, H.; Lin, L.; Liu, Q. Microstructure and mechanical properties of 2195 alloys prepared by traditional casting and spray forming. Mater. Sci. Eng. A 2020, 784, 139337. [Google Scholar] [CrossRef]
  6. Sonar, T.; Lomte, S.; Gogte, C. Cryogenic treatment of metal–a review. Mater. Today Proc. 2018, 5, 25219–25228. [Google Scholar] [CrossRef]
  7. Schneider, R.; Heine, B.; Grant, R.J. Mechanical behaviour of commercial aluminium wrought alloys at low temperatures. In Light Metal Alloys Applications; InTech: Rijeka, Croatia, 2014; pp. 61–77. [Google Scholar]
  8. Chandra Sekhar, K.; Narayanasamy, R. Mechanical properties and formability of cryorolled commercial pure aluminium at various reduction. Mater. Today Proc. 2018, 5, 6888–6896. [Google Scholar] [CrossRef]
  9. Cheng, W.J.; Liu, W.; Fan, X.B.; Yuan, S.J. Cooperative enhancements in ductility and strain hardening of a solution-treated Al–Cu–Mn alloy at cryogenic temperatures. Mater. Sci. Eng. A 2020, 790, 139707. [Google Scholar] [CrossRef]
  10. Cheng, W.J.; Liu, W.; Yuan, S.J. Deformation behavior of Al–Cu–Mn alloy sheets under biaxial stress at cryogenic temperatures. Mater. Sci. Eng. A 2019, 759, 357–367. [Google Scholar] [CrossRef]
  11. Dong, F.; Yi, Y.P.; Huang, C.; Huang, S.Q. Influence of cryogenic deformation on second-phase particles, grain structure, and mechanical properties of Al–Cu–Mn alloy. J. Alloys Compd. 2020, 827, 154300. [Google Scholar] [CrossRef]
  12. Kumar, V.; Kumar, D. Investigation of tensile behaviour of cryorolled and room temperature rolled 6082 Al alloy. Mater. Sci. Eng. A 2017, 691, 211–217. [Google Scholar] [CrossRef]
  13. Vigneshwaran, S.; Sivaprasad, K.; Narayanasamy, R.; Venkateswarlu, K. Microstructure and mechanical properties of Al–3Mg–0.25 Sc alloy sheets produced by cryorolling. Mater. Sci. Eng. A 2019, 740, 49–62. [Google Scholar] [CrossRef]
  14. Deng, Y.J.; Huang, G.J.; Cao, L.F.; Wu, X.D.; Huang, L.; Xia, M.Y.; Liu, Q. Improvement of strength and ductility of Al-Cu-Li alloy through cryogenic rolling followed by aging. Trans. Nonferr. Metal. Soc. 2017, 27, 1920–1927. [Google Scholar] [CrossRef]
  15. Shi, J.T.; Hou, L.G.; Zuo, J.R.; Zhuang, L.Z.; Zhang, J.S. Cryogenic rolling-enhanced mechanical properties and microstructural evolution of 5052 Al-Mg alloy. Mater. Sci. Eng. A 2017, 701, 274–284. [Google Scholar] [CrossRef]
  16. Xu, Z.B.; Roven, H.J.; Jia, Z.H. Effects of cryogenic temperature and pre-stretching on mechanical properties and deformation characteristics of a peak-aged AA6082 extrusion. Mater. Sci. Eng. A 2017, 679, 379–390. [Google Scholar] [CrossRef]
  17. Xu, Z.B.; Roven, H.J.; Jia, Z.H. Mechanical properties and surface characteristics of an AA6060 alloy strained in tension at cryogenic and room temperature. Mater. Sci. Eng. A 2015, 648, 350–358. [Google Scholar] [CrossRef]
  18. Park, D.Y.; Niewczas, M. Plastic deformation of Al and AA5754 between 4.2K and 295K. Mater. Sci. Eng. A 2008, 491, 88–102. [Google Scholar] [CrossRef]
  19. Zhemchuzhnikova, D.; Mogucheva, A.; Kaibyshev, R. Mechanical properties and fracture behavior of an Al–Mg–Sc–Zr alloy at ambient and subzero temperatures. Mater. Sci. Eng. A 2013, 565, 132–141. [Google Scholar] [CrossRef]
  20. Hu, Q.; Zhang, Q.C.; Fu, S.H.; Gong, M. Influence of precipitation on the Portevin-Le Chatelier effect in Al-Mg alloys. Theor. Appl. Mech. Lett. 2011, 1, 011007. [Google Scholar] [CrossRef] [Green Version]
  21. Kim, Y.M.; Kim, S.K.; Lim, Y.J.; Kim, N.J. Effect of microstructure on the yield ratio and low temperature toughness of linepipe steels. ISIJ Int. 2002, 42, 1571–1577. [Google Scholar] [CrossRef]
  22. Kleemola, H.J.; Nieminen, M.A. On the strain-hardening parameters of metals. Metall. Trans. 1974, 5, 1863–1866. [Google Scholar] [CrossRef]
  23. Messerschmidt, U. Dislocation Dynamics During Plastic Deformation; Springer: Berlin/Heidelberg, Germany, 2010. [Google Scholar]
  24. Yu, T.F.; Li, B.C.; Medjahed, A.; Hou, L.G.; Wu, R.Z.; Zhang, J.H.; Sun, J.F.; Zhang, M.L. P Impeding effect of the Al3(Er,Zr,Li) particles on planar slip and intergranular fracture mechanism of Al-3Li-1Cu-0.1Zr-X alloys. Mater. Charact. 2019, 147, 146–154. [Google Scholar] [CrossRef]
  25. Konijnenberg, P.J.; Zaefferer, S.; Raabe, D. Assessment of geometrically necessary dislocation levels derived by 3D EBSD. Acta Mater. 2015, 99, 402–414. [Google Scholar] [CrossRef]
  26. Li, L.X.; Wang, G.; Liu, J.; Yao, Z.Q. Flow softening behavior and microstructure evolution of Al–5Zn–2Mg aluminum alloy during dynamic recovery. Trans. Nonferr. Metal. Soc. 2014, 24, 42–48. [Google Scholar] [CrossRef]
  27. Téliz, E.; Abboud, M.; Faccio, R.; Esteves, M.; Zinola, F.; Díaz, V. Hydrogen storage in AB2 hydride alloys: Diffusion processes analysis. J. Electroanal. Chem. 2020, 879, 114781. [Google Scholar] [CrossRef]
Figure 1. The initial microstructures of 2195 alloy before deformation: (a,b) O-state and W-state STEM images, respectively; (c,d) O-state and W-state EBSD maps, respectively.
Metals 11 01406 g001
Figure 2. Schematic illustration of the tensile specimen sampling position and the dimensions of the tensile test specimen (mm).
Metals 11 01406 g002
Figure 3. Engineering stress–strain curves of 2195 alloy at 298 K to 77 K: (a) O-state, and (b) W-state.
Metals 11 01406 g003
Figure 4. Yield strength, tensile strength, and yield ratio of 2195 alloy at 298 K to 77 K: (a) O-state, (b) W-state.
Metals 11 01406 g004
Figure 5. Strain hardening exponent of 2195 alloy at 298 K to 77 K: (a) O-state, (b) W-state.
Metals 11 01406 g005
Figure 6. Fracture surface morphologies of the O-state alloy under uniaxial tension at (a) 298 K, (b) 218 K, (c) 138 K, and (d) 77 K.
Metals 11 01406 g006
Figure 7. Fracture surface morphologies of the W-state alloy under uniaxial tension at (a) 298 K, (b) 218 K, (c) 138 K, and (d) 77 K.
Metals 11 01406 g007
Figure 8. OM images of O-state and W-state alloys tensioned to a fixed strain at 298 K and 77 K: (a) O-state, 298 K; (b) O-state, 77 K; (c) W-state, 298 K; (d) W-state, 77 K.
Metals 11 01406 g008
Figure 9. Altitude nephograms of the O-state and W-state alloys tensioned to a strain of 0.12 at 298 K and 77 K: (a) O-state, 298 K; (b) O-state, 77 K; (c) W-state, 298 K; (d) W-state, 77 K.
Metals 11 01406 g009
Figure 10. EBSD maps of the O-state alloy after a tensile strain of 0.12 at (a) 298 K, (b) 218 K, (c) 138 K, and (d) 77 K.
Metals 11 01406 g010
Figure 11. EBSD maps of the W-state alloy after a tensile strain of 0.12 at (a) 298 K, (b) 218 K, (c) 138 K, and (d) 77 K.
Metals 11 01406 g011
Figure 12. KAM diagrams of the O-state and W-state specimens after a strain of 0.12 at 298 K and 77 K: (a) O-state, 298 K; (b) O-state, 77 K; (c) W-state, 298 K; (d) W-state, 77 K.
Metals 11 01406 g012
Figure 13. Deformation temperature-engineering stress and dislocation density curves of (a) the O-state alloy, (b) the W-state alloy.
Metals 11 01406 g013
Figure 14. TEM bright-field photographs of the O-state 2195 alloys after a tensile strain of 0.12 at (a) 298 K, and (b) 77 K.
Metals 11 01406 g014
Figure 15. TEM bright-field photographs of the W-state 2195 alloys after a tensile strain of 0.12 at (a) 298 K, and (b) 77 K.
Metals 11 01406 g015
Figure 16. TEM bright-field image of the deformed W-state alloy at 77 K.
Metals 11 01406 g016
Table 1. Surface roughness of the O-state and W-state alloys tensioned to a strain of 0.12.
Deformation Temperature/KSurface Roughness/μm
O-StateW-State
2980.1070.623
770.1400.751
Publisher’s Note: MDPI stays neutral with regard to jurisdictional claims in published maps and institutional affiliations.

