
A Comparative Study of Fatigue Energy Dissipation of Additive Manufactured and Cast AlSi10Mg Alloy

 , and
, and
Abstract
:1. Introduction
2. Materials and Experiments
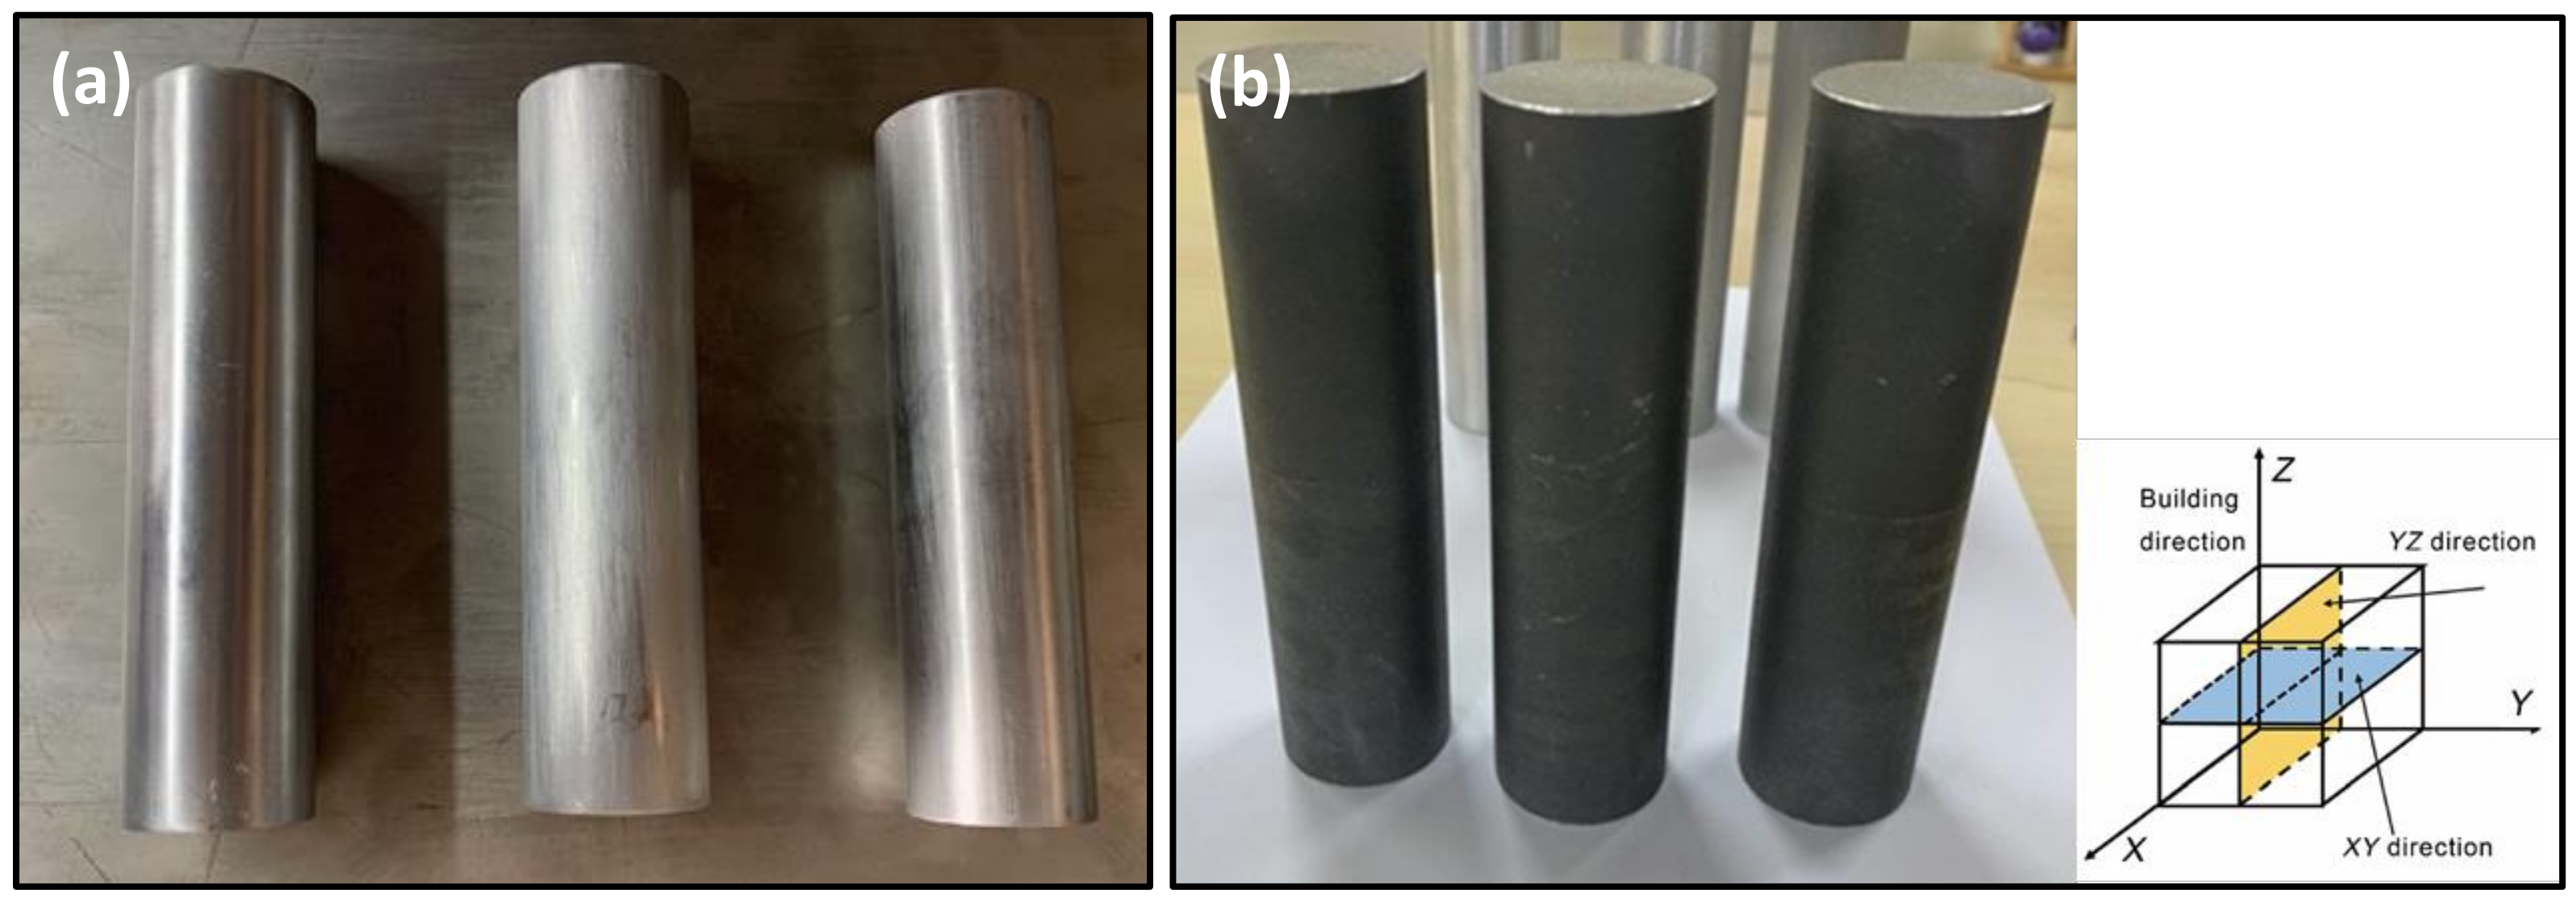
2.1. Raw Materials
2.2. LPBF Process
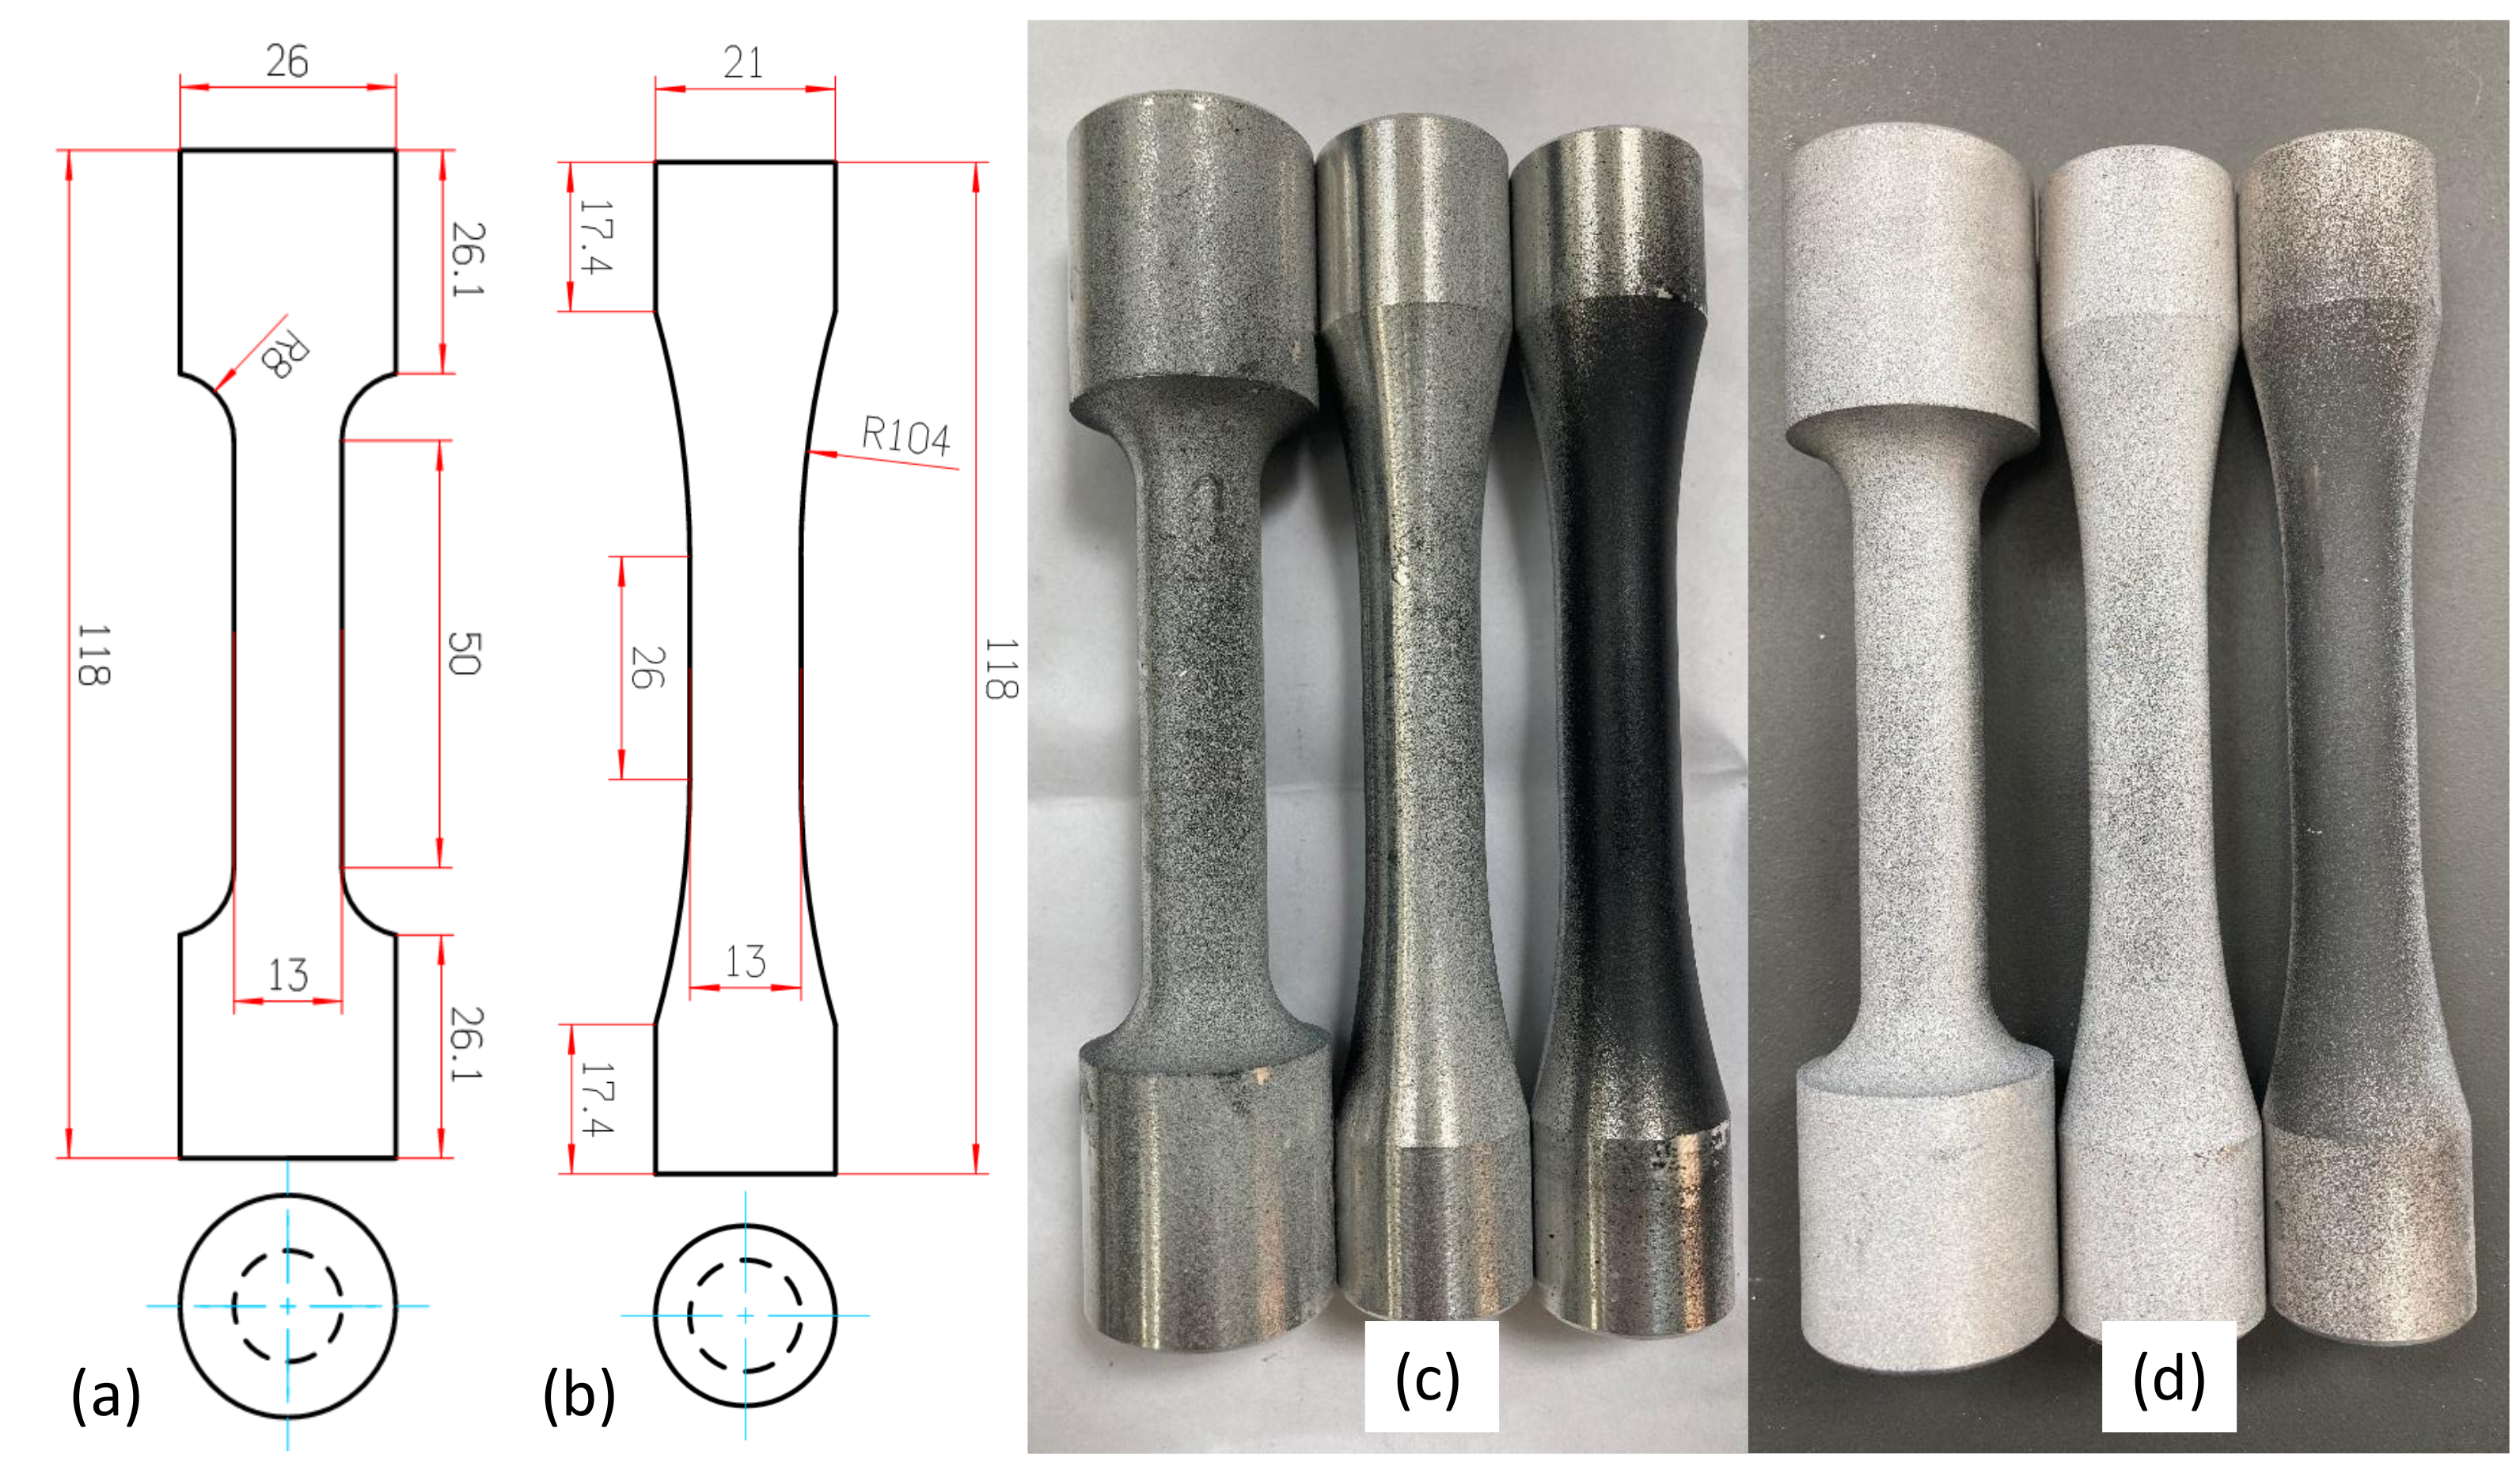
2.3. Specimen Preparation
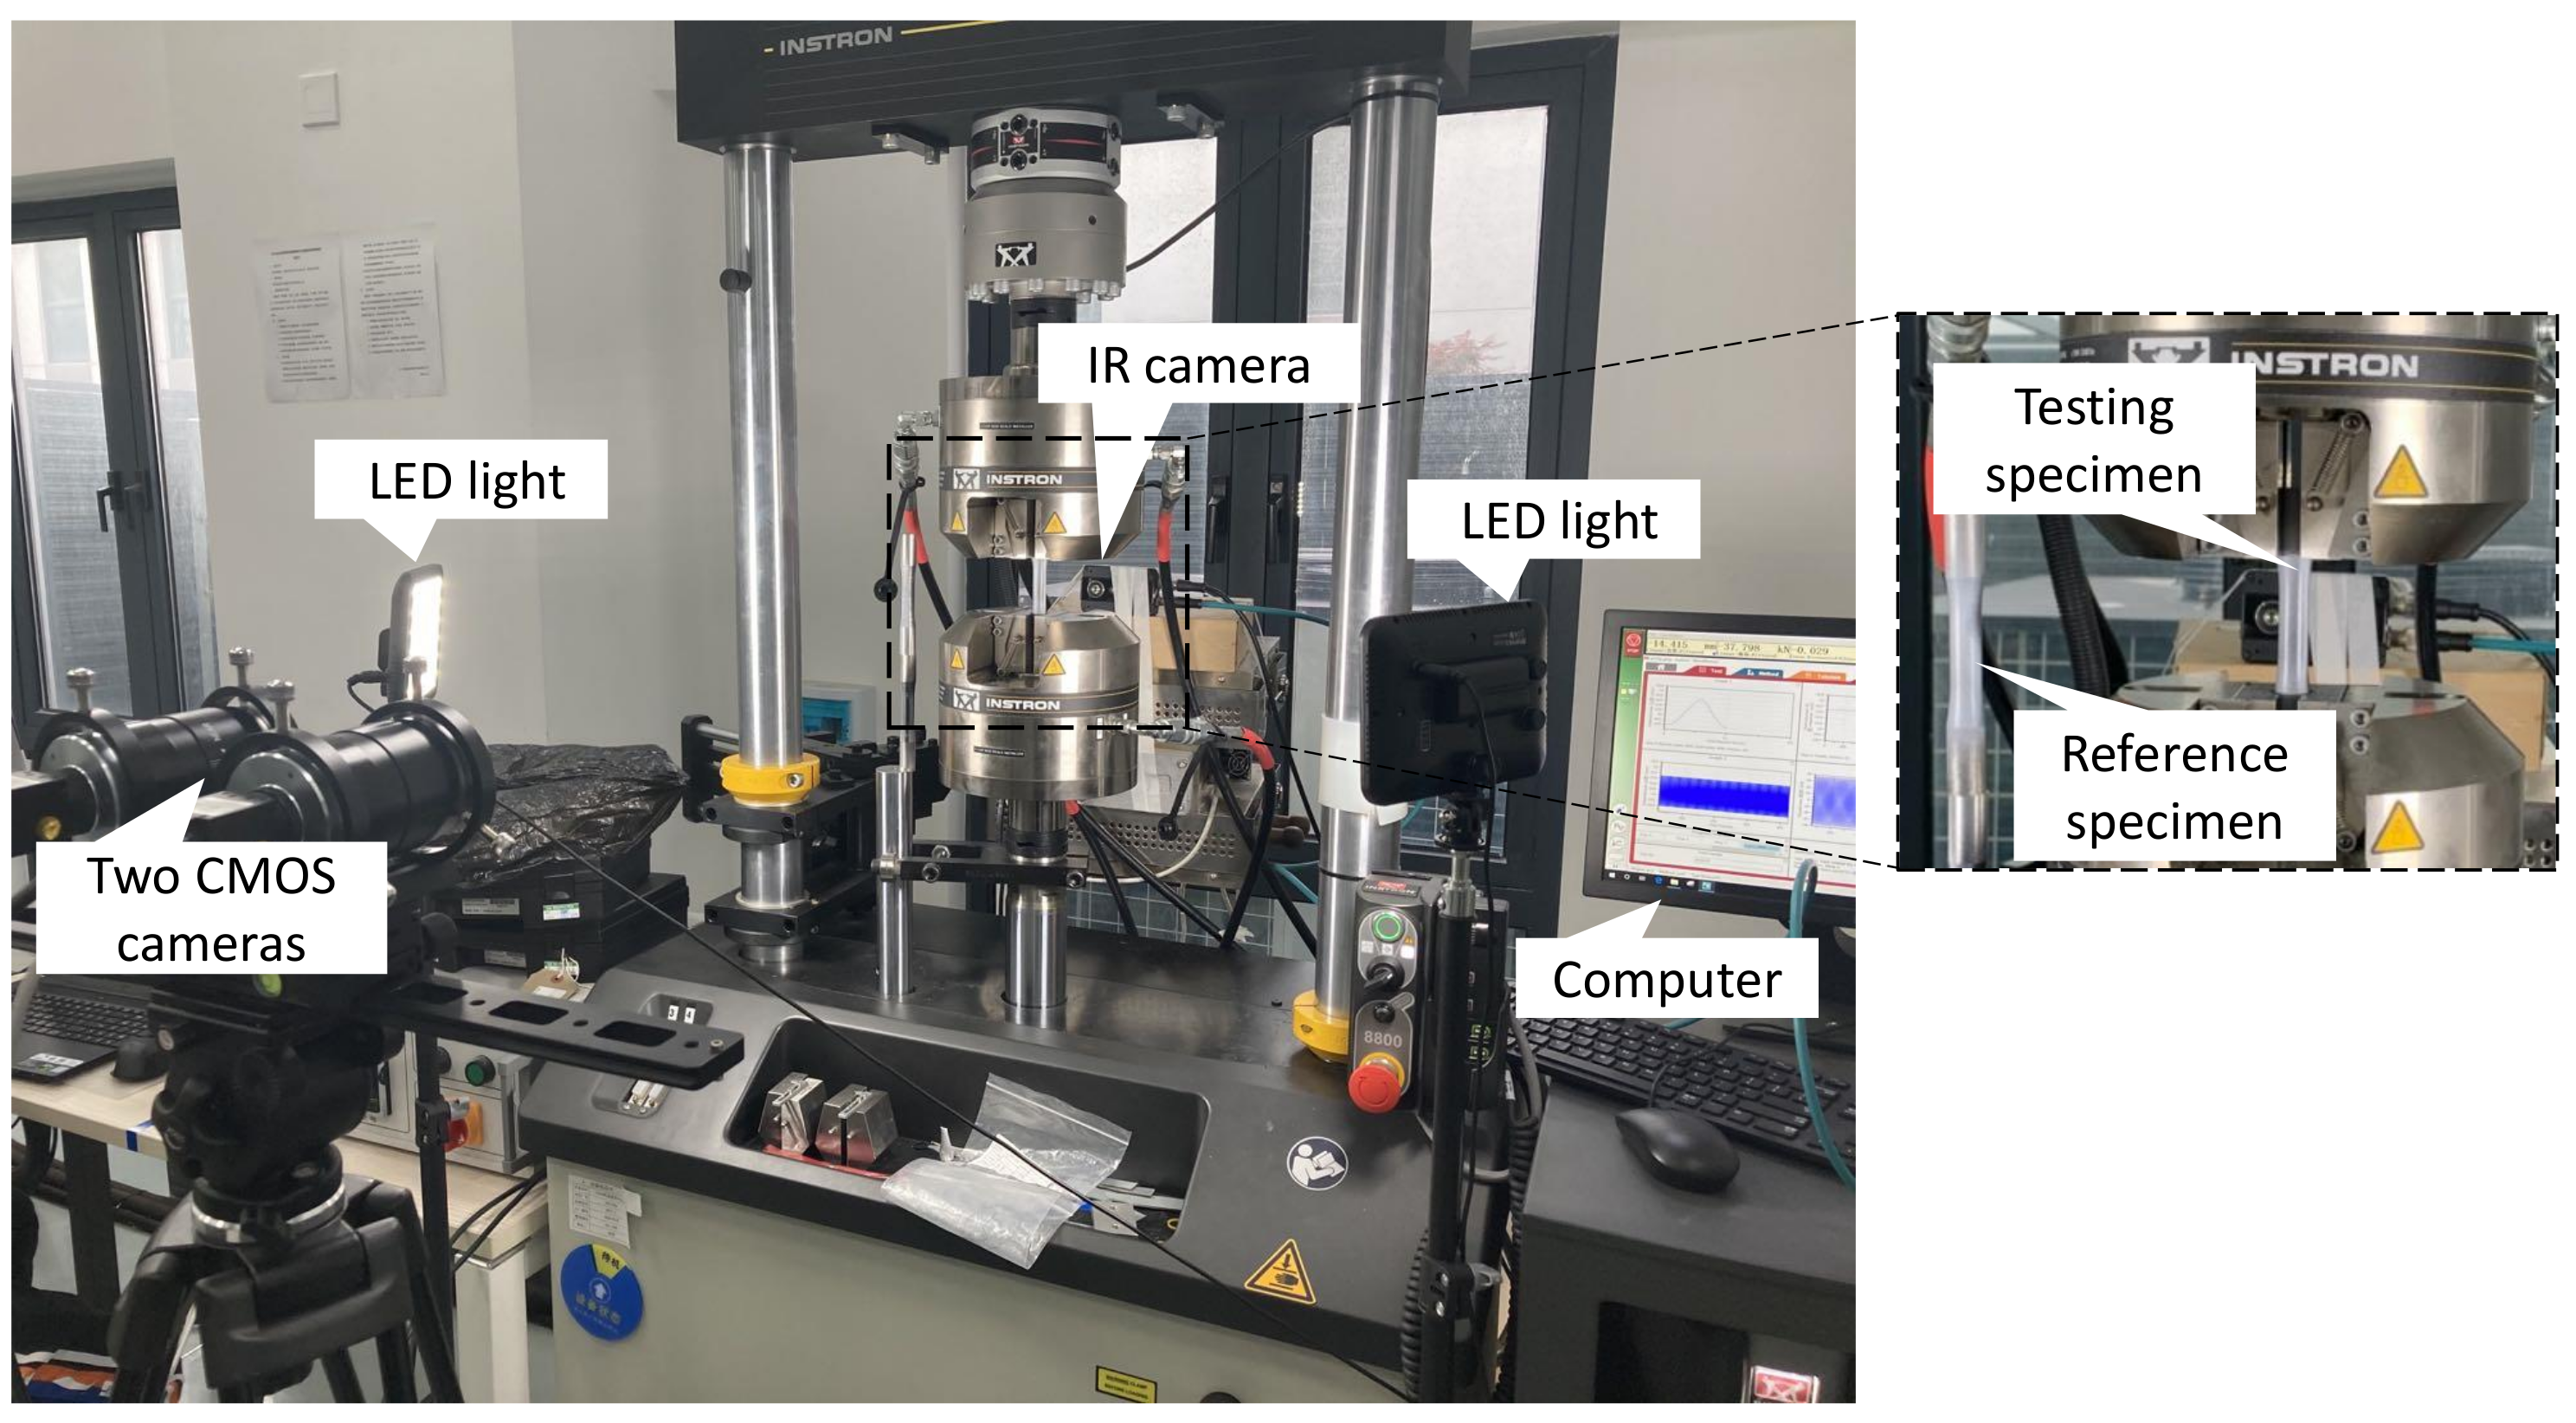
2.4. Experimental Setup
3. Fatigue Energy Dissipation Calculation
4. Results and Discussion
5. Conclusions
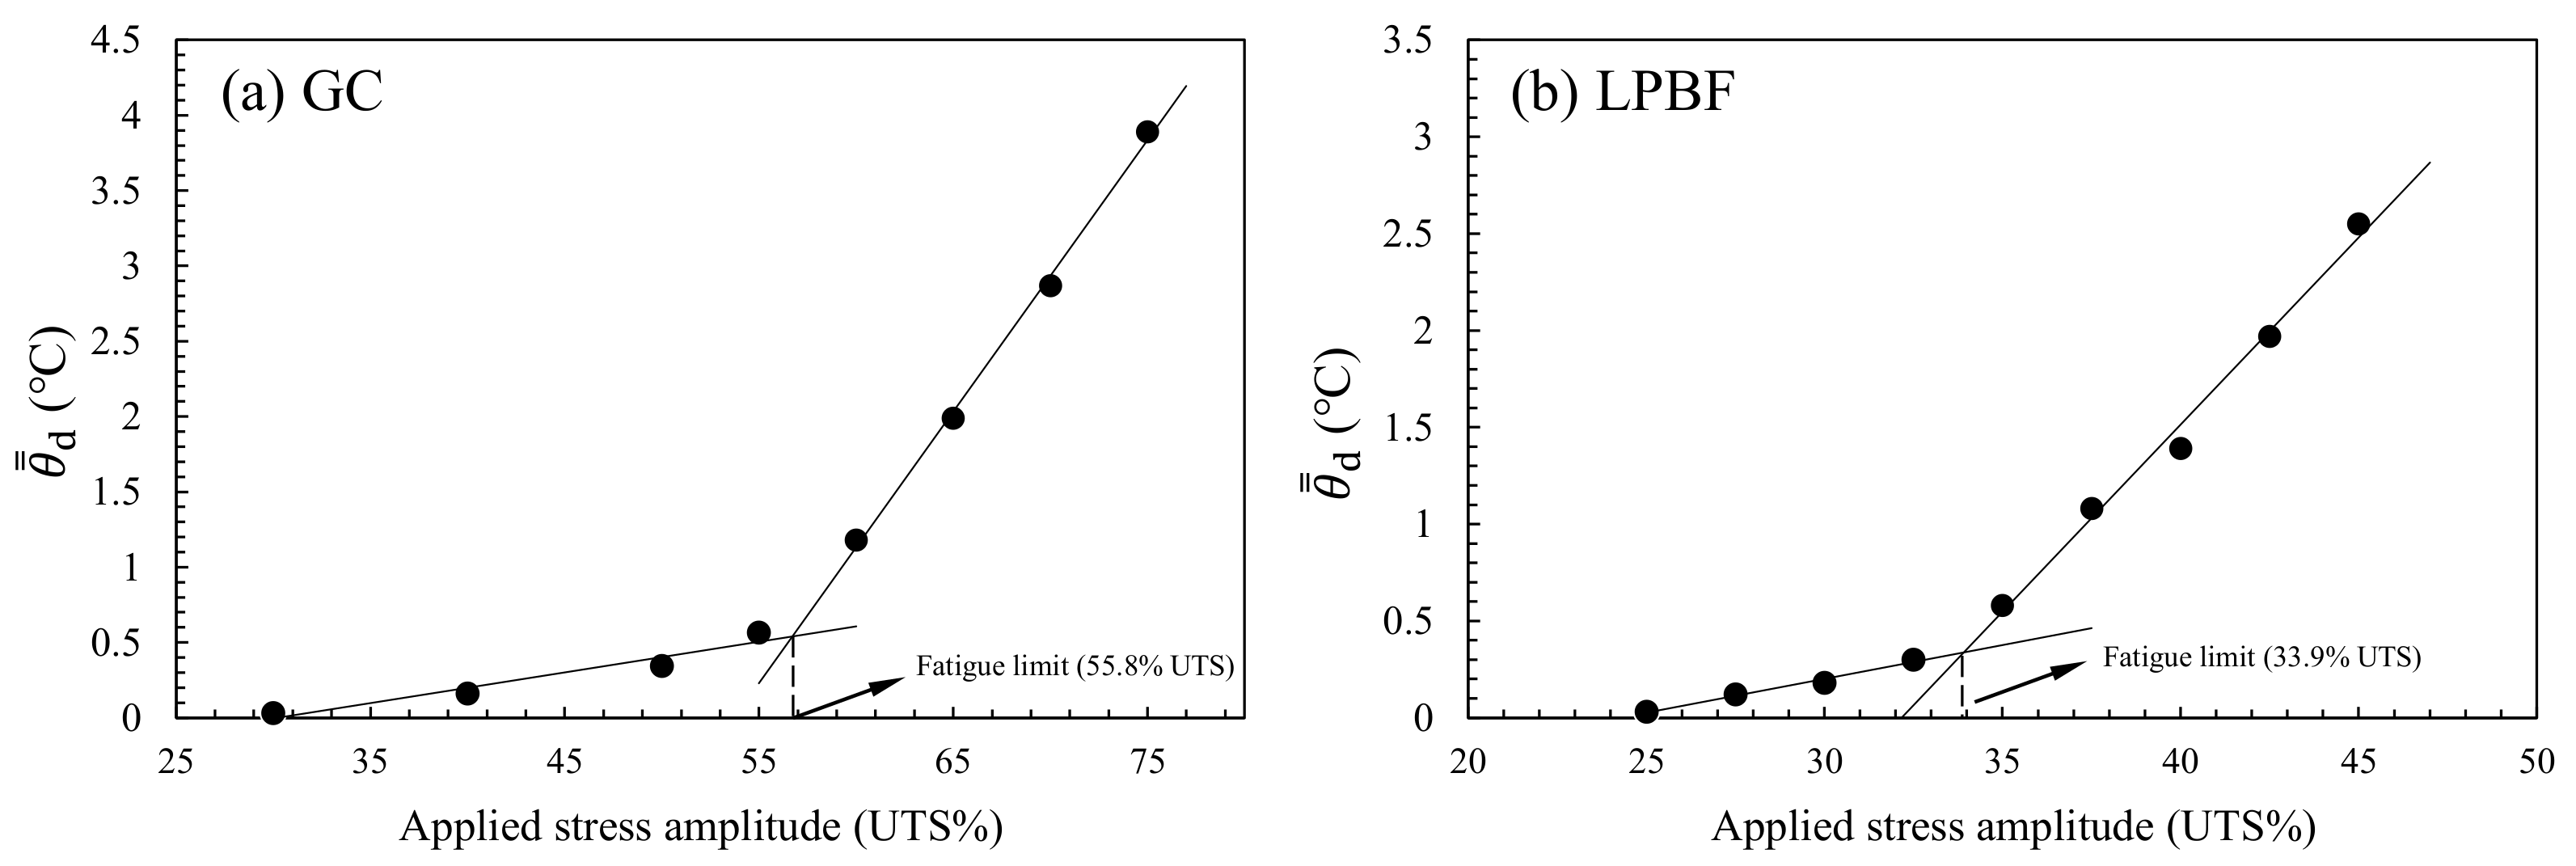
- 1.
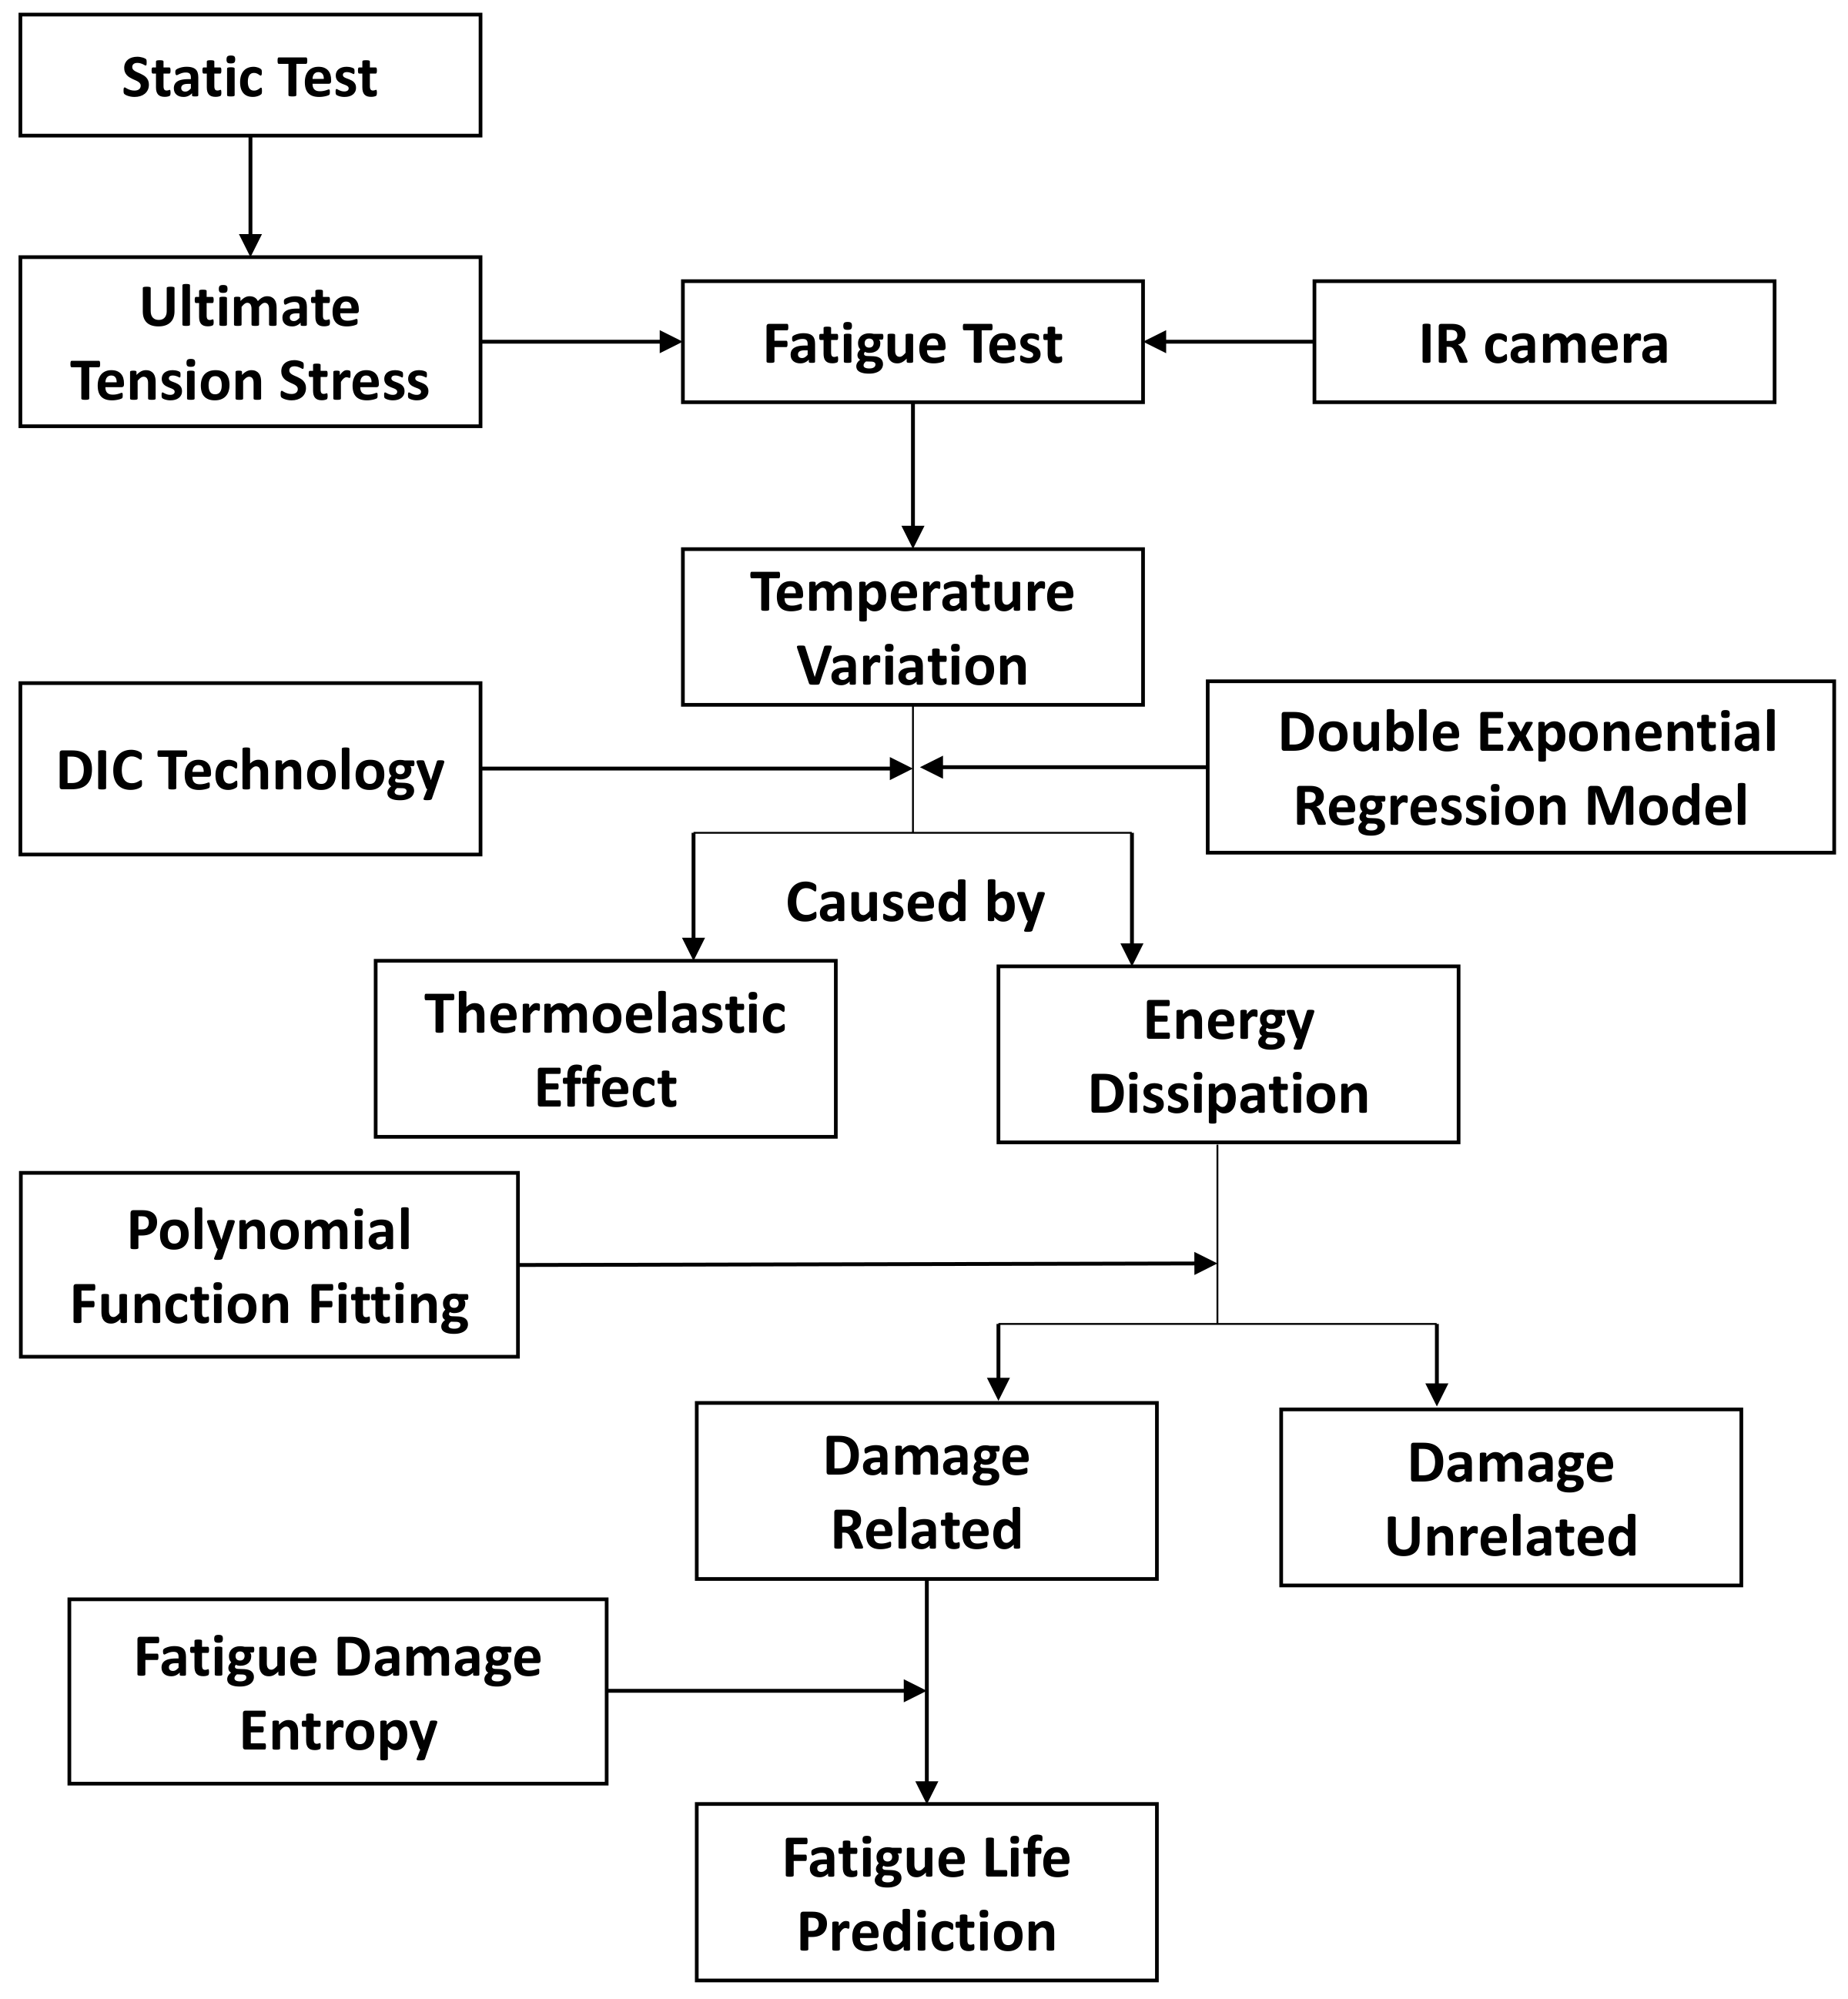
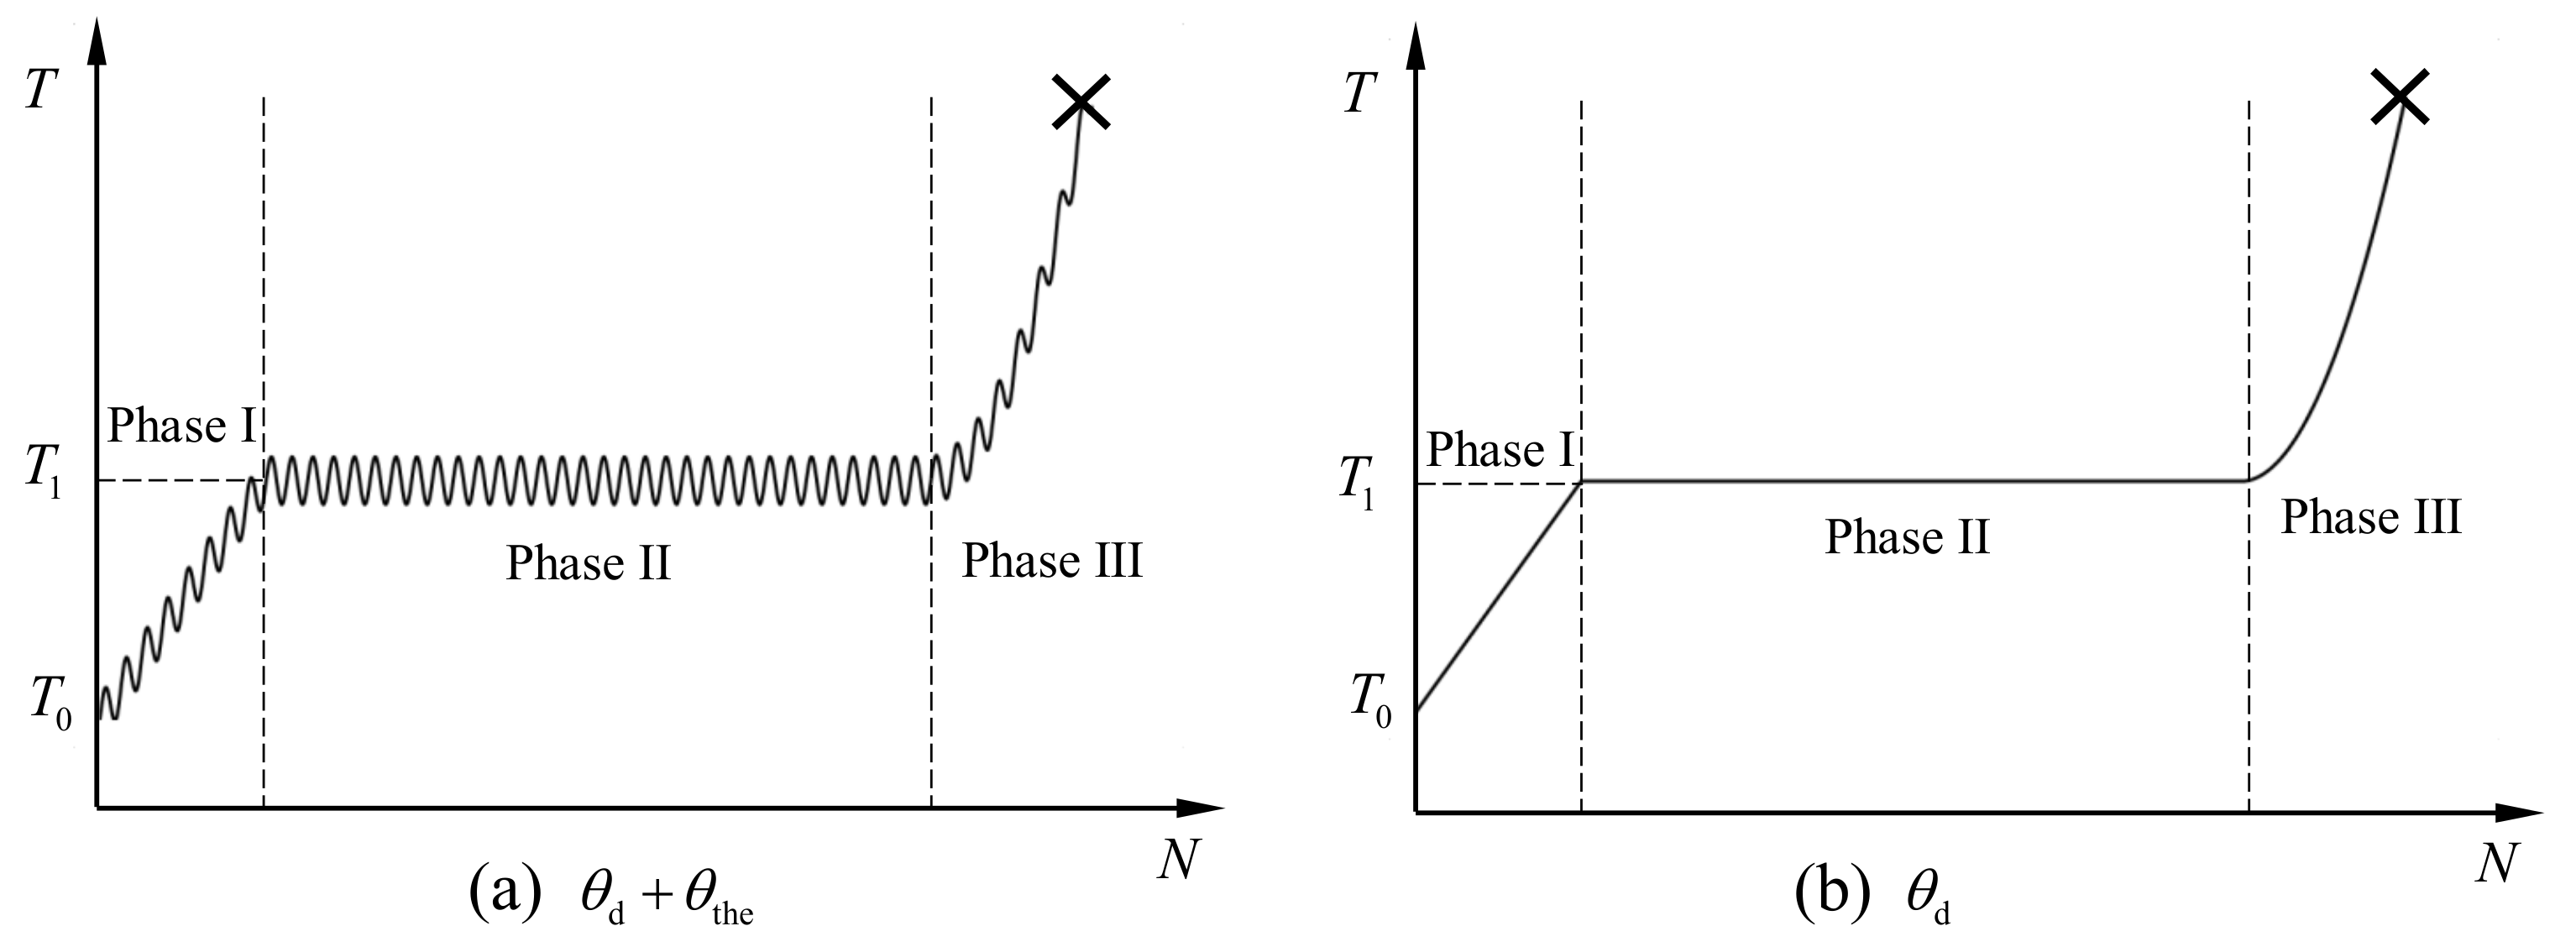
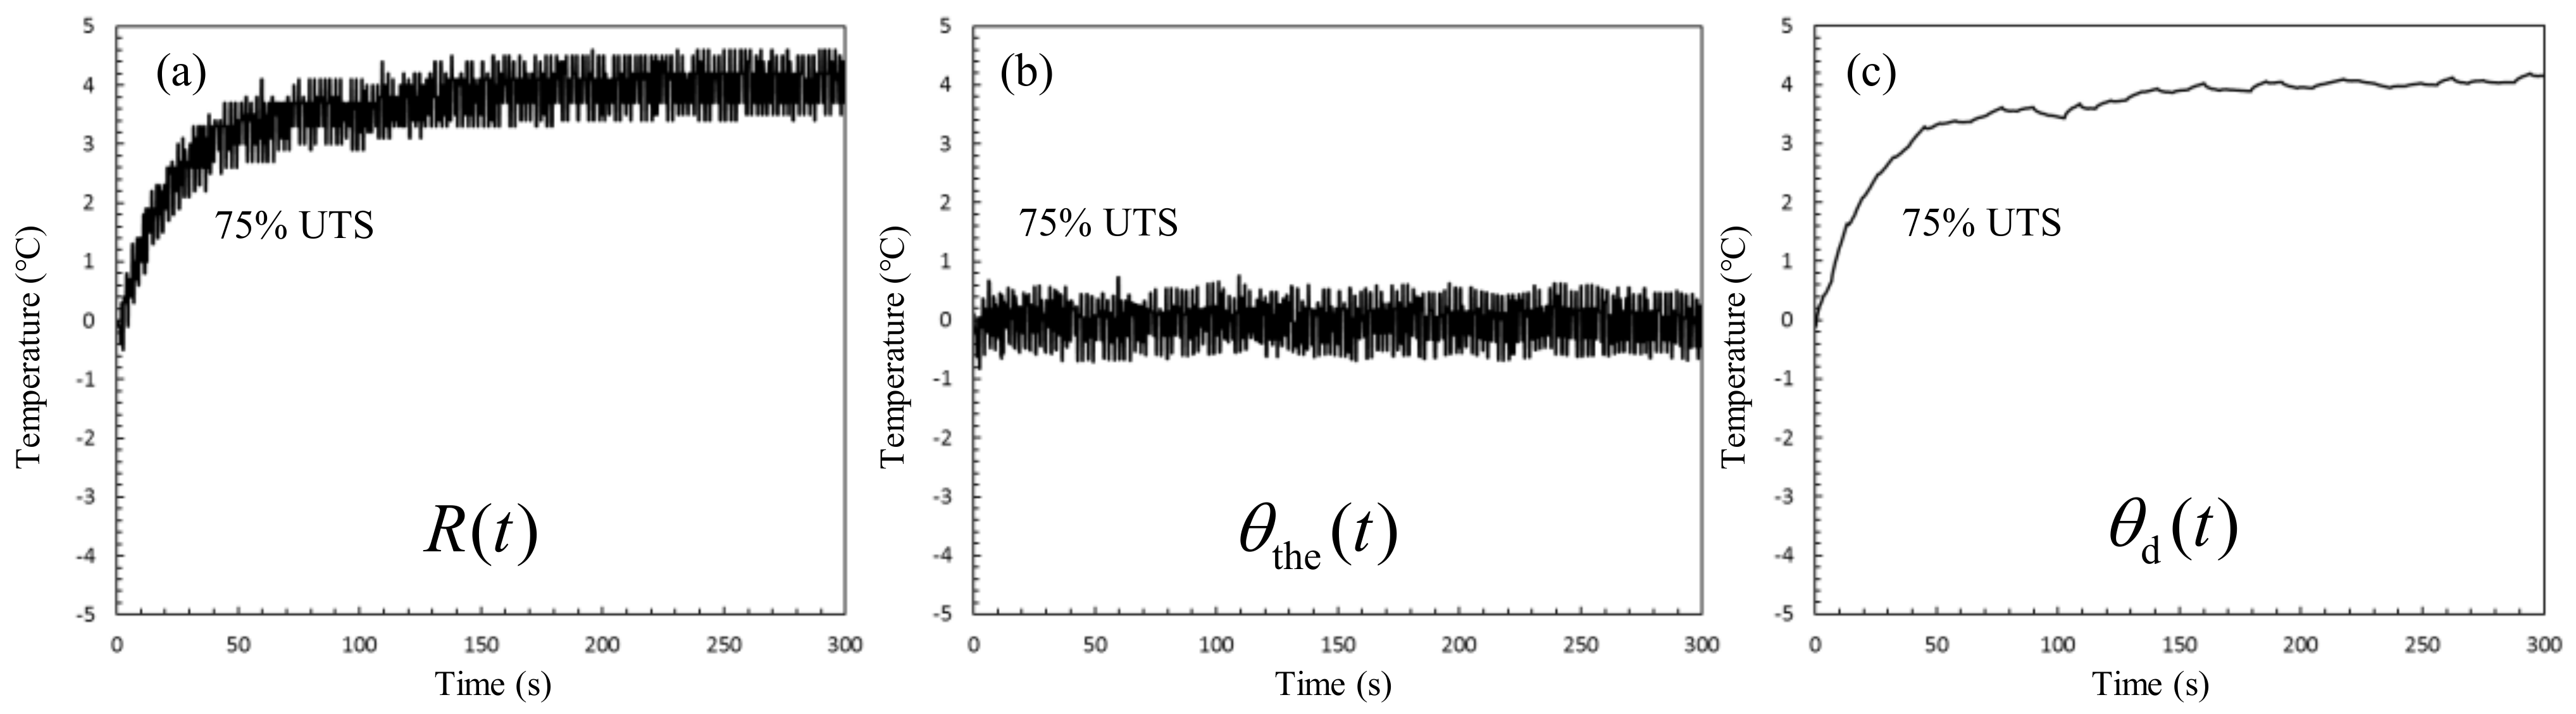
- The signal of surface temperature variation corresponding to the thermoelastic coupling effect and the energy dissipation effect is decoupled. The temperature increase induced by energy dissipation effect is used to the predict fatigue limit of GC and LPBF AlSi10Mg alloys by two linear fitting methods. The fatigue limits of GC and LPBF AlSi10Mg alloys are determined as 55.8% UTS and 33.9% UTS, respectively.
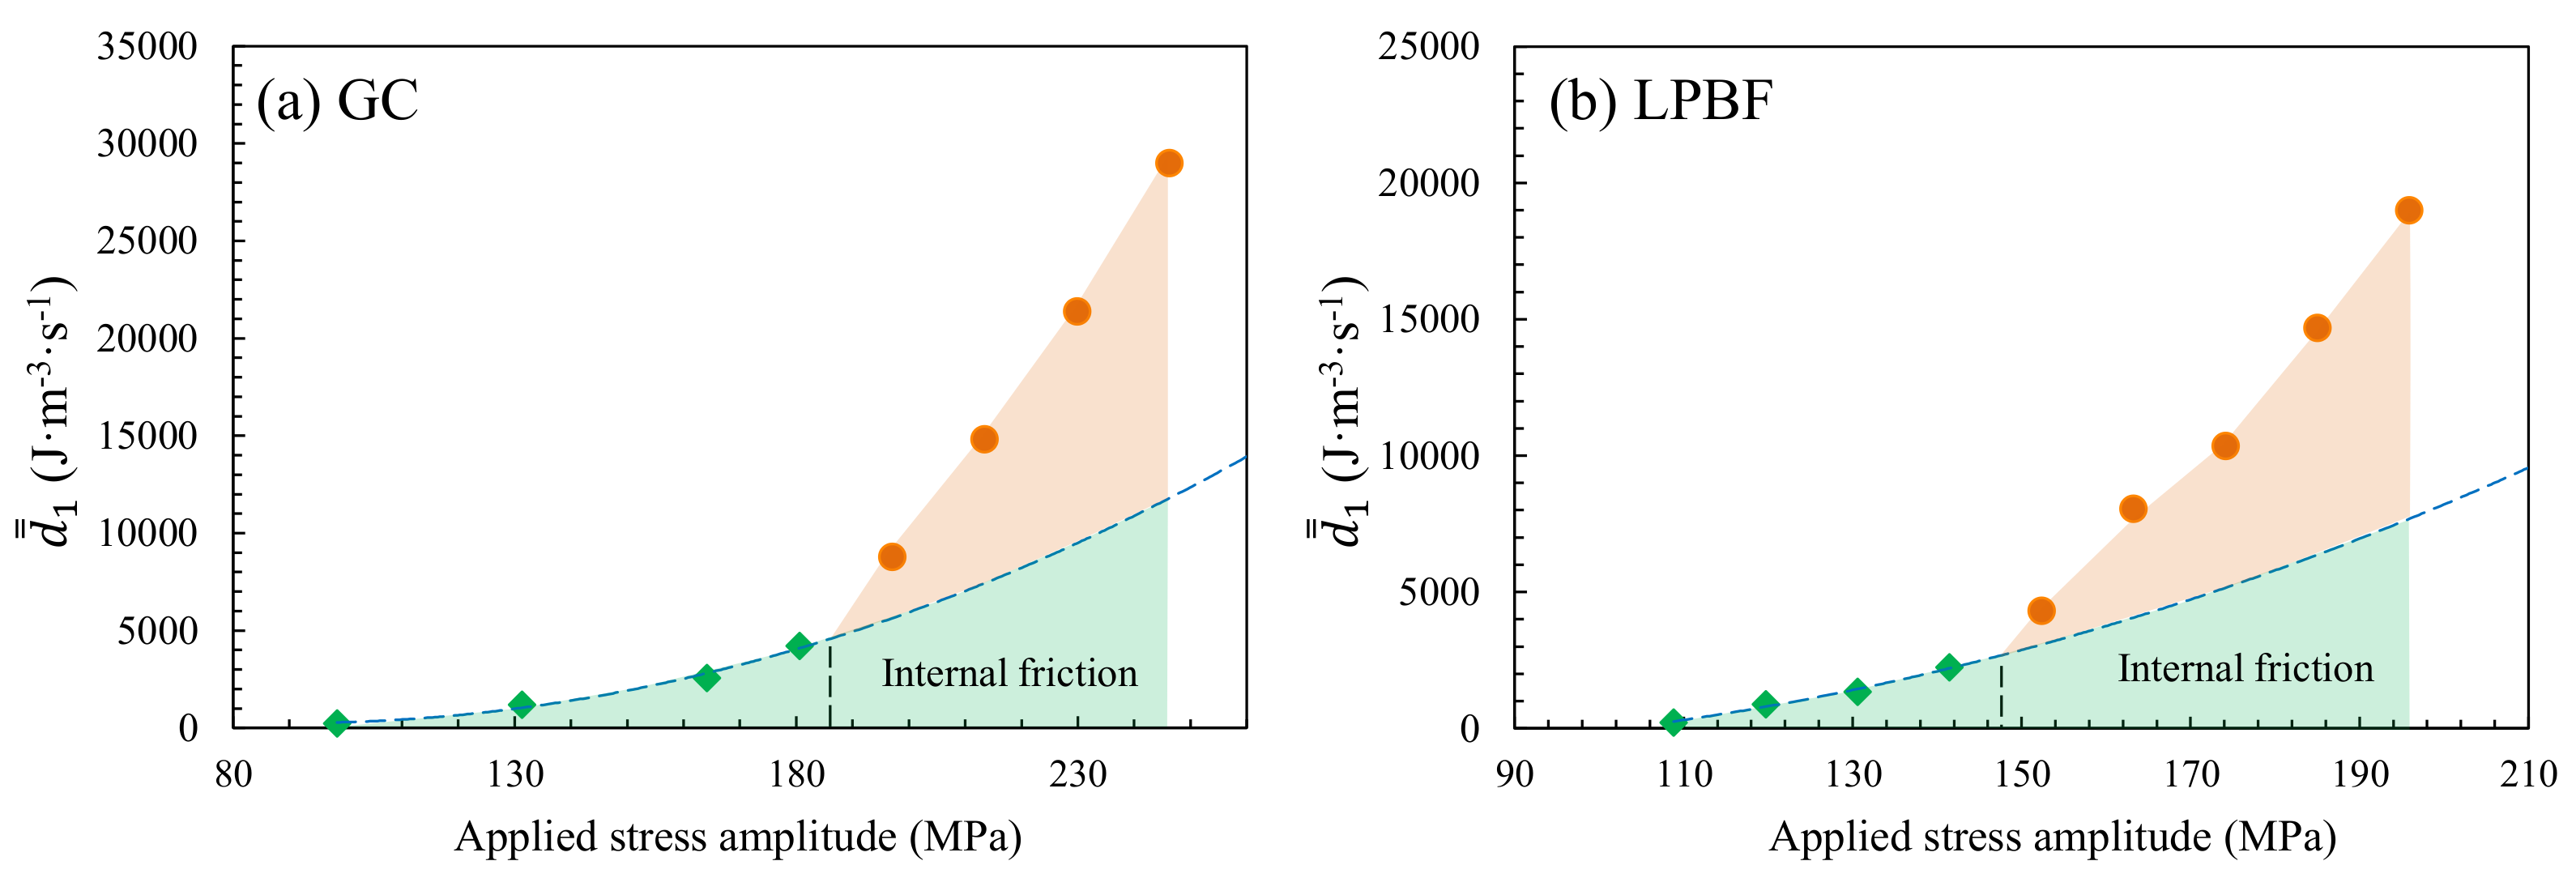
- 2.
- The energy dissipation rates of GC and LPBF AlSi10Mg alloys are obtained by solving a one-dimensional thermal diffusion problem. The amount of energy dissipation caused by internal friction and fatigue damage is separated using a polynomial function. The energy dissipation related to fatigue damage for LPBF specimens is observed to be higher than that of GC specimens.
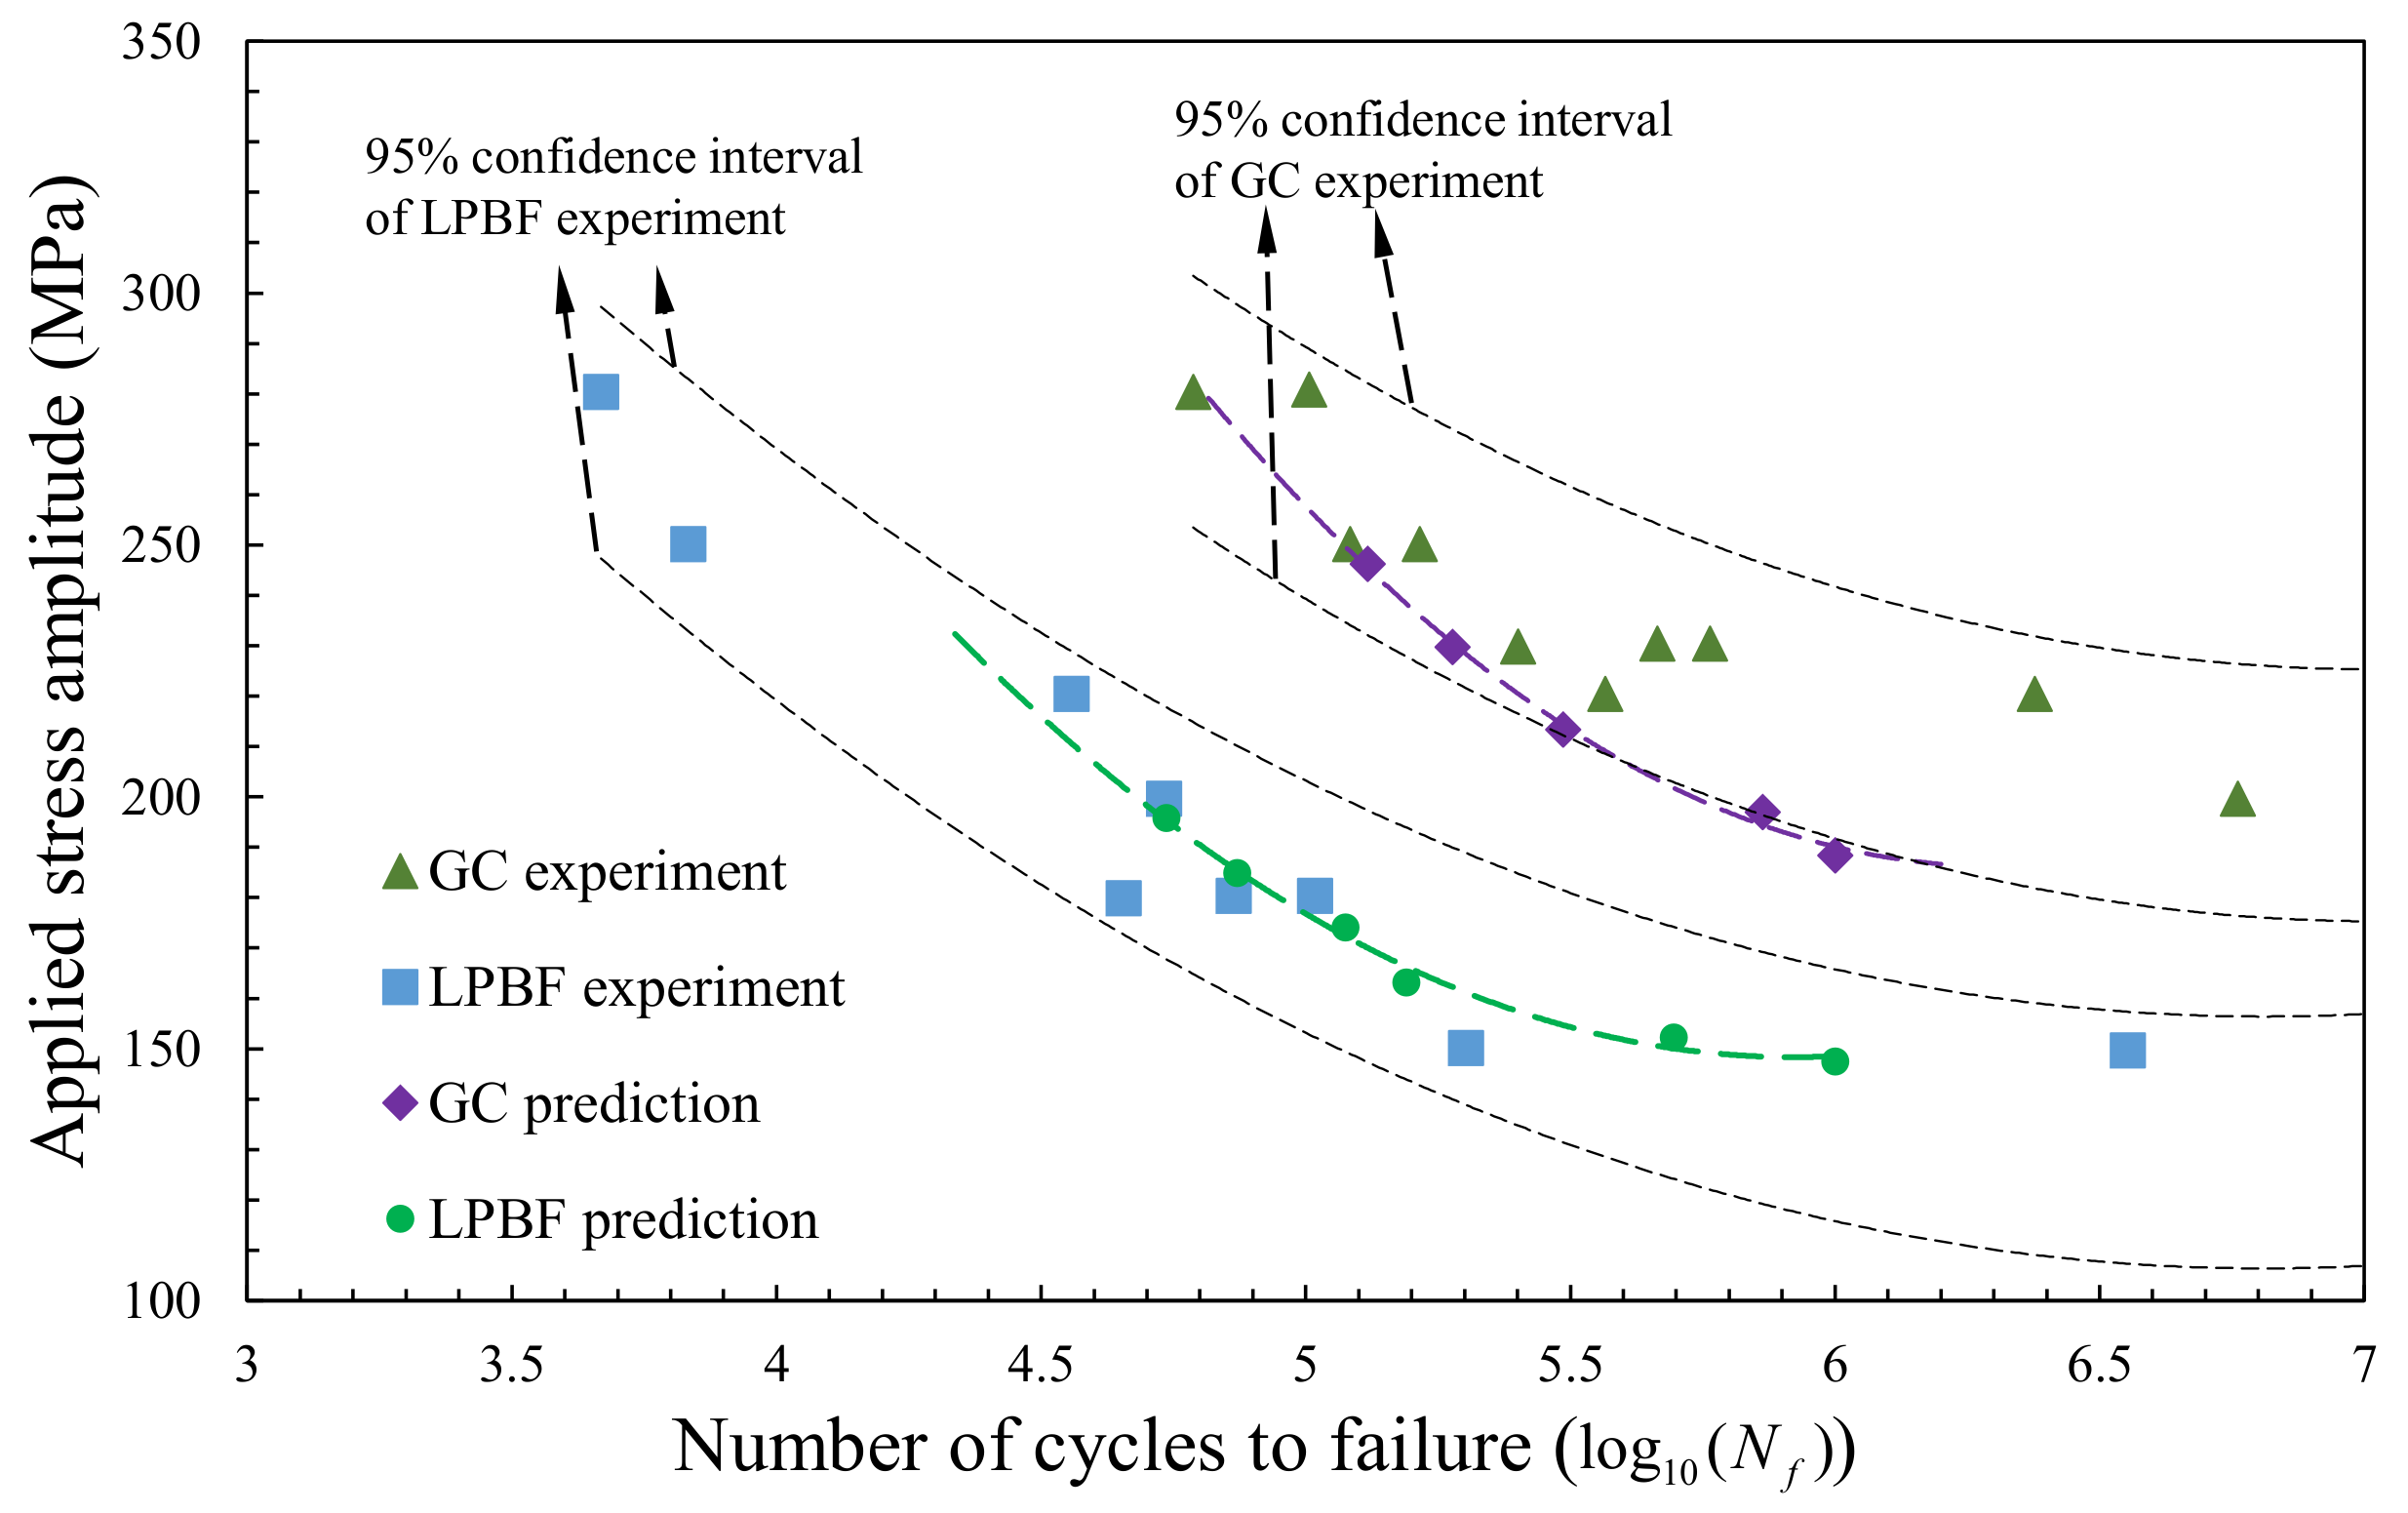
- 3.
- The concept of fatigue damage entropy is employed to predict the fatigue life of both GC and LPBF AlSi10Mg alloys based on the obtained energy dissipation data. The prediction has a good agreement with the experimental results. The whole prediction process takes less than 48 h, which is significantly less than traditional fatigue testing.
Author Contributions
Funding
Institutional Review Board Statement
Informed Consent Statement
Data Availability Statement
Conflicts of Interest
References
- Bhuvanesh Kumar, M.; Sathiya, P. Methods and materials for additive manufacturing: A critical review on advancements and challenges. Thin-Walled Struct. 2021, 159, 107228. [Google Scholar] [CrossRef]
- Rasiya, G.; Shukla, A.; Saran, K. Additive Manufacturing—A Review. Mater. Today Proc. 2021. [Google Scholar] [CrossRef]
- Roth, C.C.; Tancogne-Dejean, T.; Mohr, D. Plasticity and fracture of cast and SLM AlSi10Mg: High-throughput testing and modeling. Addit. Manuf. 2021, 43, 101998. [Google Scholar] [CrossRef]
- Yan, Q.; Song, B.; Shi, Y. Comparative study of performance comparison of AlSi10Mg alloy prepared by selective laser melting and casting. J. Mater. Sci. Technol. 2020, 41, 199–208. [Google Scholar] [CrossRef]
- Shakil, S.; Hadadzadeh, A.; Shalchi Amirkhiz, B.; Pirgazi, H.; Mohammadi, M.; Haghshenas, M. Additive manufactured versus cast AlSi10Mg alloy: Microstructure and micromechanics. Results Mater. 2021, 10, 100178. [Google Scholar] [CrossRef]
- Luong, M.P. Infrared thermographic scanning of fatigue in metals. Nucl. Eng. Des. 1995, 158, 363–376. [Google Scholar] [CrossRef] [Green Version]
- La Rosa, G.; Lo Savio, F.; Giudice, F.; Clienti, C.; Marino Cugno Garrano, A. Energetic analysis of fatigue hysteresis by thermographic and digital image correlation methodologies. Fatigue Fract. Eng. Mater. Struct. 2020, 43, 2597–2607. [Google Scholar] [CrossRef]
- La Rosa, G.; Risitano, A. Thermographic methodology for rapid determination of the fatigue limit of materials and mechanical components. Int. J. Fatigue 2000, 22, 65–73. [Google Scholar] [CrossRef]
- Luong, M.P. Fatigue limit evaluation of metals using an infrared thermographic technique. Mech. Mater. 1998, 28, 155–163. [Google Scholar] [CrossRef]
- Fargione, G.; Geraci, A.; La Rosa, G.; Risitano, A. Rapid determination of the fatigue curve by the thermographic method. Int. J. Fatigue 2002, 24, 11–19. [Google Scholar] [CrossRef]
- Morabito, A.; Chrysochoos, A.; Dattoma, V.; Galietti, U. Analysis of heat sources accompanying the fatigue of 2024 T3 aluminium alloys. Int. J. Fatigue 2007, 29, 977–984. [Google Scholar] [CrossRef]
- Meneghetti, G.; Ricotta, M. Evaluating the heat energy dissipated in a small volume surrounding the tip of a fatigue crack. Int. J. Fatigue 2016, 92, 605–615. [Google Scholar] [CrossRef]
- Ancona, F.; De Finis, R.; Palumbo, D.; Galietti, U. Crack growth monitoring in stainless steels by means of TSA technique. Procedia Eng. 2015, 109, 89–96. [Google Scholar] [CrossRef] [Green Version]
- Munier, R.; Doudard, C.; Calloch, S.; Weber, B. Determination of high cycle fatigue properties of a wide range of steel sheet grades from self-heating measurements. Int. J. Fatigue 2014, 63, 46–61. [Google Scholar] [CrossRef]
- De Finis, R.; Palumbo, D.; Ancona, F.; Galietti, U. Fatigue limit evaluation of various martensitic stainless steels with new robust thermographic data analysis. Int. J. Fatigue 2015, 74, 88–96. [Google Scholar] [CrossRef]
- Meneghetti, G. Analysis of the fatigue strength of a stainless steel based on the energy dissipation. Int. J. Fatigue 2007, 29, 81–94. [Google Scholar] [CrossRef]
- Huang, J.; Pastor, M.L.; Garnier, C.; Gong, X. Rapid evaluation of fatigue limit on thermographic data analysis. Int. J. Fatigue 2017, 104, 293–301. [Google Scholar] [CrossRef] [Green Version]
- Huang, J.; Pastor, M.L.; Garnier, C.; Gong, X.J. A new model for fatigue life prediction based on infrared thermography and degradation process for CFRP composite laminates. Int. J. Fatigue 2019, 120, 87–95. [Google Scholar] [CrossRef] [Green Version]
- Curà, F.; Curti, G.; Sesana, R. A new iteration method for the thermographic determination of fatigue limit in steels. Int. J. Fatigue 2005, 27, 453–459. [Google Scholar] [CrossRef]
- Amiri, M.; Khonsari, M.M. Life prediction of metals undergoing fatigue load based on temperature evolution. Mater. Sci. Eng. A 2010, 527, 1555–1559. [Google Scholar] [CrossRef]
- De Finis, R.; Palumbo, D.; Ancona, F.; Galietti, U. Fatigue behaviour of stainless steels: A multi-parametric approach. In Residual Stress, Thermomechanics & Infrared Imaging, Hybrid Techniques and Inverse Problems; Springer: Berlin/Heidelberg, Germany, 2017; Volume 9, pp. 1–8. [Google Scholar]
- Pitarresi, G. Lock-in signal post-processing techniques in infra-red thermography for materials structural evaluation. Exp. Mech. 2015, 55, 667–680. [Google Scholar] [CrossRef]
- Naderi, M.; Amiri, M.; Khonsari, M.M. On the thermodynamic entropy of fatigue fracture. Proc. Math. Phys. Eng. Sci. 2010, 466, 423–438. [Google Scholar] [CrossRef] [Green Version]
- Naderi, M.; Khonsari, M.M. Thermodynamic analysis of fatigue failure in a composite laminate. Mech. Mater. 2012, 46, 113–122. [Google Scholar] [CrossRef]
- Liakat, M.; Khonsari, M.M. Rapid estimation of fatigue entropy and toughness in metals. Mater. Des. 2014, 62, 149–157. [Google Scholar] [CrossRef]
- Liakat, M.; Khonsari, M.M. On the anelasticity and fatigue fracture entropy in high-cycle metal fatigue. Mater. Des. 2015, 82, 18–27. [Google Scholar] [CrossRef]
- Mehdizadeh, M.; Khonsari, M.M. On the application of fracture fatigue entropy to variable frequency and loading amplitude. Theor. Appl. Fract. Mech. 2018, 98, 30–37. [Google Scholar] [CrossRef]
- Mahmoudi, A.; Mohammadi, B. On the evaluation of damage-entropy model in cross-ply laminated composites. Eng. Fract. Mech. 2019, 219, 106626. [Google Scholar] [CrossRef]
- Mohammadi, B.; Mahmoudi, A. Developing a new model to predict the fatigue life of cross-ply laminates using coupled CDM-entropy generation approach. Theor. Appl. Fract. Mech. 2018, 95, 18–27. [Google Scholar] [CrossRef]
- Calleja-Ochoa, A.; Gonzalez-Barrio, H.; Lacalle, N.L.d.; Martínez, S.; Albizuri, J.; Lamikiz, A. A New Approach in the Design of Microstructured Ultralight Components to Achieve Maximum Functional Performance. Materials 2021, 14, 1588. [Google Scholar] [CrossRef] [PubMed]
- Guo, Q.; Guo, X. Research on high-cycle fatigue behavior of FV520B stainless steel based on intrinsic dissipation. Mater. Des. 2016, 90, 248–255. [Google Scholar] [CrossRef]
- Maquin, F.; Pierron, F. Heat dissipation measurements in low stress cyclic loading of metallic materials: From internal friction to micro-plasticity. Mech. Mater. 2009, 41, 928–942. [Google Scholar] [CrossRef]
- Guo, Q.; Guo, X.; Fan, J.; Syed, R.; Wu, C. An energy method for rapid evaluation of high-cycle fatigue parameters based on intrinsic dissipation. Int. J. Fatigue 2015, 80, 136–144. [Google Scholar] [CrossRef]
- Boulanger, T. Calorimetric analysis of dissipative and thermoelastic effects associated with the fatigue behavior of steels. Int. J. Fatigue 2004, 26, 221–229. [Google Scholar] [CrossRef]
- Chrysochoos, A.; Louche, H. An infrared image processing to analyse the calorific effects accompanying strain localisation. Int. J. Eng. Sci. 2000, 38, 1759–1788. [Google Scholar] [CrossRef]
- Montesano, J.; Fawaz, Z.; Bougherara, H. Use of infrared thermography to investigate the fatigue behavior of a carbon fiber reinforced polymer composite. Compos. Struct. 2013, 97, 76–83. [Google Scholar] [CrossRef]
- Kordatos, E.; Dassios, K.; Aggelis, D.; Matikas, T. Rapid evaluation of the fatigue limit in composites using infrared lock-in thermography and acoustic emission. Mech. Res. Commun. 2013, 54, 14–20. [Google Scholar] [CrossRef]
- Bagheri, Z.S.; El Sawi, I.; Bougherara, H.; Zdero, R. Biomechanical fatigue analysis of an advanced new carbon fiber/flax/epoxy plate for bone fracture repair using conventional fatigue tests and thermography. J. Mech. Behav. Biomed. Mater. 2014, 35, 27–38. [Google Scholar] [CrossRef]
- Nourian-Avval, A.; Khonsari, M. Rapid prediction of fatigue life based on thermodynamic entropy generation. Int. J. Fatigue 2021, 145, 106105. [Google Scholar] [CrossRef]
- Mehdizadeh, M.; Khonsari, M.M. On the role of internal friction in low-and high-cycle fatigue. Int. J. Fatigue 2018, 114, 159–166. [Google Scholar] [CrossRef]


| Si | Mg | Fe | Mn | Cu | Zn | Pb | Al | |
|---|---|---|---|---|---|---|---|---|
| LPBF | 9.544 | 0.338 | 0.137 | 0.002 | 0.001 | <0.002 | <0.002 | Balance |
| GC | 9.375 | 0.313 | 0.422 | 0.227 | 0.066 | 0.053 | 0.009 | Balance |
Publisher’s Note: MDPI stays neutral with regard to jurisdictional claims in published maps and institutional affiliations. |
© 2021 by the authors. Licensee MDPI, Basel, Switzerland. This article is an open access article distributed under the terms and conditions of the Creative Commons Attribution (CC BY) license (https://creativecommons.org/licenses/by/4.0/).
Share and Cite
Yang, C.; Zhu, K.; Liu, Y.; Cai, Y.; Liu, W.; Zhang, K.; Huang, J. A Comparative Study of Fatigue Energy Dissipation of Additive Manufactured and Cast AlSi10Mg Alloy. Metals 2021, 11, 1274. https://doi.org/10.3390/met11081274
Yang C, Zhu K, Liu Y, Cai Y, Liu W, Zhang K, Huang J. A Comparative Study of Fatigue Energy Dissipation of Additive Manufactured and Cast AlSi10Mg Alloy. Metals. 2021; 11(8):1274. https://doi.org/10.3390/met11081274
Chicago/Turabian StyleYang, Chunxia, Ke Zhu, Yayan Liu, Yusheng Cai, Wencheng Liu, Keming Zhang, and Jia Huang. 2021. "A Comparative Study of Fatigue Energy Dissipation of Additive Manufactured and Cast AlSi10Mg Alloy" Metals 11, no. 8: 1274. https://doi.org/10.3390/met11081274