Article

Influence of Cooling Process Routes after Intercritical Annealing on Impact Toughness of Duplex Type Medium Mn Steel

School of Science and Technology, Shinshu University, 4-17-1 Wakasato, Nagano 380-8553, Japan
*
Author to whom correspondence should be addressed.
Metals 2021, 11(7), 1143; https://doi.org/10.3390/met11071143
Submission received: 15 June 2021 / Revised: 13 July 2021 / Accepted: 18 July 2021 / Published: 20 July 2021
(This article belongs to the Special Issue Mechanical Properties and Microstructure of Forged Steel)

Abstract

:
To apply the duplex type low-carbon medium-manganese steel to the hot/warm-forging and -stamping products, the influence of cooling process routes immediately after intercritical annealing such as air-cooling (AC) and isothermal transformation (IT) processes on the impact toughness of 0.2%C-1.5%Si-5%Mn (in mass %) duplex type medium-Mn (D-MMn) steel was investigated. Moreover the microstructural and tensile properties were also investigated. The AC process increased the volume fraction of reverted austenite but decreased the thermal and mechanical stability in the D-MMn steel, compared to the IT process. The AC process increased the tensile strength but decreased the total elongation. The Charpy V-notch impact value and ductile-brittle transition temperature were deteriorated by the AC process, compared to the IT process. This deterioration of the impact toughness was mainly related to the reverted austenite characteristics and fracture mode.

1. Introduction

The first-, second-, and third-generation advanced high strength steels (AHSSs) recently developed are expected to apply to the automotive sheet products [1,2,3] and wire-rod products [4,5,6,7]. Among them, the third-generation AHSSs such as Si/Al-Mn transformation-induced plasticity (TRIP)-aided bainitic ferrite (TBF) [8,9] and martensite (TM) [10,11] steels, carbide-free bainitic (CFB) steel [12,13], and quenching and partitioning (Q&P) steel [14,15] bring on great weight reduction and high reliability due to the ultrahigh strength above 980 MPa. The microstructure of the third-generation AHSSs mainly consists of the matrix structure of bainitic ferrite/martensite containing metastable retained austenite of 5–20 vol. %. To obtain a larger amount of reverted austenite, annealed martensite/reverted austenite duplex type medium Mn (D-MMn) steels with 4–14 mass % Mn [16,17,18,19,20,21] were also developed as well as martensite-type medium Mn (M-MMn) steels [22,23,24,25] and laminate type medium Mn (L-MMn) steels [25,26].
The D-MMn steel can easily achieve a higher product of tensile strength and total elongation (TS × TEl) than 30 GPa% through intercritical annealing and then air cooling (AC) or quenching in a water/oil bath [16,17,18,19,20,21]. The D-MMn steel subjected to the AC process possesses a high-impact absorbed value [27,28,29,30]. Thus, some applications of the D-MMn steel to forging and stamping products [31,32] are reported up to now. Tanino et al. [21] proposed that an isothermal transformation (IT) process immediately after intercritical annealing enhances further the TS × TEl and impact absorbed value through the TRIP effect or strain-induced martensite transformation (SIMT) hardening of a large amount of metastable reverted austenite in 0.2%C-1.5%Si-5%Mn (in mass %) D-MMn steel. However, the tensile properties and impact toughness of the D-MMn steels produced with the AC process are not exactly compared with those subjected to the IT process.
In the present study, the microstructure, tensile properties, and impact toughness of the 0.2%C-1.5%Si-5%Mn D-MMn steel subjected to the AC process after intercritical annealing were compared with those of the steel subjected to the IT process for applications to hot/warm-forging and stamping products. In addition, the relation between the impact toughness and microstructural properties, especially metastable reverted austenite characteristics, was discussed.

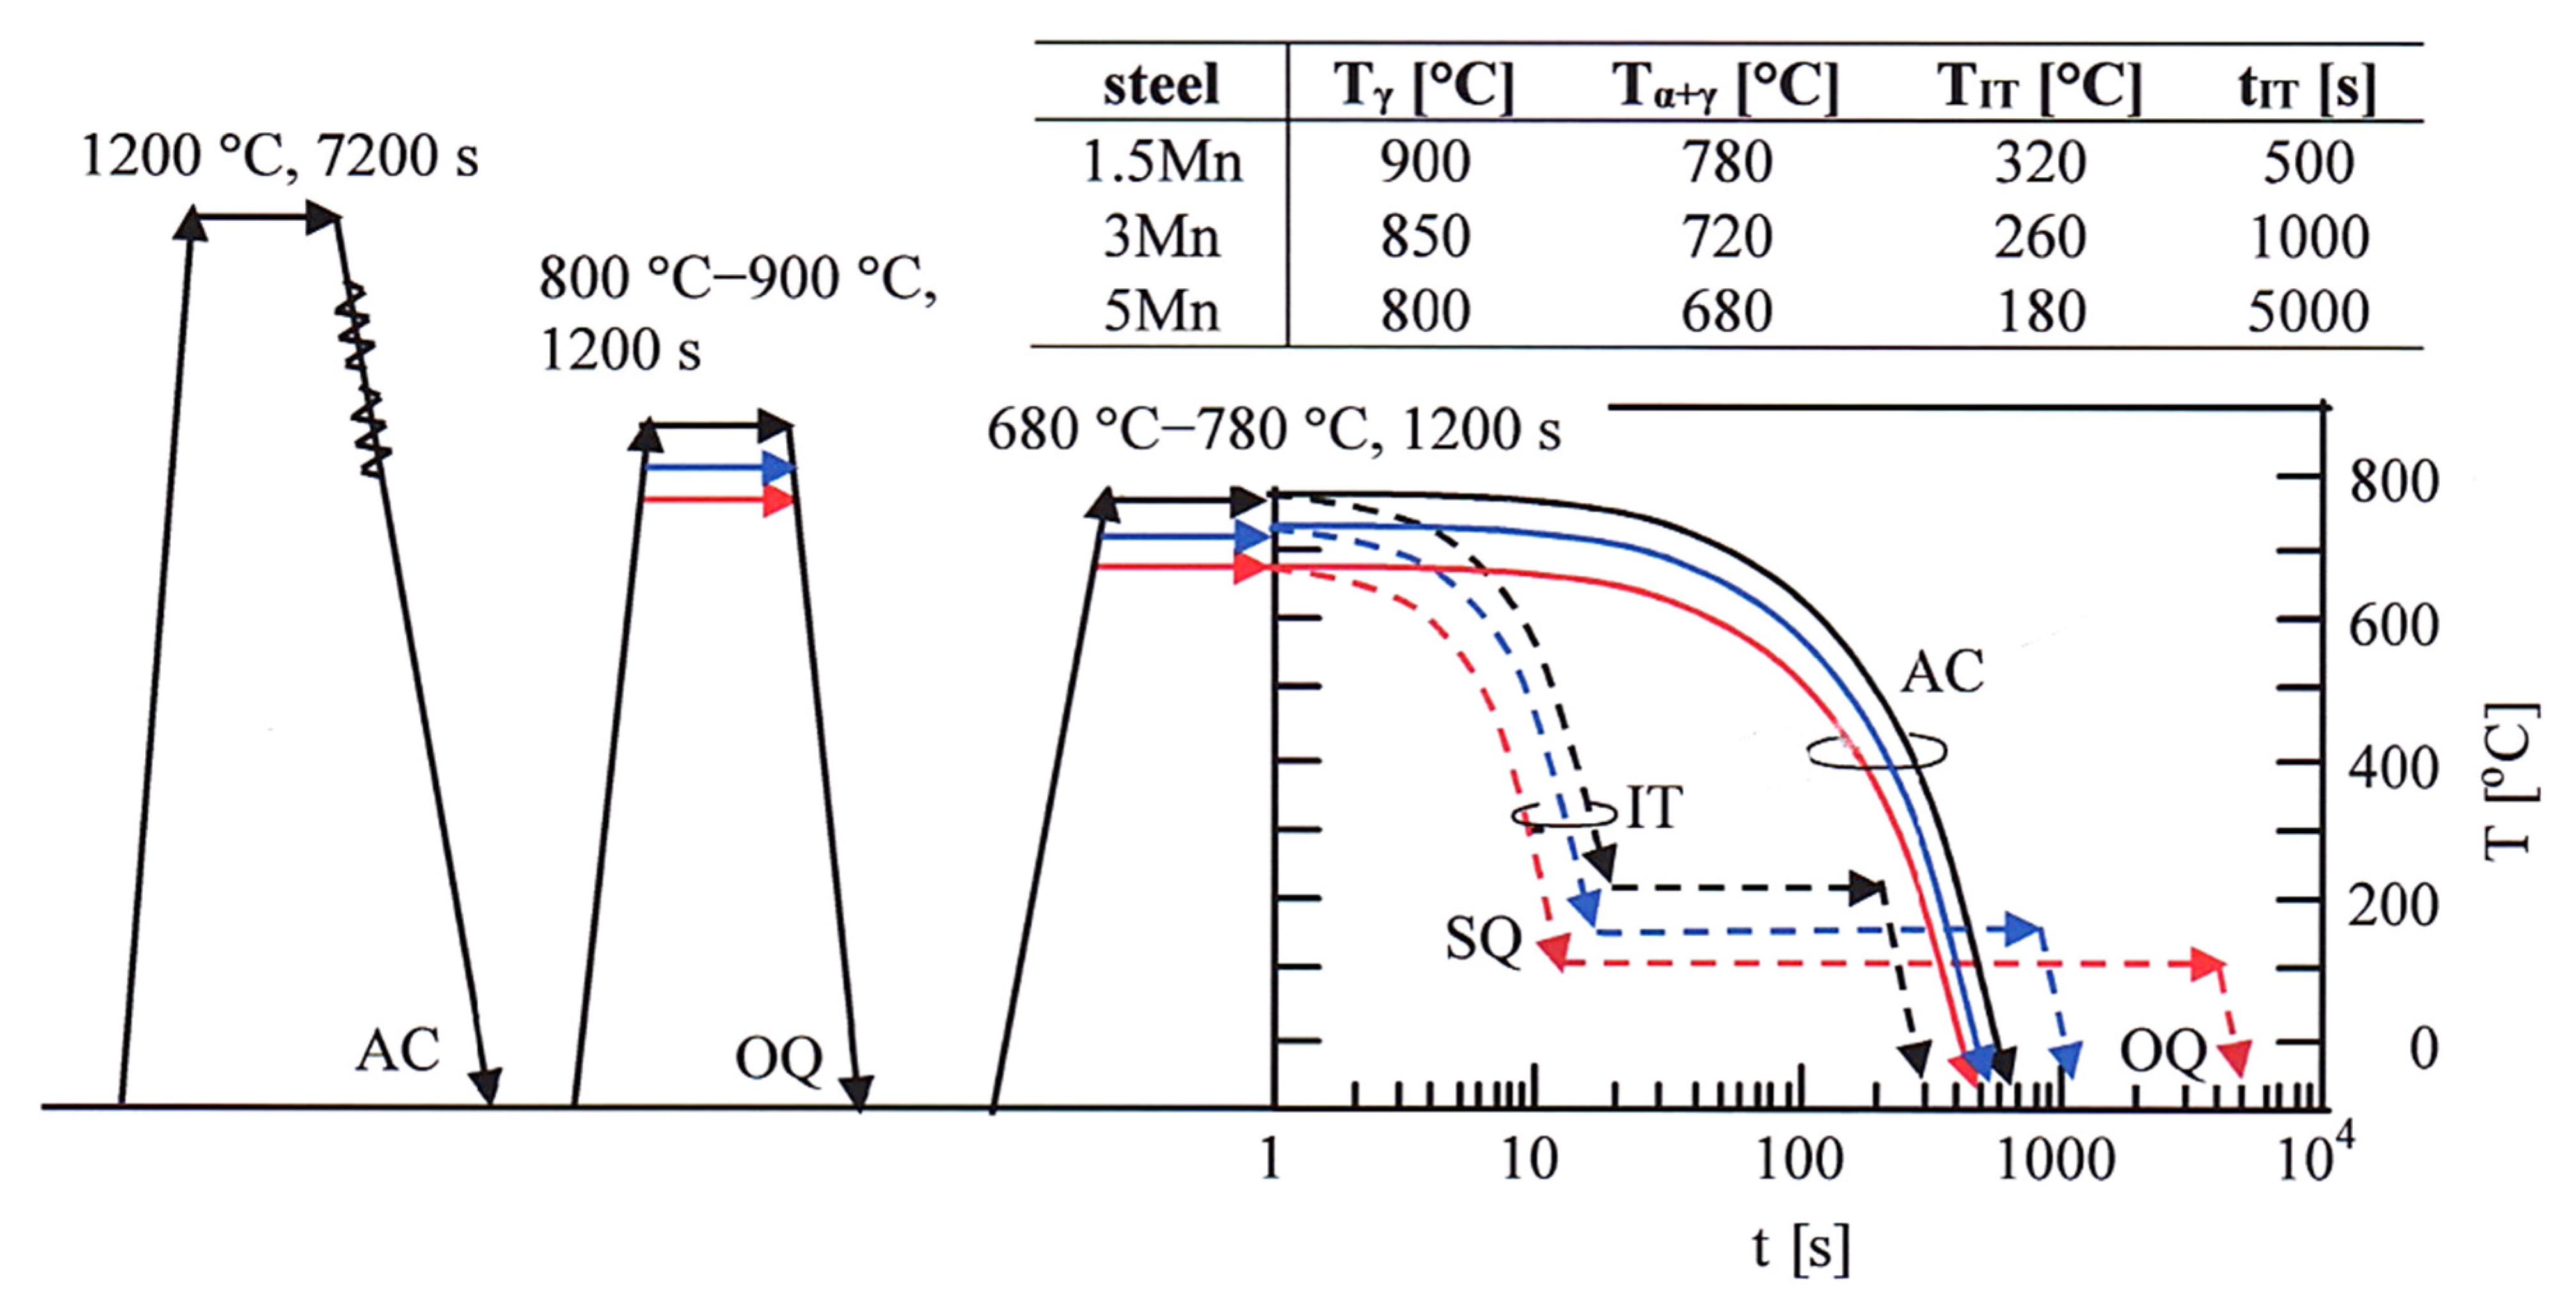
2. Materials and Methods

In this study, medium Mn steel with Mn content of 5 mass % (5 Mn steel) was prepared as 100 kg slabs via vacuum melting. For comparison, slabs containing Mn contents of 1.5 and 3 mass % (1.5 Mn and 3 Mn steels, respectively) were also produced in the same conditions. The chemical compositions of these slabs are shown in Table 1. These slabs were heated to 1200 °C and then hot-rolled to a thickness of 5 mm with a finishing temperature of 850 °C. The hot-rolled plates were then ground to a thickness of 3 mm. The austenitic and ferritic transformation temperatures (Ac3 and Ac1, respectively) and the martensite start and finish temperatures (Ms and Mf, respectively) of these steels were determined using a dilatometer (Thermecmaster-Z, Fuji Electronic Ind. Co., Osaka, Japan). The measured continuous cooling transformation (CCT) curves of the steels are shown in Figure 1.
Specimens for tensile tests (JIS-14B, 2.5-mm thick, 25 mm gauge in length, 4 mm wide) and sub-sized V-notched impact tests (JIS-5, 55 mm long, 10 mm wide, 2.5 mm thick) were machined from the plates along the rolling direction. The specimens were subsequently subjected to the heat-treatment process shown in Figure 2; (1) austenitizing at 800 to 900 °C and then quenching in an oil bath, (2) intercritical annealing between Ac1 and Ac3 for 1200 s at 780, 720, and 680 °C for the 1.5 Mn, 3 Mn, and 5 Mn sheets of steel, respectively, and (3) the AC process and IT process at TIT = Ms − 100 °C for IT times, tIT, of 500, 1000, and 5000 s in salt and an oil bath. The intercritical annealing temperatures were chosen as the temperatures at which the ferrite and austenite volume fractions are 50% and 50%, respectively. The IT temperatures and IT times that give optimum reverted austenite characteristics were selected from previous research [21].
The microstructure of the steels was observed by field-emission scanning electron microscopy (FE-SEM; JSM-7000F, JEOL Ltd., Akishima, Tokyo, Japan) which was performed using an electron backscatter diffraction system (EBSD; OIM system, TexSEM Laboratories, Inc., Prova, UT, USA) with the step size of 0.1 μm. The steel specimens for the FE-SEM–EBSD analyses were first ground with alumina powder and colloidal silica and then prepared by ion thinning.
The characteristics of the reverted austenite in the steel samples were quantified by X-ray diffraction (XRD; RINT2100, Rigaku Co., Akishima, Tokyo, Japan). The specimens were electropolished after being ground with emery paper (#2000). The volume fraction of the reverted austenite (fγ, vol. %) was calculated from the integration of the intensities of the (200)α, (211)α, (200)γ, (220)γ, and (311)γ peaks of the XRD patterns obtained using the Cu-Kα radiation [33]. The carbon concentration (Cγ, mass %) was estimated by substituting the lattice constant (aγ; unit of 10−1 nm) measured from the (200)γ, (220)γ, and (311)γ peaks of the Cu-Kα radiation into the empirical formula proposed by Dyson and Holmes [34]. For convenience, the contents of the added alloying elements were substituted for these concentrations in this study. In this research, the average values of volume fractions and carbon concentrations of reverted austenite measured at three locations were adopted, as well as the lath size of annealed martensite structure.
The thermal stability of the reverted austenite was evaluated in a temperature range between −196 °C and 300 °C by measuring the volume fraction change of the reverted austenite transformed on cooling in dry ice, ethyl alcohol, and/or liquid nitrogen, and on heating in water and using a pair of plate heaters (70 × 90 mm2). A holding time of 1200 s was used for cooling and heating. The mechanical stability of the reverted austenite was defined using “the strain-induced transformation factor k” in the following equation [11,21,35],
ln fγ = ln fγ0k ε
where fγ0 and fγ are the volume fractions of reverted austenite before and after straining to the true plastic strain (ε) via tension, respectively.
Tensile tests were carried out at 25 °C using a tensile testing machine (AG-10TD, Shimadzu Co., Kyoto) under a crosshead speed of 1 mm/min (resulting in a strain rate of 6.67 × 10⁻⁴ s−1). The impact tests were conducted on conventional and instrumented Charpy impact testing machines (CI-300 and CAI300, Tokyo Testing Machine Inc., Tokyo, Japan) for temperatures in the range of −196 °C to 100 °C. Liquid nitrogen, dry ice, ethyl alcohol, and water were used to cool and heat the specimens. The specimens were held at different testing temperatures for 1800 s before being tested. The impact tests were performed within 3 s after removing the specimen from the temperature-regulating medium. The impact properties were evaluated by determining the Charpy V-notch impact value (Ev) and 50% shear fracture ductile-to-brittle transition temperature (DBTT) of the specimens. At least three tensile and impact specimens were tested for each condition to obtain the average values of the tensile properties and Ev at 25 °C.

3. Results

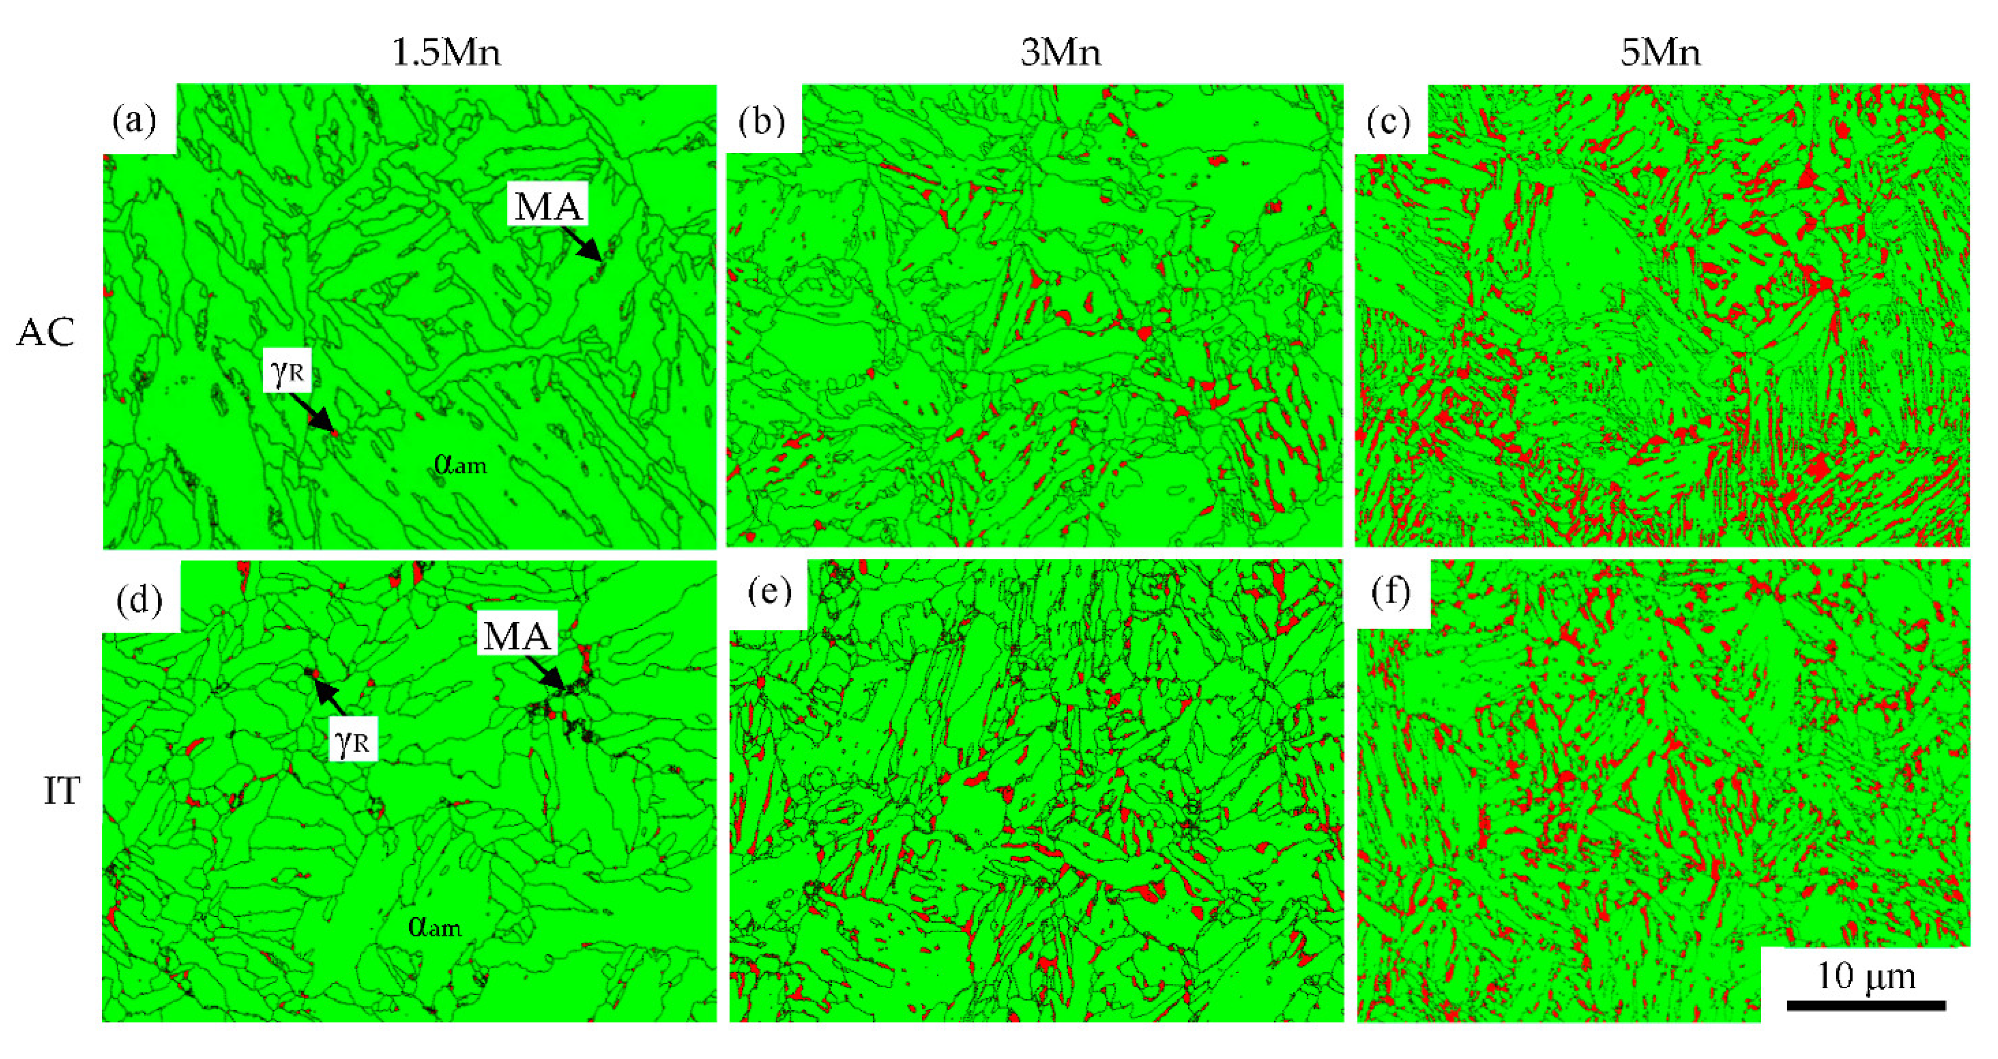
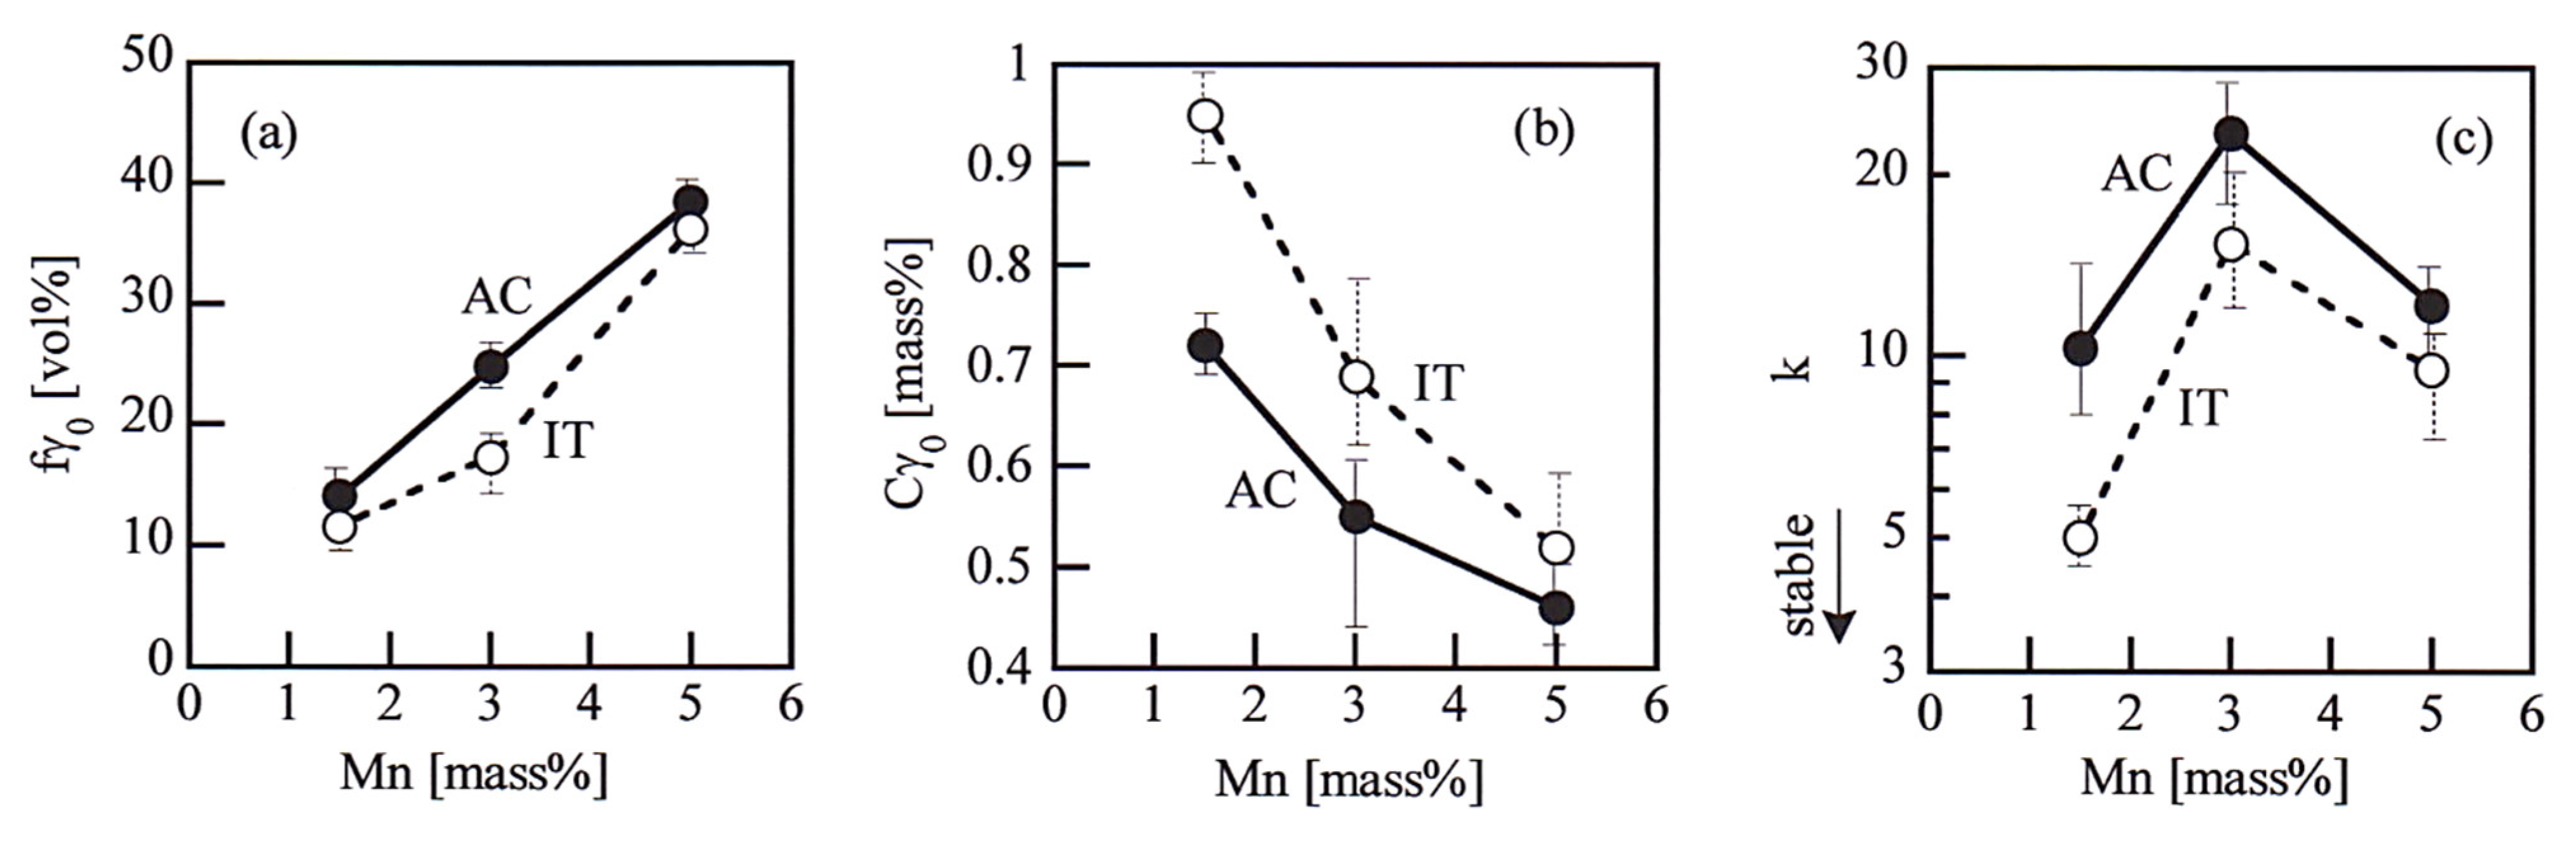
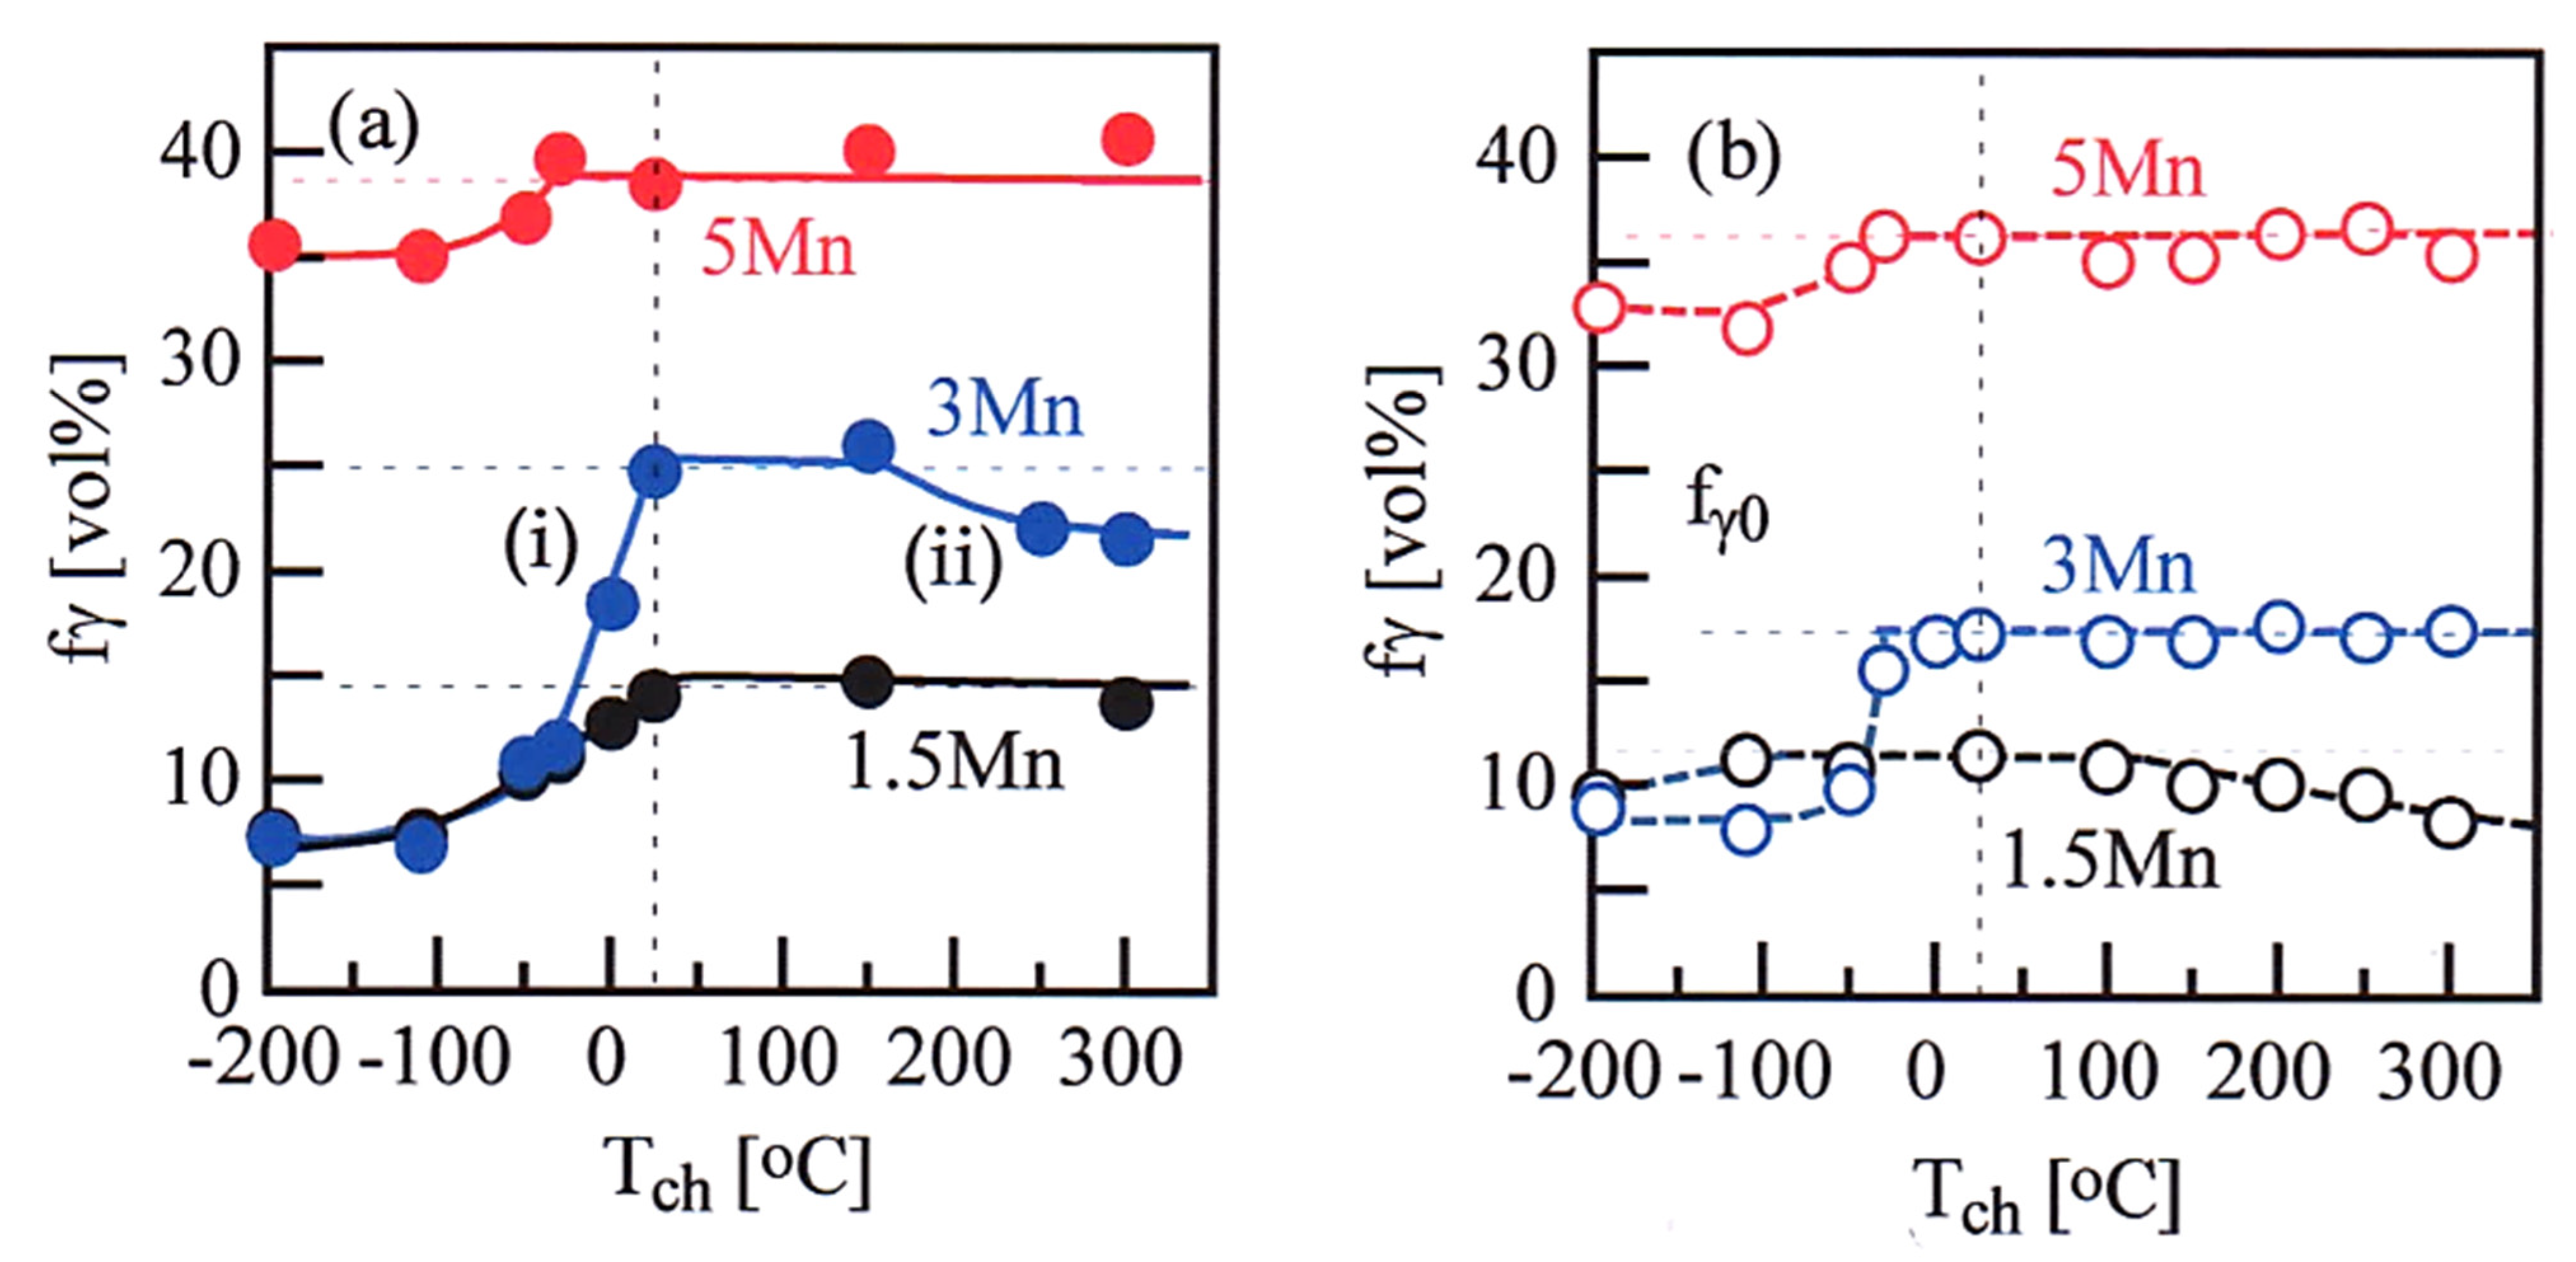
3.1. Microstructure and Reverted Austenite Characteristics

Figure 3 shows the microstructures of the 1.5 Mn, 3 Mn, and 5 Mn steels subjected to the AC and IT processes. The microstructures of the steels subjected to the AC process are nearly the same as those of the steels subjected to the IT process. The microstructures mainly consist of an annealed martensite structure matrix and metastable reverted austenite. The lath size of the annealed martensite structure measured by the line intersecting method is nearly the same in the cases of the AC and IT processes, although it considerably decreases with increasing Mn content. Martensite–austenite (MA) phase exists only in the 1.5 Mn steel. The size of the reverted austenite is nearly the same in all steels, although the volume fraction increases with increasing Mn content. According to previous research [21], the dislocation density of the annealed martensite structure of the 5 Mn steel is very low in the same way as those of the 1.5 Mn and 3 Mn steels.
Figure 4 and Table 2 show the reverted austenite characteristics of the steels subjected to the AC and IT processes. The AC process decreases the carbon concentration and mechanical stability of the reverted austenite compared to the IT process although it increases the volume fraction of the reverted austenite. The low carbon concentration decreased by the AC process is considered to be associated with the short carbon-enrichment time of the reverted austenite. The reverted austenite fraction increases with increasing Mn content in both processes. On the other hand, the carbon concentration decreases with increasing Mn content. Unlike the Mn content dependence of carbon concentration, the 3 Mn steel shows the highest k-value and the 5 Mn steel exhibits an intermediate k-value between the 1.5 Mn and 3 Mn steels.
Figure 5 shows the variations in reverted austenite fraction after cooling to −196 °C and heating to 300 °C in the 1.5 Mn, 3 Mn, and 5 Mn steels subjected to the AC and IT processes. The critical cooling temperature at which the reverted austenite fraction starts to decrease is lower than room temperature in both processes although the AC process raises slightly the critical cooling temperature. In the 1.5 Mn steel subjected to the IT process and the 3 Mn steel subjected to the AC process, the heating to temperatures above 150 °C and 250 °C decreases the reverted austenite fraction, respectively. According to Sugimoto et al. [36], the decrease in the reverted austenite fraction on cooling is owing to the ε-martensite transformation due to the decreased stacking fault energy of the reverted austenite [37,38]. On the other hand, the decrease in the reverted austenite fraction on heating may be caused by bainite transformation (or decomposition into ferrite and carbide) [35]. The decreases in the reverted austenite fraction by cooling in the 1.5 Mn, 3 Mn, and 5 Mn steels subjected to the AC process are larger than those subjected to the IT process. In both processes, the largest decrease in the reverted austenite fraction results in the 3 Mn steel.

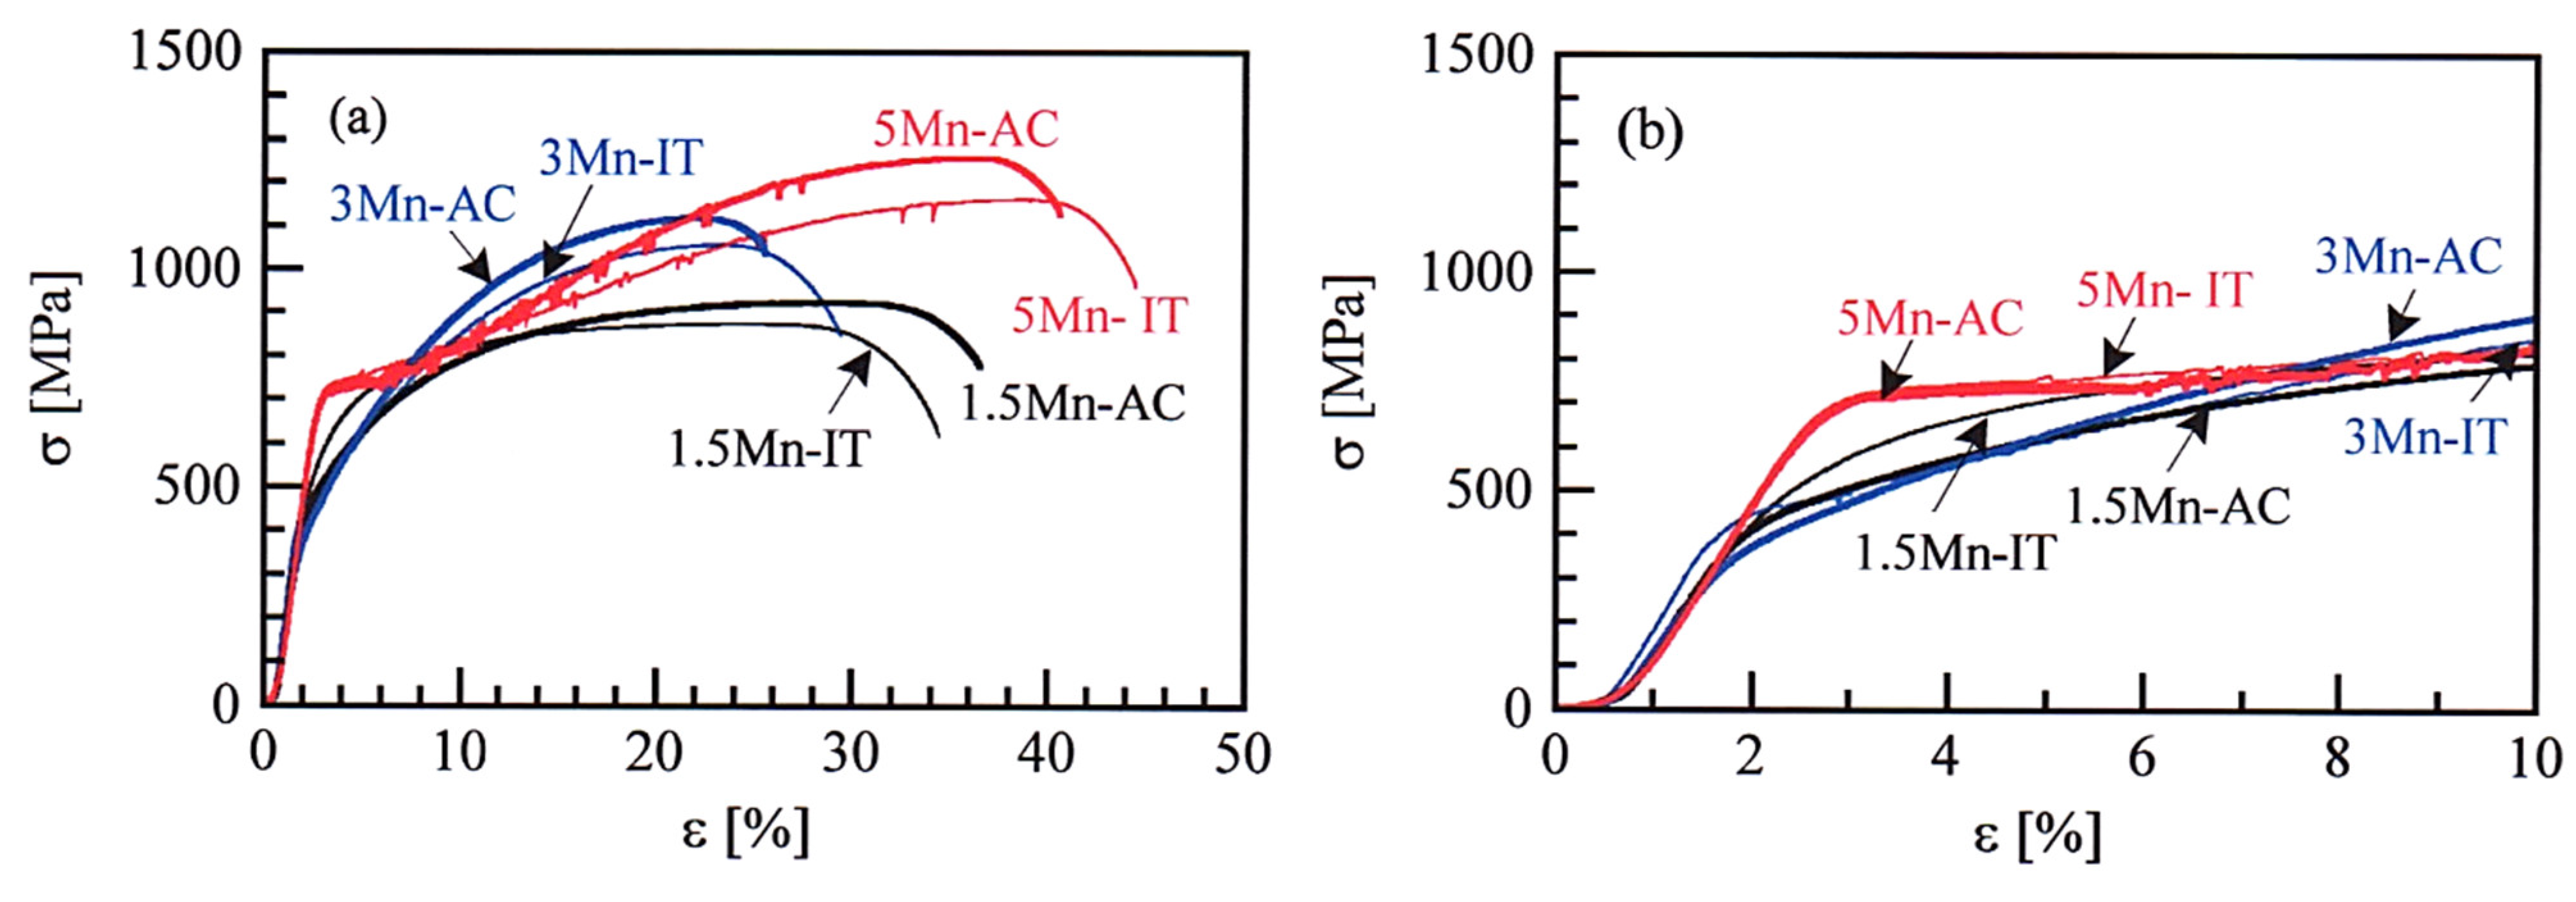
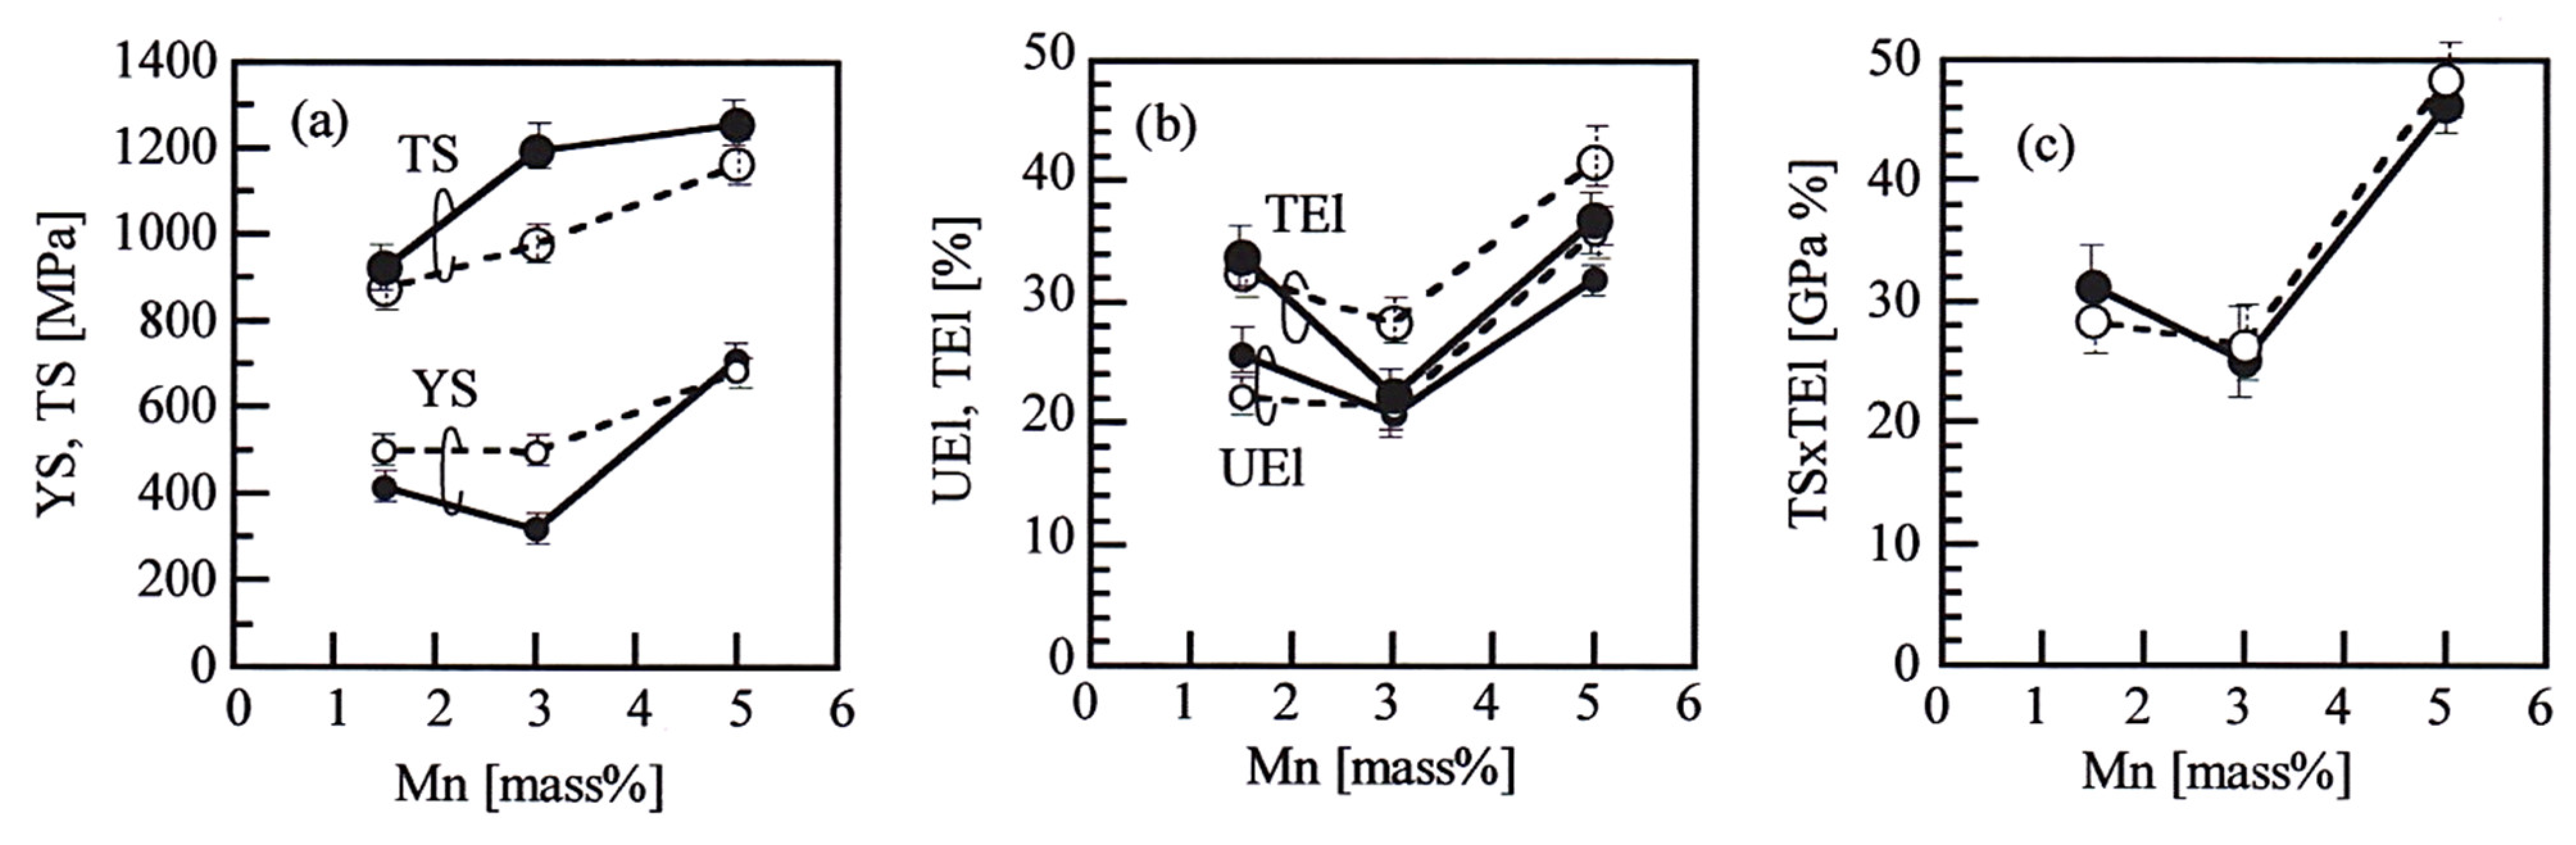
3.2. Tensile Properties at 25 °C

Typical engineering stress–strain curves at Tt = 25 °C in the 1.5 Mn, 3 Mn, and 5 Mn steels subjected to the AC and IT processes are shown in Figure 6. In all steels subjected to both processes, significant strain hardening takes place, although the yield plateau occurs in an early strain stage only in the 5 Mn steel. Moreover, many serrations occur only in the 5 Mn steel subjected to both processes.
Tensile properties of the corresponding steels are shown in Figure 7 and Table 2. The AC process increases the tensile strength compared to the IT process but decreases the yield stress or 0.2% offset proof stress except for the 5 Mn steel. In addition, the AC process brings on nearly the same TS × TEl as the IT process in all steels although it decreases the uniform and total elongations except for the 1.5 Mn steel.
In both processes, the 5 Mn steel exhibits the highest yield stress and tensile strength and the largest uniform and total elongations owing to the TRIP effect or SIMT hardening by a large amount of metastable reverted austenite and solid solution hardening by high Mn concentration, although the reduction of the area is the lowest [21]. The 5 Mn steel exhibits a superior TS × TEl (>45 GPa%). The 3 Mn steel possesses lower yield stress and higher tensile strength than the 1.5 Mn steel. The uniform and total elongations and reduction of the area are lower than those of the 1.5 Mn steel, despite a high reverted austenite fraction. The TS × TEl of the 3 Mn steel is lower than that of the 1.5 Mn steel.

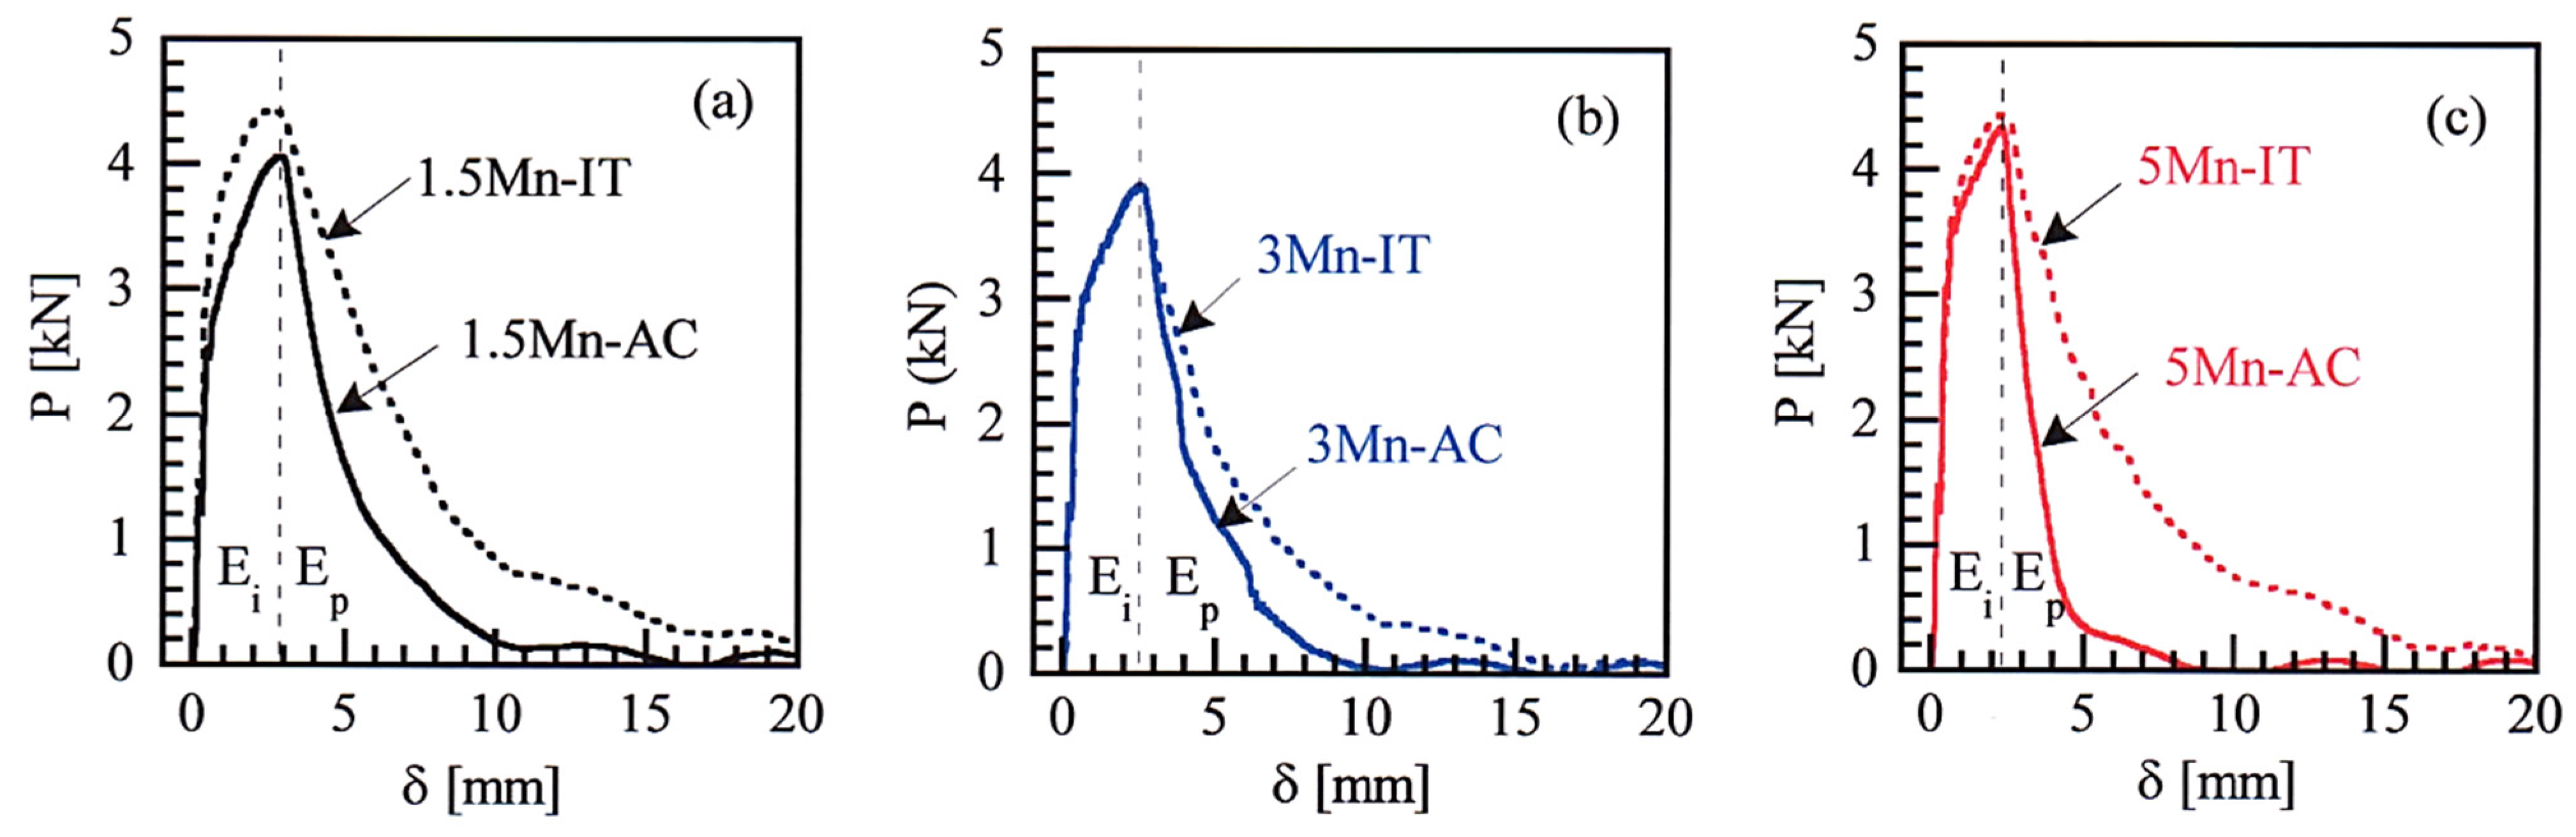
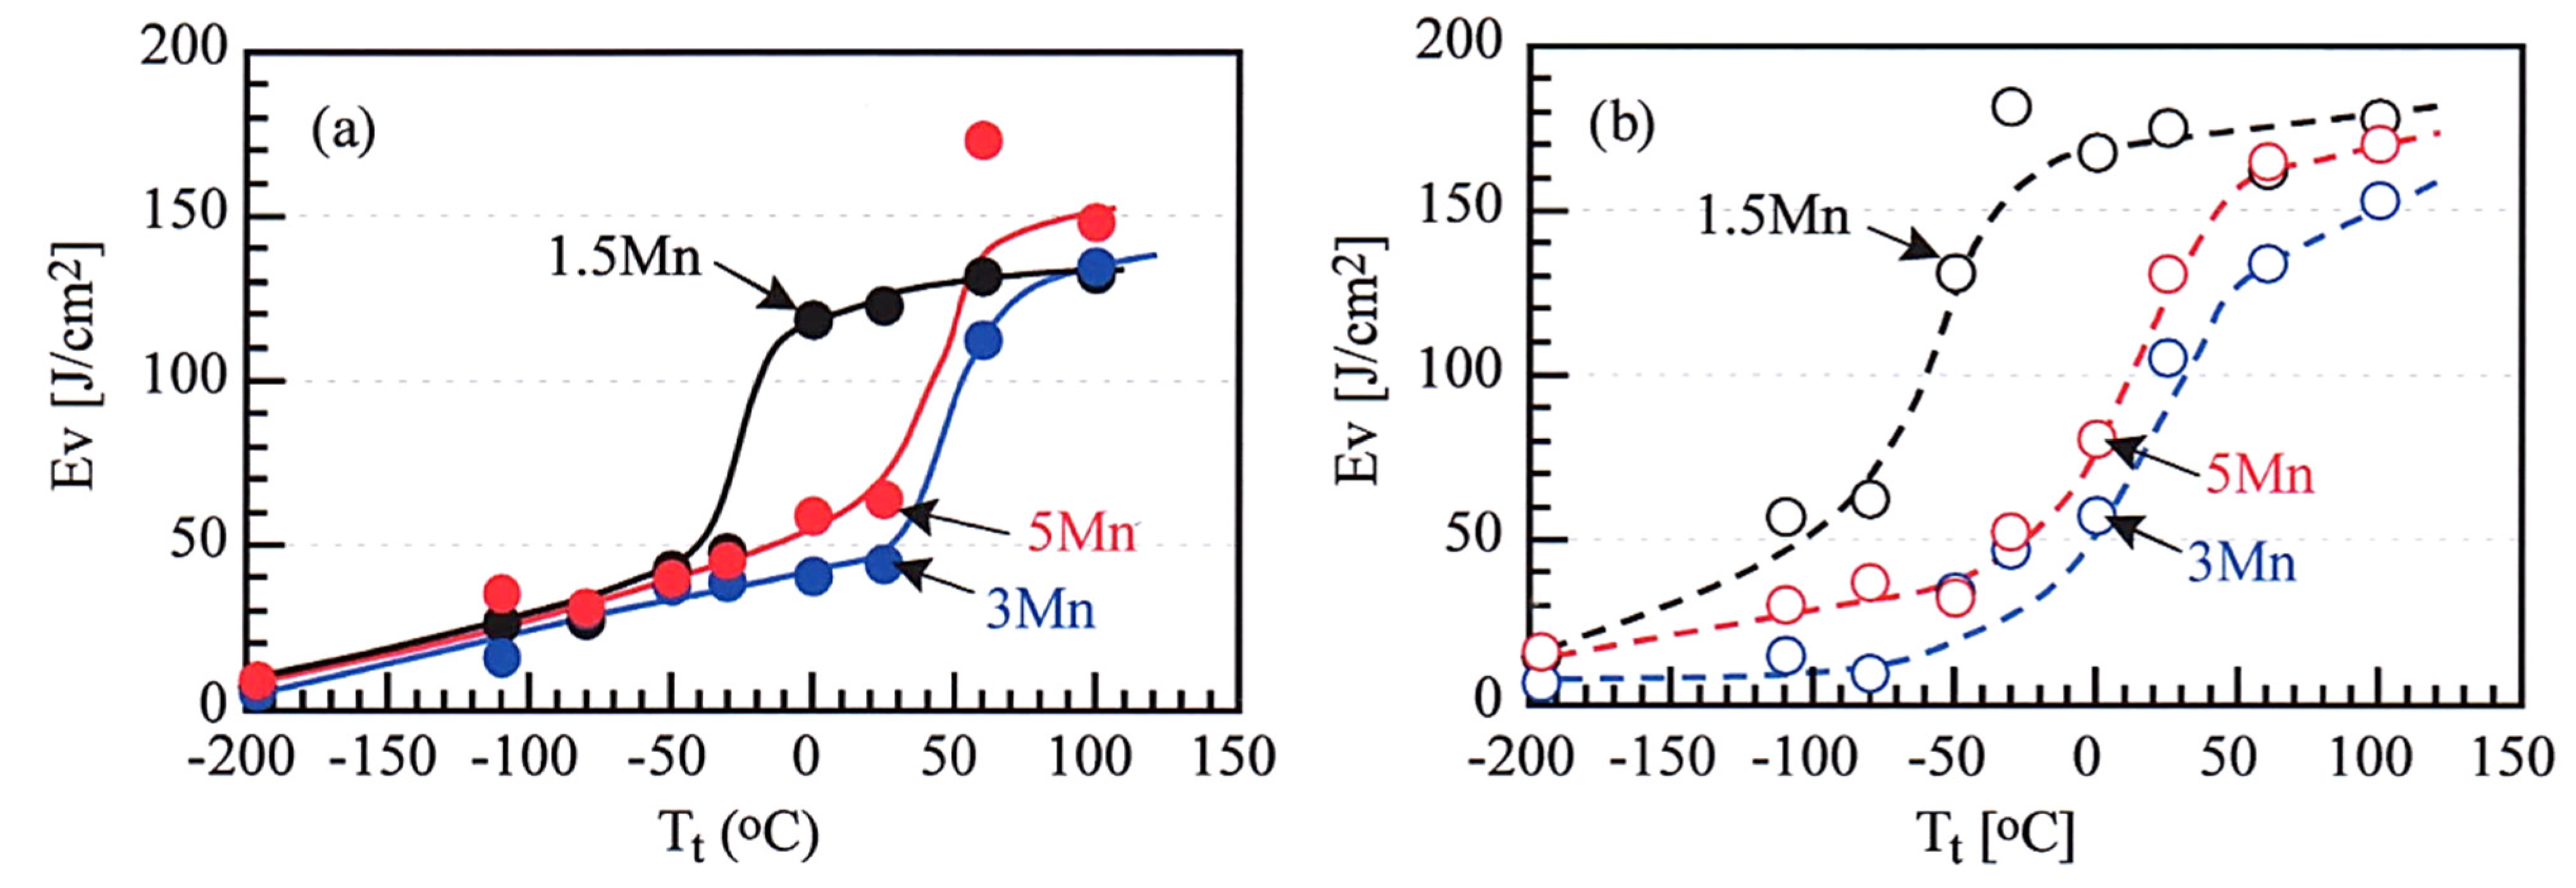
3.3. Impact Toughness

Figure 8a,b shows the Mn content dependences of the Ev and the product of TS and Ev (TS × Ev) at Tt = 25 °C and 100 °C in the steels subjected to the AC and IT processes, respectively. The AC process deteriorates the Ev and TS × Ev at 25 °C in all steels, compared to the IT process. In both processes, the 3 Mn steel exhibits minimum Ev. The Ev and TS×Ev are considerably increased by 100 °C test with shorter error bars than them at 25 °C, especially in the 5 Mn steel subjected to the AC process. In this case, the Ev of the 5 Mn steel is higher than that of the 1.5 Mn steel because an upper shelf Ev appears at temperatures above 100 °C as mentioned later. The TS × Evs at 100 °C of the 3 Mn and 5 Mn steels subjected to the AC and IT processes are nearly the same (Figure 8b).
Figure 9 shows the impact load-displacement (P-δ) curves at Tt = 25 °C in the 1.5 Mn, 3 Mn, and 5 Mn steels subjected to the AC and IT processes. It is found that low Evs of 1.5 Mn, 3 Mn, and 5 Mn steels subjected to the AC process mainly caused by low crack-propagation energy (Ep), although low Ev of the 1.5 Mn steel subjected to the AC process is also associated with the low crack-initiation energy (Ei).
Figure 10a shows the relation between the Ev and TS in the 1.5 Mn, 3 Mn, and 5 Mn steels subjected to the AC and IT processes which was tested at Tt = 25 °C and 100 °C. At a testing temperature of 25 °C, the 5 Mn steel subjected to the AC process shows an equal Ev and TS × Ev to JIS-SCM420 steel quenched and tempered, and the 3 Mn steel exhibits lower Ev and TS × Ev than JIS-SCM420 steel. On the other hand, the Ev and TS × Ev at Tt = 100 °C of the 5 Mn steel subjected to the AC and IT process significantly increase compared to those of JIS-SCM420 steel, in the same way as the 3 Mn steel. When compared to the Ev of martensite-type 5 Mn steel, the TS × Evs at Tt = 100 °C of 5 Mn steel subjected to the AC and IT processes are higher than that at Tt = 25 °C (151.4 GPa J/cm2) of martensite-type 5 Mn steel [23].
Figure 11 shows the variations in the Ev with the testing temperature of the 1.5 Mn, 3 Mn, and 5 Mn steels subjected to the AC and IT processes. Figure 10b shows the relation between the DBTT and TS of various steels. The AC process brings on higher DBTT than the IT process in the 1.5 Mn, 3 Mn, and 5 Mn steels. The DBTTs of 1.5 Mn, 3 Mn, and 5 Mn steels subjected to both processes are higher than those of quenched and tempered JIS-SCM420 steel. This result is very different from the result that the DBTTs of martensite-type 1.5 Mn, 3 Mn, and 5 Mn steels (−70 °C, −50 °C, and −50 °C, respectively, in a tensile strength range of 1274 MPa to 1633 MPa) are lower than those of the JIS-SCM420 steel [23]. It is noteworthy that the DBTTs of the 3 Mn and 5 Mn steels subjected to the AC process are higher than room temperature (25 °C). In both processes, the 1.5 Mn and 3 Mn steels exhibit the lowest and highest DBTTs, respectively.
Figure 12 shows SEM images of fracture surfaces of the 1.5 Mn, 3 Mn, and 5 Mn steels subjected to the AC process after impact tests at 25 °C and −196 °C. In Figure 12a–c, the fracture of all steels appears as dimple one. The fracture surface of the 3 Mn and 5 Mn steels is characterized by uniform fine dimples, different from that of 1.5% Mn steel consisting of both coarse and fine dimples. In Figure 12d–f, conventional cleavage fracture is observed in the 1.5 Mn steel fractured at −196 °C, but non-quasi-cleavage fracture appears on the surface of the 5 Mn steel although a small amount of cleavage facet coexists with the non-quasi-cleavage fracture. The 3 Mn steel shows a similar fracture surface to 5 Mn steel. The above-mentioned non-quasi-cleavage fracture looks like an inter-granular fracture along prior austenitic grain boundary which appeared in the 5 Mn steel subjected to the IT process [21].

4. Discussion

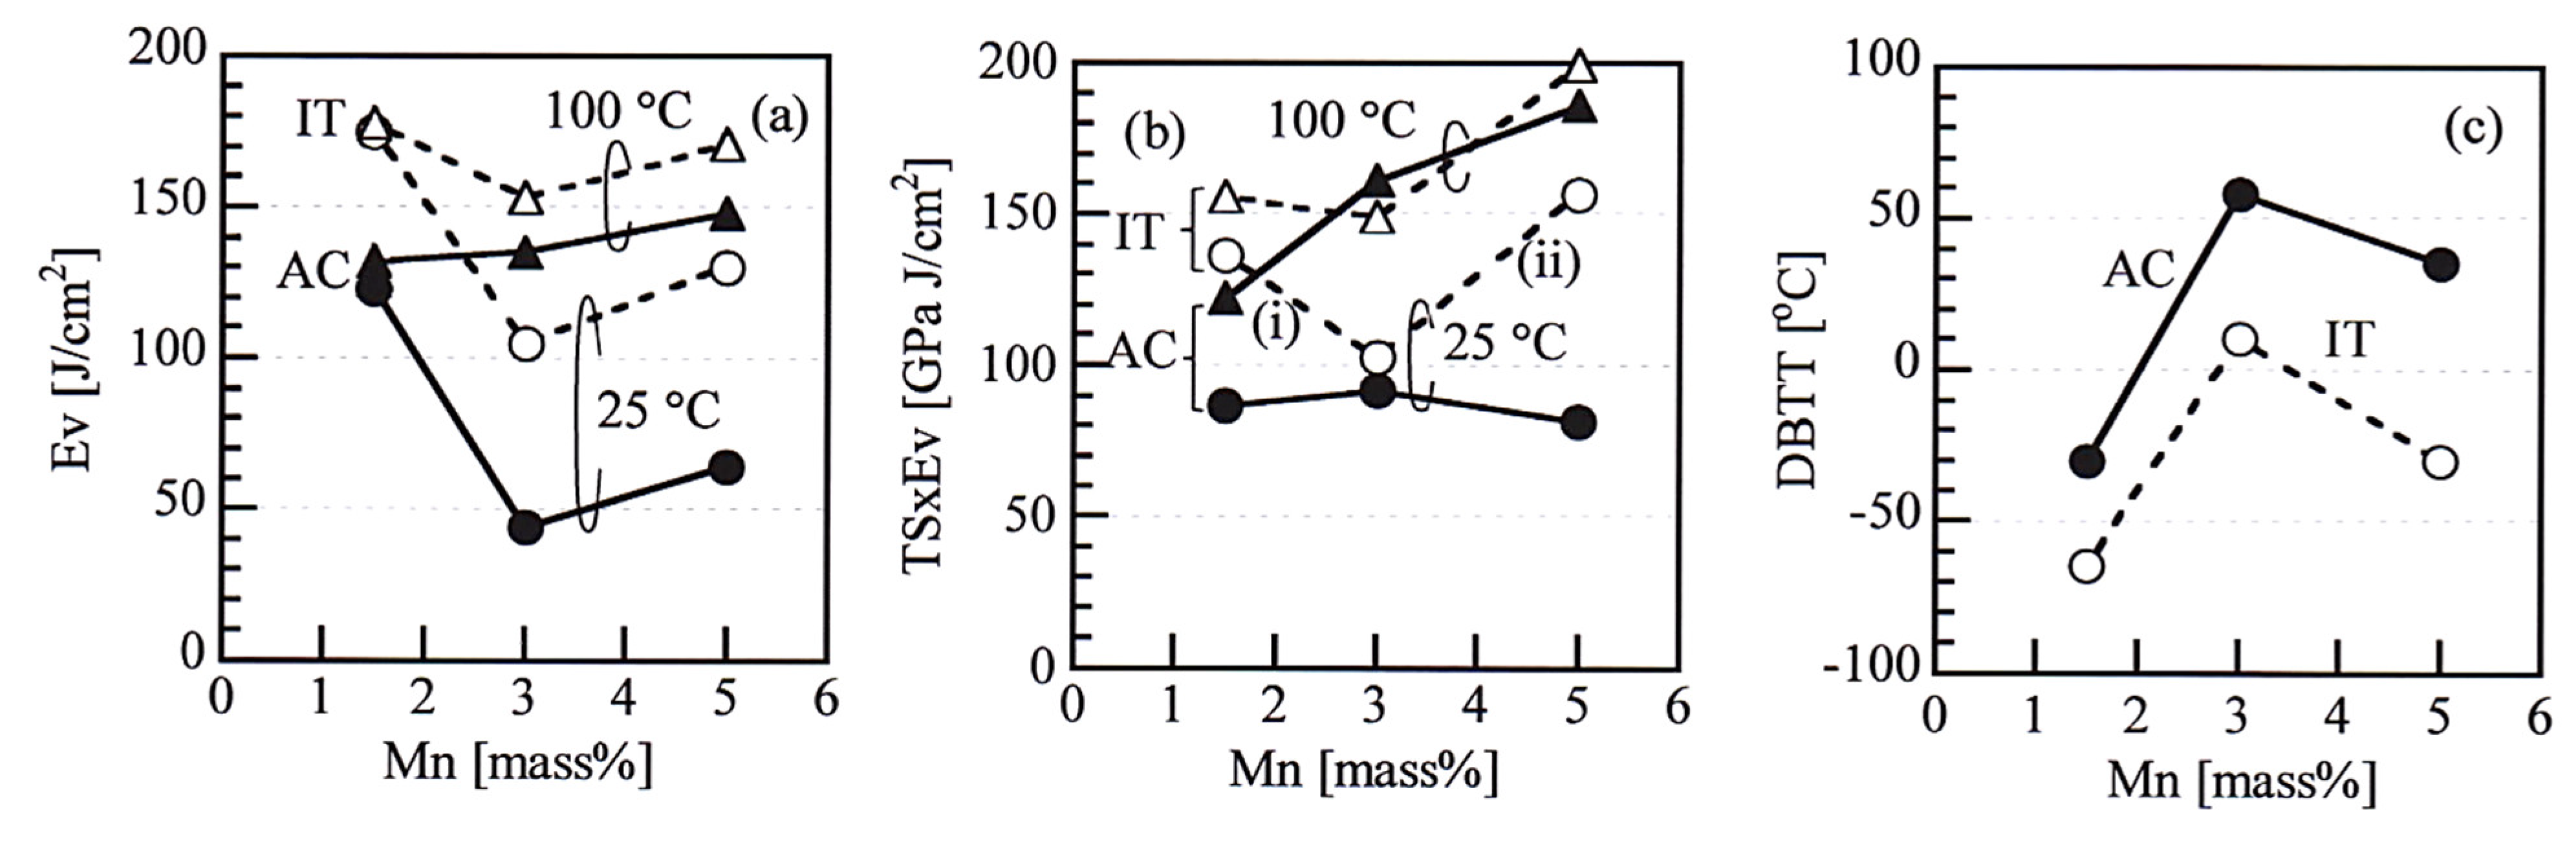
4.1. Ev at 25 °C and 100 °C

The 5 Mn steel subjected to the IT process possessed lower Ev and TS × Ev at 25 °C than the 1.5 Mn steel subjected to the same process (Figure 8a,b). According to Sugimoto et al. [21], they are essentially caused by the SIMT (or TRIP effect) of a large amount of reverted austenite, solid solution hardening of the matrix structure by high solute Mn concentration and microstructure-refining, although low mechanical stability of the reverted austenite plays a role in reducing these values. The SIMT suppresses the void or dimple formation through the plastic relaxation of localized stress concentration by volume change from the reverted austenite to martensite. The present 3 Mn steel subjected to the IT process exhibited the minimum Ev and TS × Ev (Figure 8a,b). Sugimoto et al. [21] showed that this was mainly associated with lower mechanical stability than that of the 5 Mn steel (Figure 4b,c), as well as lower volume fraction (Figure 4c) and larger inter-particle path of reverted austenite. In the 1.5 Mn steel, the MA phase plays a role in forming coarse dimples and resultantly increases the Ev, as well as the SIMT of the reverted austenite [21,39]. The 3 Mn and 5 Mn steels subjected to the IT process showed uniform fine dimple fracture on impact test at 25 °C. In this case, the dimples were mainly initiated at the reverted austenite (or the strain-induced martensite)/matrix structure interface [21].
In the present study, the AC process decreased the Ev at 25 °C in the 5 Mn steel, compared to the IT process, in the same way as the 1.5 Mn and 3 Mn steels (Figure 8a). In all steels, dimple fracture was observed, although the mixed coarse and fine dimples were formed only in the 1.5 Mn steel (Figure 12a–c). Figure 9c showed that the decrease in the Ev was mainly caused by low crack-propagation energy. As shown in Figure 4, the AC process increased the reverted austenite fraction but decreased the mechanical stability of the reverted austenite (increased the k-value). As the other microstructures were nearly the same between the steels subjected to the AC and IT processes, the decreased mechanical stability is considered to mainly reduce the Ev due to the easy SIMT which promotes easy void formation at the strain-induced martensite/annealed martensite interface and the resultant easy void propagation and connection. High Ev of the 1.5 Mn steel subjected to the AC process may be caused by a small amount of MA phase like in the case of the IT process.
As shown in Figure 8a, Figure 10a, and Figure 11, the impact test at 100 °C significantly increased the Ev and TS × Ev in the 3 Mn and 5 Mn steels subjected to the AC process, compared to the IT process. Sugimoto et al. [36] investigated the testing temperature dependence of the mechanical stability of reverted austenite in the 1.5 Mn, 3 Mn, and 5 Mn steels subjected to the IT process and found that the mechanical stability of the 3 Mn and 5 Mn steels is considerably influenced by the testing temperature compared to that of the 1.5 Mn steel as shown in Figure 13. Namely, the mechanical stability at the temperatures lower than 25 °C is lower than that of the 1.5 Mn steel but at temperatures between 100 °C and 200 °C it is higher than that of 1.5 Mn steel. If a similar testing temperature dependence of the k-value is obtained in the AC process, although the k-values are higher than those of the IT process because of lower carbon concentration (Figure 4b), the increased mechanical stability of reverted austenite is considered to increase the Evs and TS × Evs at 100 °C in the 3 Mn and 5 Mn steels subjected to the AC process.

4.2. DBTT

In general, Mn plays a role in increasing the DBTT due to Mn segregation on the prior austenitic grain boundary [40,41,42]. According to Yamanaka and Kowaka [43], Mn addition below 2 mass % lowers the DBTT but Mn addition above 5 mass % raises the DBTT in 0.002%C-(1−7.5)%Mn ferritic steels. In the latter, inter-granular fracture occurred at a low-temperature range, not cleavage fracture. Tanaka et al. [44] investigated the effect of Mn addition on the DBTT in 0.002%C-(0−2)%Mn-0.03%Ti ferritic steels and showed that Mn raises the DBTT by lowering the surface energy for inter-granular fracture. Based on the above results and SEM observation of the fracture surface, Sugimoto et al. [21] reported that high DBTTs of the 3 Mn and 5 Mn steels subjected to the IT process are associated with the inter-granular fracture in a brittle fracture temperature range and non-quasi-cleavage fracture (inter-granular fracture) (Figure 14b), although the quasi-cleavage fracture pre-dominantly occurs in the 1.5 Mn steel with low DBTT (Figure 14a). They also proposed that the inter-granular fracture resulted from (i) high Mn segregation and (ii) a large amount of unstable reverted austenite (or strain-induced martensite) on the prior austenitic grain boundaries. Tanaka et al. [44] also reported that solute Mn decreases the activation energy of dislocation glide at low temperatures like Ni and suppresses the cleavage fracture. According to Sugimoto et al. [23], quasi-cleavage fracture occurred at −196 °C in the martensite-type 5 Mn steel with a small amount of retained austenite (7.6 vol. %). This indicates that a large amount of reverted austenite also suppresses the cleavage fracture and promotes the inter-granular fracture in the present 5 Mn steel subjected to the AC and IT processes.
According to Kunitake et al. [45], the DBTT of 0.12%C-0.30%Si-0.83%Mn-0.30%Cu-1.11%Ni-0.53%Cr-0.49%Mo-0.03%V steel with the microstructure of martensite and martensite/lower bainite structures correlates with the unit crack path (dp) on the quasi-cleavage fracture surfaces as given by the following equation,
DBTT = E − Z × log dp−1/2.
where E and Z are the material’s constants. The unit crack path is corresponding to the packet size. Figure 15 shows the relation between the DBTT and dp for various steels. The DBTTs of quenched and then tempered JIS-SCM420 steel are also plotted in the figure. In this case, the grain facet sizes of the 3 Mn and 5 Mn steels were assumed to be the same as the dp. If the slopes of these DBTT versus log dp−1/2 lines are assumed to be similar to that reported by Kunitake et al. [45], the 3 Mn and 5 Mn steels subjected to the IT process had higher DBTTs by 128 °C (ΔDBTT1) than the 1.5 Mn steel and JIS-SCM420 steel. This means that the dp of cleavage fracture is equivalent to grain facet size in the 5 Mn steel and the ΔDBTT1 is associated with the inter-granular fracture.
The AC process further raised the DBTTs of the 3 Mn and 5 Mn steels by 33 °C (ΔDBTT2), compared to the IT process (see Figure 15). The AC process increased the reverted austenite fraction but decreased the thermal and mechanical stability, compared to the IT process in the 1.5 Mn, 3 Mn, and 5 Mn steels. Because the AC process produced the same microstructure as the IT process except for the reverted austenite characteristics, an increase in the DBTT (ΔDBTT2) of the 3 Mn and 5 Mn steels subjected to the AC process may be mainly caused by the further decrease in the mechanical stability of reverted austenite.
In this case, the inter-granular fracture raises the DBTT by ΔDBTT1 in the same way as the IT process.

5. Conclusions

The reverted austenite characteristics, tensile properties, and impact toughness of 0.2%C–1.5%Si–5.0%Mn D-MMn steel subjected to the AC process were compared with those subjected to the IT process. The main results obtained are as follows:
(1)
The AC process increased the volume fraction of reverted austenite in the annealed martensite matrix structure of the 5 Mn steel, but decreased the thermal and mechanical stability, compared to the IT process.
(2)
The AC process increased the tensile strength but decreased the total elongation. The TS × TEl was hardly influenced by the cooling process routs.
(3)
The TS × Ev at 25 °C of the 5 Mn steel was deteriorated by the AC process compared to the IT process, although at 100 °C it improved by the AC process in the same way as the IT process. The deterioration of the impact toughness at 25 °C was mainly caused by the decreased mechanical stability of reverted austenite, although the increased volume fraction of metastable reverted austenite contributed to improving the impact toughness.
(4)
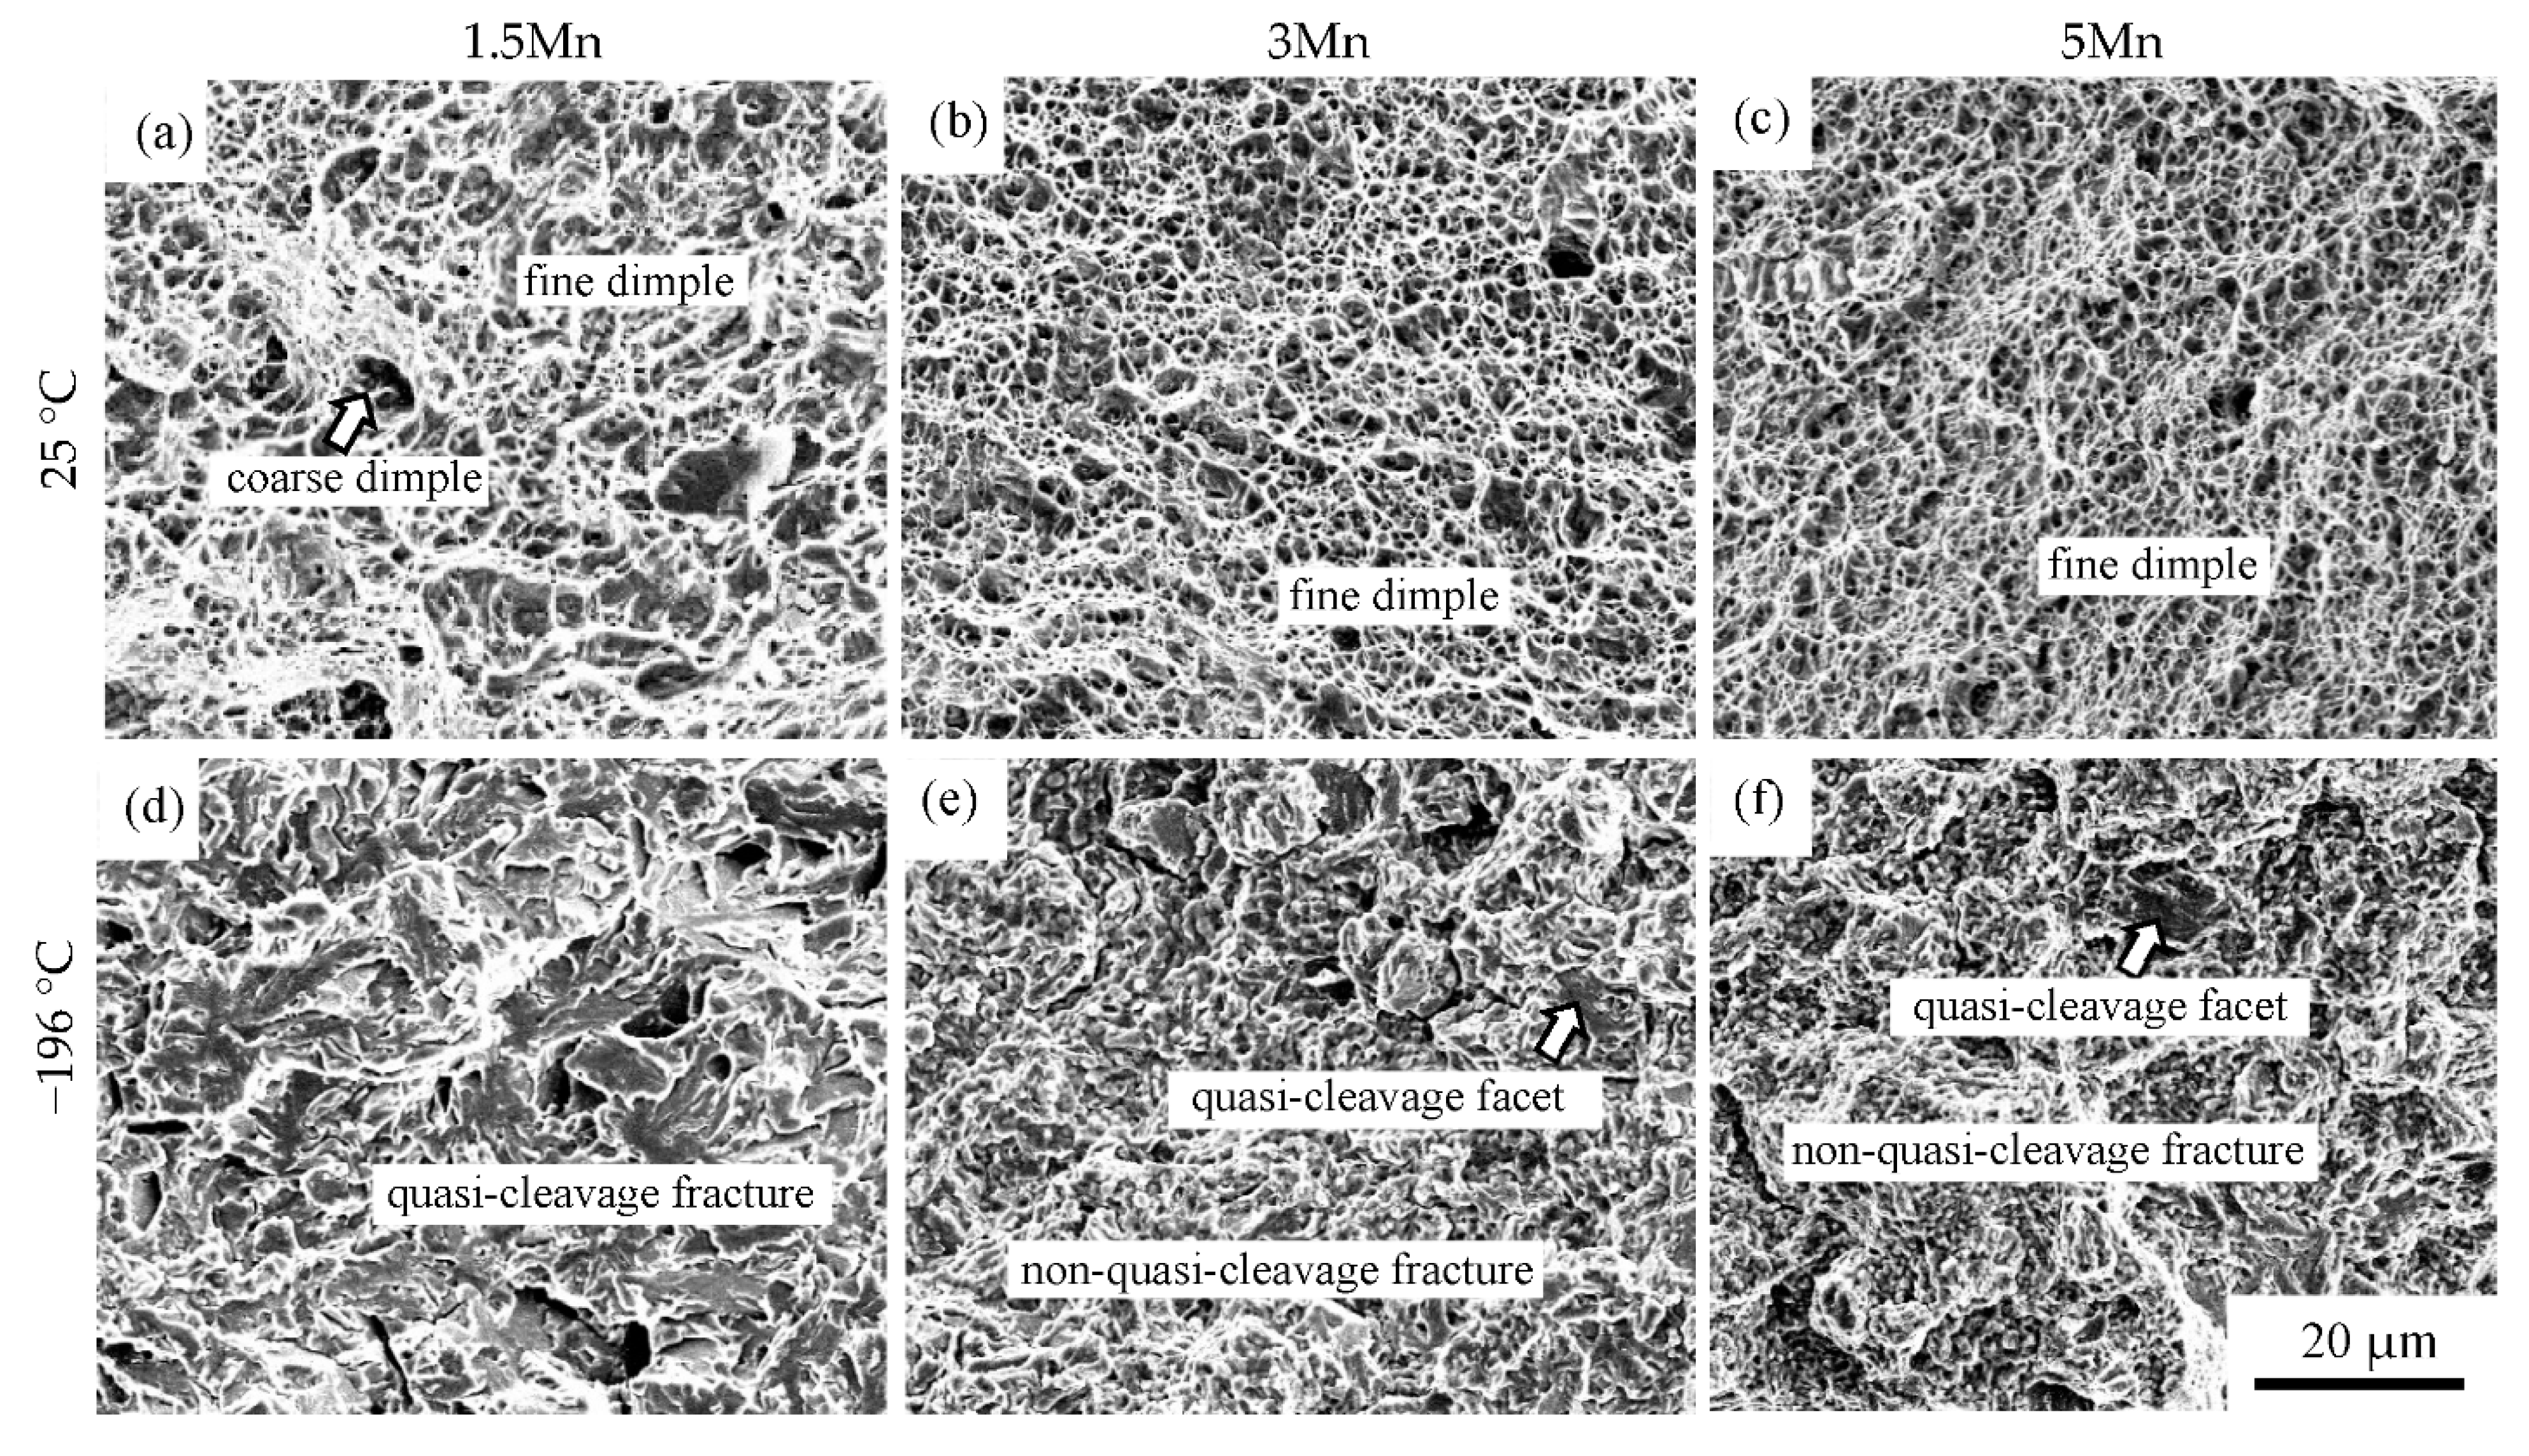
The AC process further raised the DBTT of the 5 Mn steel compared to the IT process. The high DBTT was mainly associated with the further decrease in the thermal and mechanical stability of the reverted austenite, as well as the inter-granular fracture in a brittle fracture temperature range in a similar way as the IT process.

Author Contributions

The first draft of the paper was written by K.-i.S., and the final editing was done by K.-i.S. and H.T. All authors have read and agreed to the published version of the manuscript.

Funding

This research received no external funding.

Institutional Review Board Statement

Not applicable.

Informed Consent Statement

Not applicable.

Data Availability Statement

Not applicable.

Acknowledgments

I thank Junya Kobayashi from Ibaraki University for the kind discussion.

Conflicts of Interest

The author declares no conflict of interest.

References

  1. Rana, R.; Singh, S.B. Automotive Steels—Design, Metallurgy, Processing and Applications; Woodhead Publishing: Cambridge, UK, 2016. [Google Scholar]
  2. Bleck, W.; Guo, X.; Ma, Y. The TRIP effect and its application in cold formable sheet steels. Steel Res. Int. 2017, 88, 1700218. [Google Scholar] [CrossRef]
  3. Ghosh, M.; Bansal, G.; Chandan, A.; Shah, M.; Tripathy, S.; Murugaiyan, P.; Sahoo, B.; Mukherjee, K.; Srivastava, V.C.; Chowdhury, S.G. Functionally driven steels: A review. Steel Tech. 2017, 12, 13–36. [Google Scholar]
  4. Sugimoto, K.; Hojo, T.; Srivastava, A.K. Low and medium carbon advanced high-strength forging steels for automotive applications. Metals 2019, 9, 1263. [Google Scholar] [CrossRef] [Green Version]
  5. Tong, C.; Rong, Q.; Yardley, V.; Li, X.; Luo, J.; Zhu, G.; Shi, Z. New developments and future trends in low-temperature hot stamping technologies: A review. Metals 2020, 10, 1652. [Google Scholar] [CrossRef]
  6. Sugimoto, K.; Hojo, T.; Mizuno, Y. Effects of fine particle peening conditions on the rotational bending fatigue strength of a vacuum-carburized transformation-induced plasticity-aided martensitic Steel. Metall. Mater. Trans. A 2018, 49A, 1552–1560. [Google Scholar] [CrossRef]
  7. Sugimoto, K. Recent progress of low and medium carbon advanced martensitic steels. Metals 2021, 11, 652. [Google Scholar] [CrossRef]
  8. Sugimoto, K.; Tsunezawa, M.; Hojo, T.; Ikeda, S. Ductility of 0.1-0.6C-1.5Si-1.5Mn ultra high-strength TRIP-aided sheet steels with bainitic ferrite matrix. ISIJ Int. 2004, 44, 1608–1614. [Google Scholar] [CrossRef]
  9. Sugimoto, K.; Murata, M.; Song, S. Formability of Al-Nb bearing ultrahigh-strength TRIP-aided sheet steels with bainitic ferrite and/or martensite matrix. ISIJ Int. 2010, 50, 162–168. [Google Scholar] [CrossRef]
  10. Sugimoto, K.; Kobayashi, J.; Pham, D.V. Advanced ultrahigh-strength TRIP-aided martensitic sheet steels for automotive applications. In Proceedings of the New Developments in Advanced High Strength Sheet Steels (AIST 2013), Vail, CO, USA, 23–27 June 2013; pp. 175–184. [Google Scholar]
  11. Pham, D.V.; Kobayashi, J.; Sugimoto, K. Effects of microalloying on stretch-flangeability of TRIP-aided martensitic sheet steel. ISIJ Int. 2014, 54, 1943–1951. [Google Scholar] [CrossRef] [Green Version]
  12. Tian, J.; Xu, G.; Zhou, M.; Hu, H. Refined bainite microstructure and mechanical properties of a high-strength low-carbon bainitic steel. Steel Res. Int. 2018, 89, 1700469. [Google Scholar] [CrossRef]
  13. Navarro-López, A.; Hidalgo, J.; Sietsma, J.; Santofimia, M.J. Influence of the prior athermal martensite on the mechanical response of advanced bainitic steel. Mater. Sci. Eng. A 2018, 735, 343–353. [Google Scholar] [CrossRef]
  14. Speer, J.G.; De Moor, E.; Findley, K.O.; Matlock, B.C.; De Cooman, B.C.; Edmonds, D.V. Analysis of microstructure evolution in quenching and partitioning automotive sheet steel. Metall. Mater. Trans. A 2011, 42A, 3591–3601. [Google Scholar] [CrossRef]
  15. Tan, X.; Xu, Y.; Yang, X.; Wu, D. Microstructure–properties relationship in a one-step quenched and partitioned steel. Mater. Sci. Eng. A 2014, 589, 101–111. [Google Scholar] [CrossRef]
  16. Miller, R.I. Ultrafine-grained microstructures and mechanical properties of alloy steels. Metall. Trans. 1972, 3, 905–912. [Google Scholar] [CrossRef]
  17. Furukawa, T. Dependence of strength-ductility characteristics on thermal history in low carbon, 5 wt-%Mn steels. Mater. Sci. Technol. 1989, 5, 465–470. [Google Scholar] [CrossRef]
  18. Hu, B.; He, B.; Cheng, G.; Yen, H.; Huang, M.; Luo, H. Super-high-strength and formable medium Mn steel manufactured by warm rolling process. Acta Mater. 2019, 174, 131–141. [Google Scholar] [CrossRef]
  19. Su, G.; Gao, X.; Zhang, D.; Du, L.; Hu, J.; Liu, Z. Impact of reverted austenite on the impact toughness of the high-strength steel of low carbon medium manganese. JOM 2018, 70, 672–679. [Google Scholar] [CrossRef]
  20. Cao, W.; Wang, C.; Shi, J.; Wang, M.; Hui, W.; Dong, D. Microstructure and mechanical properties of Fe–0.2C–5Mn steel processed by ART-annealing. Mater. Sci. Eng. A 2011, 528, 6661–6666. [Google Scholar] [CrossRef]
  21. Tanino, H.; Horita, M.; Sugimoto, K. Impact toughness of 0.2 pct-1.5 pct-(1.5 to 5) pct Mn transformation-induced plasticity-aided steels with an annealed martensite matrix. Metall. Mater. Trans. A 2016, 47A, 2073–2080. [Google Scholar] [CrossRef]
  22. Hanamura, T.; Torizuka, S.; Tamura, S.; Enokida, S.; Takechi, H. Effect of austenite grain size on transformation behavior, microstructure and mechanical properties of 0.1C-5Mn martensitic steel. ISIJ Int. 2013, 53, 2218–2225. [Google Scholar] [CrossRef] [Green Version]
  23. Sugimoto, K.; Tanino, H.; Kobayashi, J. Impact toughness of medium-Mn transformation-induced plasticity-aided steels. Steel Res. Int. 2015, 86, 1151–1160. [Google Scholar] [CrossRef]
  24. Maeda, T.; Okuhara, S.; Matsuda, K.; Matsumura, T.; Tsuchiyama, T.; Shirahata, H.; Kawamoto, Y.; Fujioka, M. Toughening mechanism in 5%Mn and 10%Mn martensitic steels treated by thermo-mechanical control process. Mater. Sci. Eng. A 2021, 812, 141058. [Google Scholar] [CrossRef]
  25. Cao, W.; Zhang, M.; Huang, C.; Xiao, S.; Dong, H.; Weng, Y. Ultrahigh Charpy impact toughness (-450J) achieved in high strength ferrite/martensite laminated steels. Sci. Rep. 2017, 7, 41459. [Google Scholar] [CrossRef] [Green Version]
  26. Liu, L.; Yu, Q.; Wang, Z.; Ell, J.; Huang, M.X.; Ritchie, R.O. Making ultrastrong steel tough by grain-boundary delamination. Science 2020, 368, 1347–1352. [Google Scholar] [CrossRef]
  27. Zou, Y.; Xu, Y.; Hu, Z.; Gu, X.; Peng, F.; Tan, X.; Chen, S.; Han, D.; Misra, R.D.K.; Wang, G. Austenite stability and its effect on the toughness of a high strength ultra-low carbon medium manganese steel plate. Mater. Sci. Eng. A 2016, 675, 153–163. [Google Scholar] [CrossRef]
  28. Qi, X.; Du, L.; Hu, J.; Misra, R.D.K. Effect of austenite stability on toughness, ductility, and work-hardening of medium-Mn steel. Mater. Sci. Technol. 2019, 35, 2134–2142. [Google Scholar] [CrossRef]
  29. Su, G.; Gao, X.; Yan, T.; Zhang, D.; Cui, C.; Du, L.; Liu, Z.; Tang, Y.; Hu, J. Intercritical tempering enables nanoscale austenite/e-martensite formation in low-C medium-Mn steel: A pathway to control mechanical properties. Mater. Sci. Eng. A 2018, 736, 417–430. [Google Scholar] [CrossRef]
  30. Torizzo, Q.; Maziere, M.; Perlade, A.; Gourgues-Lorenzon, A.-F. Effect of austenite stability on the fracture micromechanisms and ductile-to-brittle transition in a medium-Mn, ultra-fine-grained for automotive applications. J. Mater. Sci. 2020, 55, 9245–9257. [Google Scholar]
  31. Gramlich, A.; Emmrich, R.; Bleck, W. Austenite reversion tempering-annealing of 4 wt.% manganese steels for automotive forging application. Metals 2019, 9, 575. [Google Scholar] [CrossRef] [Green Version]
  32. Chang, Y.; Wang, C.; Zhao, K.; Dong, H.; Yan, J. An introduction to medium-Mn steel: Metallurgy, mechanical properties and warm stamping process. Mater. Des. 2016, 94, 424–432. [Google Scholar] [CrossRef]
  33. Maruyama, H. X-ray measurement of retained austenite. Jpn. Soc. Heat Treat. 1977, 17, 198–204. [Google Scholar]
  34. Dyson, D.J.; Holmes, B. Effect of alloying additions on the lattice parameter of austenite. J. Iron Steel Inst. 1970, 208, 469–474. [Google Scholar]
  35. Sugimoto, K.; Usui, N.; Kobayashi, M.; Hashimoto, S. Effects of volume fraction and stability of retained austenite on ductility of TRIP-aided dual-phase steels. ISIJ Int. 1992, 32, 1311–1318. [Google Scholar] [CrossRef]
  36. Sugimoto, K.; Hidaka, S.; Tanino, H.; Kobayashi, J. Effects of Mn content on the warm stretch-flangeability of C-S-Mn TRIP-aided steels. Steel Res. Int. 2017, 83, 1600482. [Google Scholar] [CrossRef]
  37. Zambrano, O.A. Stacking fault energy maps of Fe-Mn-Al-C-Si steels: Effect of temperature, grain size and variations in compositions. J. Eng. Mater. Technol. 2016, 138, 041010. [Google Scholar] [CrossRef]
  38. Nakano, J.; Jacques, P.J. Effects of the thermodynamic parameters of the hcp phase on the stacking fault energy calculations in the Fe-Mn and Fe-Mn-C systems. Calphad 2010, 34, 167–175. [Google Scholar] [CrossRef]
  39. Kobayashi, J.; Ina, D.; Nakajima, Y.; Sugimoto, K. Effects of microalloying on the impact toughness of ultrahigh-strength TRIP-aided martensitic steels. Metall. Mater. Trams. A 2013, 44A, 5006–5017. [Google Scholar] [CrossRef] [Green Version]
  40. Nasim, M.; Edwards, B.C.; Wilson, E.A. A study of grain boundary embrittlement in an Fe-8%Mn alloy. Mater. Sci. Eng. A 2000, 281, 56–67. [Google Scholar] [CrossRef]
  41. Heo, N.; Nam, J.; Heo, Y.; Kim, S. Grain boundary embrittlement by Mn and eutectoid reaction in binary Fe-12Mn steel. Acta Mater. 2013, 61, 4022–4034. [Google Scholar] [CrossRef]
  42. Kuzmina, M.; Ponge, D.; Raabe, D. Grain boundary segregation engineering and austenite reversion turn embrittlement into toughness: Example of a 9wt.% medium Mn steel. Acta Mater. 2015, 86, 182–192. [Google Scholar] [CrossRef]
  43. Yamanaka, K.; Kowaka, M. Mechanical properties and fracture behavior of Fe-Mn alloys. J. Jpn. Inst. Met. 1979, 43, 1151–1157. [Google Scholar] [CrossRef] [Green Version]
  44. Tanaka, M.; Maeno, K.; Yoshimura, N.; Hoshino, M.; Uemori, R.; Ushioda, K.; Higashida, K. Effect of Mn addition on a brittle-to-ductile transition in ferritic steels. Tetsu Hagane 2014, 100, 1267–1273. [Google Scholar] [CrossRef] [Green Version]
  45. Kunitake, T.; Terasaki, F.; Ohmori, Y.; Ohtani, H. The Effect of Transformation Structures on the Toughness of Quenched-and-Tempered Low-Carbon Low-Alloy Steels. Toward Improved Ductility and Toughness; Climax Molybdenum Development Company Ltd.: Kyoto, Japan, 1971; pp. 83–100. (In Japanese) [Google Scholar]
Figure 1. CCT diagrams of the 1.5 Mn, 3 Mn and 5 Mn steels. “A”, “F”, “P”, “B” are austenite, ferrite, pearlite, bainite, and martensite, respectively.
Metals 11 01143 g001
Figure 2. Heat treatment diagram of the AC and IT processes in the 1.5 Mn (black line), 3 Mn (blue line), and 5 Mn (red line) steels. OQ: quenching in an oil bath (53.5 °C/s), SQ: quenching in a salt bath (24.0 °C/s), AC: air cooling (1.2 °C/s).
Metals 11 01143 g002
Figure 3. Phase maps of SEM-EBSD in the 1.5 Mn, 3 Mn and 5 Mn steels subjected to (ac) the AC and (df) IT processes. Green and red phases denote annealed martensite (αam) and reverted austenite (γR), respectively. “MA” represents the martensite-austenite phase. Average lath sizes of annealed martensite in the 1.5 Mn, 3 Mn, and 5 Mn steels subjected to the AC and IT processes are 4.3 μm, 3.1 μm, and 2.4 μm, respectively.
Metals 11 01143 g003
Figure 4. Variations in (a) initial volume fraction (fγ0), (b) initial carbon concentration (Cγ0), and (c) strain-induced transformation factor (k) of reverted austenite as a function of Mn content in the steels subjected to the AC (●) and IT () processes after intercritical annealing.
Metals 11 01143 g004
Figure 5. Variations in volume fraction of reverted austenite with cooling and heating temperature (Tch) in the 1.5 Mn, 3 Mn, and 5 Mn steels subjected to (a) the AC and (b) IT processes. (i) and (ii) in (a) represent the decreases of reverted austenite by ε-martensite transformation [36] and bainite transformation (or decomposition into ferrite and carbide) [35], respectively. (b) is reprinted with permission from Wily-VCH GmbH, Weinheim: Steel Res. Int., Copyright 2021.
Metals 11 01143 g005
Figure 6. Engineering stress–strain (σ-ε) curves of (a) overall and (b) early strain ranges in the 1.5 Mn, 3 Mn, and 5 Mn steels subjected to the AC (thick lines) and IT (thin lines) processes.
Metals 11 01143 g006
Figure 7. Variations in (a) yield stress or 0.2% offset proof stress (YS) and tensile strength (TS), (b) uniform and total elongations (UEl and TEl), and (c) the product of TS and TEl (TS × TEl) as a function of Mn content in the steels subjected to the AC (●) and IT () processes after intercritical annealing.
Metals 11 01143 g007
Figure 8. Variations in (a) Charpy V-notch impact value (Ev) and (b) the product of tensile strength and Ev (TS × Ev) at Tt = 25 °C (circle marks) and 100 °C (triangle marks) and (c) 50% shear fracture ductile-brittle transition temperature (DBTT) as a function of Mn content in the steels subjected to the AC (●▲) and IT (○△) processes. In (b), (i) and (ii) represent the contributions of mechanical stability and volume fraction of reverted austenite, respectively.
Metals 11 01143 g008
Figure 9. Impact load-displacement (P-δ) curves at Tt = 25 °C of (a) the 1.5 Mn, (b) 3 Mn, and (c) 5 Mn steels subjected to the AC (thick lines) and IT (thin lines) processes. Ei and Ep are crack-initiation and propagation energies, respectively, where Ei + Ep = Ev.
Metals 11 01143 g009
Figure 10. Variations in (a) Charpy V-notch impact value (Ev) at Tt = 25 °C and 100 °C and (b) ductile-brittle transition temperature (DBTT) with tensile strength (TS) in the 1.5 Mn, 3 Mn, and 5 Mn steels subjected to the AC (solid marks) and IT (open marks) processes. Metals 11 01143 i005
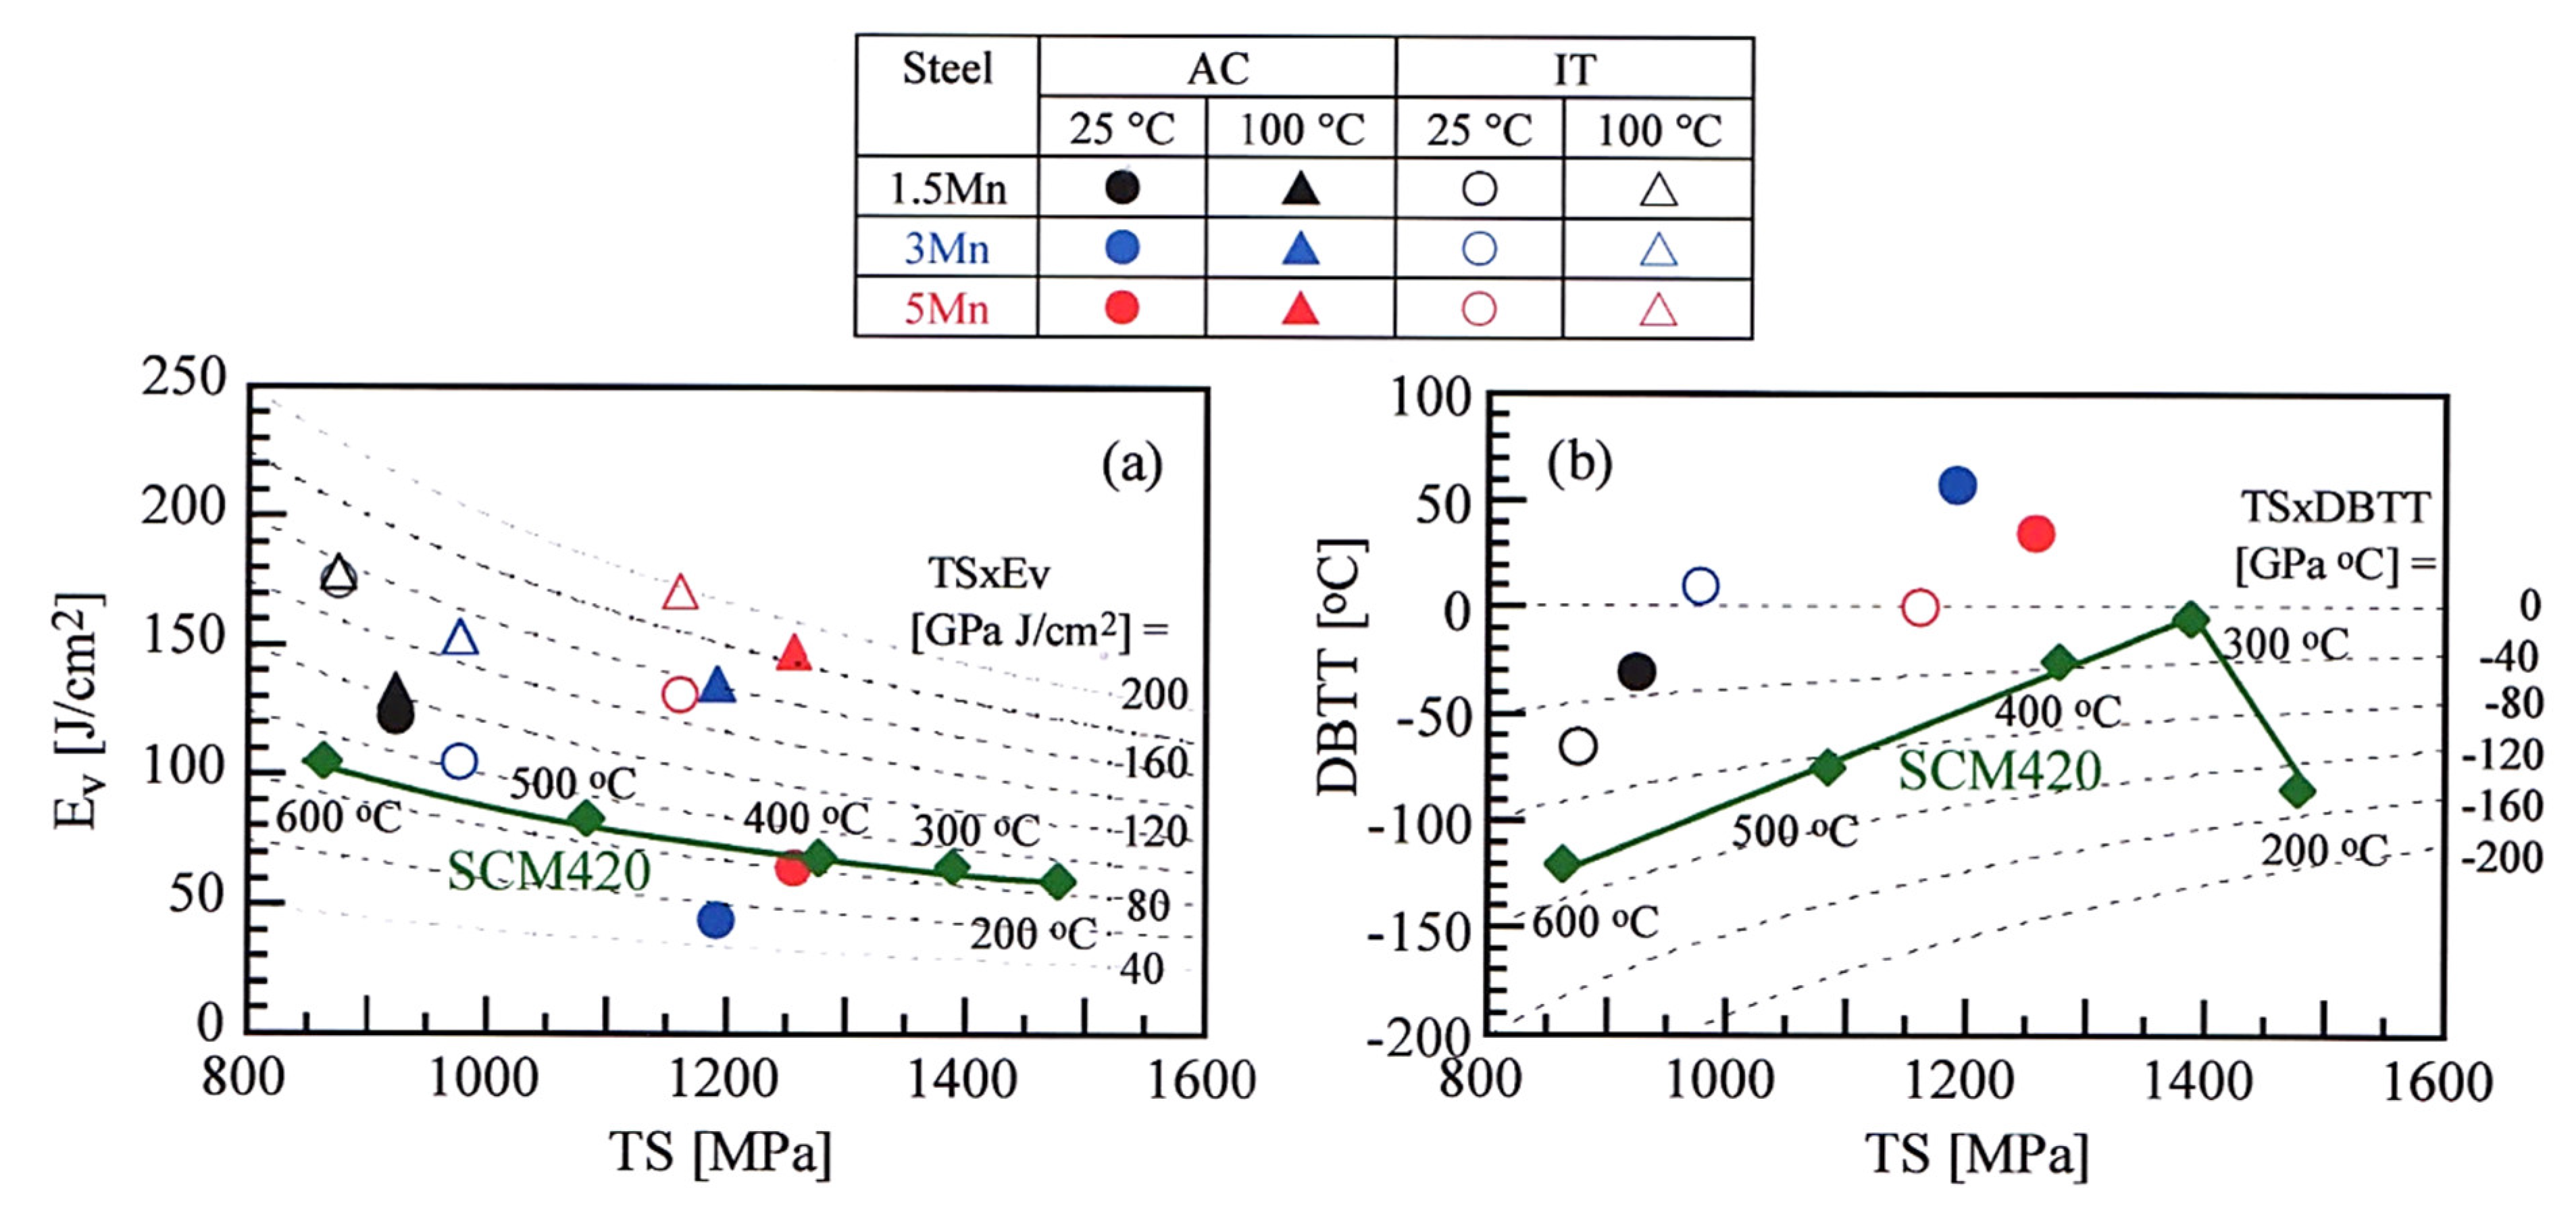
: Ev at Tt = 25 °C and DBTT of JIS-SCM420 steel (0.21%C-0.21%Si-0.77%Mn-1.0%Cr-0.2%Mo) quenched and tempered at 200 °C to 600 °C [7,21]. This figure is reproduced based on Ref. [21]. Copyright permission obtained.
Metals 11 01143 g010
Figure 11. Variations in Charpy V-notch impact value (Ev) with impact test temperature (Tt) in the 1.5 Mn, 3 Mn, and 5 Mn steels subjected to (a) the AC and (b) IT processes. (b) is reprinted with permission from Spring Nature: Metall. Mater. Trans. A, Copyright 2021.
Metals 11 01143 g011
Figure 12. SEM images of fracture surface in the 1.5 Mn, 3 Mn, and 5 Mn steels subjected to the AC process after impact tests at (ac) 25 °C and (df) −196 °C.
Metals 11 01143 g012
Figure 13. Variations in k-value with tensile test temperature (Tt) in the 1.5 Mn, 3 Mn and 5 Mn steels subjected to the IT process [36]. “SIMT” and “SIBT” represent the strain-induced martensite and bainite transformation, respectively. Reprinted with permission from Wily-VCH GmbH, Weinheim: Steel Res. Int., Copyright 2021.
Metals 11 01143 g013
Figure 14. Brittle fracture morphology at −196 °C appeared on the fracture surface of impact tested samples of (a) the 1.5 Mn and (b) 5 Mn steels subjected to the AC and IT processes. The 3 Mn steel shows the intermediate fracture mode in which quasi-cleavage fracture and inter-granular fracture are coexisting.
Metals 11 01143 g014
Figure 15. Relationship between 50% shear fraction ductile-brittle transition temperature (DBTT) and unit crack path (dp) for the 1.5 Mn (●), 3 Mn ( Metals 11 01143 i001 Metals 11 01143 i002), and 5 Mn ( Metals 11 01143 i003 Metals 11 01143 i004
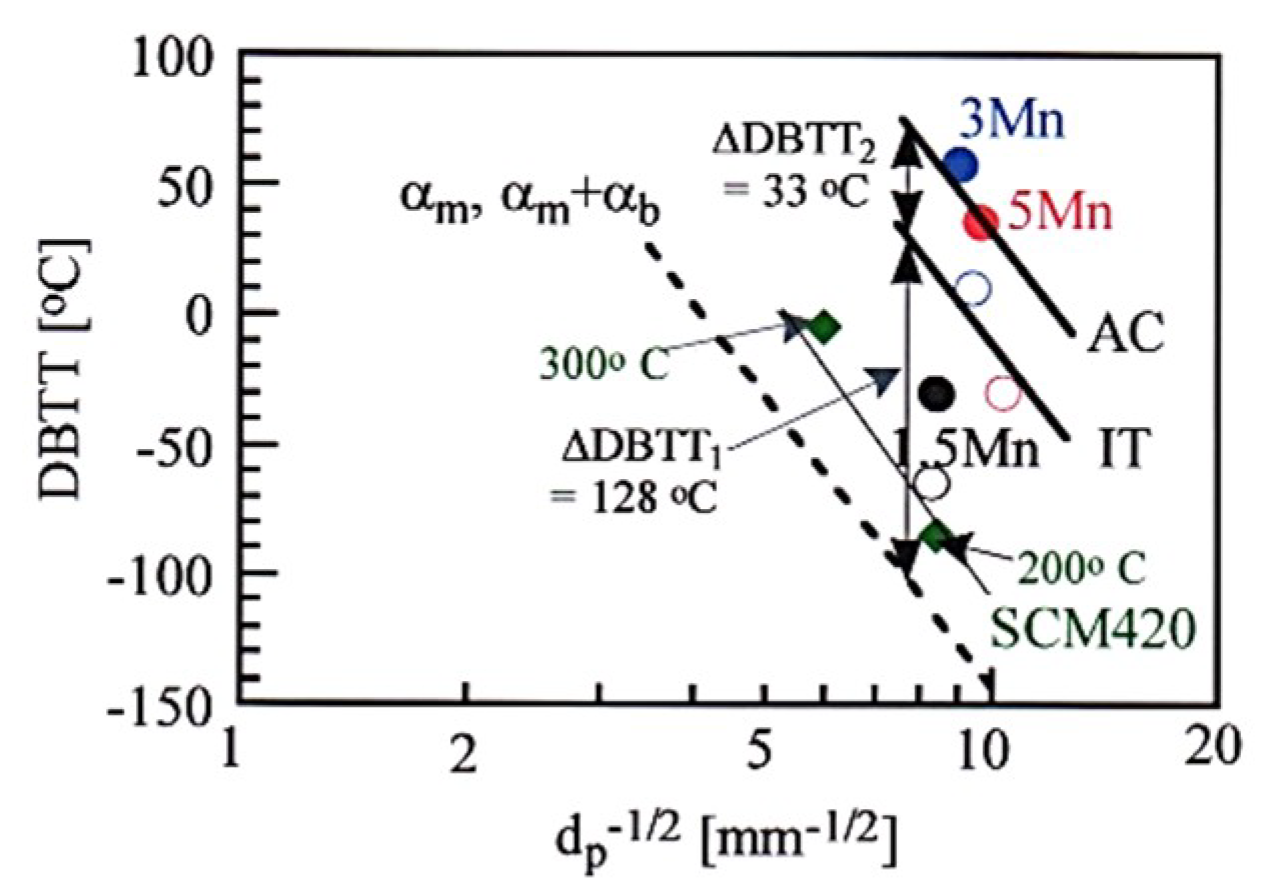
) steels subject to the AC (solid marks) and IT (open marks) processes and JIS-SCM420 ( Metals 11 01143 i005) steel quenched and then tempered at 200 °C and 300 °C. A dotted line represents the DBTT of 0.12%C-0.30%Si-0.83%Mn-0.30%Cu-1.11%Ni-0.53%Cr-0.49%Mo-0.03%V steel with the microstructure of martensitic (αm) or martensitic/bainitic (αm + αb) structures [45]. This figure is reproduced based on Ref. [21]. Copyright obtained.
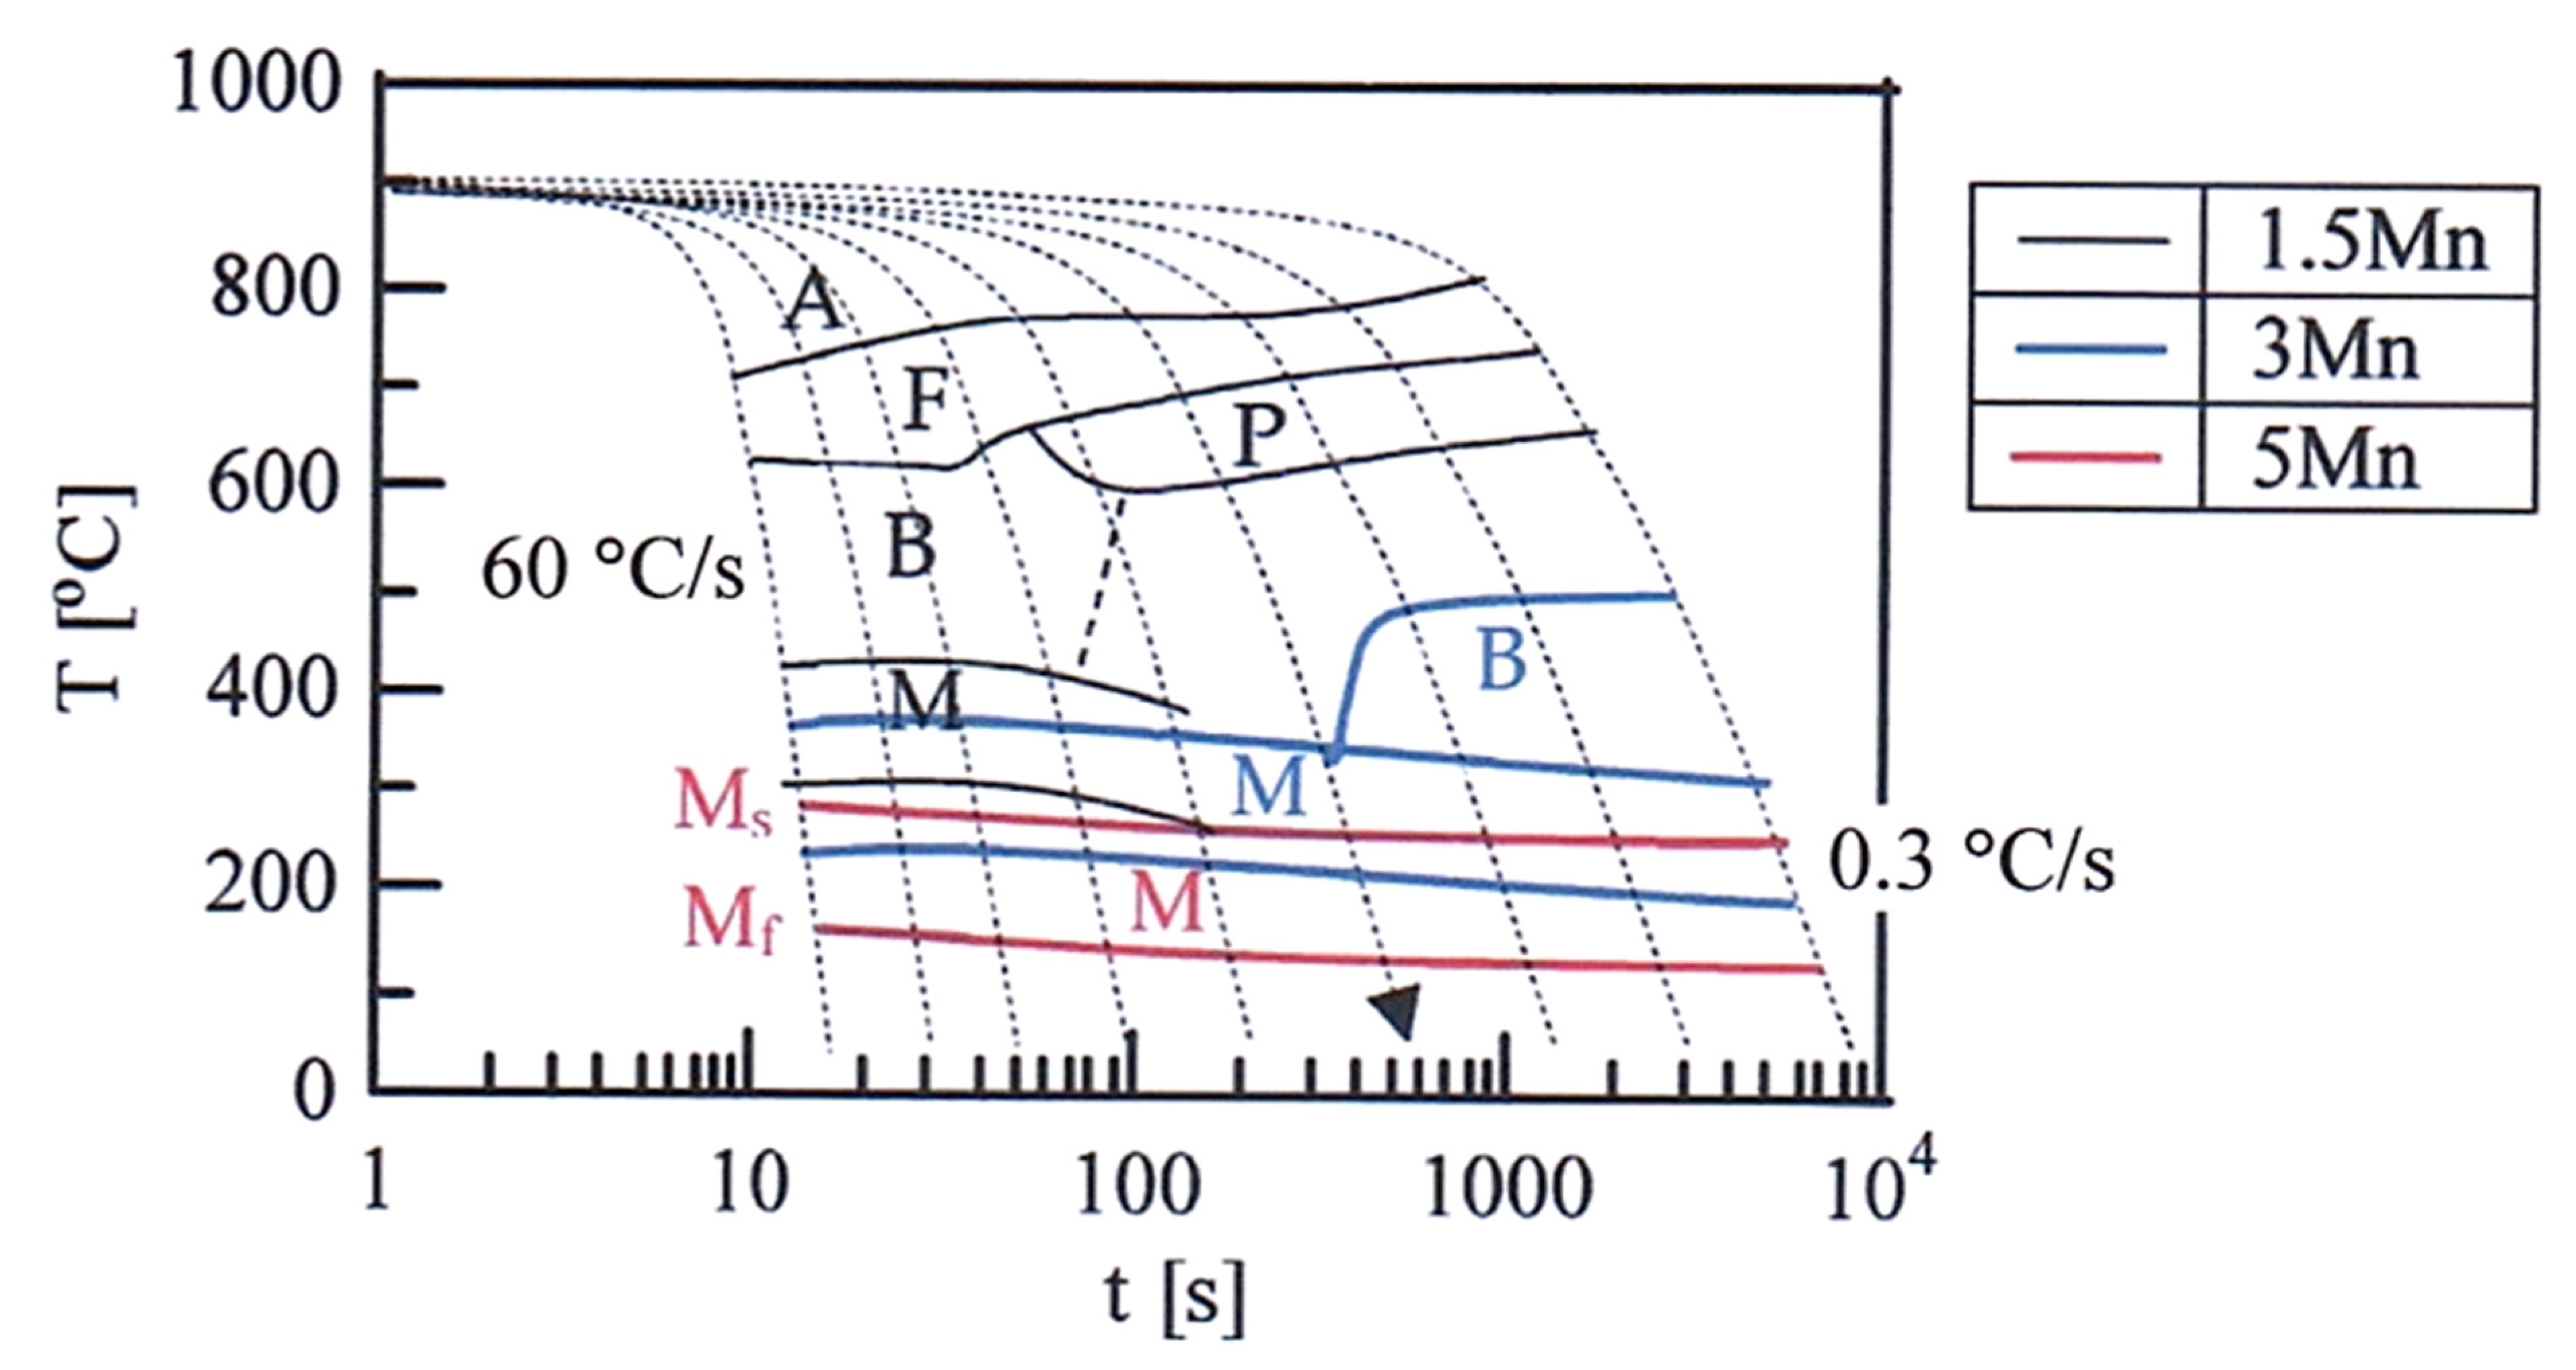
Metals 11 01143 g015
Table 1. Chemical composition (mass %) and austenite-start and -finish temperatures and martensite-start and -finish temperatures (Ac1, Ac3, Ms, and Mf in °C) of steels used.
SteelCSiMnPSAlNOAc1Ac3MsMf
1.5 Mn0.201.491.500.0060.00150.0350.0038<0.001719847420300
3 Mn0.201.522.980.0060.00160.0370.0034<0.001689797363220
5 Mn0.211.504.940.0050.00160.0320.0020<0.001657741282150
Table 2. Reverted austenite characteristics, tensile properties at 25 °C and impact toughness properties of the 1.5 Mn, 3 Mn, and 5 Mn steels subjected to the AC and IT processes.
ProcessSteelfγ0Cγ0kYSTSUElTElRATS × TElEv (1)Ev (2)DBTT
1.5 Mn14.10.7210.341592425.733.848.131.2123132−30
AC3 Mn24.80.5523.4320119220.822.434.825.14413560
5 Mn38.50.4612.1710125632.036.829.746.26414835
1.5 Mn11.40.955.050087522.232.457.328.3175178−65
IT3 Mn17.30.6815.349597721.428.359.627.610515310
5 Mn36.20.529.4680116135.741.652.148.3131171−30
fγ0 [vol. %]: initial volume fraction of reverted austenite, Cγ0 [mass %]: initial carbon concentration of reverted austenite, k: strain-induced transformation factor, YS [MPa]: yield stress or 0.2% offset proof stress, TS [MPa]: tensile strength, UEl [%]: uniform elongation, TEl [%]: total elongation, RA [%]: reduction of area, Ev [J/cm2]: Charpy V-notch impact value at 25 °C (1) and 100 °C (2), DBTT [°C]: ductile-brittle transition temperature.
Publisher’s Note: MDPI stays neutral with regard to jurisdictional claims in published maps and institutional affiliations.

