
Behavior of Nitrogen in GH4169 Superalloy Melt during Vacuum Induction Melting Using Returned Materials


Abstract
:1. Introduction
2. Experimental Process and Methods
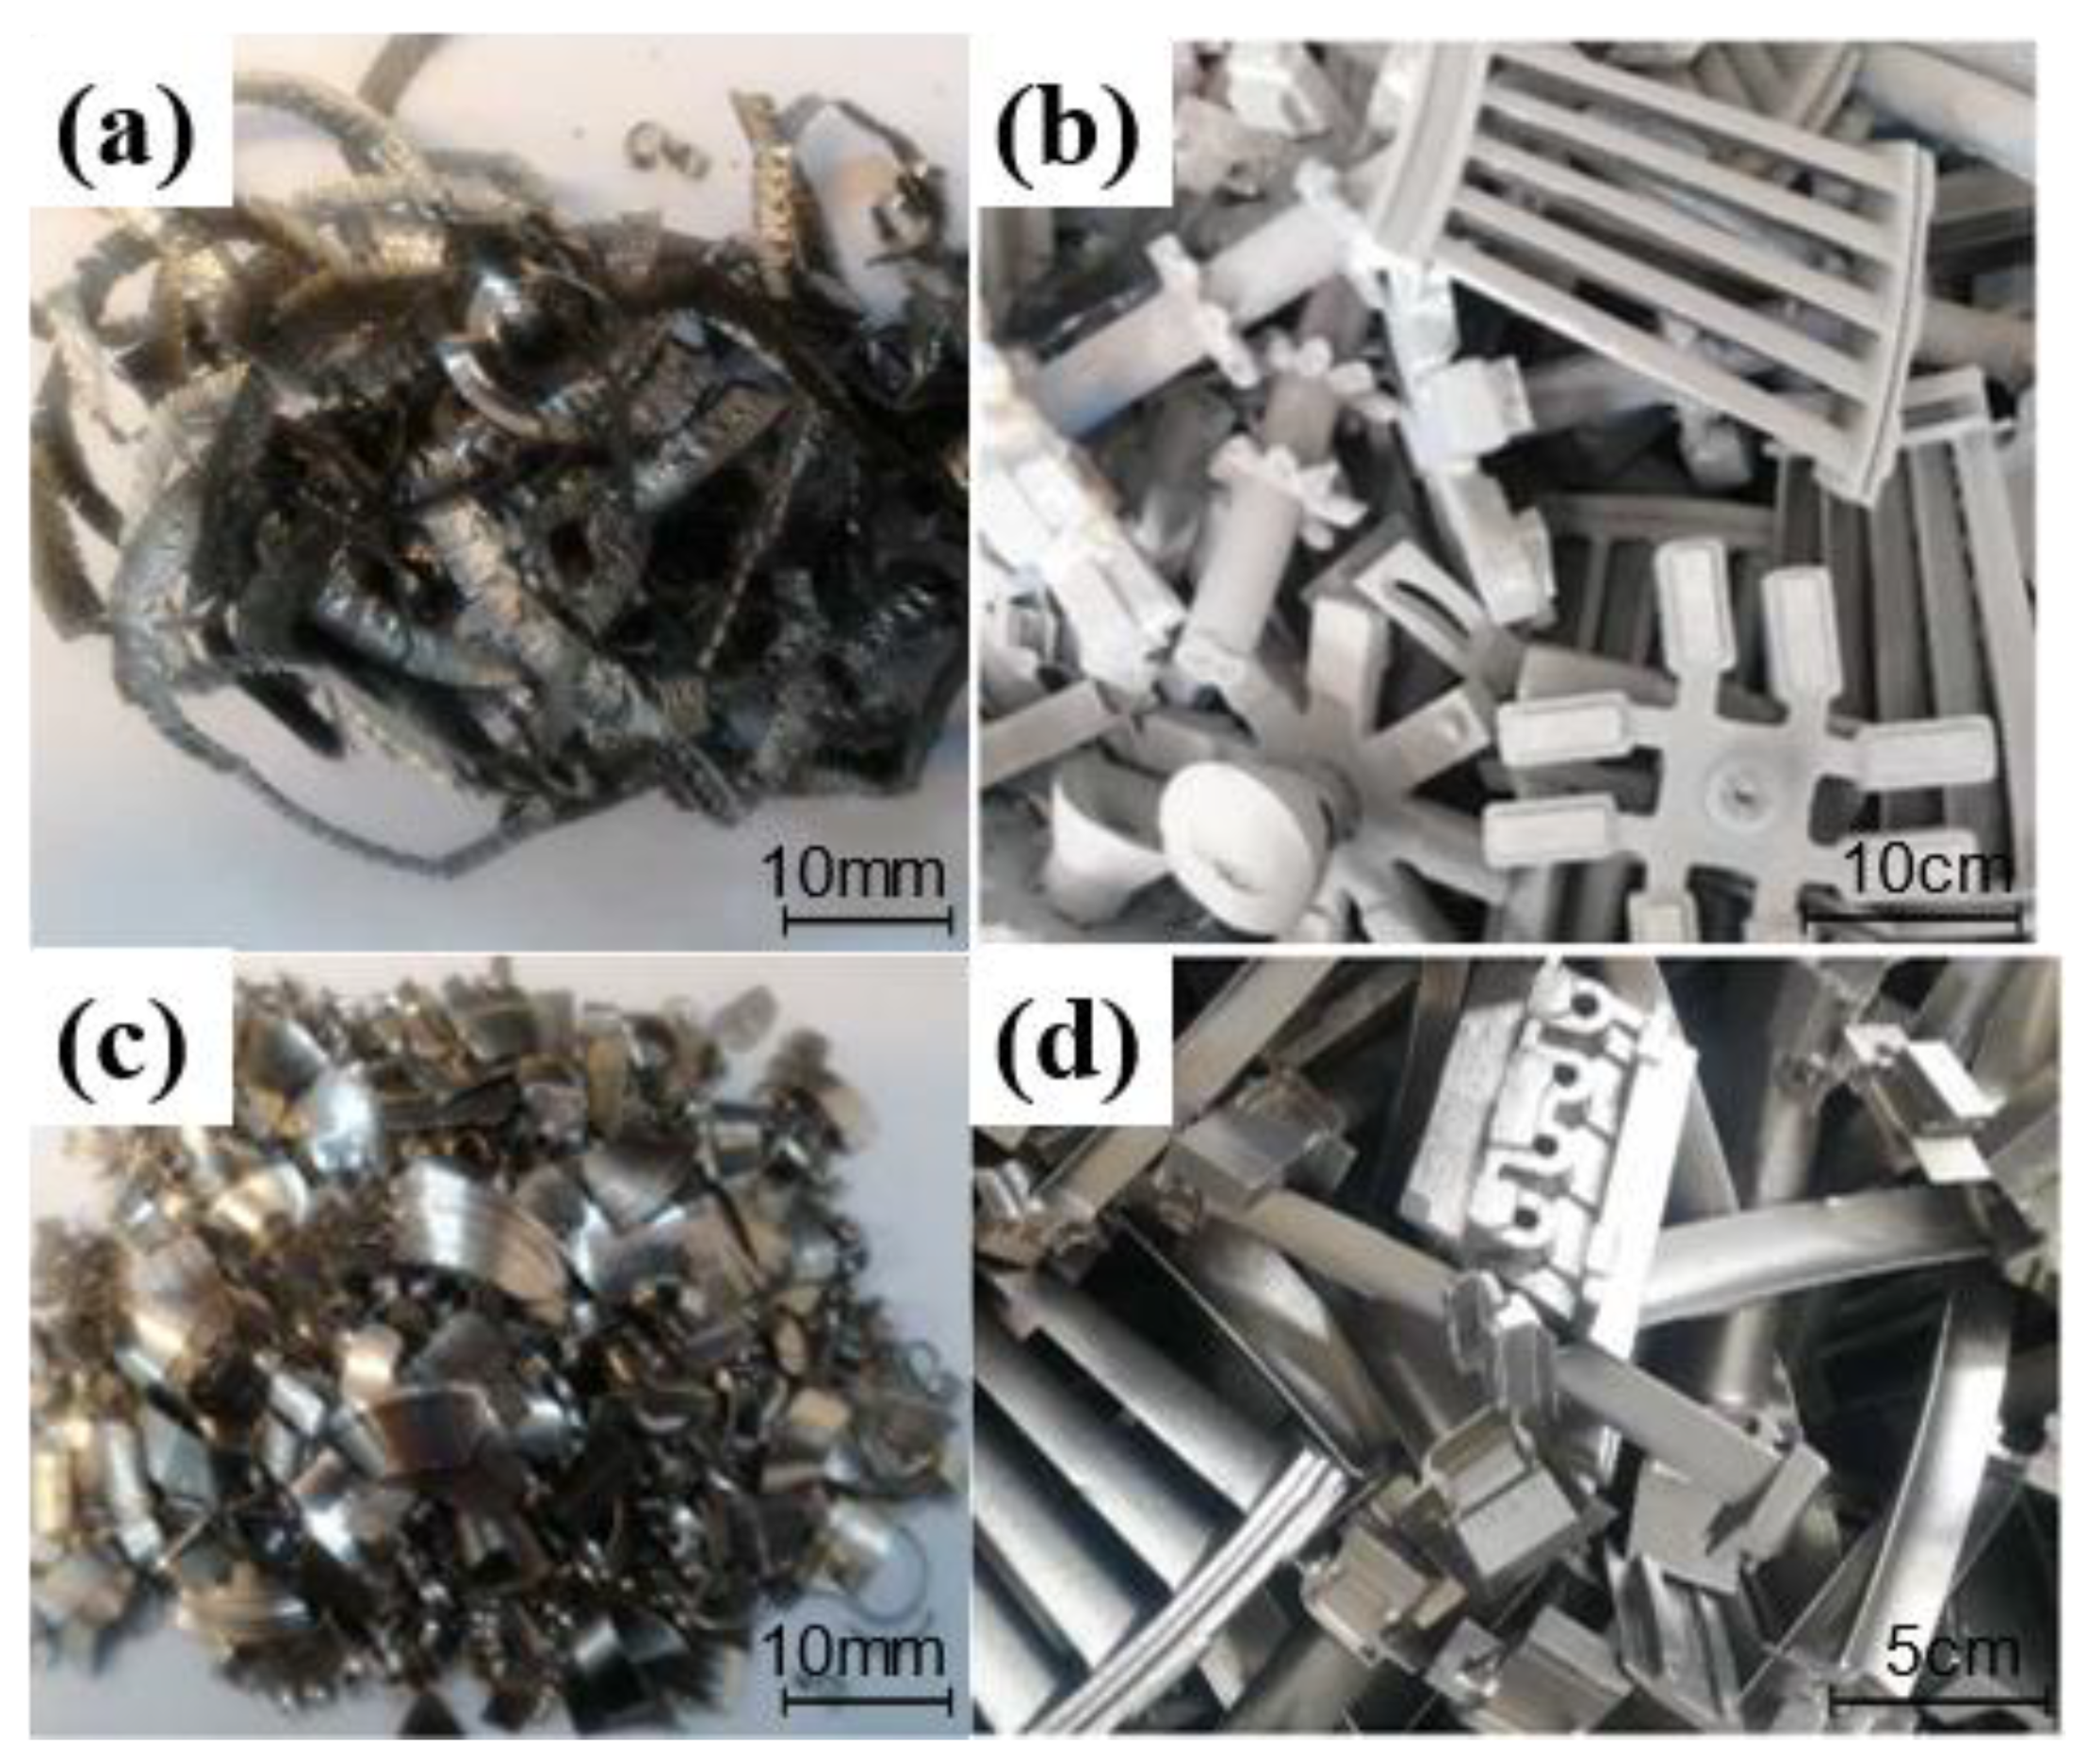
2.1. Material Preparation
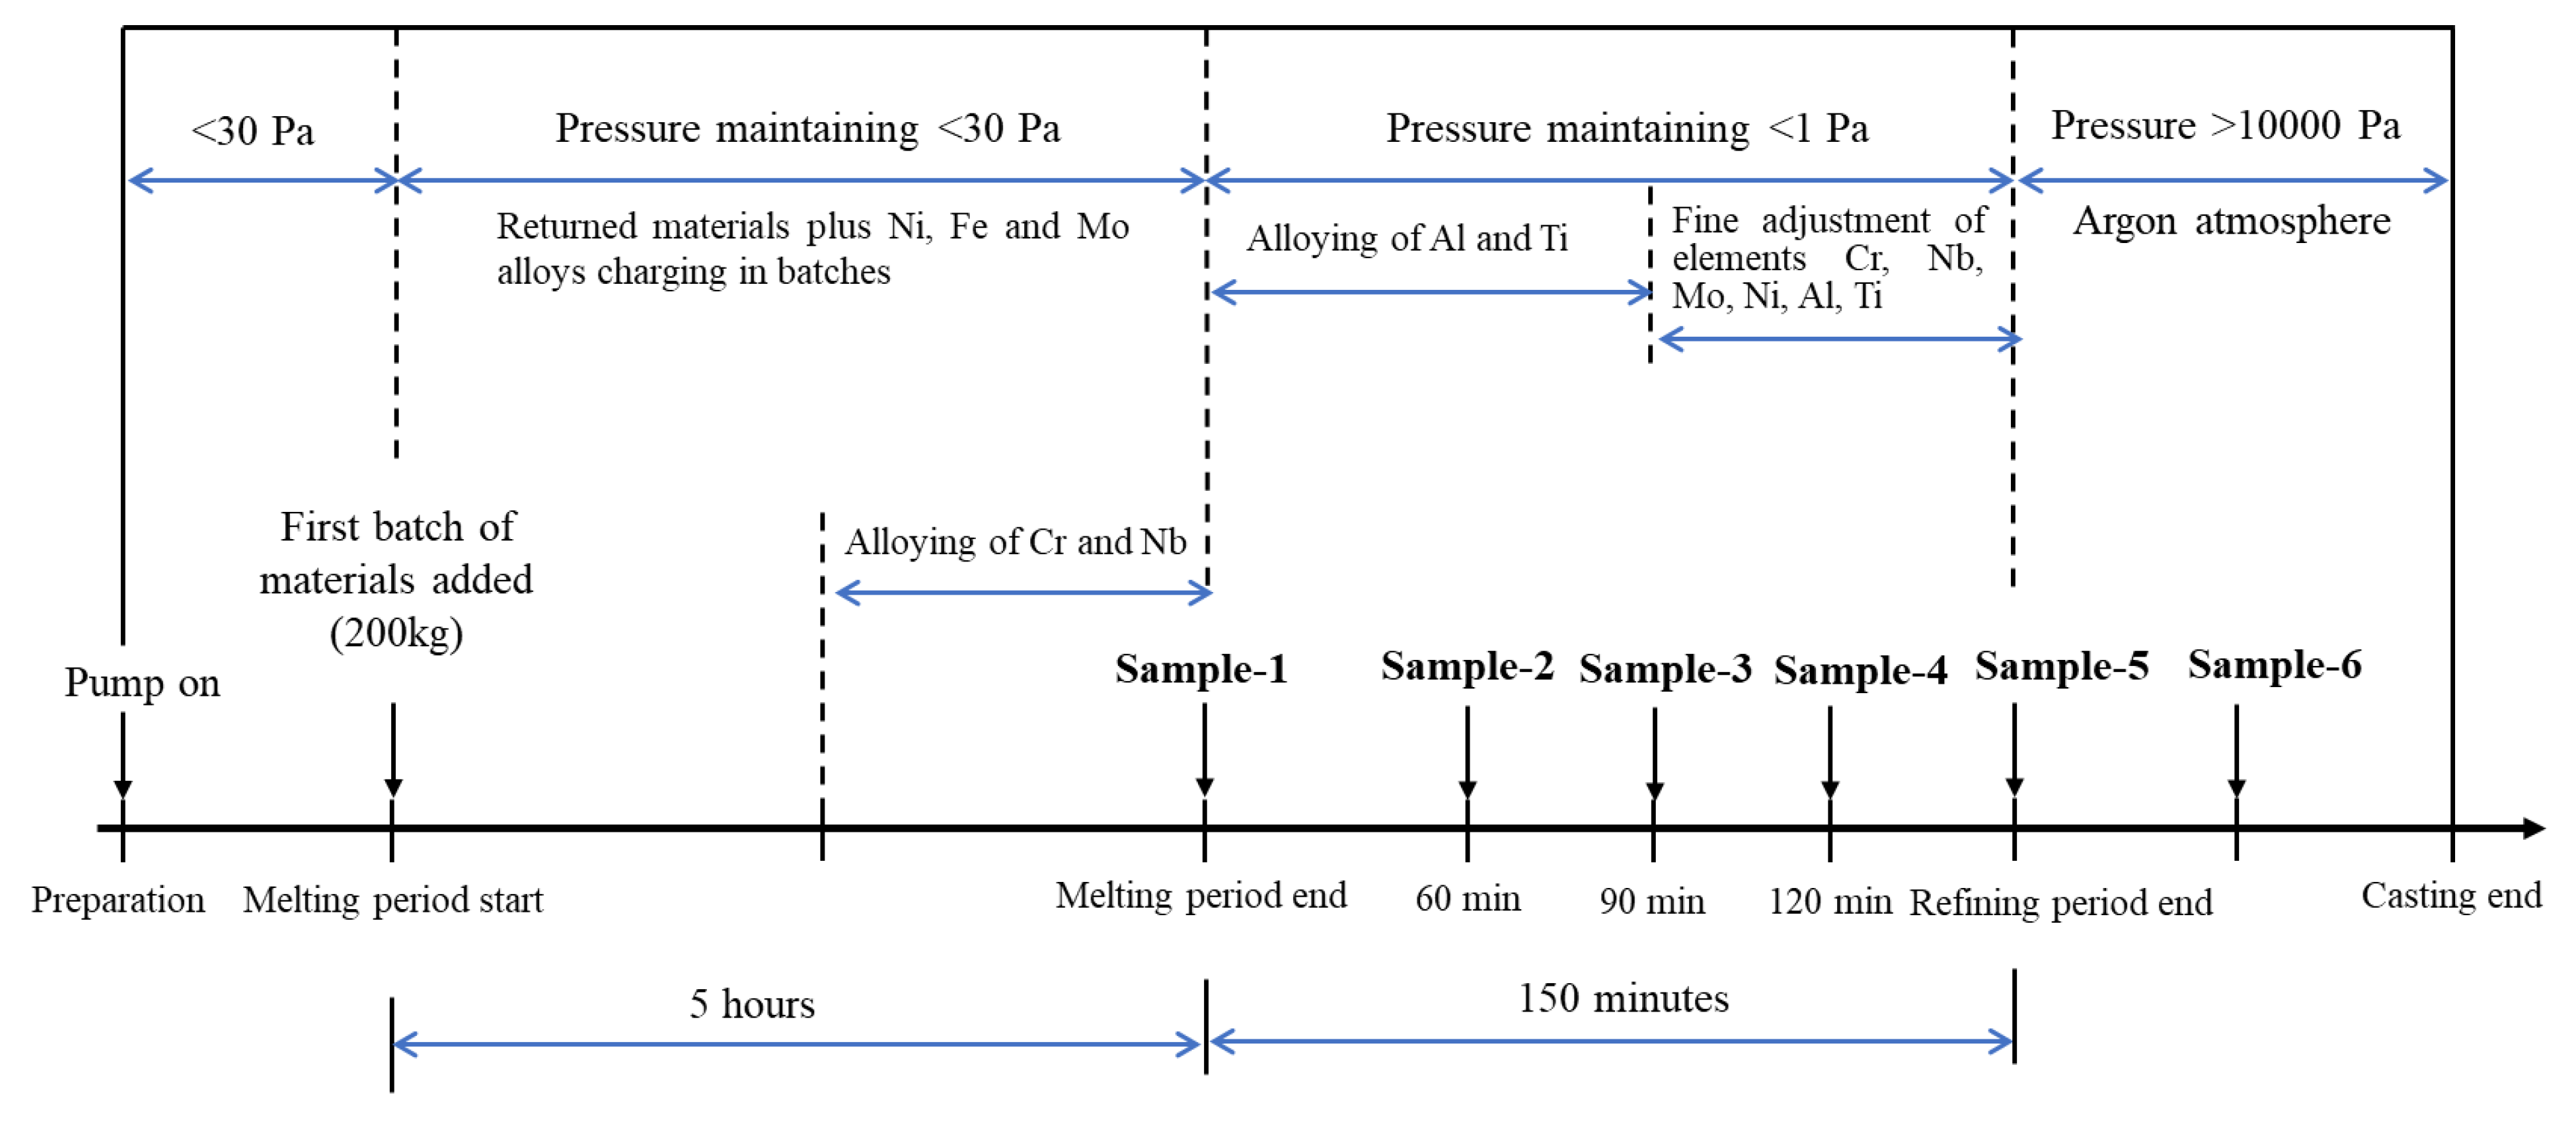
2.2. Experimental Procedure
3. Results and Discussion
3.1. Operation Curves and Chemical Composition of Superalloy Melt during Smelting Process
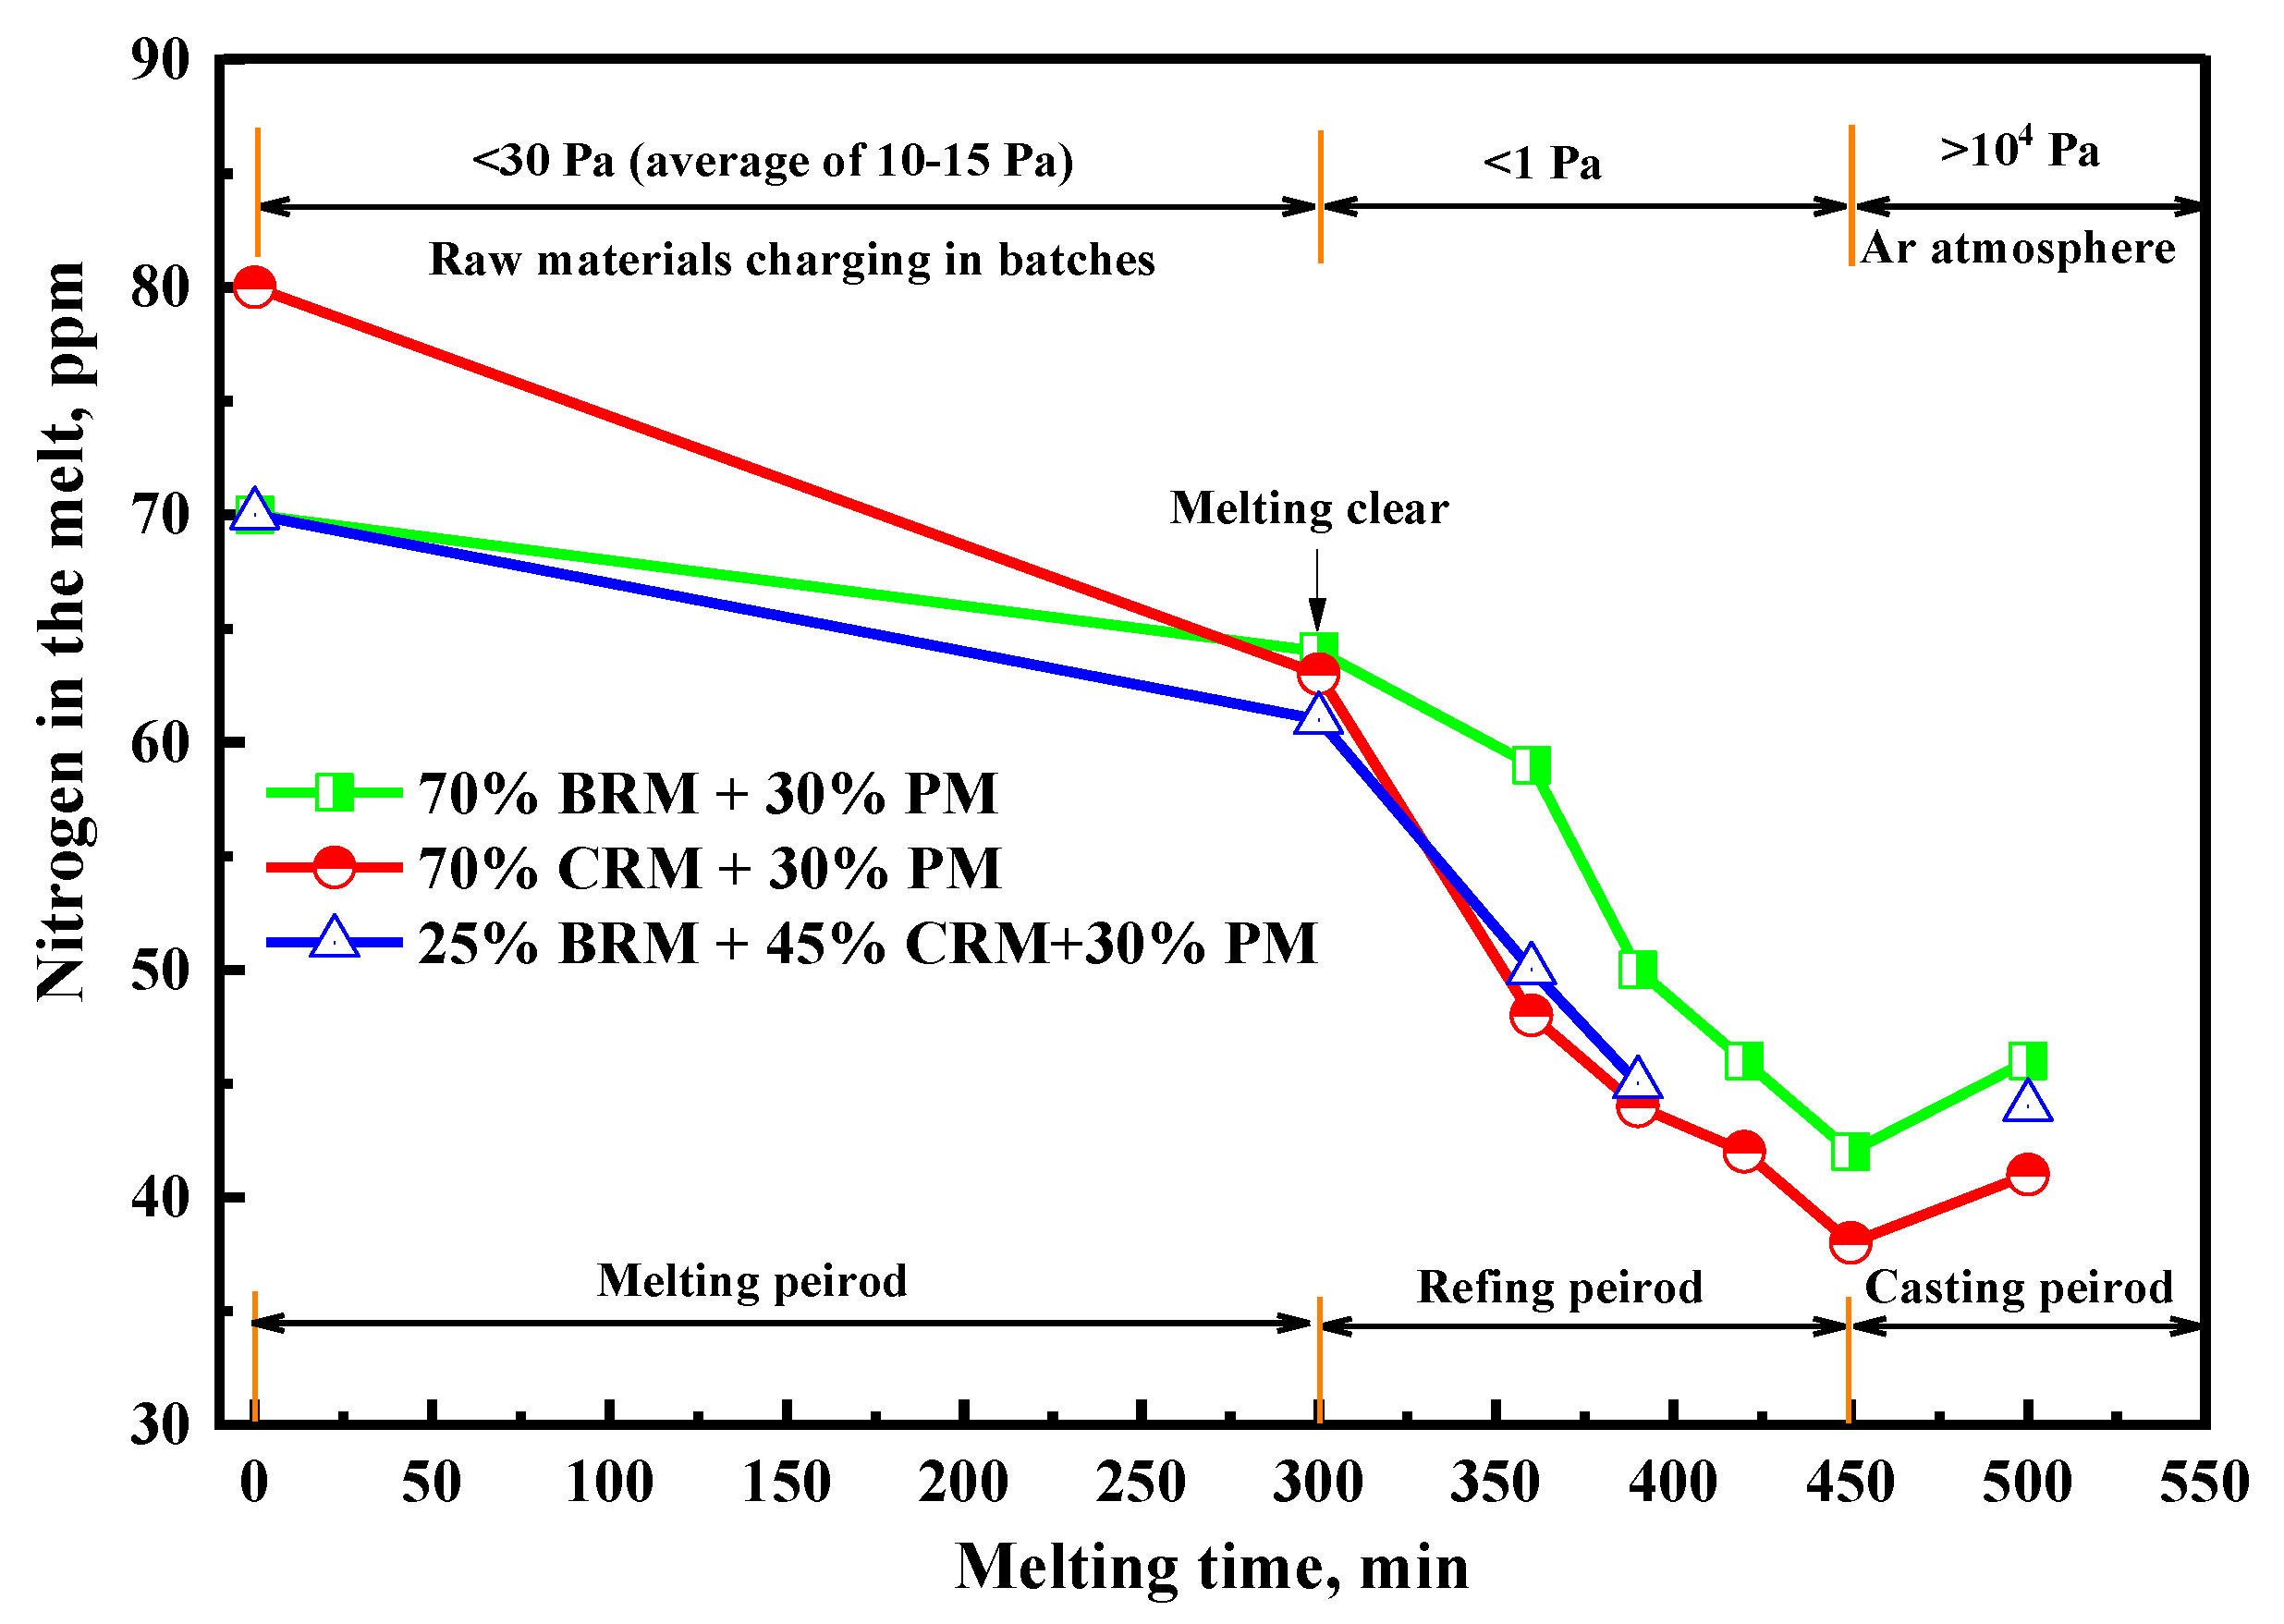
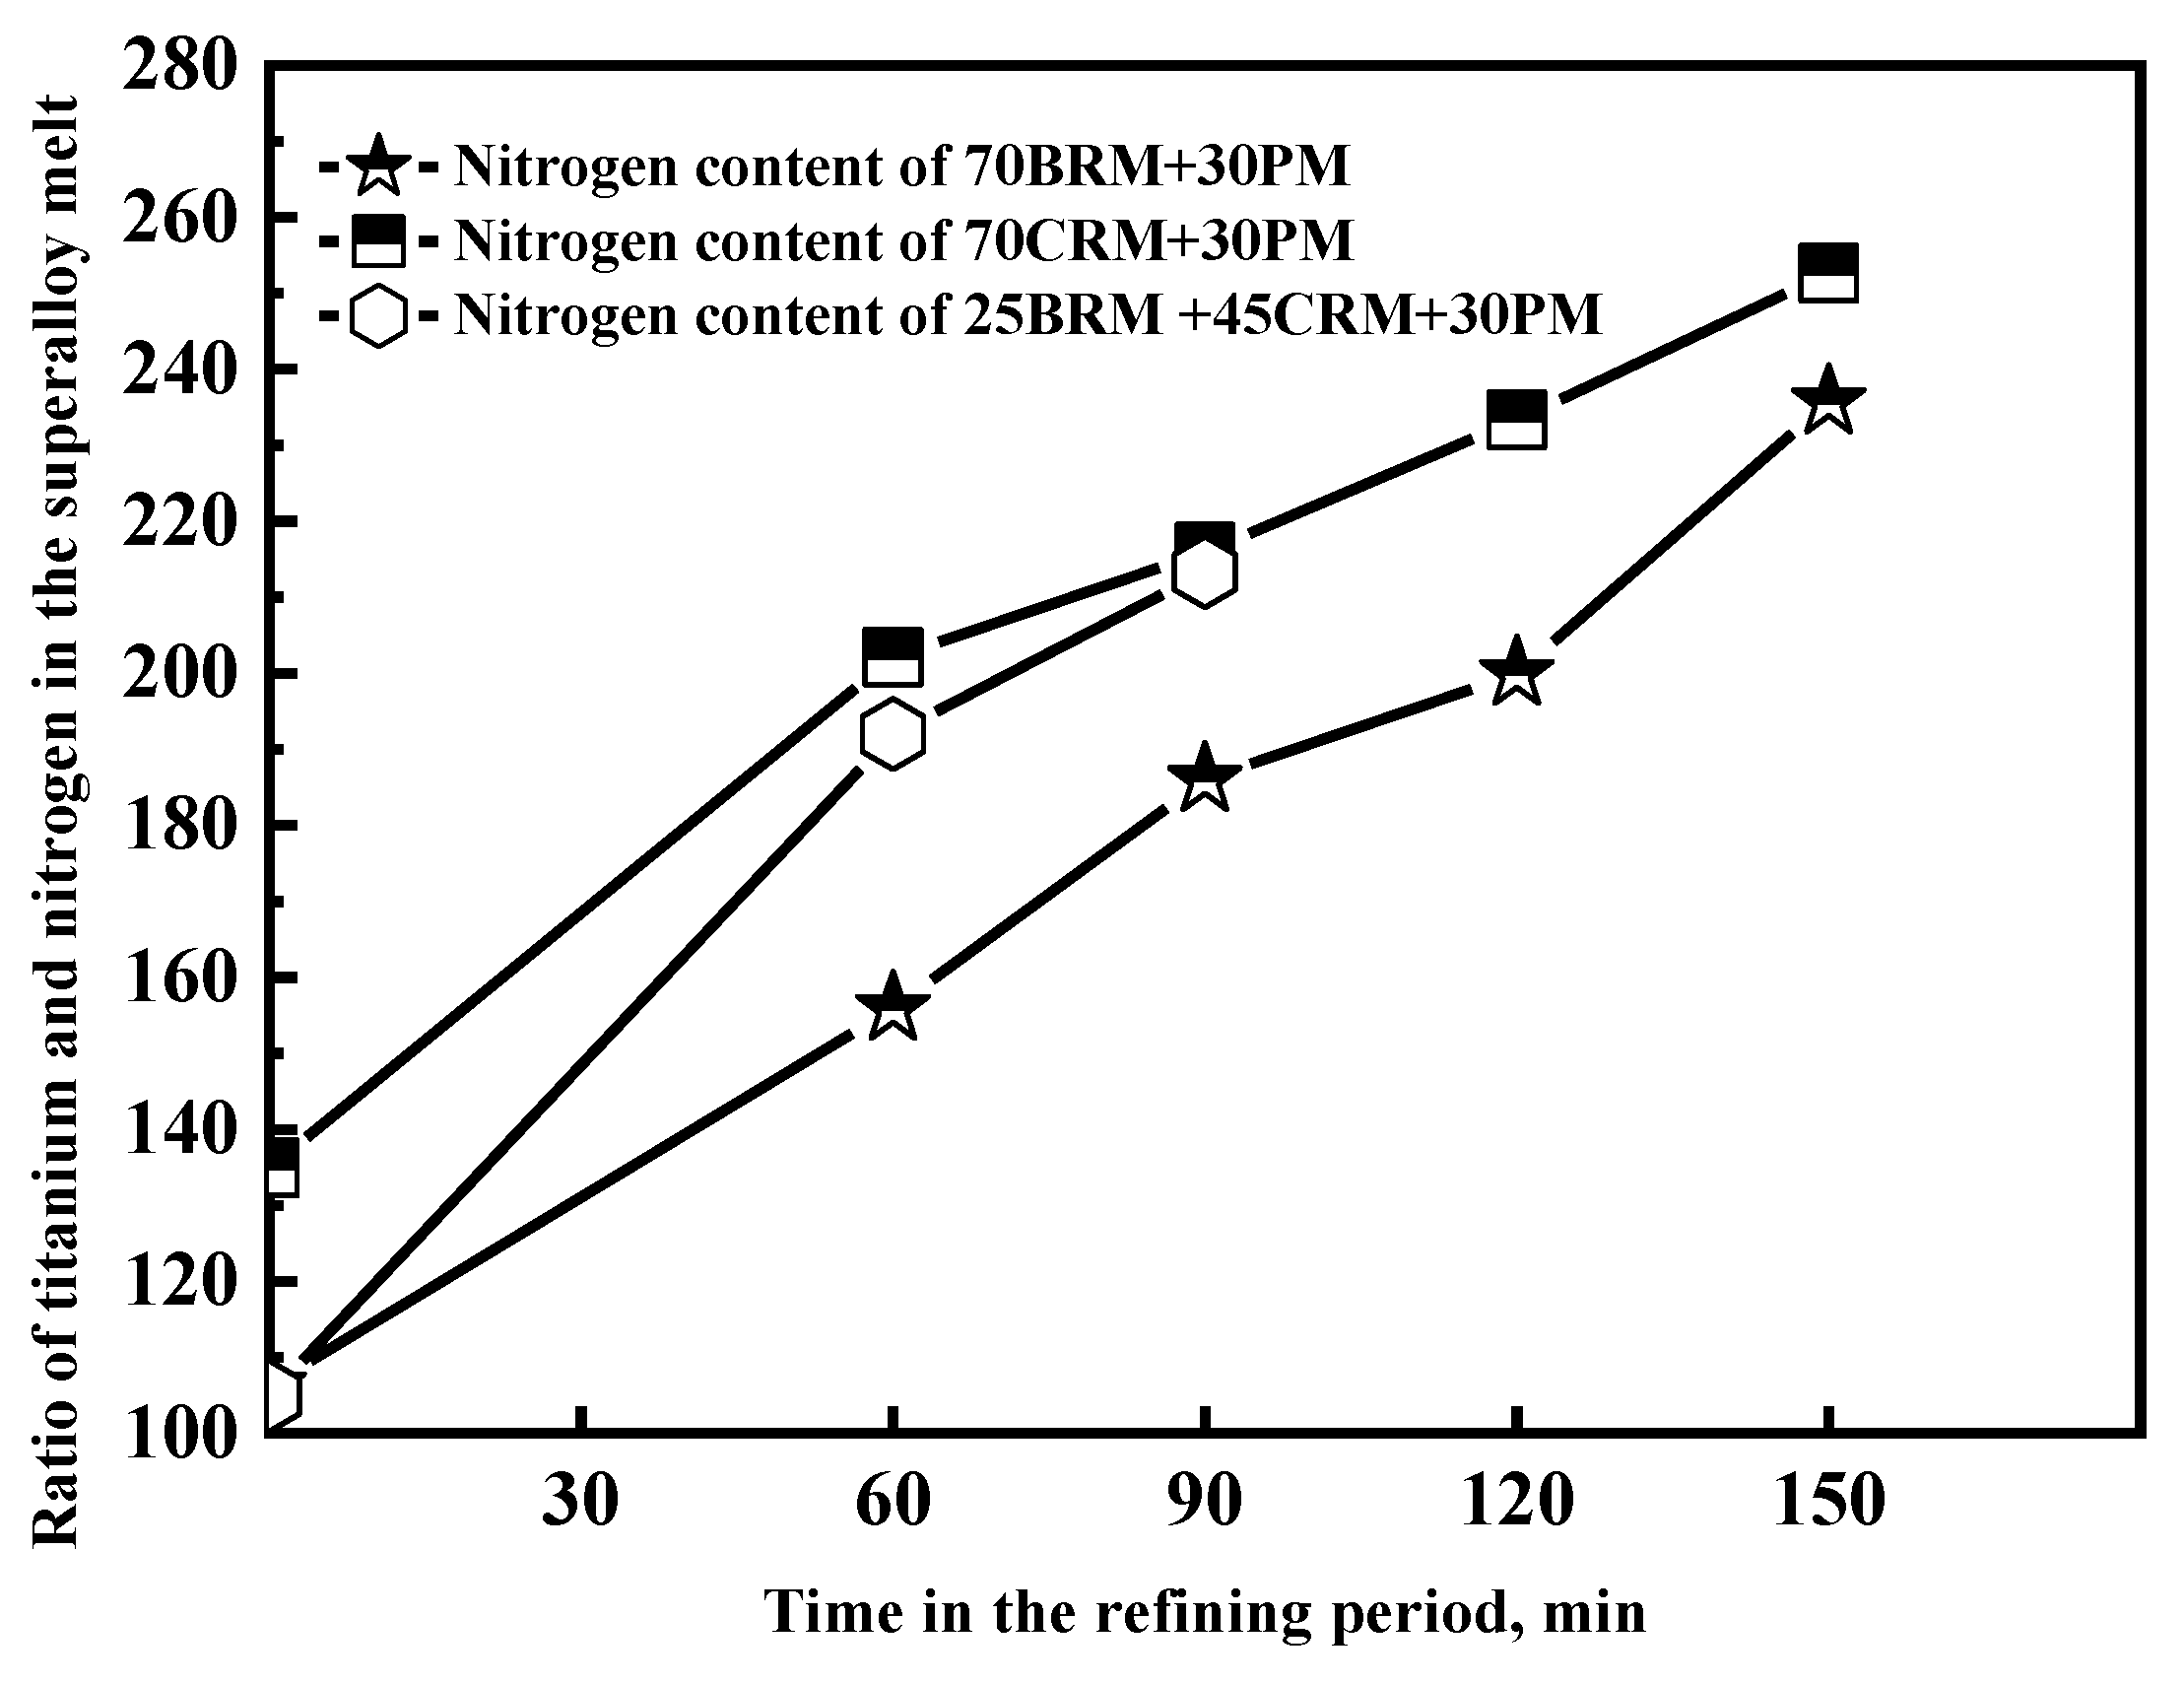
3.2. Change of Nitrogen in the Superalloy Melt during Smelting Process
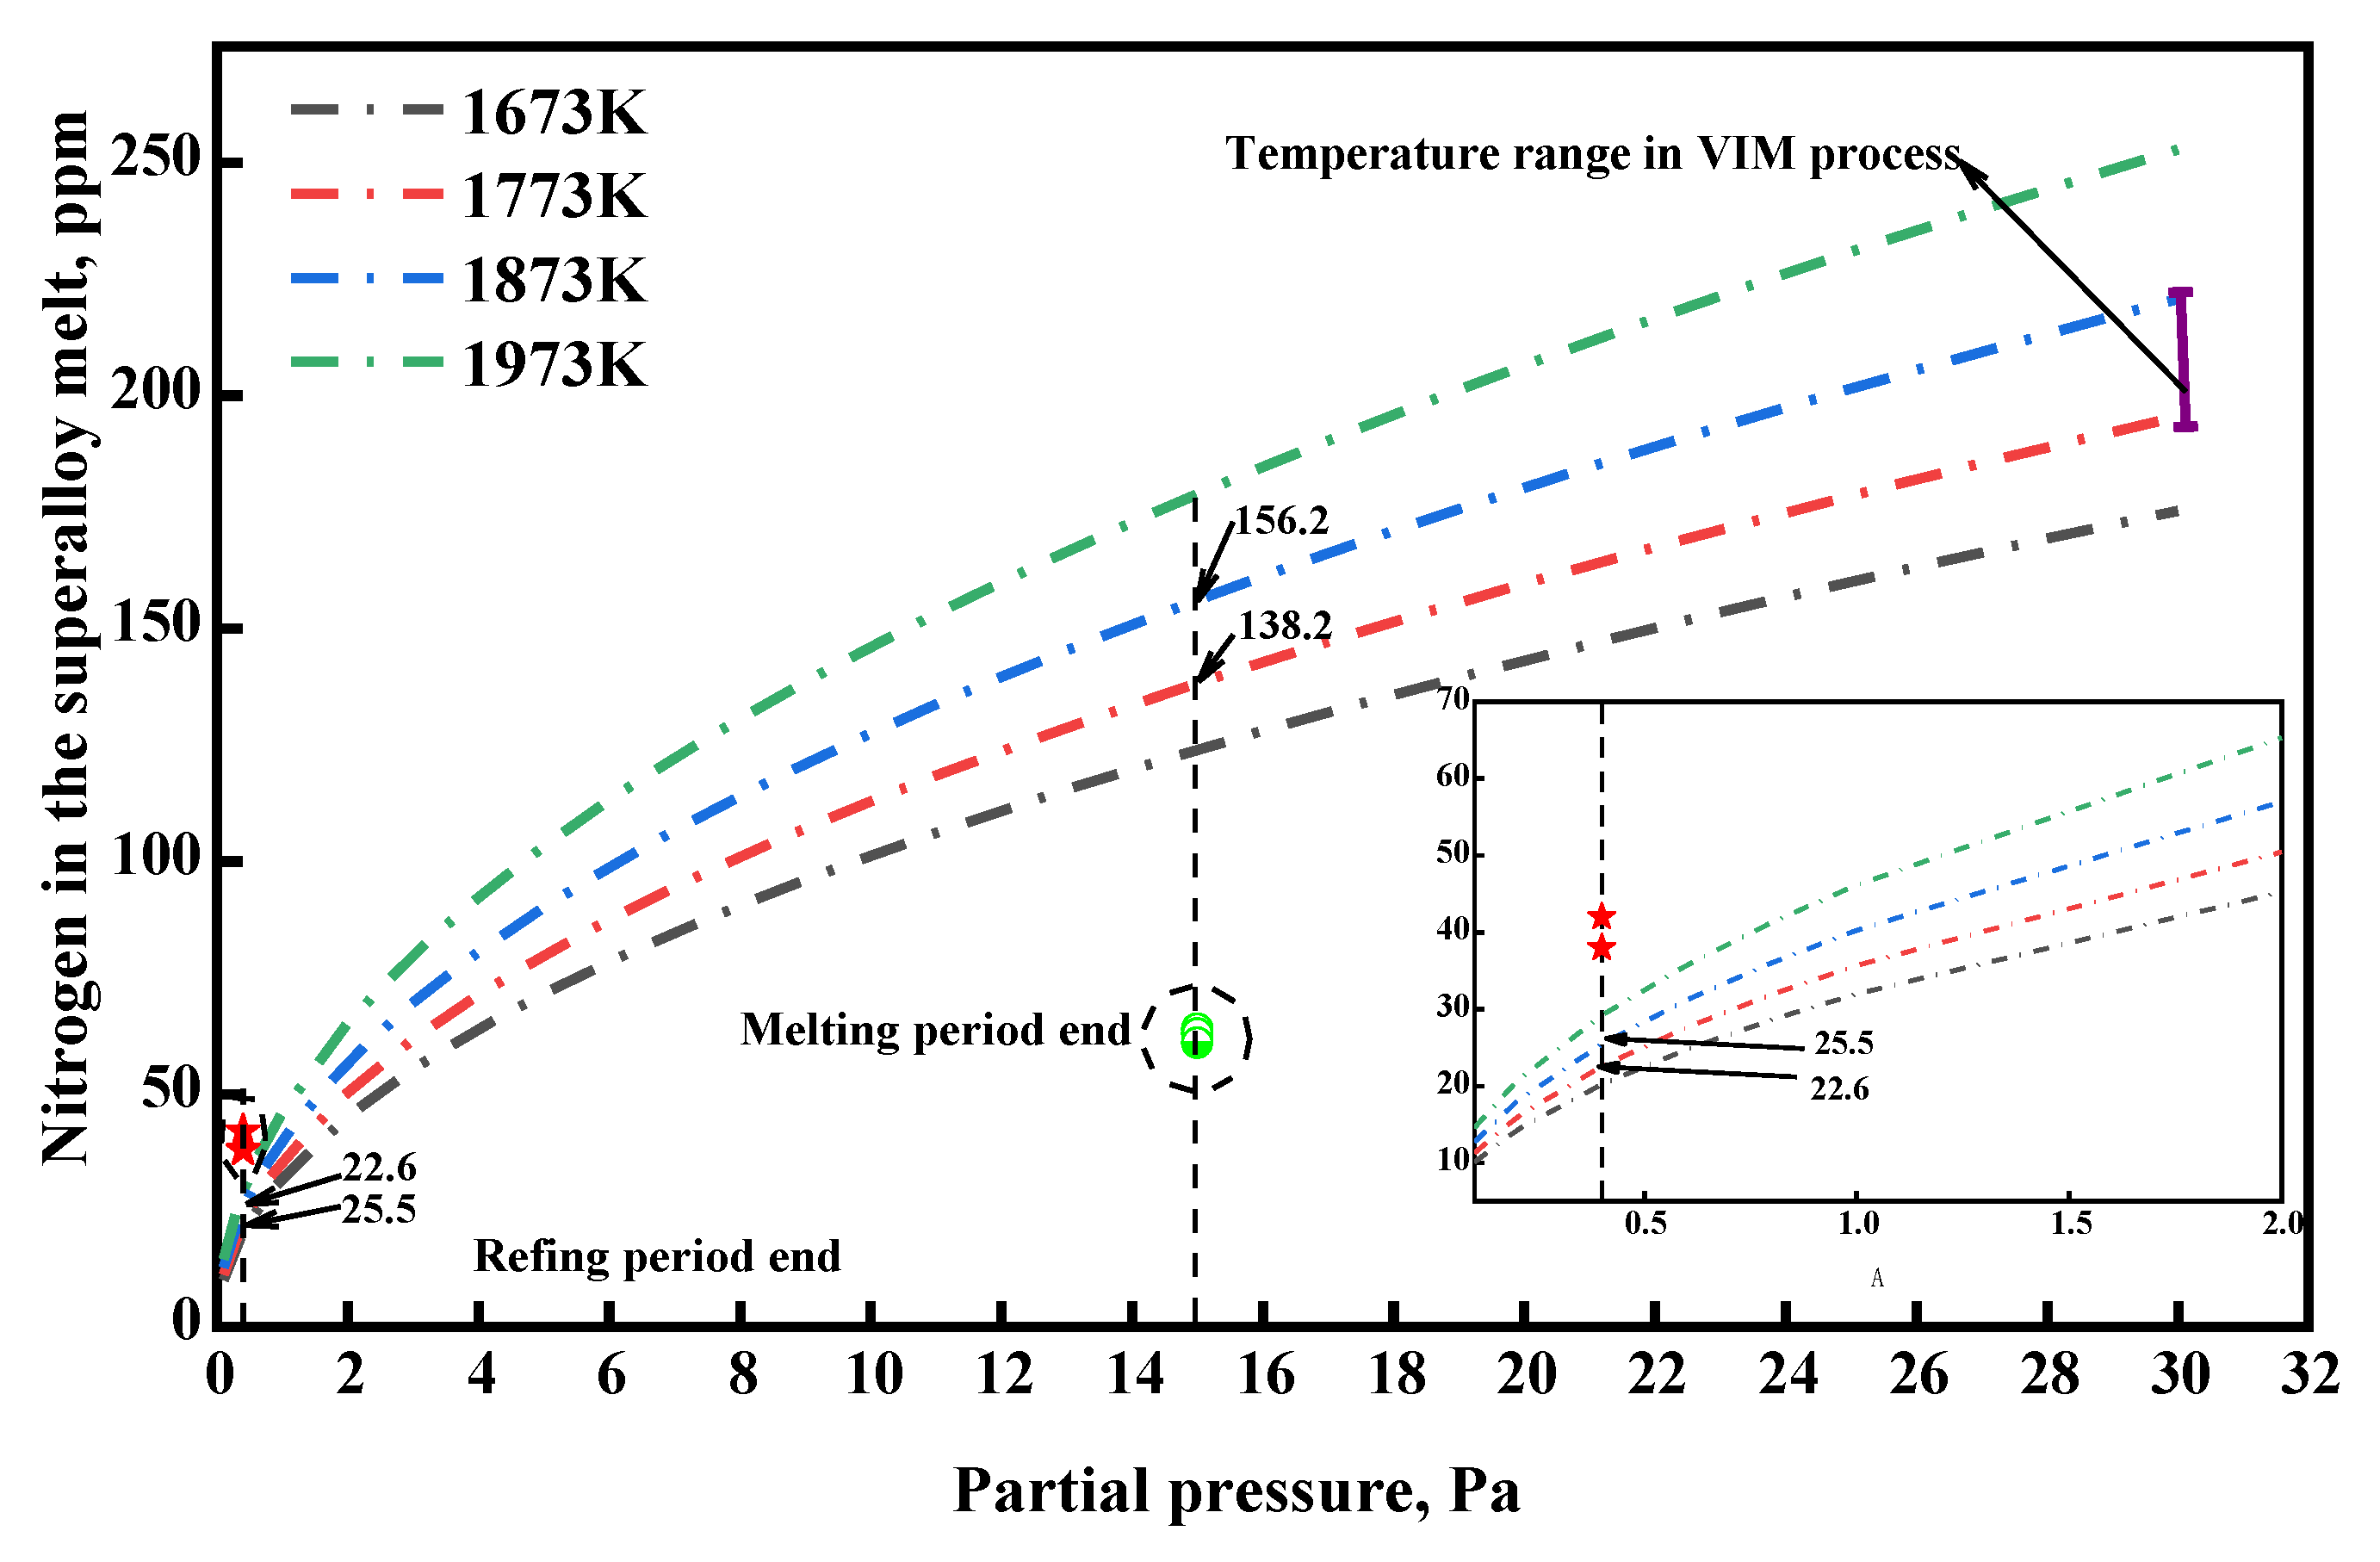
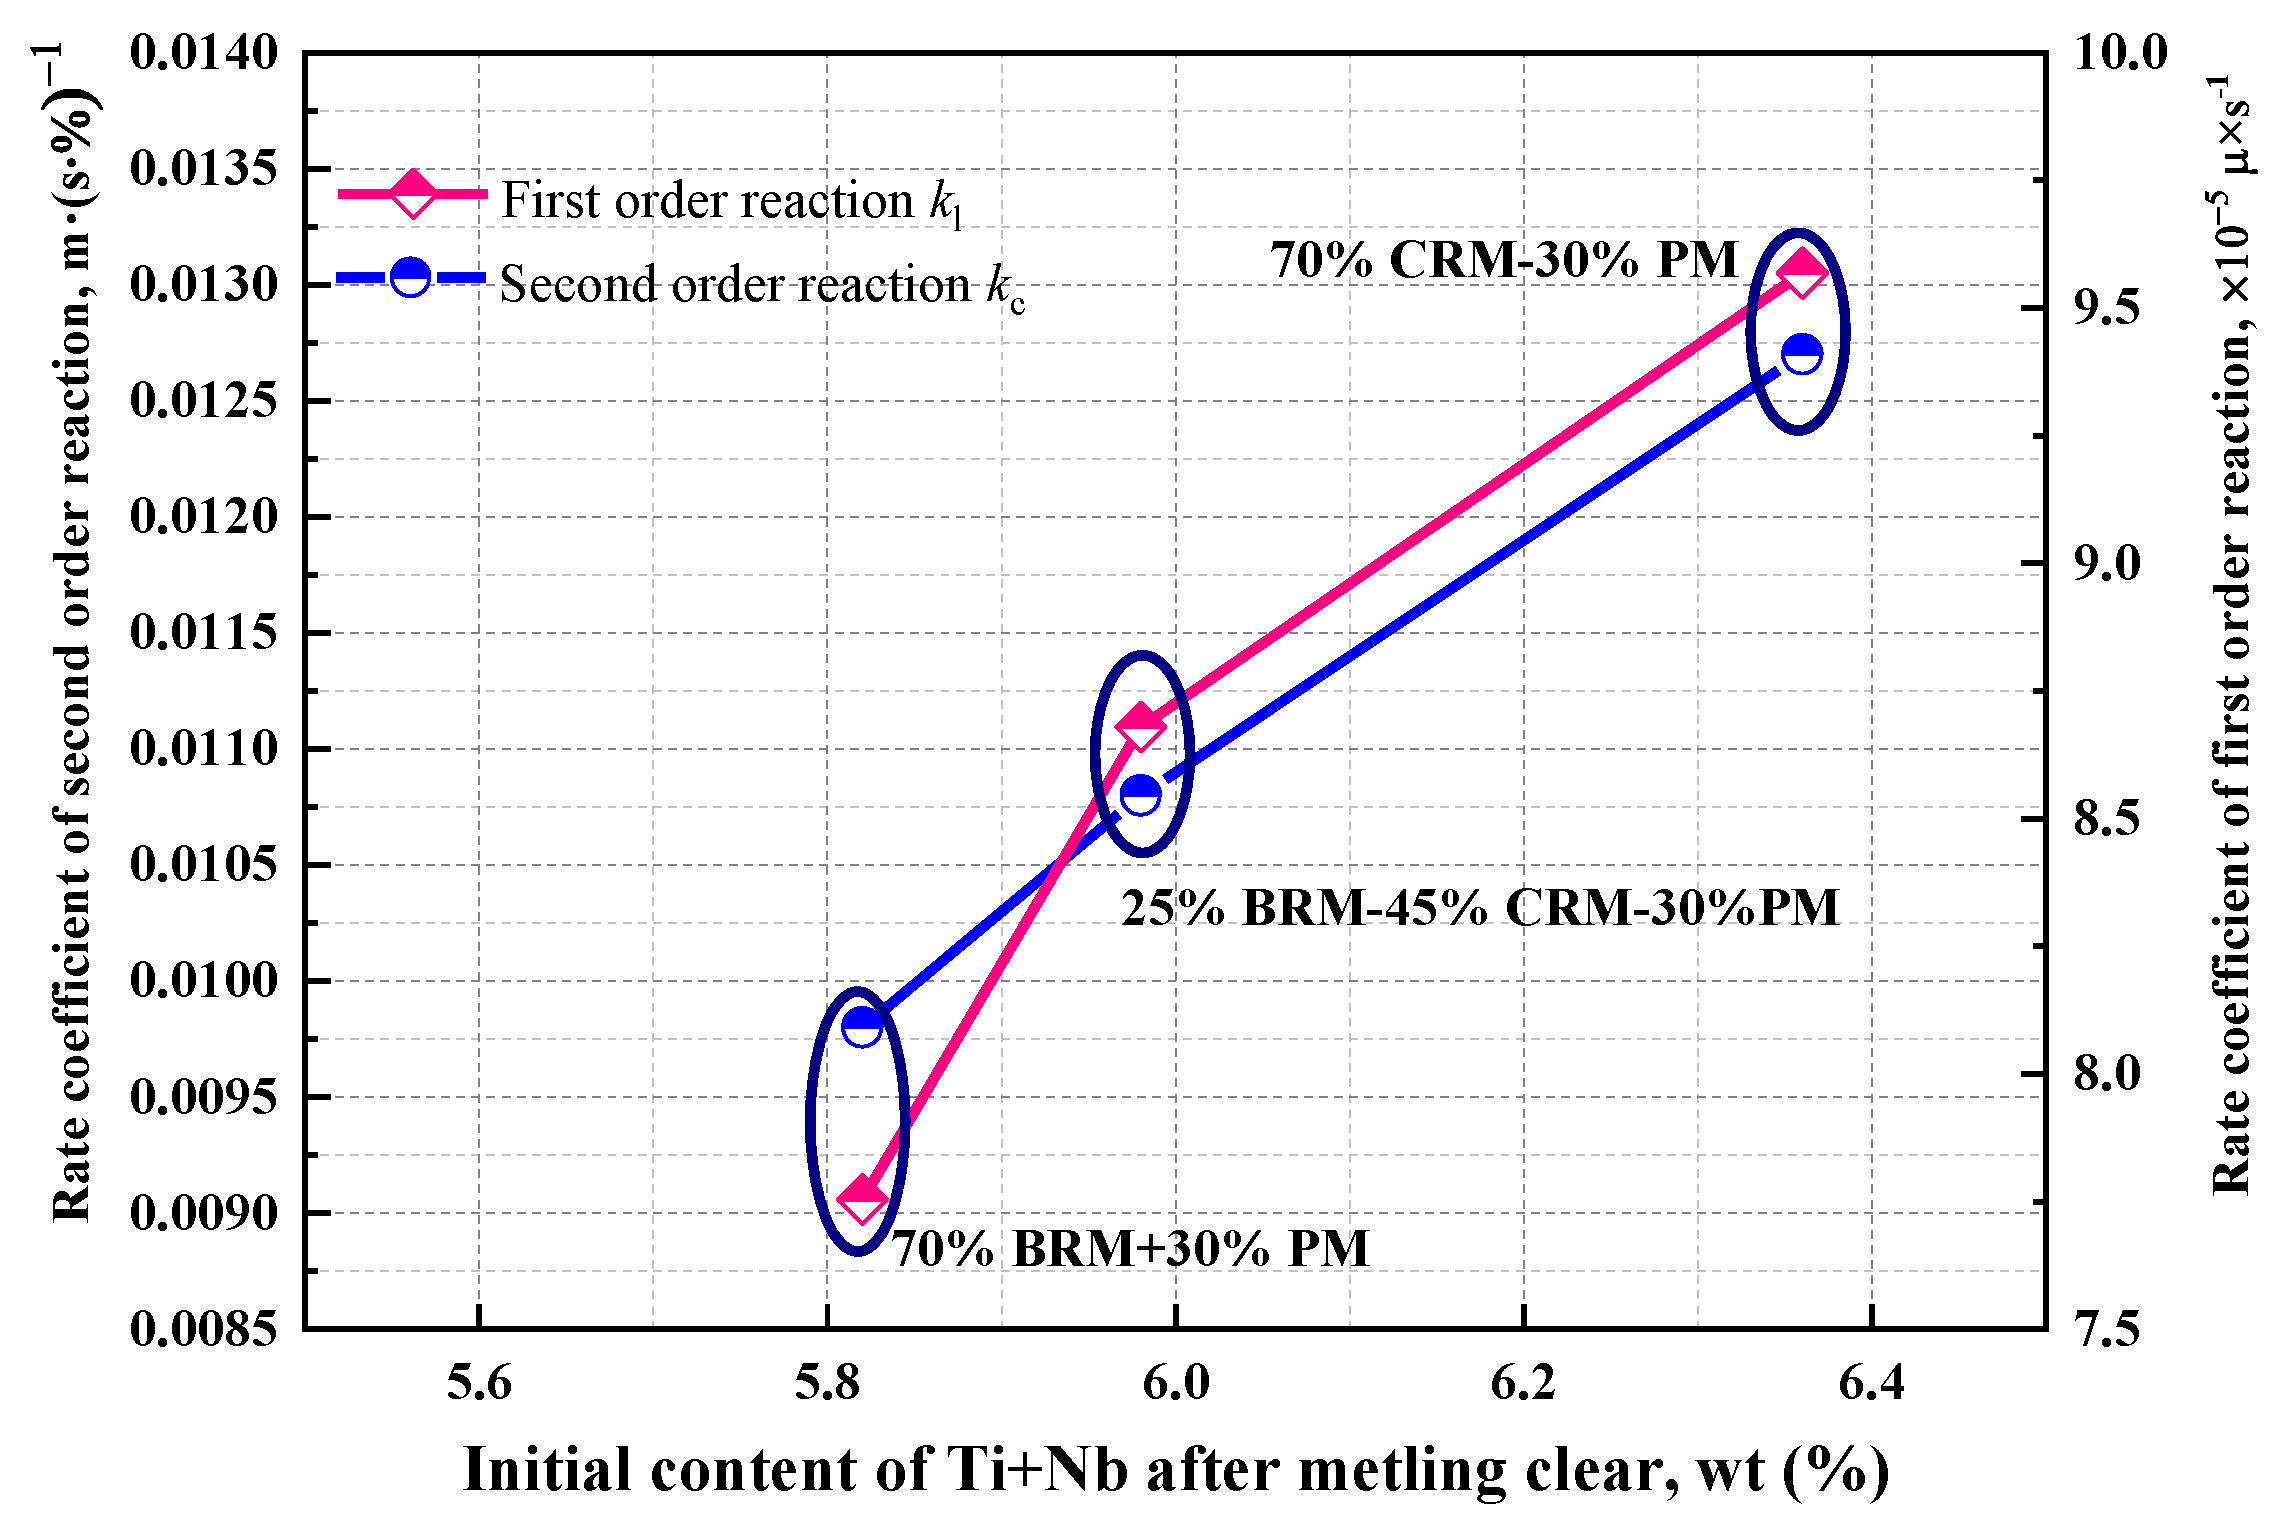
3.3. Correlation of Denitrification and Nitrogen Solubility in the Superalloy Melt
3.4. Thermodynamic Consideration of Nitride Formation in the Superalloy Melt
4. Conclusions
- (1)
- The denitrification rates of superalloy melt GH4169 during the VIM process were 1 ppm per hour at the melting period and 10 ppm per hour in the refining period. Low vacuum pressure (<1 Pa) and good stirring conditions promote the removal of nitrogen in the melt.
- (2)
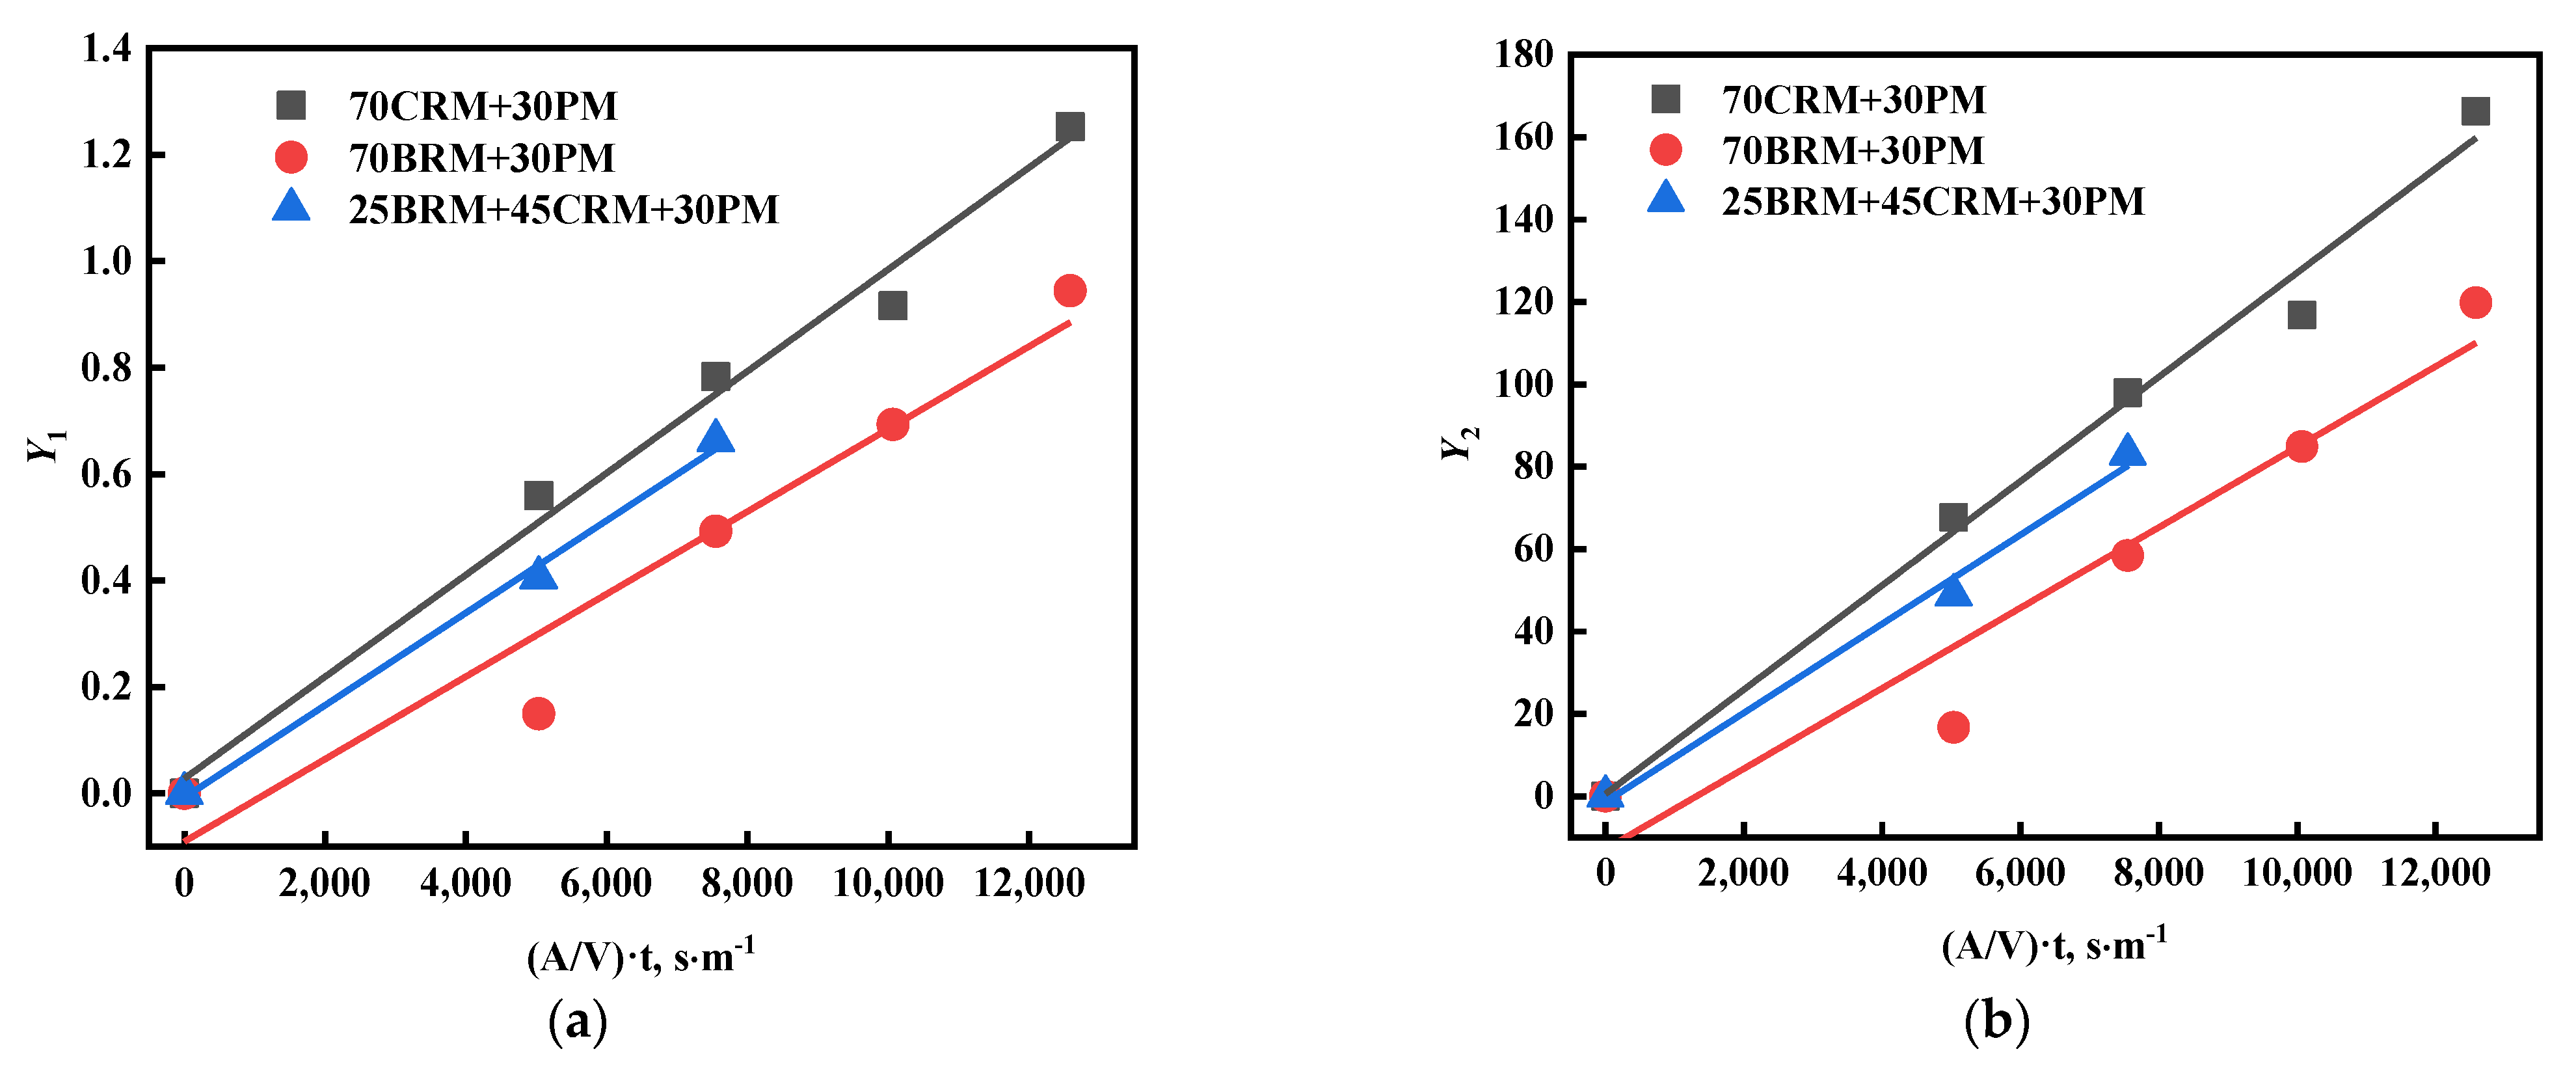
- The denitrification reaction of superalloy melt GH4169 under extremely low vacuum pressure is controlled by both the mass transfer of nitrogen in the melt and the chemical reaction of the liquid–gas interface. The average coefficients of determination for the first-order and second-order reaction are both above 0.96.
- (3)
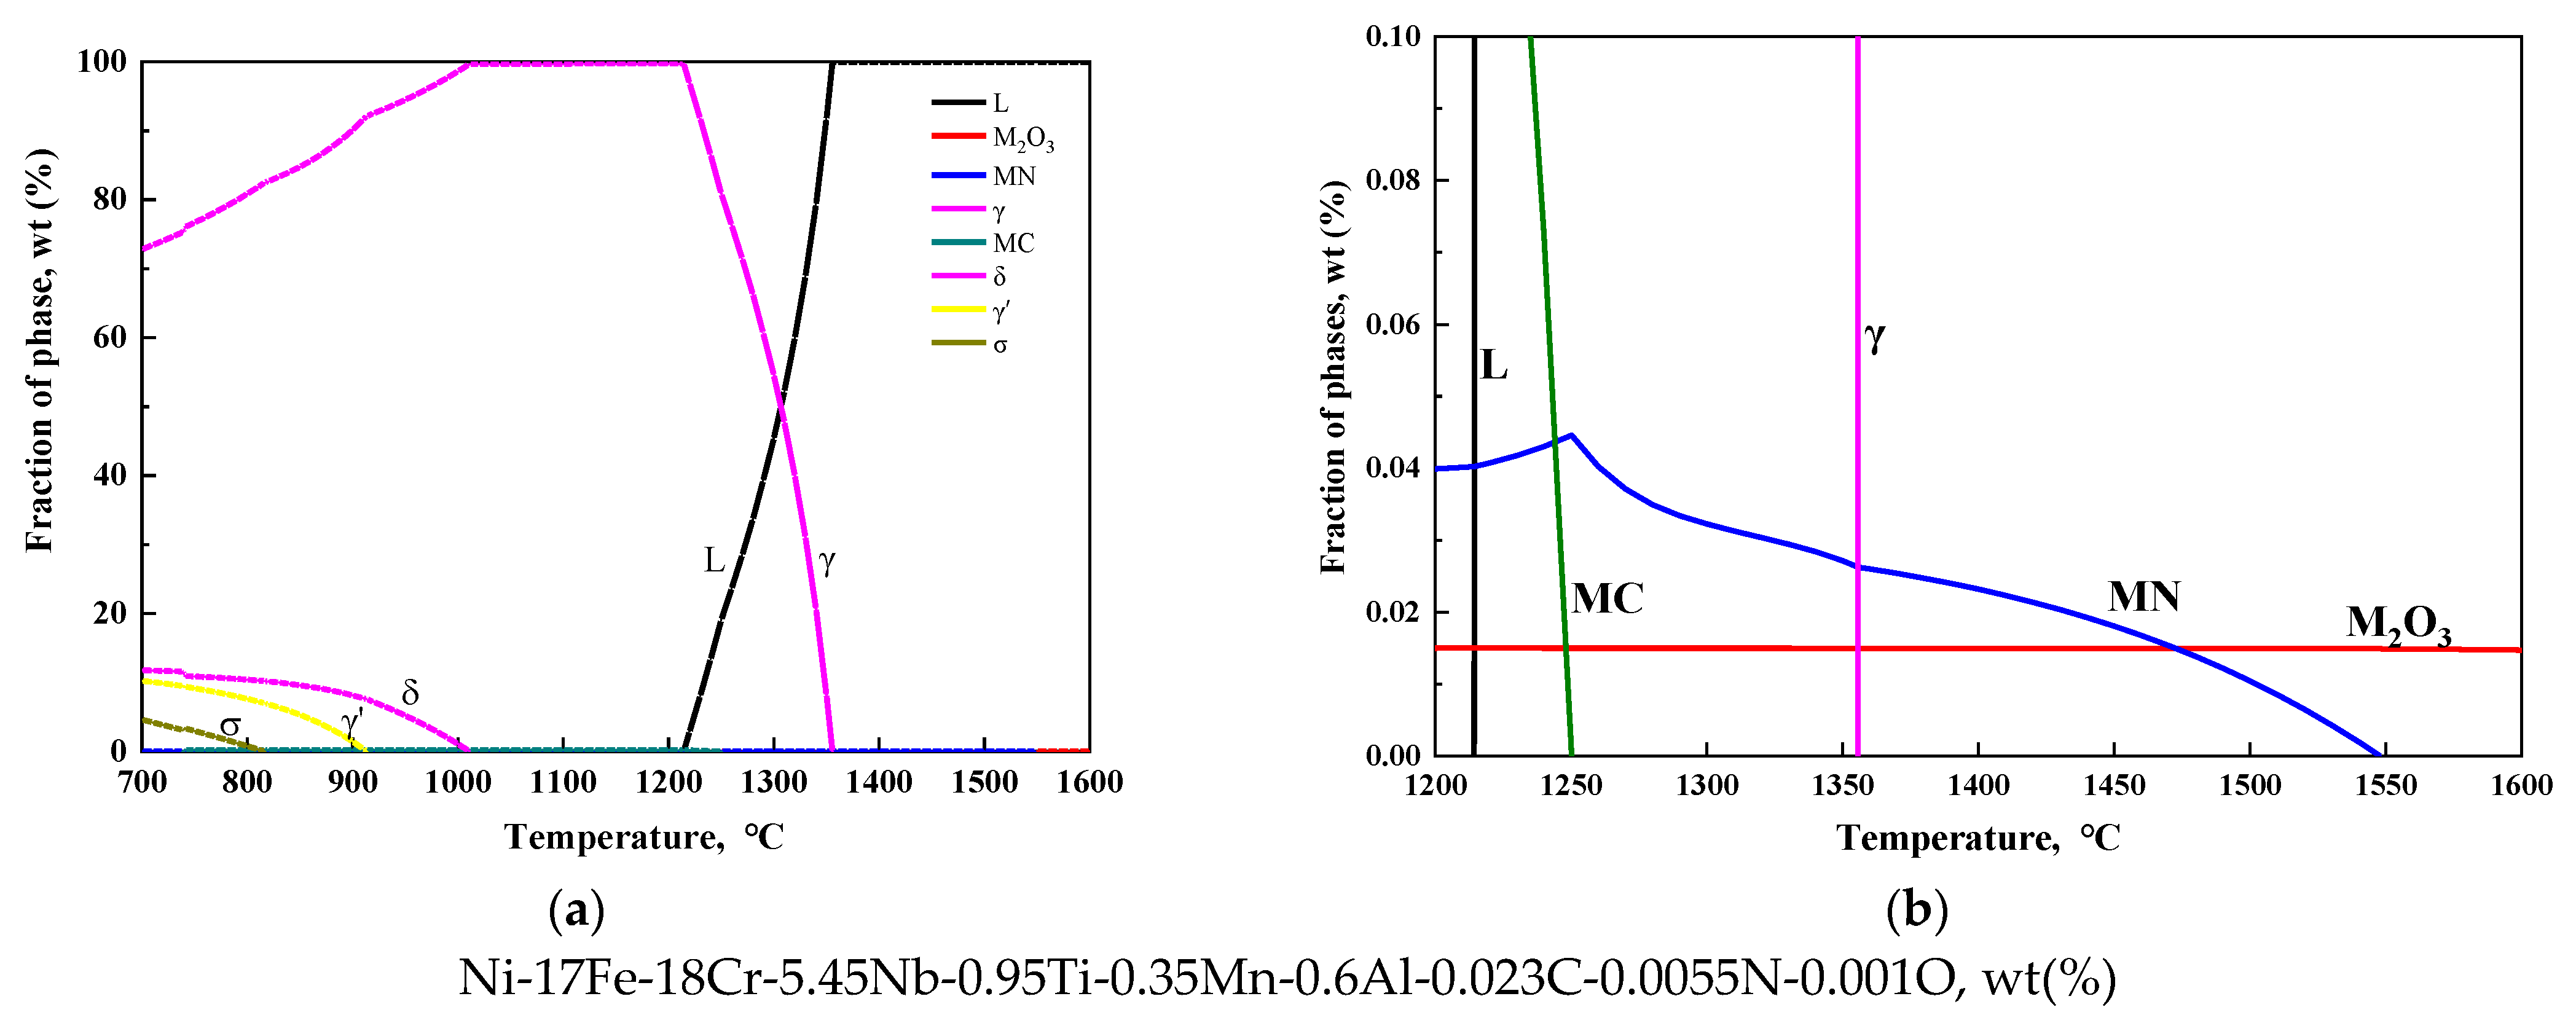
- The liquidus and solidus temperature of GH4169 are 1355 °C and 1214 °C, respectively. A small amount of the oxide (M2O3) co-exist with the liquid phase, while the nitride (MN) begins to precipitate in the liquid phase at 1550 °C reaching the maximum at 1250 °C.
- (4)
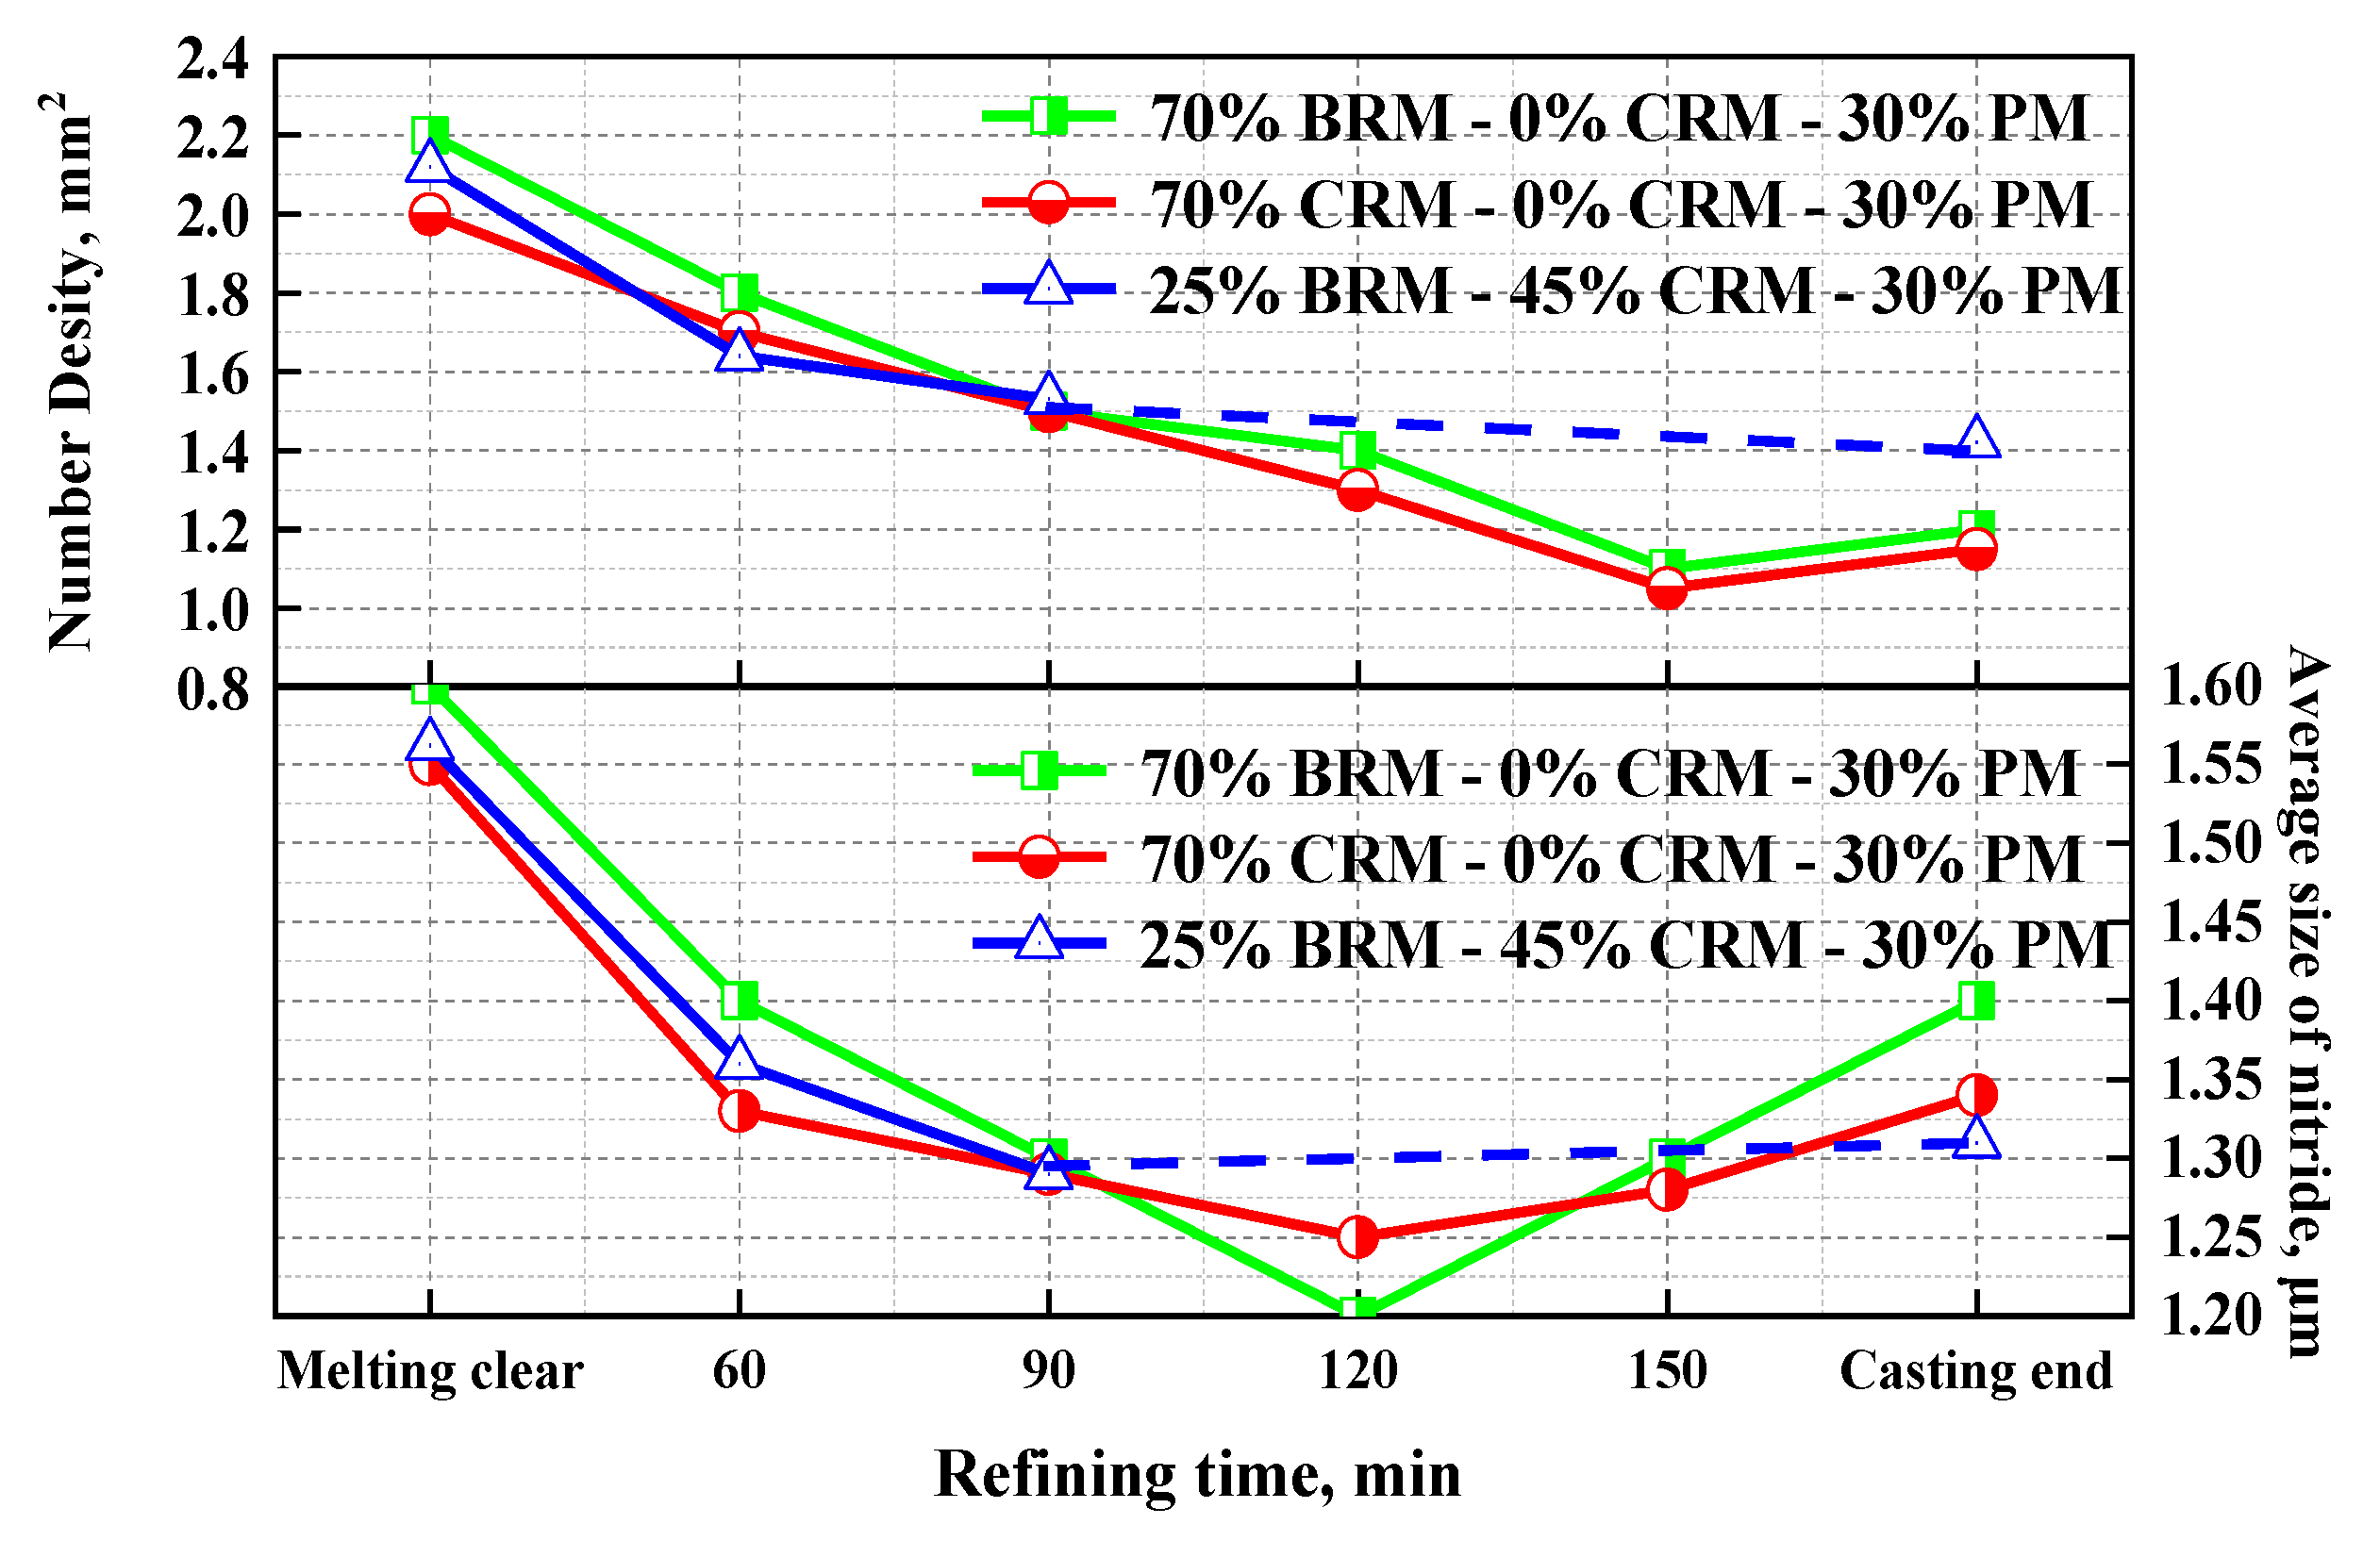
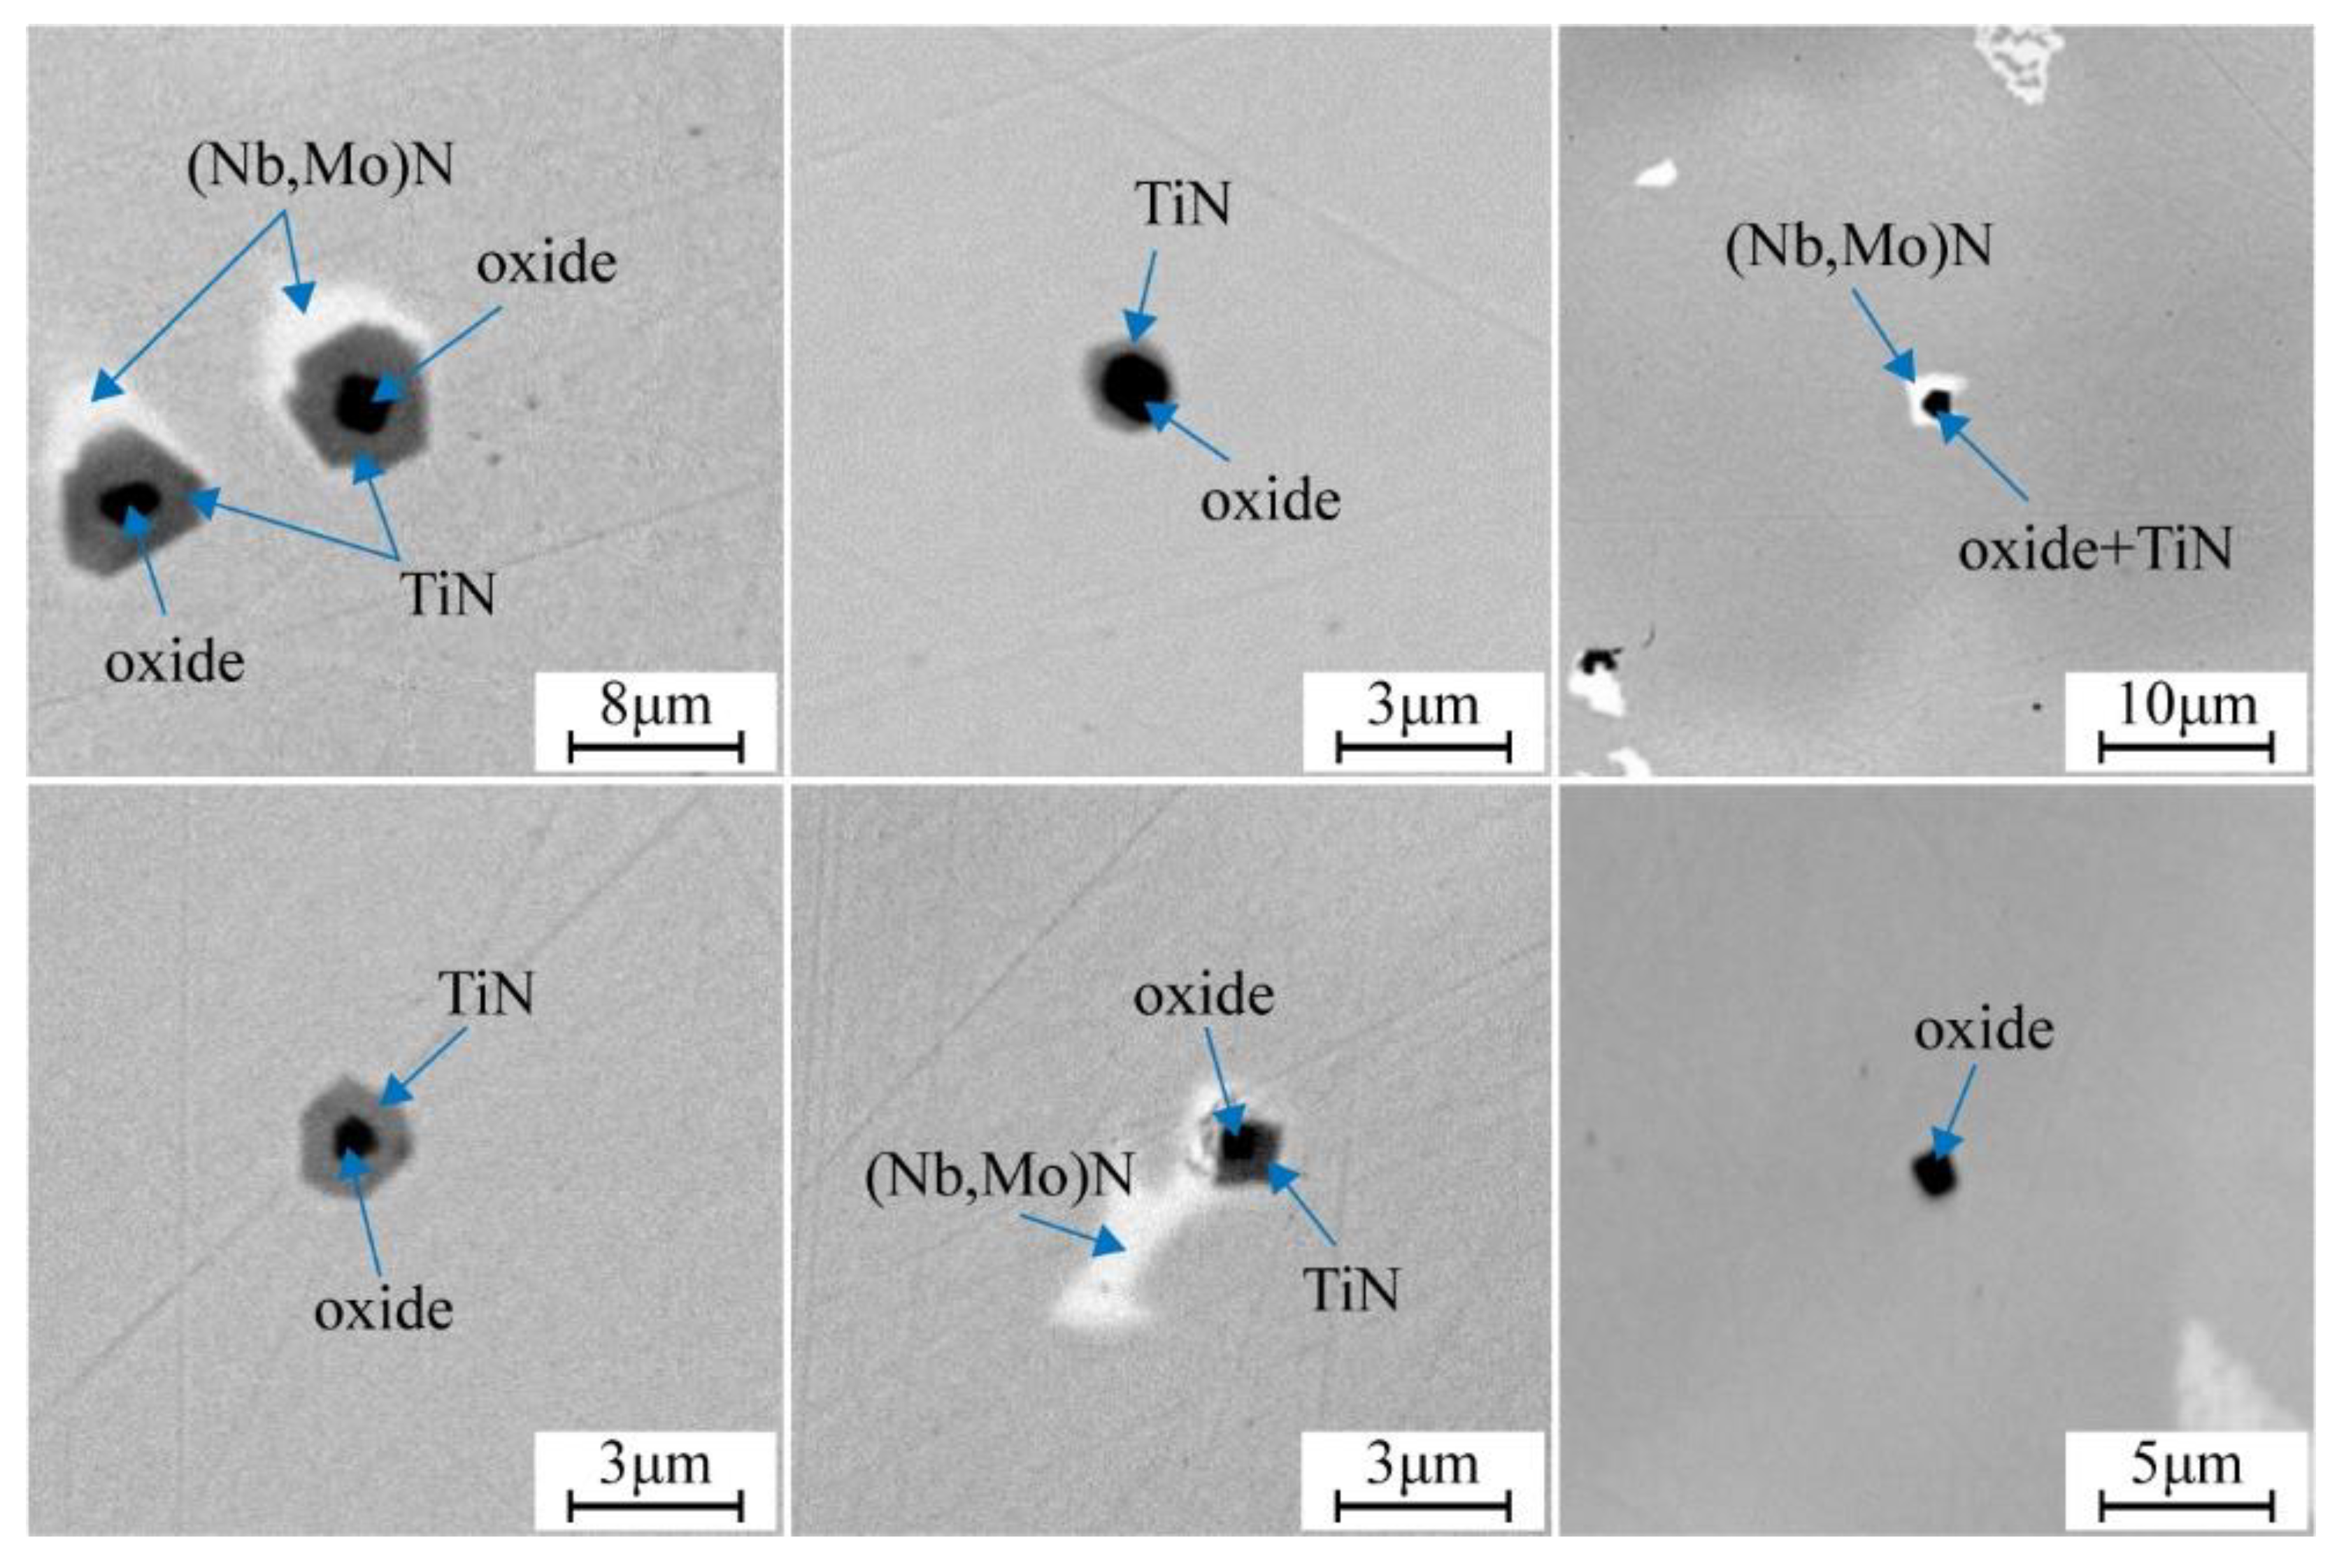
- Three typical inclusions, namely single-phase oxide inclusion, two-phase inclusion of titanium nitride wrapping oxide, and multiphase inclusion with three-layer structure, are found in the melt during the refining period.
- (5)
- The denitrification of the superalloy melt during the vacuum process is due to the gasification denitrification and nitrides floatation, and the denitrification rate decreased with the proportion increase of the block-shaped returned material during the smelting process.
Author Contributions
Funding
Institutional Review Board Statement
Informed Consent Statement
Data Availability Statement
Acknowledgments
Conflicts of Interest
References
- Lvova, E.; Norsworthy, D. Influence of service-induced microstructural changes on the aging kinetics of rejuvenated Ni-based superalloy gas turbine blades. J. Mater. Eng. Perform. 2001, 10, 299–312. [Google Scholar] [CrossRef]
- Zhu, Y.X.; Li, C.; Liu, Y.C.; Ma, Z.Q.; Yu, H.Y. Effect of Ti addition on high-temperature oxidation behavior of Co-Ni-based superalloy. J. Iron Steel Res. Int. 2020, 27, 1179–1189. [Google Scholar] [CrossRef]
- Liu, Z.Y.; Zhu, Q. Effect of Pulse Frequency on the Columnar-to-Equiaxed Transition and Microstructure Formation in Quasi-Continuous-Wave Laser Powder Deposition of Single-Crystal Superalloy. Metall. Mater. Trans. A 2021, 52, 776–778. [Google Scholar] [CrossRef]
- Liburdi, J.; Lowden, P.; Nagy, D.; de Priamus, T.R.; Shaw, S. Practical Experience with the Development of Superalloy Rejuvenation. In Proceedings of the ASME Turbo Expo, Orlando, FL, USA, 8–12 June 2009; Volume 4, pp. 819–827. [Google Scholar] [CrossRef] [Green Version]
- Musavi, S.H.; Davoodi, B.; Niknam, S.A. Environmental-friendly turning of A286 superalloy. J. Manuf. Process. 2018, 32, 734–743. [Google Scholar] [CrossRef]
- Shao, Y.L.; Xu, J.; Wang, H. Effect of Ti and Al on microstructure and partitioning behavior of alloying elements in Ni-based powder metallurgy superalloys. Int. J. Miner. Metall. Mater. 2019, 26, 500–506. [Google Scholar] [CrossRef]
- Gao, X.Y.; Zhang, L.; Qu, X.H. Effect of interaction of refractories with Ni-based superalloy on inclusions during vacuum induction melting. Int. J. Miner. Metall. Mater. 2020, 27, 1551–1559. [Google Scholar] [CrossRef]
- Liu, J.; Zhang, Z.; Li, B.; Lang, S. Multiaxial Fatigue Life Prediction of GH4169 Alloy Based on the Critical Plane Method. Metals 2019, 9, 255. [Google Scholar] [CrossRef] [Green Version]
- Xu, R.; Zhou, Y.; Li, X.; Yang, S.; Han, K.; Wang, S. The Effect of Milling Cooling Conditions on the Surface Integrity and Fatigue Behavior of the GH4169 Superalloy. Metals 2019, 9, 1179. [Google Scholar] [CrossRef] [Green Version]
- Wang, J.L.; Wei, D.S.; Wang, Y.R.; Zhong, B. High-temperature LCF life estimation based on stress gradient effect of notched GH4169 alloy specimens. Fatigue Fract. Eng. Mater. Struct. 2017, 40, 1640–1651. [Google Scholar] [CrossRef]
- Semiatin, S.L.; Tiley, J.S.; Zhang, F.; Smith, T.M.; Zhang, R.Y.; Dong, H.B.; Gadaud, P.; Cormier, J. A Fast-Acting Method for Simulating Precipitation during Heat Treatment of Superalloy 718. Metall. Mater. Trans. 2021, 52, 483–499. [Google Scholar] [CrossRef]
- Mueller, E.M.; Carney, L.; Ngin, S.T.; Yadon, J.L. Failure analysis of weld-repaired B-1900 turbine blade shrouds. Superalloys 2008, 2008, 469–477. [Google Scholar] [CrossRef]
- Gao, X.Y.; Zhang, L.; Luan, Y.F.; Chen, X.W.; Qu, X.H. Investigation of Inclusion Agglomeration and Flotation during Levitation Melting of Ni-Based Superalloy in a Cold Crucible. JOM 2020, 72, 3247–3255. [Google Scholar] [CrossRef]
- Chen, X.C.; Shi, C.B.; Guo, H.J.; Wang, F.; Ren, H.; Feng, D. Investigation of Oxide Inclusions and Primary Carbonitrides in Inconel 718 Superalloy Refined through Electroslag Remelting Process. Metall. Mater. Trans. 2012, 43, 1596–1607. [Google Scholar] [CrossRef]
- Song, X.; Wang, L.; Liu, Y.; Ma, H.P. Precipitation characteristics and La effects on precipitates of a new 22Cr-14W-2Mo superalloy. Rare Metals 2010, 29, 132–137. [Google Scholar] [CrossRef]
- Pelcová, J.; Smola, B.; Stulíková, I. Influence of processing technology on phase transformations in a rare-earth-containing Mg–Zn–Zr alloy. Mater. Sci. Eng. 2007, 462, 334–338. [Google Scholar] [CrossRef]
- Wang, R.M.; Song, Y.G.; Han, Y.F. Effect of rare earth on the microstructures and properties of a low expansion superalloy. J. Alloys Compd. 2002, 33, 575–580. [Google Scholar] [CrossRef]
- Guo, F.A.; Xiang, C.J.; Yang, C.X.; Cao, X.M.; Mu, S.G.; Tang, Y.Q. Study of rare earth elements on the physical and mechanical properties of a Cu–Fe–P–Cr alloy. Mater. Sci. Eng. 2008, 147, 1–6. [Google Scholar] [CrossRef]
- Gheno, T.; Monceau, D.; Oquab, D.; Cadoret, Y. Characterization of Sulfur Distribution in Ni-Based Superalloy and Thermal Barrier Coatings after High Temperature Oxidation: A SIMS Analysis. Oxid. Met. 2010, 73, 95–113. [Google Scholar] [CrossRef] [Green Version]
- Jalowicka, A.; Nowak, W.; Naumenko, D.; Singheiser, L.; Quadakkers, W.J. Effect of nickel base superalloy composition on oxidation resistance in SO2 containing, high pO2 environments. Mater. Corros. 2014, 65, 178–187. [Google Scholar] [CrossRef]
- Niu, J.; Sun, X.; Jin, T.; Yang, K.; Guan, H.; Hu, Z. Investigation into deoxidation during vacuum induction melting refining of nickel base superalloy using CaO crucible. J. Mater. Sci. Technol. 2003, 19, 435–439. [Google Scholar] [CrossRef]
- Alexander, J. Optimizing deoxidation and desuIphurization during vacuum induction melting of alloy 718. J. Mater. Sci. Technol. 1985, 1, 167–170. [Google Scholar] [CrossRef]
- Qian, K.; Chen, B.; Shu, L.; Liu, K. Nitrogen Solubility in Liquid Ni-V, Ni-Ta, Ni-Cr-V, and Ni-Cr-Ta Alloys. Metals 2019, 9, 1184. [Google Scholar] [CrossRef] [Green Version]
- Wang, W.; Zhang, L.; Yang, Y.Q.; Gao, M.; Ding, L.L.; Ma, Y.C.; Liu, K. Thermodynamics and Kinetics of Denitrification Reaction of High Cr Nickel Base Alloys. Rare Metal Mater. Eng. 2020, 49, 3803–3808. [Google Scholar]
- Campbell, J.; Tiryakioğlu, M. Bifilm Defects in Ni-Based Alloy Castings. Metall. Mater. Trans. 2012, 43, 902–914. [Google Scholar] [CrossRef]
- Campbell, J. An overview of the effects of bifilms on the structure and properties of cast alloys. Metall. Mater. Trans. 2006, 37, 857–863. [Google Scholar] [CrossRef]
- Niu, J.P.; Yang, K.N.; Sun, X.F.; Jin, T.; Guan, H.R.; Hu, Z.Q. Denitrogenation during vacuum induction melting refining Ni base superalloy using CaO crucible. J. Mater. Sci. Technol. 2002, 18, 1041–1044. [Google Scholar] [CrossRef]
- Kowanda, C.; Speidel, M.O. Solubility of nitrogen in liquid nickel and binary Ni–Xi alloys (Xi=Cr, Mo, W, Mn, Fe, Co) under elevated pressure. Scripta Mater. 2003, 48, 1073–1078. [Google Scholar] [CrossRef]
- Balasubramanian, K.; Kirkaldy, J.S. Experimental Investigation of the Thermodynamics of Fe–Nb–N Austenite and Nonstoichiometric Niobium Nitride (1373–1673 K). Can. Metall. Quart. 1989, 28, 301–315. [Google Scholar] [CrossRef]
- Ohta, H.; Suito, H. Thermodynamics of Aluminum and Manganese Deoxidation Equilibria in Fe-Ni and Fe-Cr Alloys. ISIJ Int. 2003, 43, 1301–1308. [Google Scholar] [CrossRef]
- Chen, E.-B.; Wang, S.-J.; Dong, Y.-C.; Wu, B.-G.; Zhou, Y. Thermodynamic Properties of Fe-C-N and Fe-C-B-N Melts. J. Iron Steel Res. Int. 2007, 14, 21–24. [Google Scholar] [CrossRef]
- Zhou, L.; Sun, X.F.; Yin, F.; Hou, G.C.; Zheng, Q.; Guan, H.R.; Hu, Z. Effect of melt-superheating treatment on nitrogen-absorption behavior in cast nickel-base superalloy. Chin. J. Nonferrous Met. 2003, 13, 550–553. [Google Scholar] [CrossRef]
- Byrne, M.; Belton, G.R. Studies of the interfacial kinetics of the reaction of nitrogen with liquid iron by the15N-14N isotope exchange reaction. Metall. Trans. B 1983, 14, 441–449. [Google Scholar] [CrossRef]
- Fruehan, R.J.; Martonik, L.J. The rate of absorption of nitrogen into liquid iron containing oxygen and sulfur. Metall. Trans. B 1980, 11, 615–621. [Google Scholar] [CrossRef]
- Ban-Ya, S.; Ishii, F.; Iguchi, Y.; Nagasaka, T. Rate of nitrogen desorption from liquid iron-carbon and iron-chromium alloys with argon. Metall. Trans. B 1988, 19, 233–242. [Google Scholar] [CrossRef]
- Wang, Z.D.; Cao, K.J.; He, J.L. Induction Furnace Smelting; Chemical Industry Press: Beijing, China, 2007; 347p. [Google Scholar]


| Scheme | Block-Shaped Returned Material | Chip-Shaped Returned Material | Pure Material |
|---|---|---|---|
| A | 70% | / | 30% |
| B | / | 70% | 30% |
| C | 25% | 45% | 30% |
| Elements | C | Mn | Ni | Cr | Mo | Al | Ti | Nb | Fe | T.O | T.N |
|---|---|---|---|---|---|---|---|---|---|---|---|
| Standard range | 0.015–0.036 | ≤0.35 | 52.0–55.0 | 17.00–19.00 | 2.80–3.15 | 0.30–0.65 | 0.75–1.15 | 5.20–5.55 | 16.0–19.0 | ≤0.0025 | ≤0.010 |
| Target control | 0.023 | / | 53.5 | 18.0 | 2.95 | 0.6 | 0.95 | 5.45 | 17.0 | ≤0.001 | ≤0.0055 |
| Case | Time/Min | C | Mn | Si | S | P | Ni | Cr | Mo | Al | Ti | Cu | B | Nb | Co | Fe |
|---|---|---|---|---|---|---|---|---|---|---|---|---|---|---|---|---|
| A (70%BRM-0%CRM-30%PM) | 0 | 0.024 | 0.03 | 0.052 | 0.0008 | 0.01 | 54.69 | 19.01 | 2.80 | 0.32 | 0.68 | 0.018 | 0.003 | 5.14 | 0.14 | 16.16 |
| 60 | 0.023 | 0.023 | 0.053 | 0.0008 | 0.009 | 53.75 | 18.38 | 2.95 | 0.56 | 0.92 | 0.018 | 0.003 | 5.38 | 0.29 | 16.74 | |
| 90 | 0.023 | 0.022 | 0.057 | 0.0008 | 0.013 | 53.89 | 18.36 | 2.97 | 0.56 | 0.93 | 0.017 | 0.003 | 5.43 | 0.29 | 16.66 | |
| 120 | 0.023 | 0.02 | 0.057 | 0.0008 | 0.011 | 53.79 | 18.36 | 2.96 | 0.56 | 0.92 | 0.017 | 0.003 | 5.4 | 0.29 | 16.72 | |
| 150 | 0.027 | 0.019 | 0.055 | 0.0007 | 0.009 | 54.23 | 18.34 | 2.99 | 0.61 | 0.99 | 0.016 | 0.003 | 5.43 | 0.3 | 16.71 | |
| 200 | 0.029 | 0.018 | 0.054 | 0.0007 | 0.011 | 53.97 | 18.24 | 2.97 | 0.6 | 0.98 | 0.015 | 0.005 | 5.39 | 0.3 | 16.75 | |
| B (0%BRM-70%CRM-30%PM) | 0 | 0.021 | 0.032 | 0.052 | 0.0008 | 0.009 | 55.44 | 18.53 | 2.86 | 0.36 | 0.85 | 0.026 | 0.003 | 5.5 | 0.23 | 15.12 |
| 60 | 0.024 | 0.019 | 0.053 | 0.0008 | 0.013 | 53.96 | 17.9 | 2.96 | 0.6 | 0.97 | 0.021 | 0.003 | 5.61 | 0.3 | 16.68 | |
| 90 | 0.023 | 0.019 | 0.055 | 0.0008 | 0.015 | 54.16 | 17.93 | 2.93 | 0.61 | 0.95 | 0.02 | 0.003 | 5.29 | 0.3 | 16.87 | |
| 120 | 0.023 | 0.017 | 0.053 | 0.0008 | 0.014 | 53.97 | 17.78 | 2.96 | 0.6 | 0.98 | 0.019 | 0.003 | 5.64 | 0.3 | 16.64 | |
| 150 | 0.023 | 0.016 | 0.053 | 0.0008 | 0.013 | 54 | 17.91 | 2.96 | 0.62 | 0.96 | 0.018 | 0.003 | 5.6 | 0.29 | 16.94 | |
| 200 | 0.022 | 0.012 | 0.057 | 0.001 | - | 53.7 | 17.22 | 2.95 | 0.634 | 0.98 | 0.013 | - | 5.56 | - | 16.9 | |
| C (25%BRM-45%CRM-30%PM) | 0 | 0.03 | 0.032 | 0.064 | 0.001 | 0.01 | 54.83 | 18.47 | 2.88 | 0.36 | 0.64 | 0.02 | 0.003 | 5.34 | 0.17 | 16.7 |
| 60 | 0.029 | 0.024 | 0.063 | 0.001 | 0.012 | 53.56 | 18.04 | 2.97 | 0.572 | 0.96 | 0.02 | 0.003 | 5.52 | 0.29 | 17.21 | |
| 90 | 0.028 | 0.018 | 0.069 | 0.002 | 0.013 | 53.73 | 17.9 | 2.99 | 0.57 | 0.96 | 0.02 | 0.003 | 5.554 | 0.29 | 17.17 | |
| 200 | 0.027 | 0.016 | 0.068 | 0.0015 | 0.012 | 53.4 | 17.89 | 2.97 | 0.58 | 0.96 | 0.014 | 0.0045 | 5.57 | 0.3 | 17.09 |
| Element | C | Cr | Ti | Nb | Mo | Fe |
|---|---|---|---|---|---|---|
| 0.09 | −0.1 | −0.21 | −0.072 | −0.043 | −0.021 |
| Reaction Order | Raw Material | R2 |
|---|---|---|
| First-order reaction model | 70 CRM + 30 PM | 0.984 |
| 70 BRM + 30 PM | 0.923 | |
| 25 BRM + 45 CRM + 30 PM | 0.992 | |
| Second-order reaction model | 70 CRM + 30 PM | 0.983 |
| 70 BRM + 30 PM | 0.909 | |
| 25 BRM + 45 CRM + 30 PM | 0.984 |
Publisher’s Note: MDPI stays neutral with regard to jurisdictional claims in published maps and institutional affiliations. |
© 2021 by the authors. Licensee MDPI, Basel, Switzerland. This article is an open access article distributed under the terms and conditions of the Creative Commons Attribution (CC BY) license (https://creativecommons.org/licenses/by/4.0/).
Share and Cite
Gao, S.; Wang, M.; Xie, X.; Liu, M.; Bao, Y. Behavior of Nitrogen in GH4169 Superalloy Melt during Vacuum Induction Melting Using Returned Materials. Metals 2021, 11, 1119. https://doi.org/10.3390/met11071119
Gao S, Wang M, Xie X, Liu M, Bao Y. Behavior of Nitrogen in GH4169 Superalloy Melt during Vacuum Induction Melting Using Returned Materials. Metals. 2021; 11(7):1119. https://doi.org/10.3390/met11071119
Chicago/Turabian StyleGao, Shengyong, Min Wang, Xiaoyu Xie, Meng Liu, and Yanping Bao. 2021. "Behavior of Nitrogen in GH4169 Superalloy Melt during Vacuum Induction Melting Using Returned Materials" Metals 11, no. 7: 1119. https://doi.org/10.3390/met11071119