Article

Evolution of the Microstructure of a CuCr1Zr Alloy during Direct Heating by Electric Current

1
Department of Materials, Faculty of Nuclear Sciences and Physical Engineering, Czech Technical University in Prague, Trojanova 13, 120 00 Praha 2, Czech Republic
2
Department of Physics of Materials, Faculty of Mathematics and Physics, Charles University, Ke Karlovu 5, 121 16 Prague 2, Czech Republic
3
UMR CNRS 6027, IRDL, Centre de Recherche C. Huygens, Université Bretagne Sud, Rue de Saint-Maudé, 56321 Lorient, France
*
Author to whom correspondence should be addressed.
Metals 2021, 11(7), 1074; https://doi.org/10.3390/met11071074
Submission received: 28 May 2021 / Revised: 15 June 2021 / Accepted: 1 July 2021 / Published: 3 July 2021

Abstract

:
Round tensile test specimens of an age-hardened CuCr1Zr alloy were subjected to direct electrical current heating in a Gleeble thermal–mechanical simulator at 800 °C. The mechanical properties were monitored by the Vickers hardness test, and the changes in the grain structure were examined by light metallography. A quantitative analysis of the size and distribution of fine precipitates during annealing was carried out using transmission electron microscopy (TEM). The grain structure showed a gradient corresponding to the gradient of the temperature on the test piece. Annealing for 60 s at 800 °C resulted in a partially (~50%) recrystallized structure with new grains about 45 μm in diameter. In the as-delivered condition, TEM documented tiny (1 to 4 nm) coherent chromium precipitates inducing strain fields in the matrix. During overaging, the particles lost their coherence and gradually coarsened up to a mean diameter of 40 nm after 300 s at 800 °C. The coarsening kinetics obeys Lifshitz, Sloyzov, and Wagner’s theory.

1. Introduction

Precipitation-hardened CuCr1Zr alloy combines high thermal and electrical conductivity with high strength and good softening resistance. It is used in many application areas, especially as resistance welding electrodes and wheels, switches, circuit breakers, high-temperature wires, lead frames of integrated circuits, contact wires of high-speed railways, casting wheels, and ingot molds in metallurgy, or as rotor rings and connectors in the electric industry. It is also considered for heat sink of the International Thermonuclear Experimental Reactor (ITER) divertor [1]. According to the standard [2], CuCr1Zr alloy usually contains about 0.5–1.2 wt.% Cr and 0.03–0.3 wt.% Zr.
Solidification, annealing, and hardening heat treatment result in the formation of precipitates in the alpha matrix. The ternary Cu-Cr-Zr system was investigated by Liu et al. [3]. The phase equilibrium at the Cu-rich corner of the phase diagram and experimental studies [3,4,5,6,7] show that Cr precipitates and Cu5Zr and/or Cu51Zr14 phases may exist in the Cu matrix in the composition range of the CuCr1Zr alloy. The size of particles ranges from coarse phases larger than 1 μm to tiny particles with the size of few nanometers. Coarse Zr-rich particles resist solution annealing treatments and do not contribute to mechanical strength. The main strengthening is caused by nanosized particles, composed mainly of fcc chromium-rich precipitates [8,9]. The role of Zr is to promote the formation of precipitates in the alloy and to improve its mechanical properties at elevated temperatures [6,8]. Nevertheless, when the alloy is exposed to high temperatures, as in resistance spot welding electrodes, mechanical properties can be degraded by softening, thermal fatigue, recovery, and recrystallization. In particular, the accumulation of weld spots that progressively deteriorates the electrodes is associated with sequential short thermal cycles at a maximum temperature near 800°C close to the electrode surface [10]. The purpose of this study is thus to visualize the changes in the grain structure of the alloy after direct heating by electric current in a Gleeble thermal–mechanical simulator at 800 °C. The temperature gradient existing in the Gleeble specimens allows us to obtain this in-formation at different temperatures for the same experiment. These results are supplemented by a quantitative analysis of the size and distribution of fine precipitates for different annealing times at 800 °C.

2. Materials and Methods

Rods of the CuCr1Zr alloy 15.4 mm in diameter have been prepared after conventional billet casting by: (i) solution annealing of the billet (950–1000 °C/30–60 min), (ii) hot extrusion to rods 28 mm in diameter and quenching after exiting the press, (iii) cold drawing with a 70% reduction in area, and (iv) aging (450–500 °C/2–4 h). Round tensile test specimens with a reduced section of 6 mm in diameter (Figure 1a) were directly heated by an electric current to 800 °C for 10, 30, 60, and 300 s in a Gleeble 3500 thermal–mechanical simulator [11]. The grain boundaries of the alloy were revealed by etching with a solution of 2 g K2Cr2O7, 8 mL H2SO4, 4 mL sat. aq. NaCl, and 100 mL water. Transmission electron microscopy (TEM) samples were prepared from cross-section slices 0.3 mm in thickness cut by a slow-speed diamond blade. Standard TEM discs 3 mm in diameter were punched after mechanical grinding to 0.12 mm. Thin foils were electrolytically twin-jet polished (8 °C, 4 V) in a Struers Tenupol 2 unit filled with a solution of 50% H3PO4 in water, and observed at a 200 kV acceleration voltage using a JEOL JEM 2000FX microscope equipped with an energy dispersive spectrometer Bruker and CCD camera Veleta. The thickness of TEM foils was estimated either by the recording of convergent beam electron diffraction (CBED) patterns and comparing them to simulations calculated with the JEMS software package [12], or by counting thickness fringes. Typical values ranged between 25 and 50 nm for the micrographs of tiny Cr particles, and between 120 and 400 nm for the observation of coarsened particles. In the as-delivered condition, the number of tiny Cr particles exhibiting complicated contrast with lobes due to misfit strains in the matrix was counted manually. Coarsened particles in the micrographs of heat-treated samples were analyzed by software written in Matlab [13], using the Image Processing and Statistics toolbox.

3. Results and Discussion

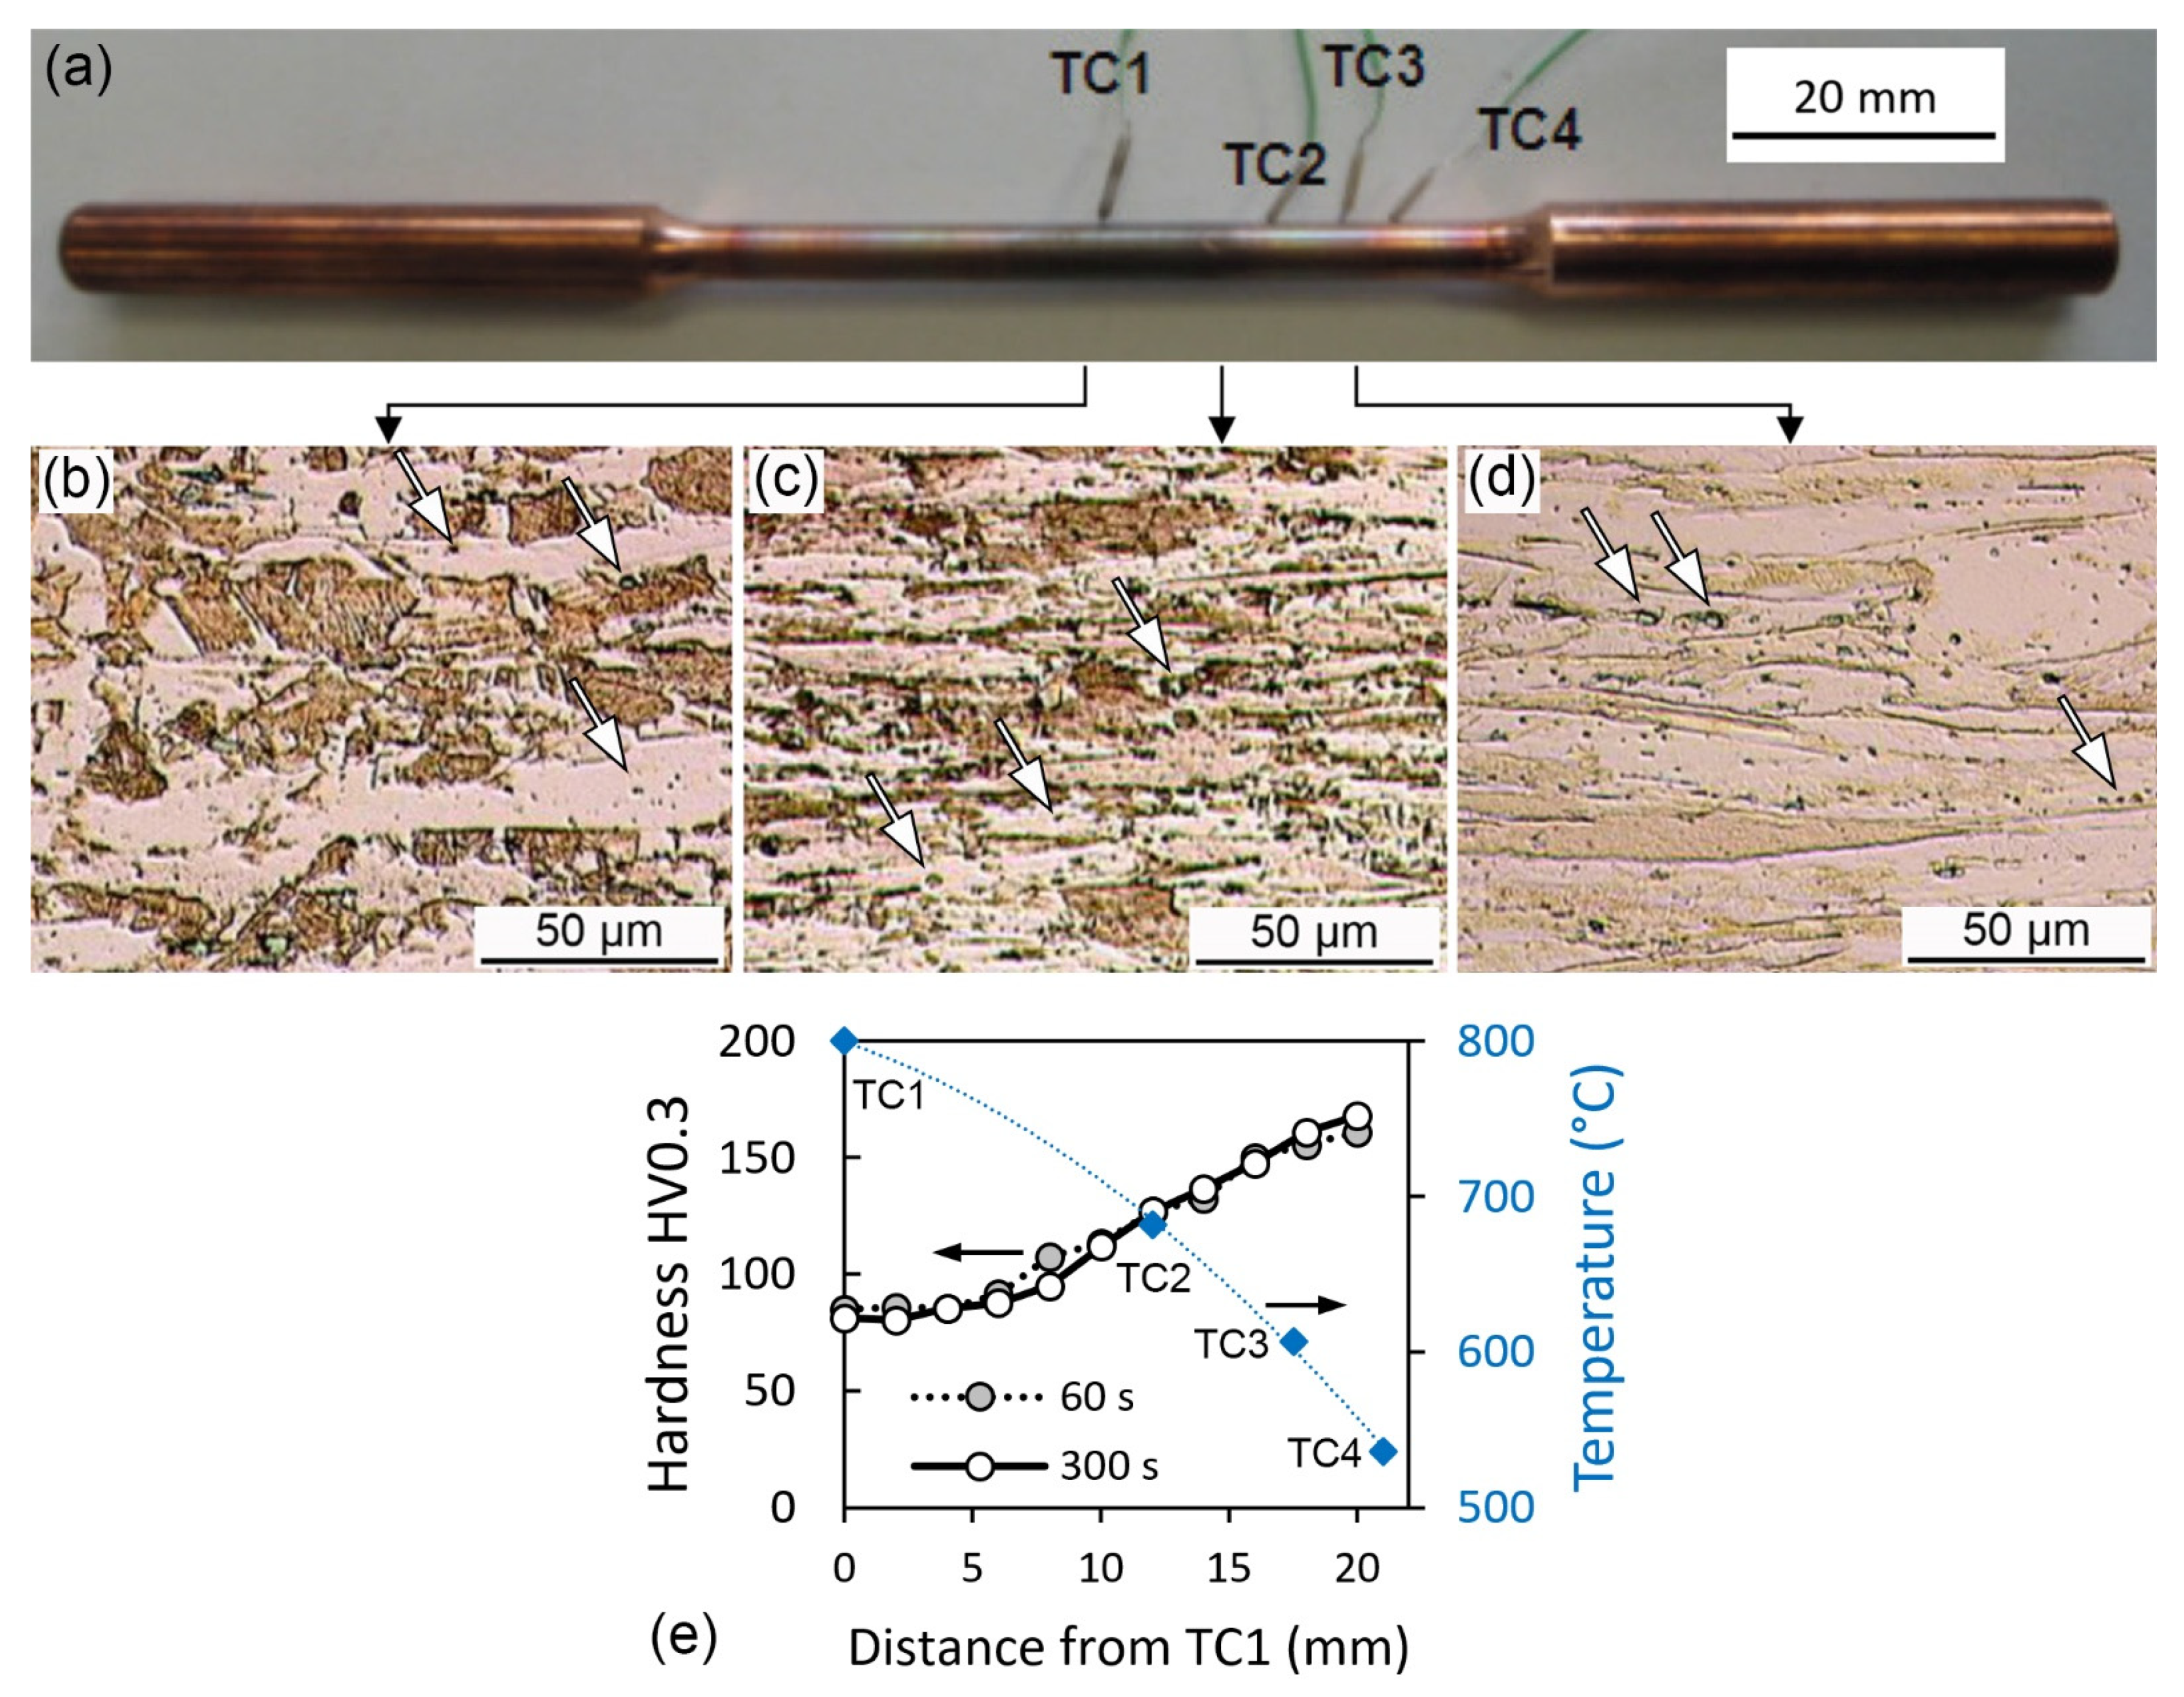
3.1. Grain structure and Hardness

A picture of a Gleeble round tensile test specimen with thermocouples is shown in Figure 1a. Water-cooled jaw carriers and copper grips hold the specimen in the vacuum chamber of the Gleeble 3550. The grain structure gradient (Figure 1b–d) corresponds to the gradient of the temperature between specimen ends and the center of the gauge length (thermocouple TC1); the readout of the thermocouples is shown in Figure 1e. It can be seen that in the middle of the specimen (TC1 position), annealing to 800 °C/60 s resulted in a partially (~50%) recrystallized microstructure with new grains about 45 μm in diameter (Figure 1b). The recrystallized fraction at TC2 is lower (Figure 1c), while at TC3 and TC4 the structure remains deformed (original grains approximately 175 μm in diameter are elongated along the drawing direction—Figure 1d). Coarse Cr- and ZrCr-rich [14] particles can also be seen inside Cu grains in Figure 1b–d (some of them are pointed by arrows); the size of the precipitates is under the resolution limit of the light microscopy. Microhardness increases from 85 HV0.3 to 161 HV0.3 from the area heated at 800 °C for 60 s (TC1) to the area exposed to a temperature of about 540 °C (TC4). Further soaking at 800 °C for up to 300 s did not lead to a significant change in hardness (corresponding values for TC1 and TC4 are 81 HV0.3 and 168 HV0.3, respectively—Figure 1e), nor in the grain structure. Tensile testing after heat treatment showed that the room temperature yield stress of the material is also largely impacted by the observed softening during annealing at 800°C (for details see Ref. [14]).

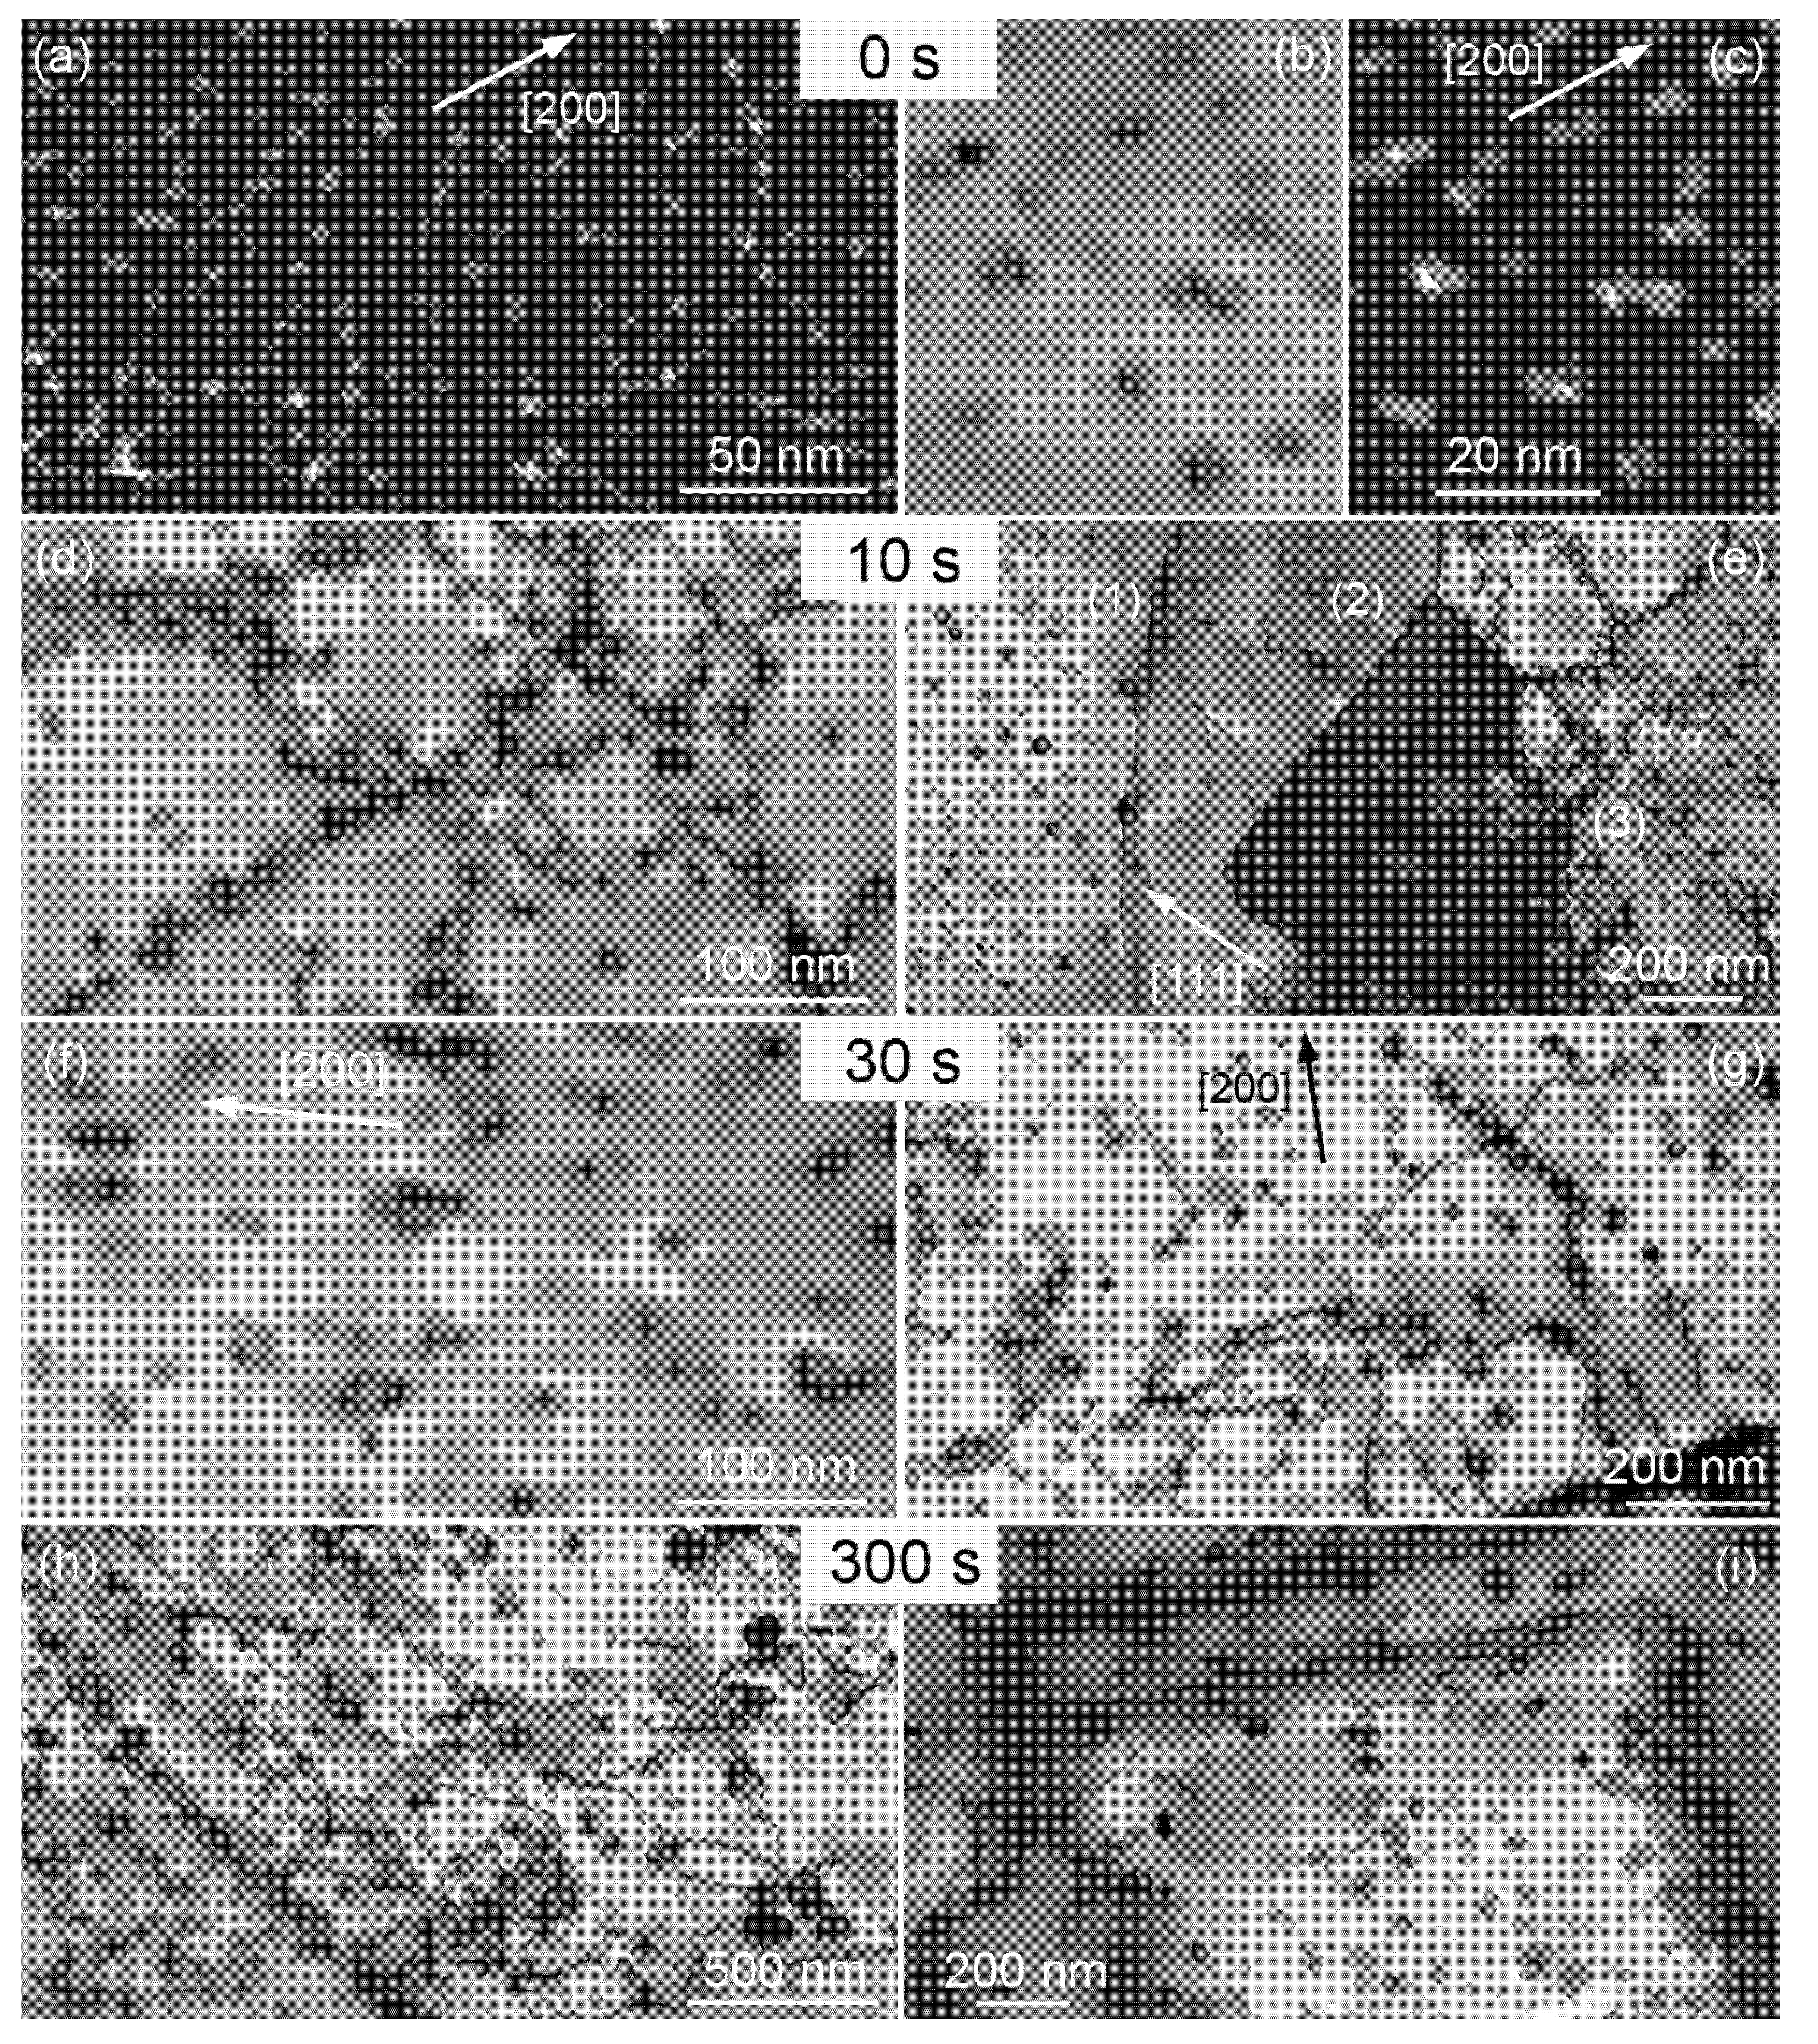
3.2. Substructure and Precipitates

In the initial (as-delivered) hardened condition, as previously investigated in [14], a dense distribution of tiny coherent Cr particles was found. The precipitates are evenly distributed, they appear also at subgrain and grain boundaries (the micrographs are not presented here). A general view of the dark field weak beam contrast (DFWB) is shown in Figure 2a. From the micrographs recorded at the highest magnification (500k) available (bright field—Figure 2b, the same area in DFWB—Figure 2c), it can be seen that tiny Cr particles exhibit complicated, so-called coffee-bean diffraction contrast with lobes due to misfit strains, which they induce in the matrix. The diameter of the particles corresponds to the length of the zero-contrast line between the lobes, and ranges from 1 to 4 nm, the mean value being 2 nm. The average number density of these particles, estimated from three micrographs, is about 6.2 × 10²² m−3, and the interparticle spacing is 25 nm (Table 1).
After annealing for 10 s at 800 °C, the particles have coarsened. Their shape is mostly spherical with a diameter ranging from 3 to 35 nm, the mean value being 8 nm (Figure 2d). Many of the particles are still coherent with the matrix (Figure 2d), others lost the coherency and their contrast around their circumference is regular (Figure 2e). In general, the particles remain closely spaced (average distance of 64 nm—Table 1). In consequence, they pin the grain boundaries and dislocations very effectively (Figure 2e) and hinder recovery and recrystallization. Figure 2e is a very instructive micrograph showing that even after only 10 s of annealing at 800 °C, there are already recrystallization nuclei formed in the alloy. The left part of the micrograph (1) is a diffraction contrast with g = [111], no dislocation is visible in this grain although the material was deformed by drawing with an area reduction of about 70% before annealing. Therefore, this gives strong evidence for a recrystallization nucleus with a high-angle grain boundary (with a typical fringe contrast). From its bowing, it can be seen that the boundary was moving from the left to the right, and it was pinned on two coarser particles. The next grain in the middle (2) can also be taken as a recrystallization nucleus as it contains only a few dislocations, presenting a zig-zag contrast (since they are tilted to the electron beam direction). The dark grain (very close to the Bragg diffraction condition) is another recrystallization nucleus that is forming. It has a high-angle boundary with a fringe contrast on the top, left, and bottom, while on the right there is only a low-angle grain boundary—a dislocation network. Thus, this grain connects recrystallization nuclei on the left with the recovered matrix in the right part of the micrograph (3), where subgrains and isolated dislocations are pinned on fine particles.
After annealing for 30 s at 800 °C, the microstructure did not change a lot when compared to the former annealing time (10 s). The particles are spherical, 3 to 35 nm in diameter; some of them did not lose coherency, so they present a coffee-bean strain field contrast (Figure 2f), and their average distance slightly increased to 75 nm (Table 1). The matrix is mostly recovered as it follows from Figure 2g, showing isolated dislocations pinned on the particles.
The microstructure after annealing for 300 s at 800 °C is shown in Figure 2h. The particles further coarsened, their diameter ranges from 10 to 100 nm, the mean values and average distances are 40 nm, and 163 nm, respectively (Table 1, Figure 3a). Figure 2i shows annealing twins, a typical feature for Cu alloys. Their boundaries in the micrograph are tilted to the electron beam and so they present a fringe contrast.

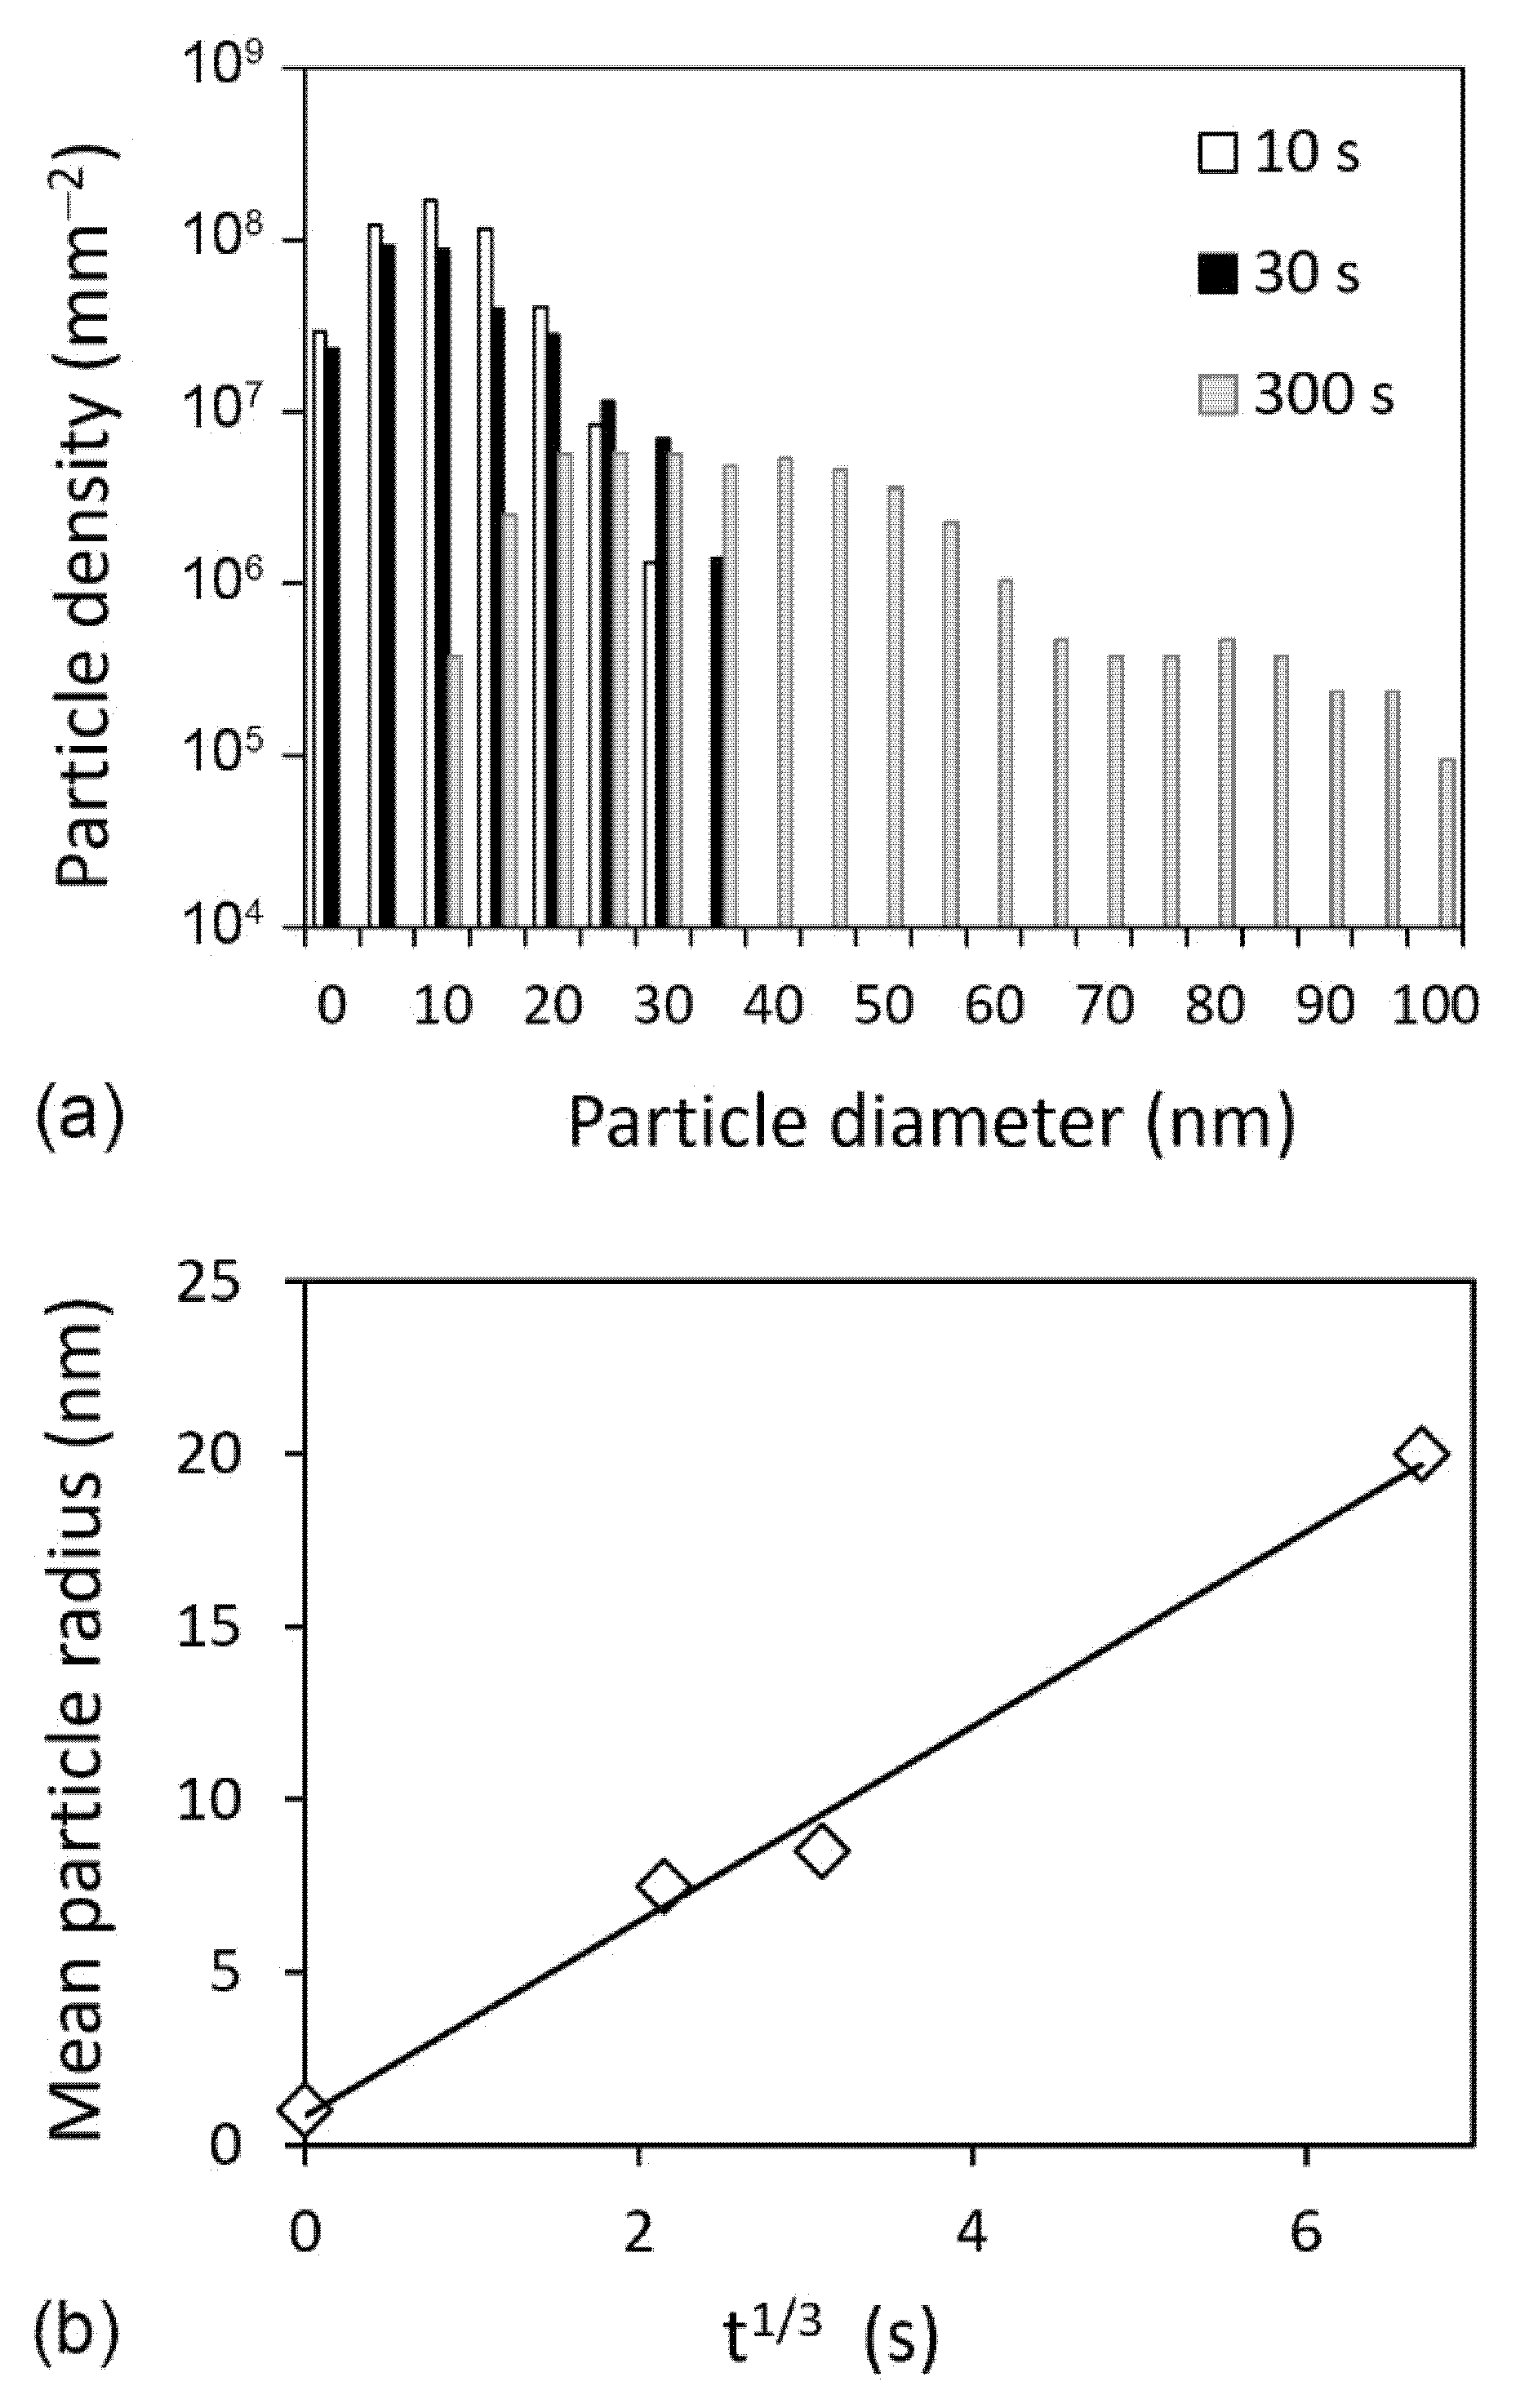
3.3. Quantitative Particle Analysis

The results of the quantitative particle analysis are summarized in Table 1, and histograms of the particle distribution in annealed conditions are shown in Figure 3a. The plot of the mean particle radius <R> vs. annealing time t1/3 is linear (Figure 3b), and so the kinetics of coarsening obeys Lifshitz, Sloyzov [15] and Wagner [16] (LSW) theory (<R>3 = Kt, where K is the rate constant). The average number density in the initial condition is similar to values found by Holzwarth et al. [17,18] or by Edwards et al. [19].

4. Conclusions

The grain structure of the CuCr1Zr alloy directly annealed by electric current in the Gleeble simulator showed a gradient corresponding to the gradient of the temperature on the test piece. Annealing at 800 °C/60 s resulted in a partially (~50%) recrystallized structure with new grains about 45 μm in diameter, and further soaking at 800 °C up to 300 s did not lead to a significant change in the grain structure. TEM observations revealed that first recrystallization nuclei form already during annealing for 10 s at 800 °C. In the as-delivered state, TEM documented tiny coherent precipitates of face-centered cubic (fcc) Cr inducing strain fields in the matrix. These particles exhibit a complicated contrast with lobes due to misfit strains that they induce in the matrix. The diameter of the particles corresponds to the length of the zero-contrast line between the lobes, and ranges from 1 to 4 nm, and the average interparticle spacing is 25 nm. During annealing, the particles lose their coherence and gradually coarsen up to a mean diameter of 40 nm after 300 s at 800 °C and an interparticle distance of 163 nm. The coarsening kinetics obeys Lifshitz, Sloyzov, and Wagner’s theory.

Author Contributions

Conceptualization, M.K., and P.P.; investigation, M.K., P.H., P.P., D.C.; writing—original draft preparation, M.K.; writing—review and editing, M.K., P.H., P.P., D.C. All authors have read and agreed to the published version of the manuscript.

Funding

This research was financially supported by European Regional Development Fund (ERDF) in the frame of the project Nanomaterials Centre for Advanced Applications, No. CZ.02.1.01/0.0/0.0/15_003/0000485. P.P. and D.C. would also like to acknowledge the financial support from Région Bretagne (Grant ELECSOUD of E. Gauthier). The Gleeble 3500 machine at Université de Bretagne-Sud was co-financed by the ERDF.

Data Availability Statement

Not applicable.

Acknowledgments

Le Bronze Alloys company is acknowledged for its helpful collaboration.

Conflicts of Interest

The authors declare no conflict of interest.

References

  1. Higashijima, S.; Sakurai, S.; Sakasai, A. Heat treatment of CuCrZr cooling tubes for JT-60SA monoblock-type divertor targets. J. Nucl. Mater. 2011, 417, 912–915. [Google Scholar] [CrossRef]
  2. European Standard. EN 12163. Copper and Copper Alloys—Rods for General Purposes; European Committee for Standardization: Brussels, Belgium, 2016. [Google Scholar]
  3. Liu, Y.; Zhou, P.; Liu, S.; Du, Y. Experimental investigation and thermodynamic description of the Cu-Cr-Zr system. Calphad 2017, 59, 1–11. [Google Scholar] [CrossRef]
  4. Fuxiang, H.; Jusheng, M.; Honglong, N.; Zhiting, G.; Chao, L.; Shumei, G.; Xuetao, Y.; Tao, W.; Hong, L.; Huafen, L. Analysis of phases in a Cu–Cr–Zr alloy. Scr. Mater. 2003, 48, 97–102. [Google Scholar] [CrossRef]
  5. Li, H.; Xie, S.; Wu, P.; Mi, X. Study on improvement of conductivity of Cu-Cr-Zr alloys. Rare Met. 2007, 26, 124–130. [Google Scholar] [CrossRef]
  6. Lin, G.B.; Wang, Z.D.; Zhang, M.K.; Zhang, H.; Zhao, M. Heat treatment method for making high strength and conductivity Cu–Cr–Zr alloy. Mater. Sci. Technol. 2011, 27, 966–969. [Google Scholar] [CrossRef]
  7. Zhao, M.; Lin, G.; Wang, Z.; Zhang, M. Analysis of precipitation in a Cu–Cr–Zr alloy. China Foundry 2008, 5, 268–271. [Google Scholar]
  8. Chbihi, A.; Sauvage, X.; Blavette, D. Atomic scale investigation of Cr precipitation in copper. Acta Mater. 2012, 60, 4575–4585. [Google Scholar] [CrossRef] [Green Version]
  9. Chen, X.; Jiang, F.; Liu, L.; Huang, H.; Shi, Z. Structure and orientation relationship of new precipitates in a Cu–Cr–Zr alloy. Mater. Sci. Technol. 2017, 34, 282–288. [Google Scholar] [CrossRef]
  10. Gauthier, E.; Carron, D.; Rogeon, P.; Pilvin, P.; Pouvreau, C.; Lety, T.; Primaux, F. Numerical modeling of electrode degradation during resistance spot welding using CuCrZr electrodes. J. Mater. Eng. Perform. 2014, 23, 1593–1599. [Google Scholar] [CrossRef]
  11. Gleeble Systems. Available online: http://www.gleeble.com/ (accessed on 28 May 2021).
  12. Jems; Version V4; Jems-Swiss: Jongny, Switzerland, 2020; Available online: https://www.jems-swiss.ch/ (accessed on 28 May 2021).
  13. Ondráček, J. Quantitative Analysis of Fine Particles in Al-Mn Alloys. Bachelor’s Thesis, Faculty of Nuclear Sciences and Physical Engineering, Czech Technical University, Prague, Czech Republic, 2009. (In Czech). [Google Scholar]
  14. Gauthier, E. Experimental and Numerical Study of the Cyclic Degradation of the CuCr1Zr Electrodes during Resistance Spot Welding. Ph.D. Thesis, Université de Bretagne Sud, Lorient, France, 2014. (In French). Available online: https://tel.archives-ouvertes.fr/tel-01045222. (accessed on 28 May 2021).
  15. Lifshitz, I.; Slyozov, V. The kinetics of precipitation from supersaturated solid solutions. J. Phys. Chem. Solids 1961, 19, 35–50. [Google Scholar] [CrossRef]
  16. Wagner, C. Theorie der Alterung von Niederschlägen durch Umlösen (Ostwald-Reifung). Z. Elektrochem. 1961, 65, 581–591. [Google Scholar] [CrossRef]
  17. Holzwarth, U.; Stamm, H.; Pisoni, M.; Volcan, A.; Scholz, R. The recovery of tensile properties of CuCrZr alloy after hot isostatic pressing. Fusion Eng. Des. 2000, 51–52, 111–116. [Google Scholar] [CrossRef]
  18. Holzwarth, U.; Stamm, H. The precipitation behaviour of ITER-grade Cu–Cr–Zr alloy after simulating the thermal cycle of hot isostatic pressing. J. Nucl. Mater. 2000, 279, 31–45. [Google Scholar] [CrossRef]
  19. Edwards, D.; Singh, B.; Tähtinen, S. Effect of heat treatments on precipitate microstructure and mechanical properties of a CuCrZr alloy. J. Nucl. Mater. 2007, 367–370, 904–909. [Google Scholar] [CrossRef] [Green Version]
Figure 1. Test specimen with thermocouples (a) and grain structure (bd) related to the gradient of the temperature (e) during annealing 800 °C/60 s by electric current in the Gleeble machine; microhardness values (e) correspond to annealing for 60 and 300 s.
Metals 11 01074 g001
Figure 2. TEM micrographs of the Cr precipitate in the CuCr1Zr alloy in the initial condition (0 s) and during annealing at 800 °C for 10, 30 and 300 s by electric current in the Gleeble thermal–mechanical simulator (see text for details).
Metals 11 01074 g002
Figure 3. (a) Histograms of the particle size distribution in annealed conditions, (b) plot of the mean particle radius vs. annealing time t1/3.
Metals 11 01074 g003
Table 1. Results of the quantitative particle analysis.
Annealing Time at 800 °C
(s)
Number of Micrographs EvaluatedNumber of ParticlesAVG Volume FractionMean Particle Radius
(nm)
AVG Distance between Particles
(nm)
AVG Number Density
(m−3)
033952.6 × 10−41256.2 × 1022
10318541.2 × 10−27.5644.5 × 1021
30312201.2 × 10−28.5753.0 × 1021
300510821.2 × 10−2201632.7 × 1020
Publisher’s Note: MDPI stays neutral with regard to jurisdictional claims in published maps and institutional affiliations.

