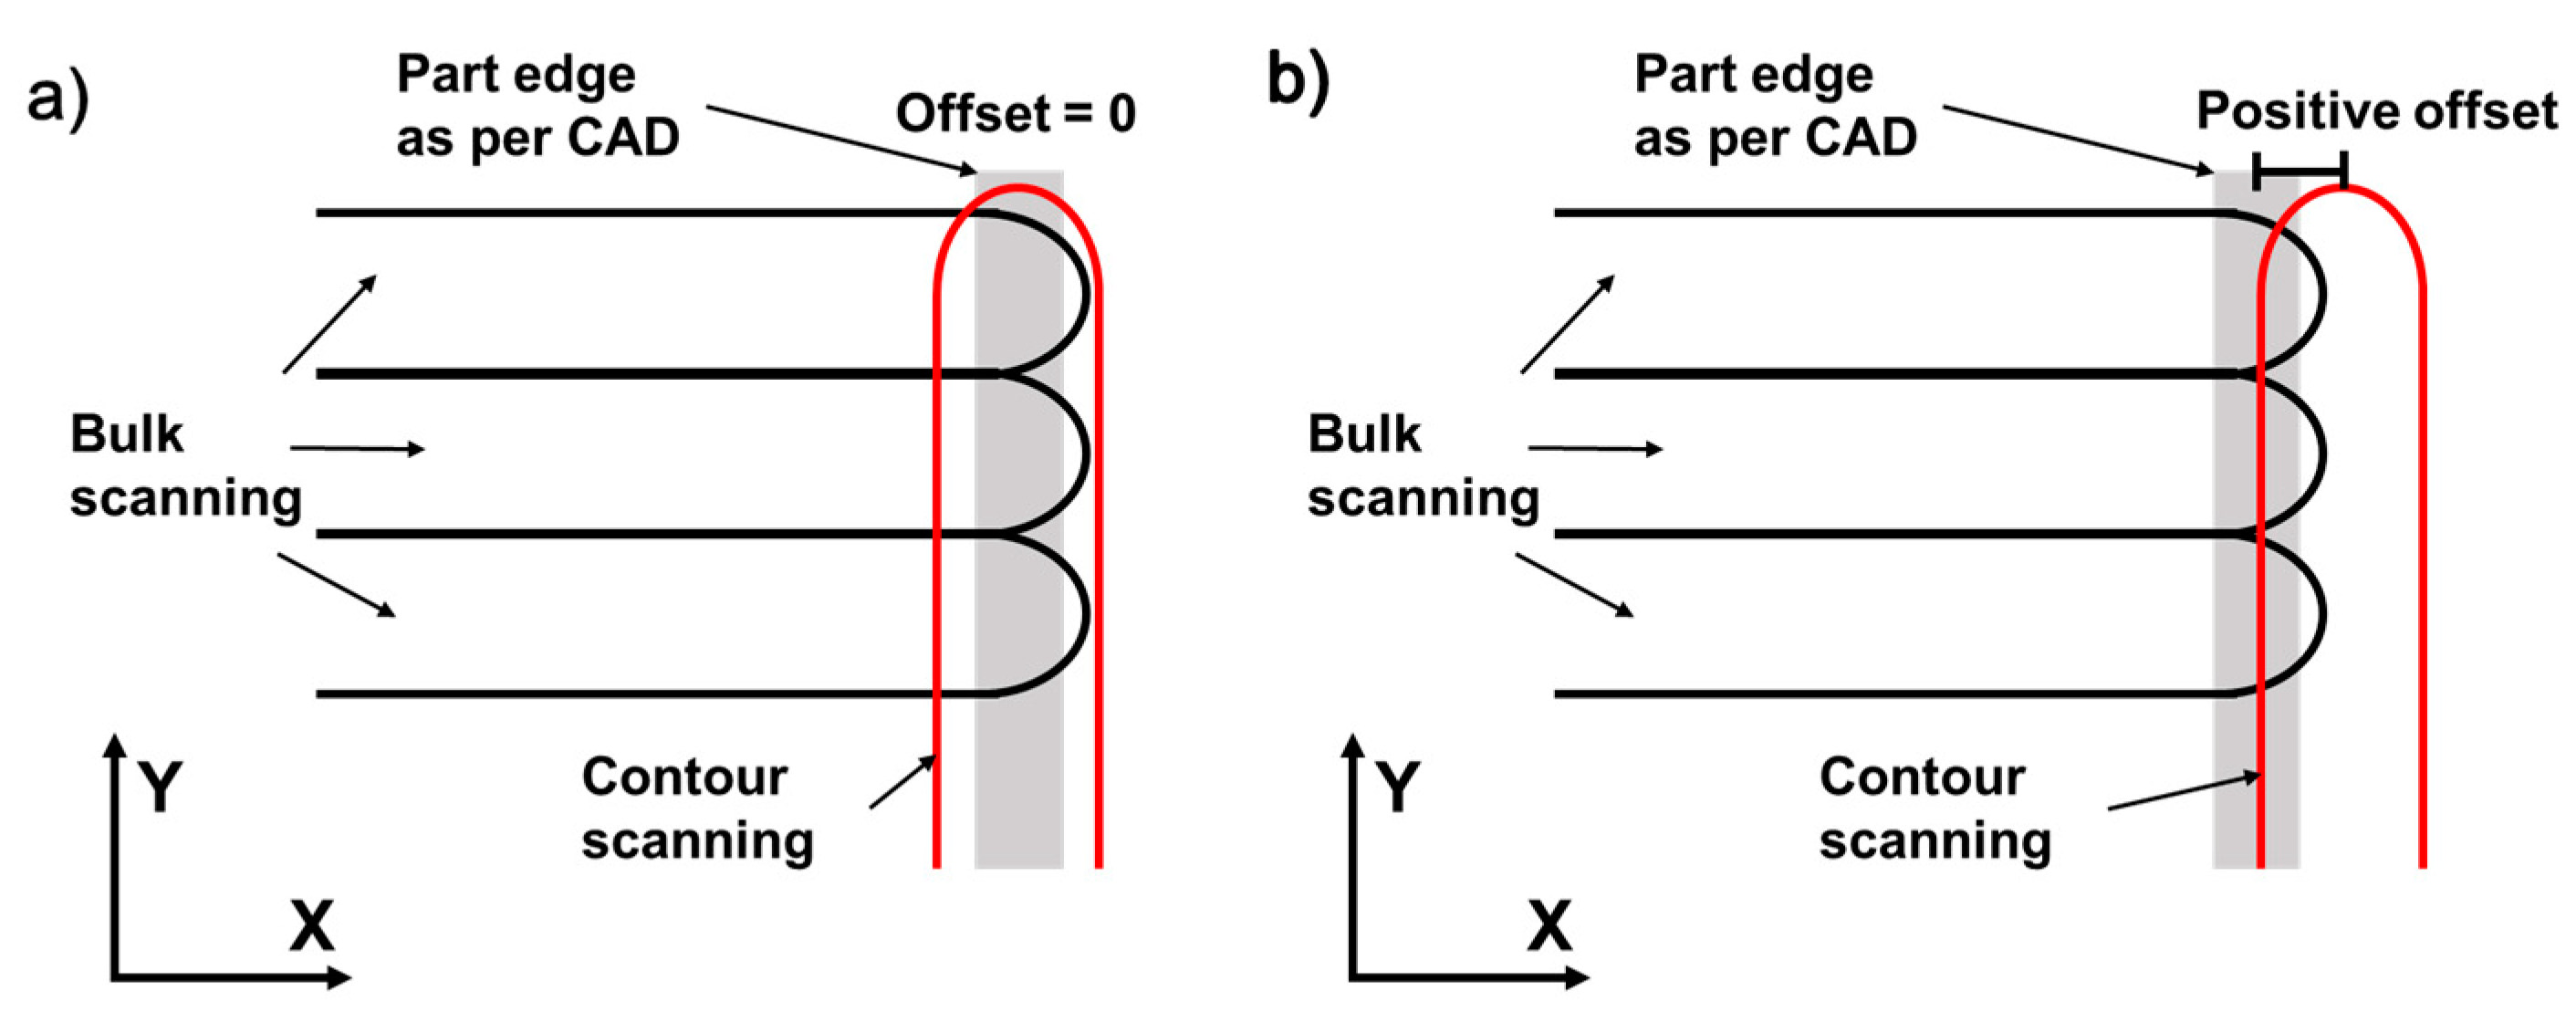
The contour scanning deployed during the LB-PBF process to achieve better surface characteristics is a well-recognized method [
22,
23]. It is completed because the optimum parameters for achieving the best surface and bulk density are not the same. A different laser power to speed ratio is used at the surface to re-melt the already existing bulk to have a better surface finish [
22,
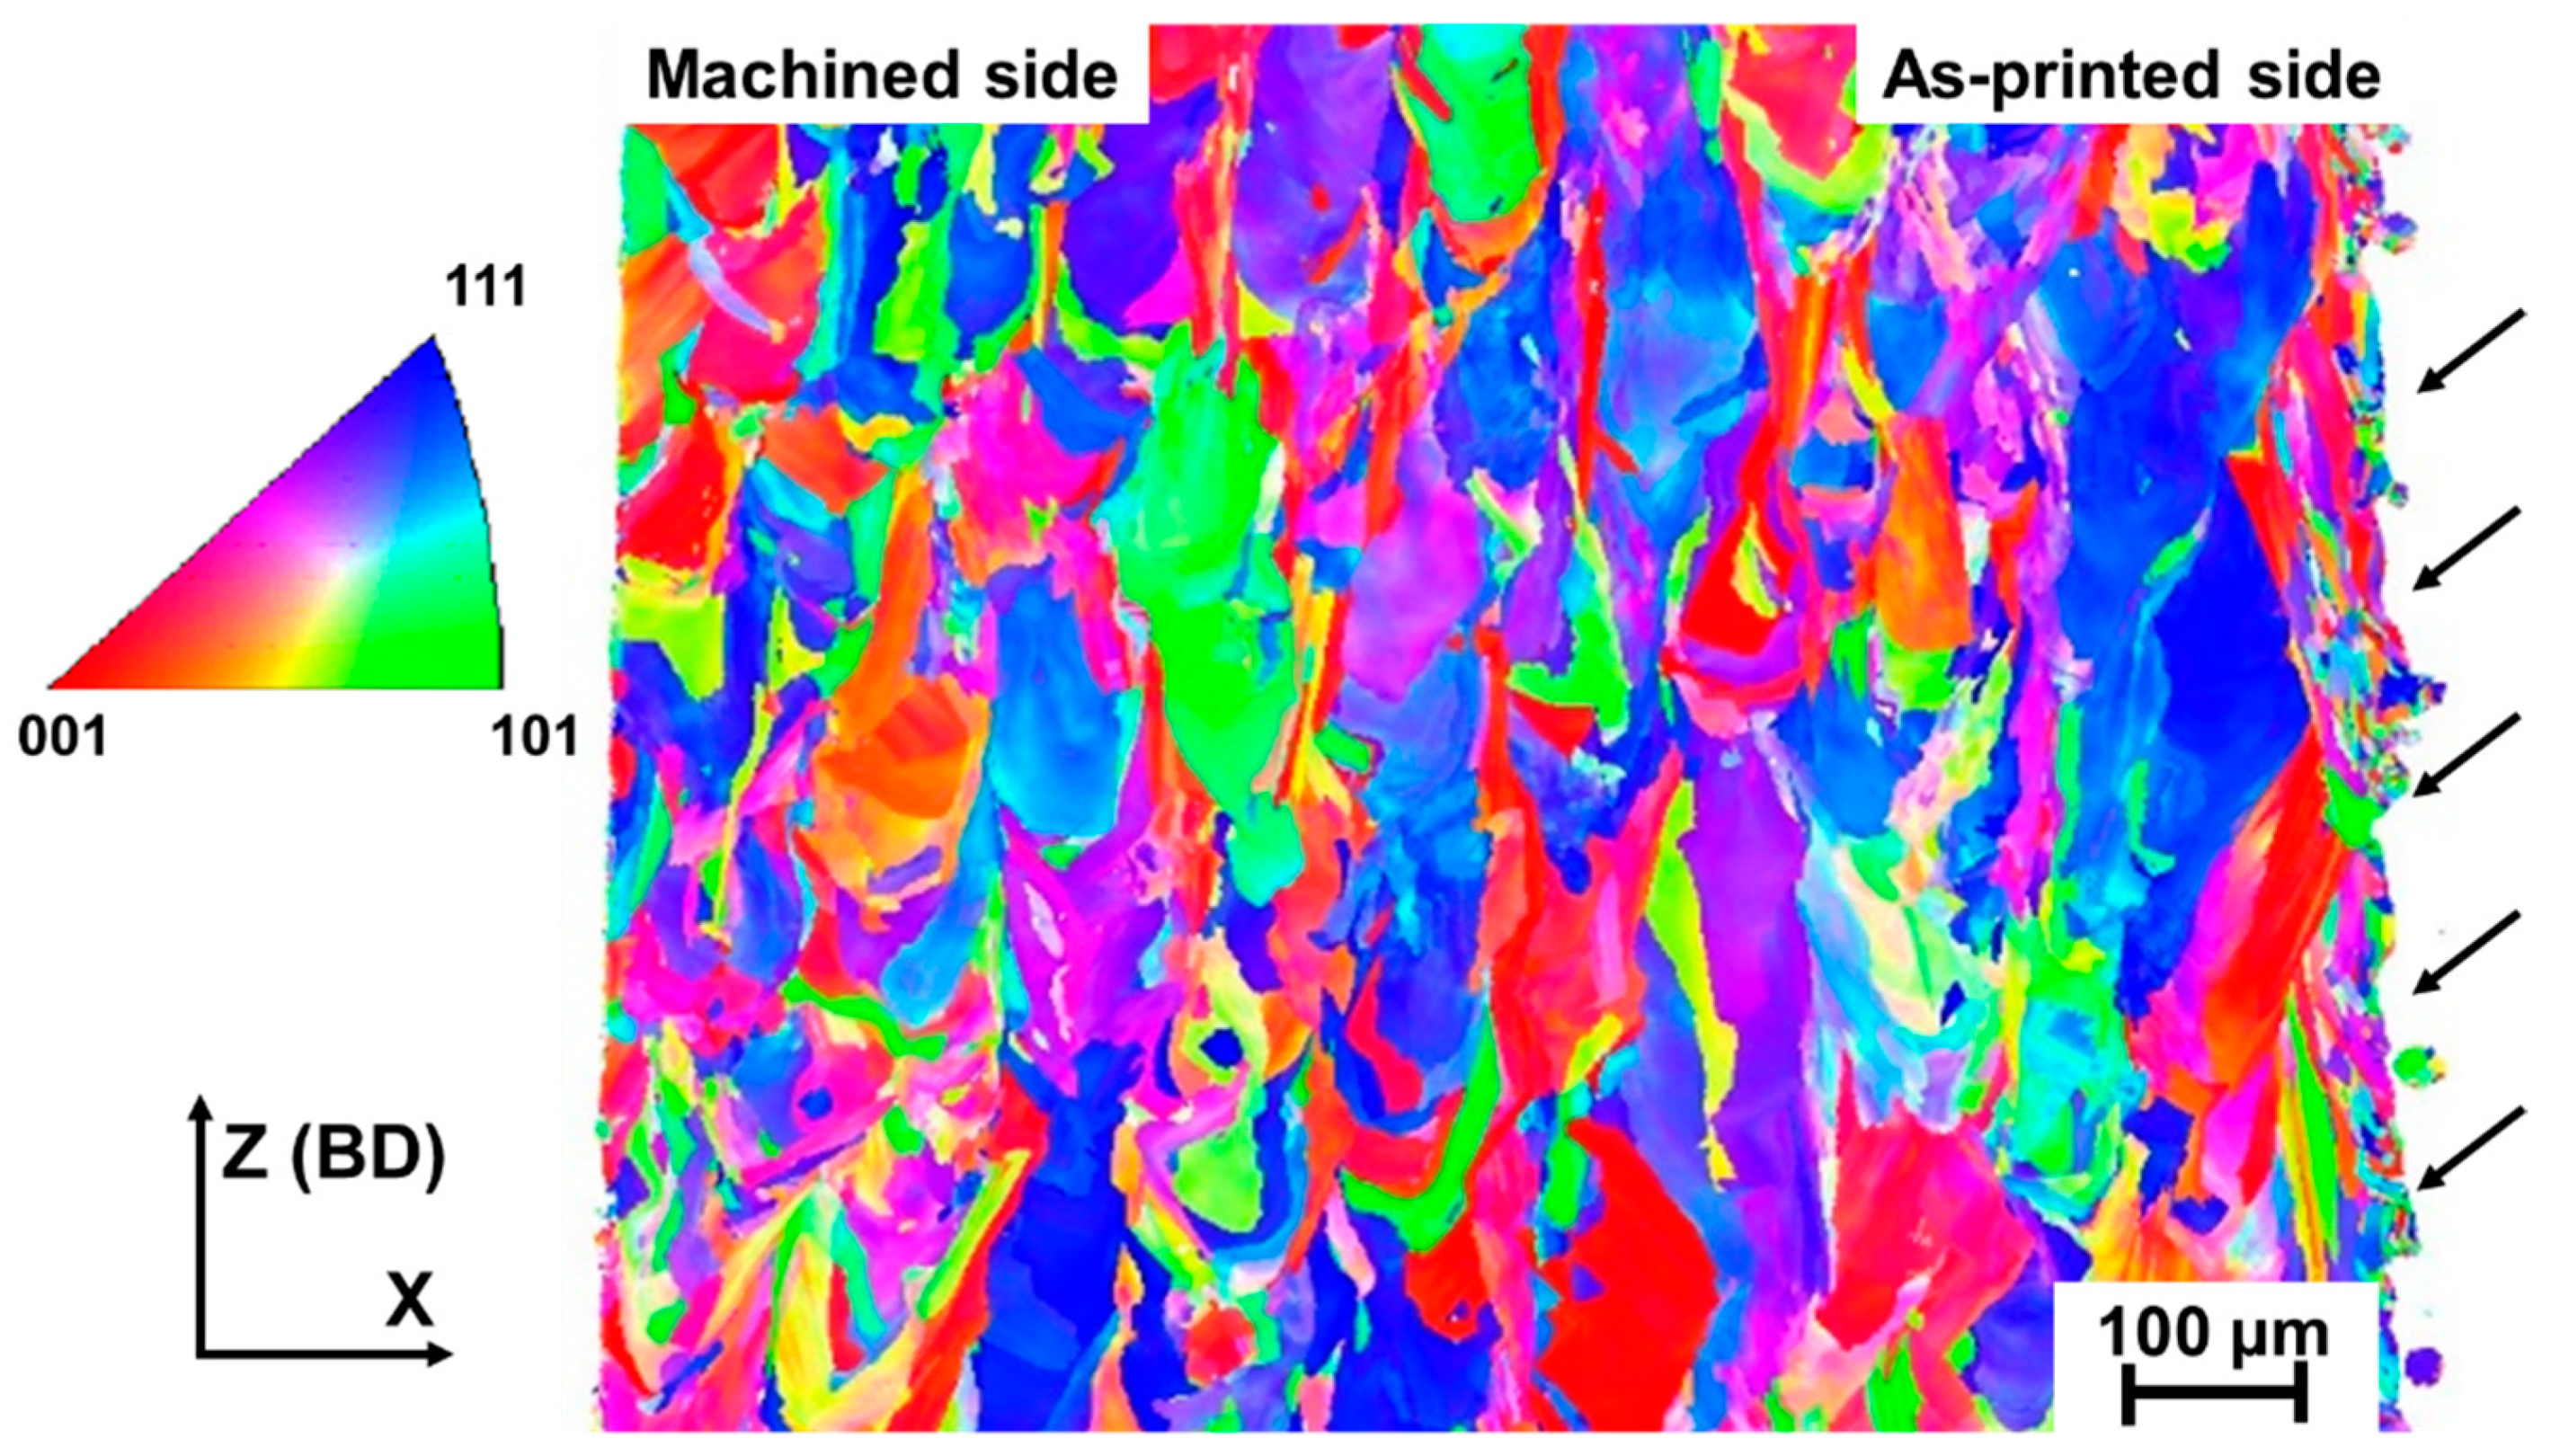
24]. This re-melting also causes a change in grain texture, thus proving a change in thermal history as compared to bulk specimen, as shown in
Figure 9. This difference in processing parameters is required since a better surface quality is desired on the surface, and a near-dense part is required in the bulk. A better-quality surface is critical for improving mechanical properties such as fatigue resistance and elongation before failure in tensile loading, which are highly dependent on the quality of surface and surface/sub-surface defects [
17,
25]. However, creating better surfaces is not the only application for AM materials, and it may create limitations for other properties, such as compressive properties or a drop in yield resistance for thin-wall structures. It has been shown that a reduction in tensile yield strength is observed when the thickness of samples is reduced [
14,
15]. Further, to prove that contour scanning has a decisive role to play,
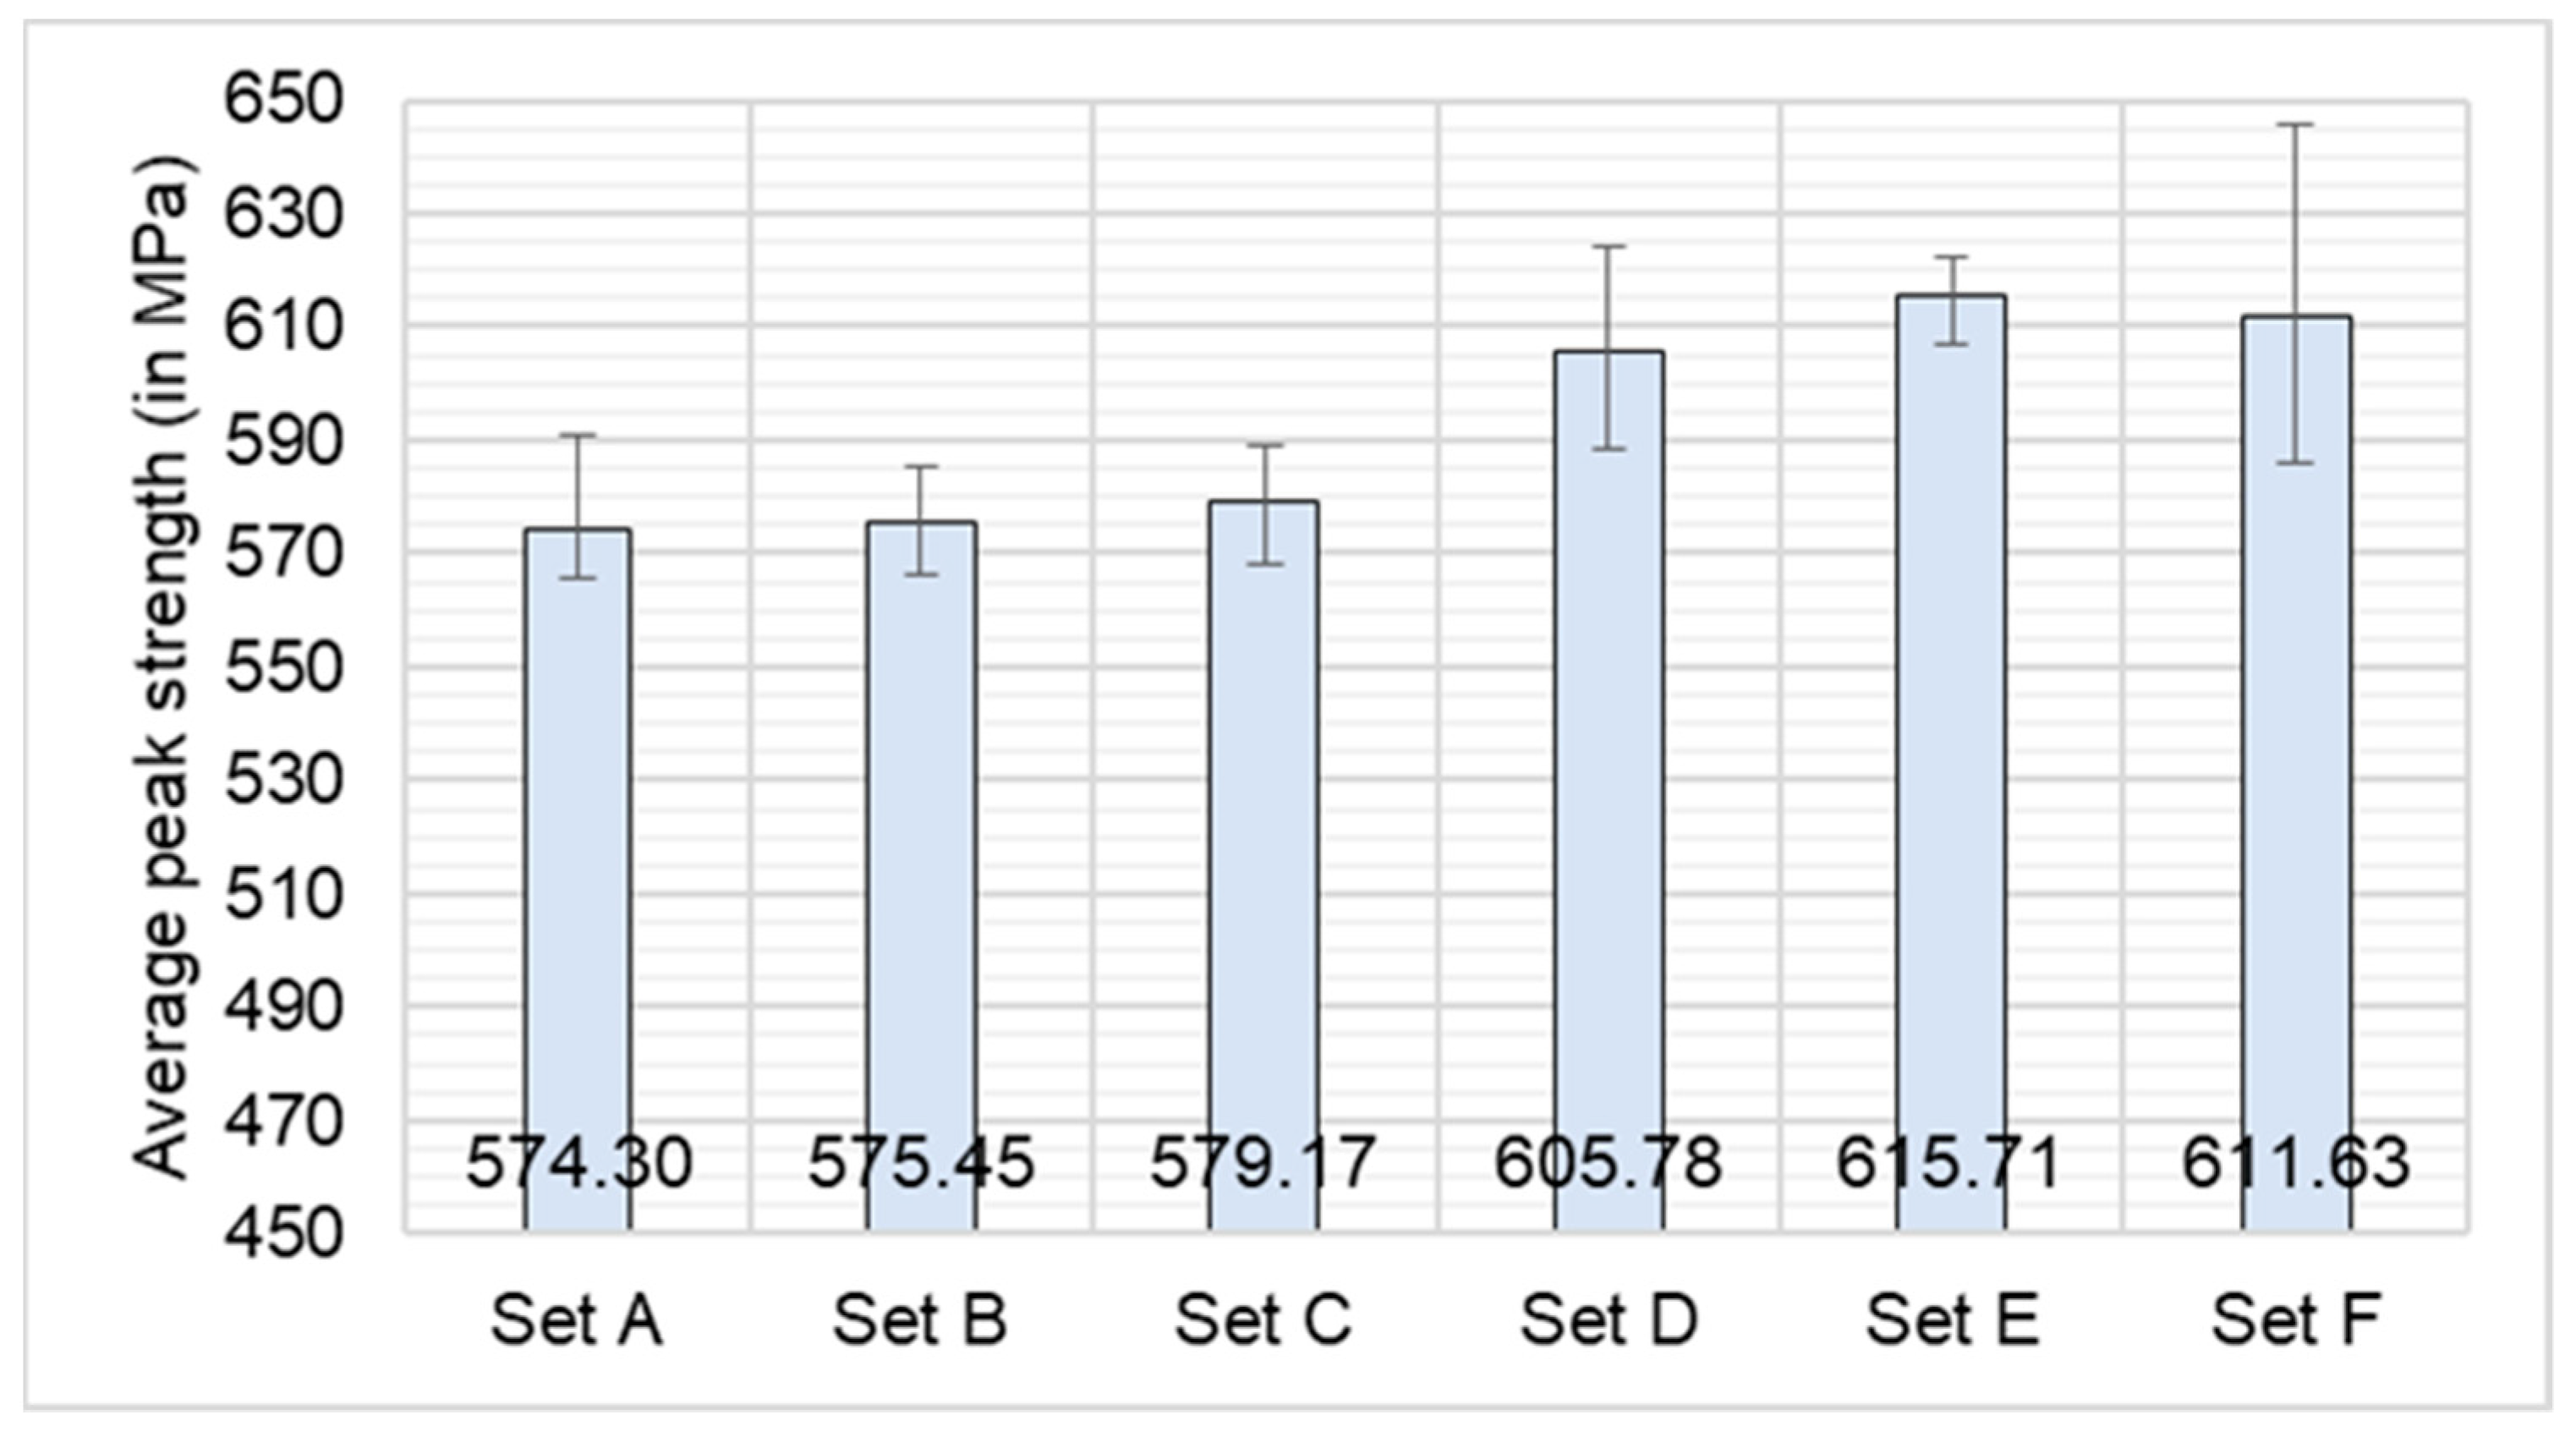
Figure 11 clearly shows that just by improving the surface roughness (sandblasting), there is a negligible increase in compressive properties. It is only by removing the soft surface layer completely (set D–F) that the full strength of the material is realized.
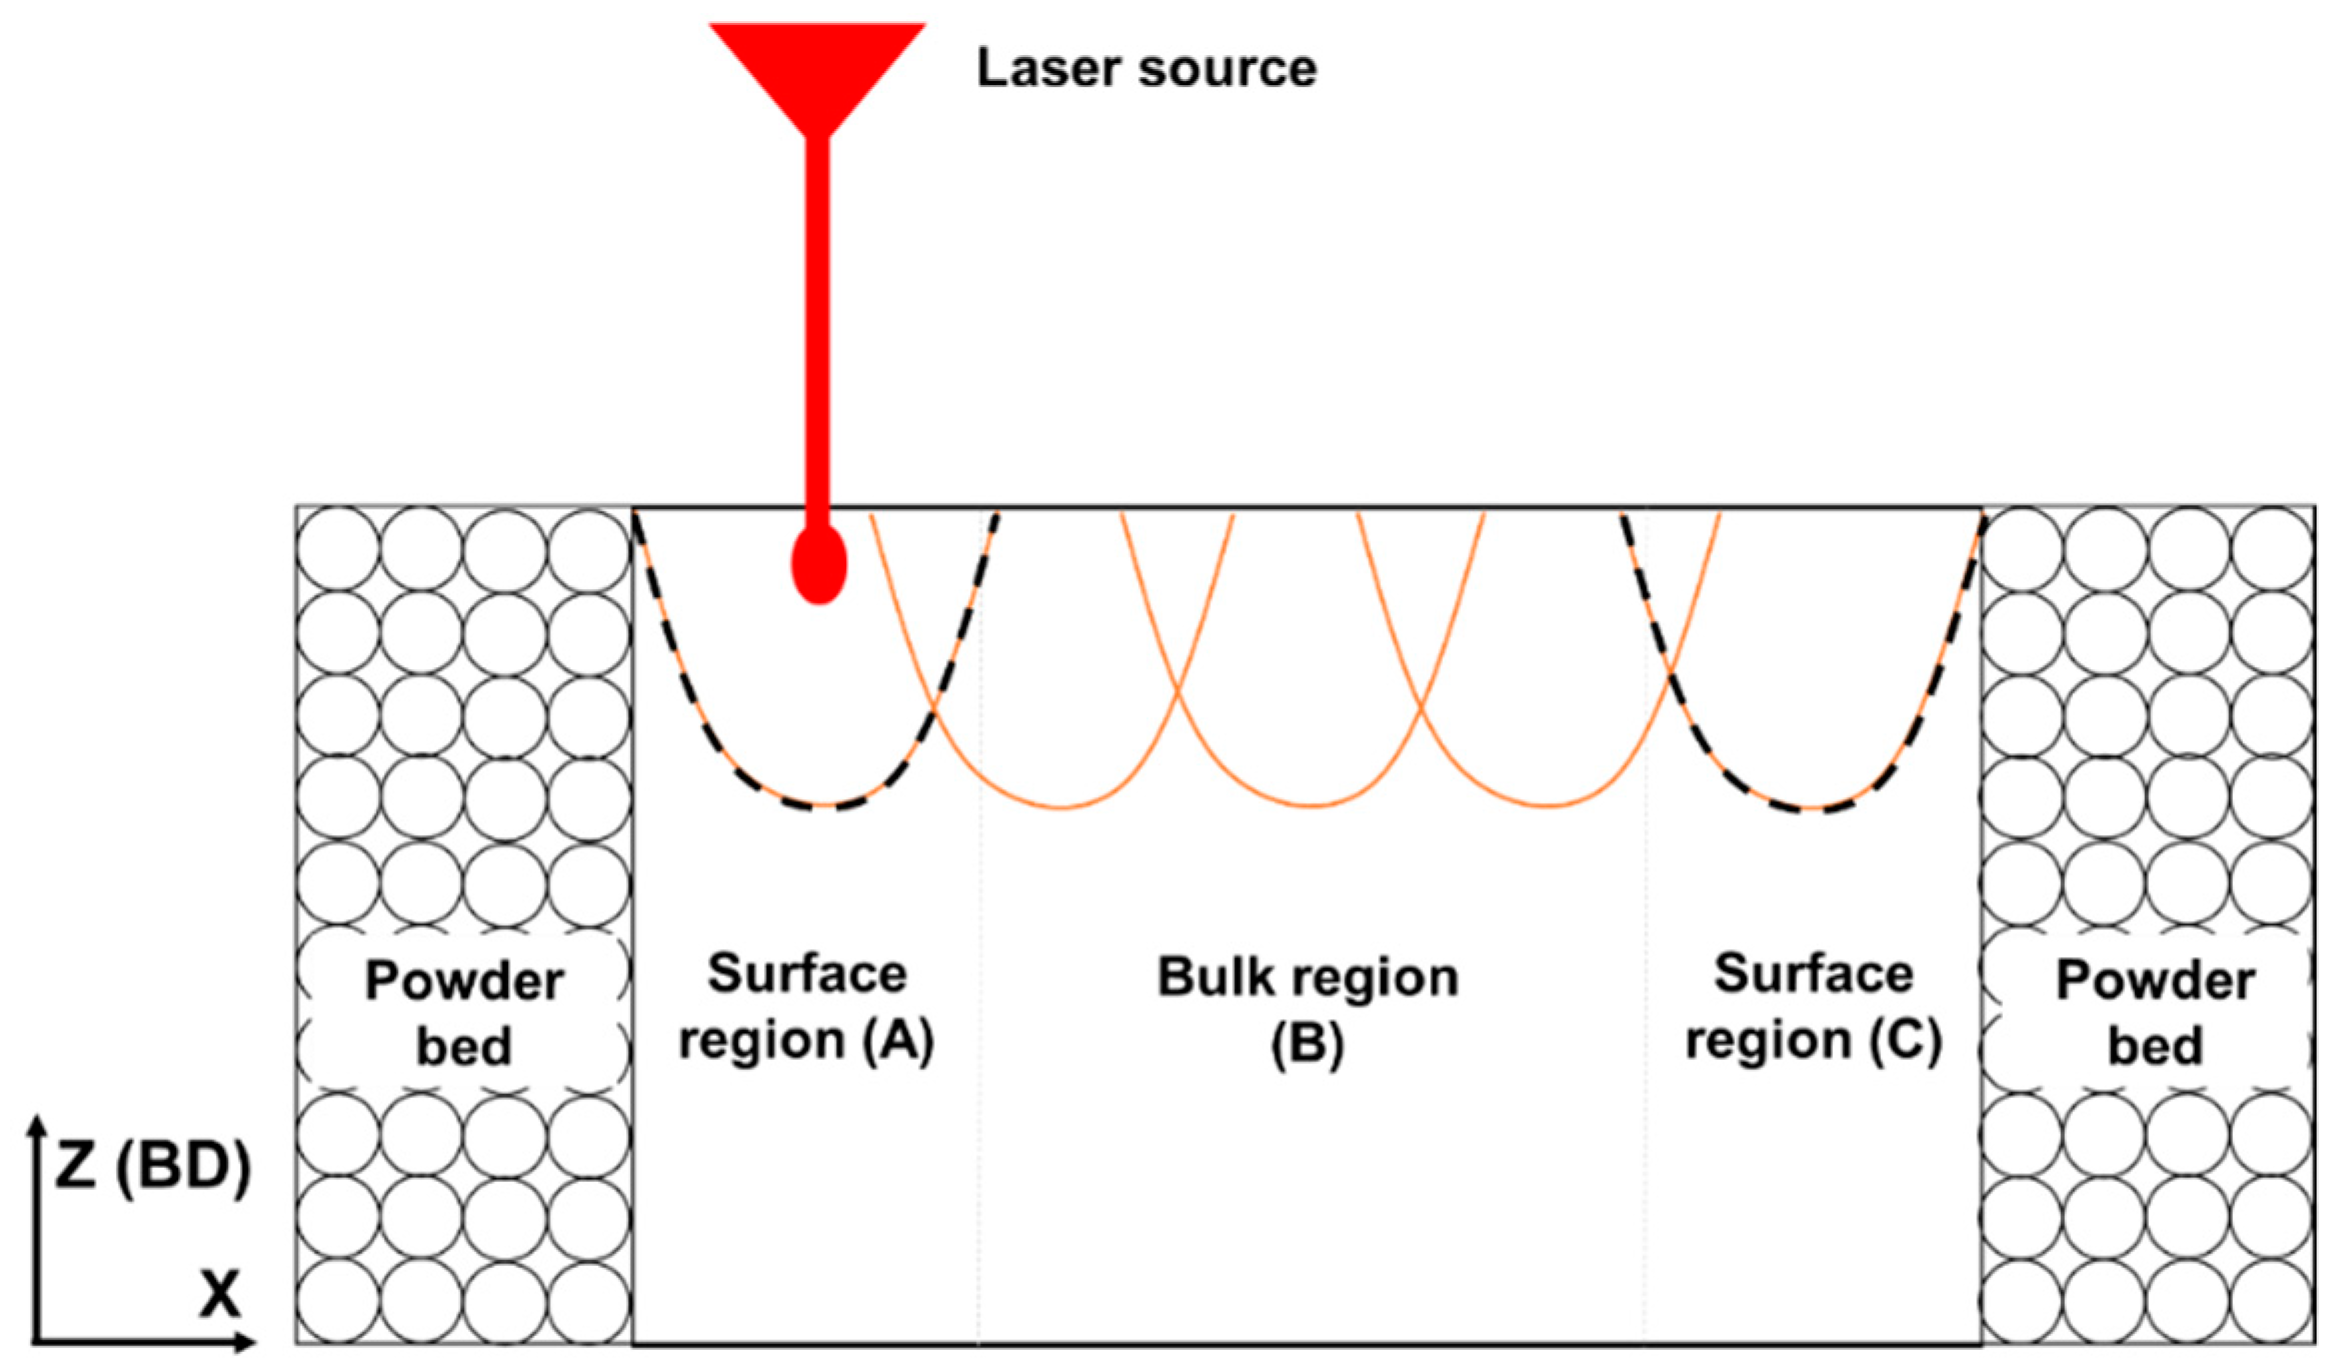
In
Figure 12, a schematic of the melt pool forming at the surface region is shown. It shows that contour scanning would cause re-melting of the surface region, thus letting the heat stay longer in those regions, causing a local softening effect. The generic effect of heat treatments to reduce dislocation densities in bulk AM materials has been shown before [
5]. It was shown that there is a microhardness loss from 3.2 ± 0.1 GPa to 2.2 ± 0.1 GPa after annealing the samples at 1073 K for 6 min under Ar atmosphere. This resulting microhardness was similar to that of wrought solution annealed and cast 316L stainless steel, which is 2.1 ± 0.1 GPa [
26]. Hence, this argumentation suggests that inherent heat treatments, such as the one caused by contour scanning on the surface melt pool, could lead to local softening of the surface zone. Considering the proposed surface layer model [
12], where it is said that the dislocation structure close to the surface is different compared to that inside the part, it can be anticipated that this causes a local change in the plastic regime. Additionally, it is well-known that surface grain microstructure is usually depleted in dislocation density for thin samples which are conventionally manufactured [
27], but that is again not necessarily the same mechanism as the thermal gradients and processing conditions in LB-PBF materials are quite different. In LB-PBF, heat is conducted away to the bottom of the part, as the part is usually covered by a powder bed known to conduct less heat than solid material [
28].
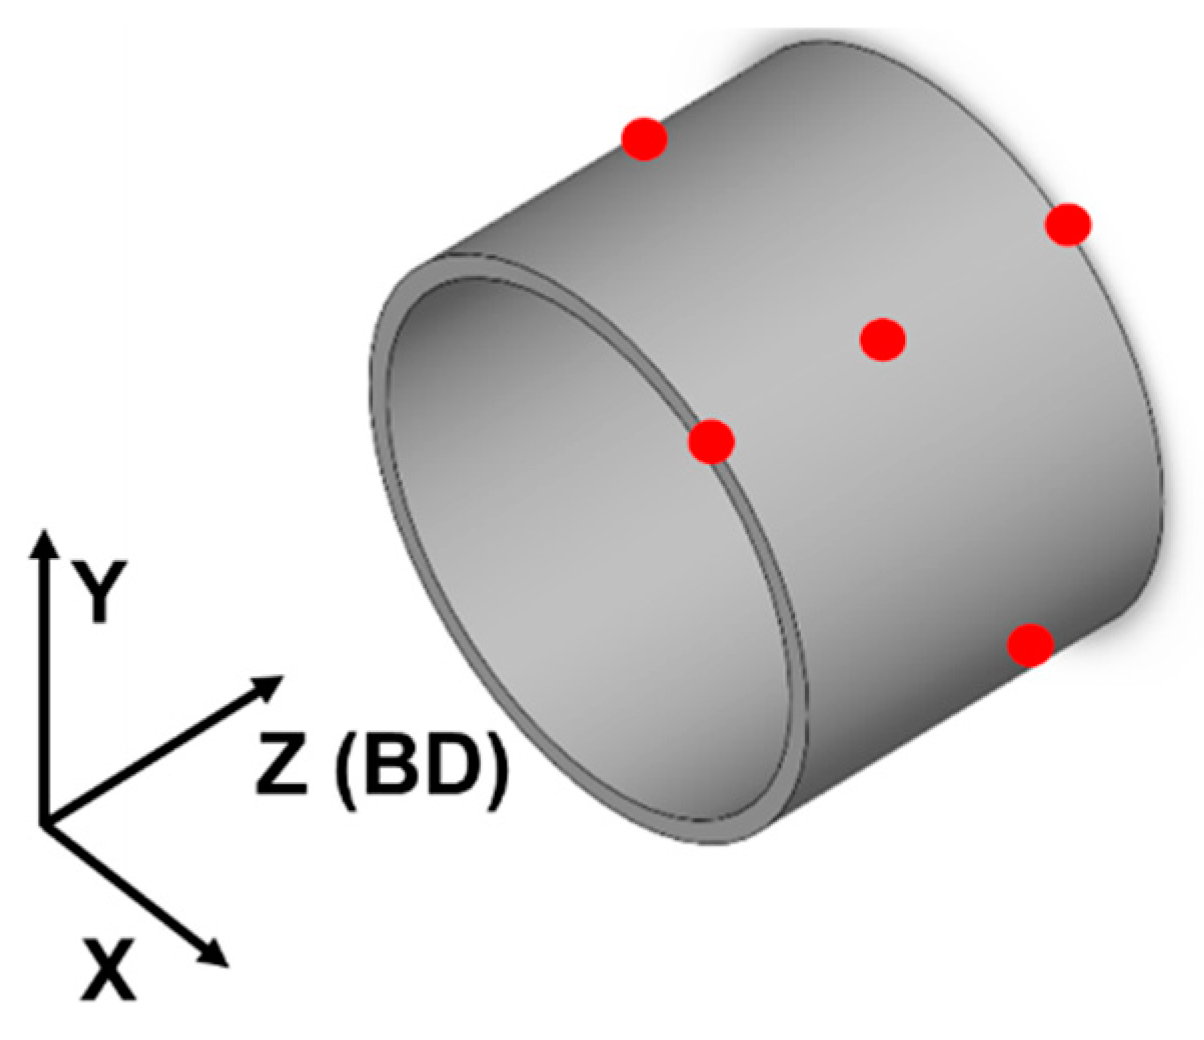
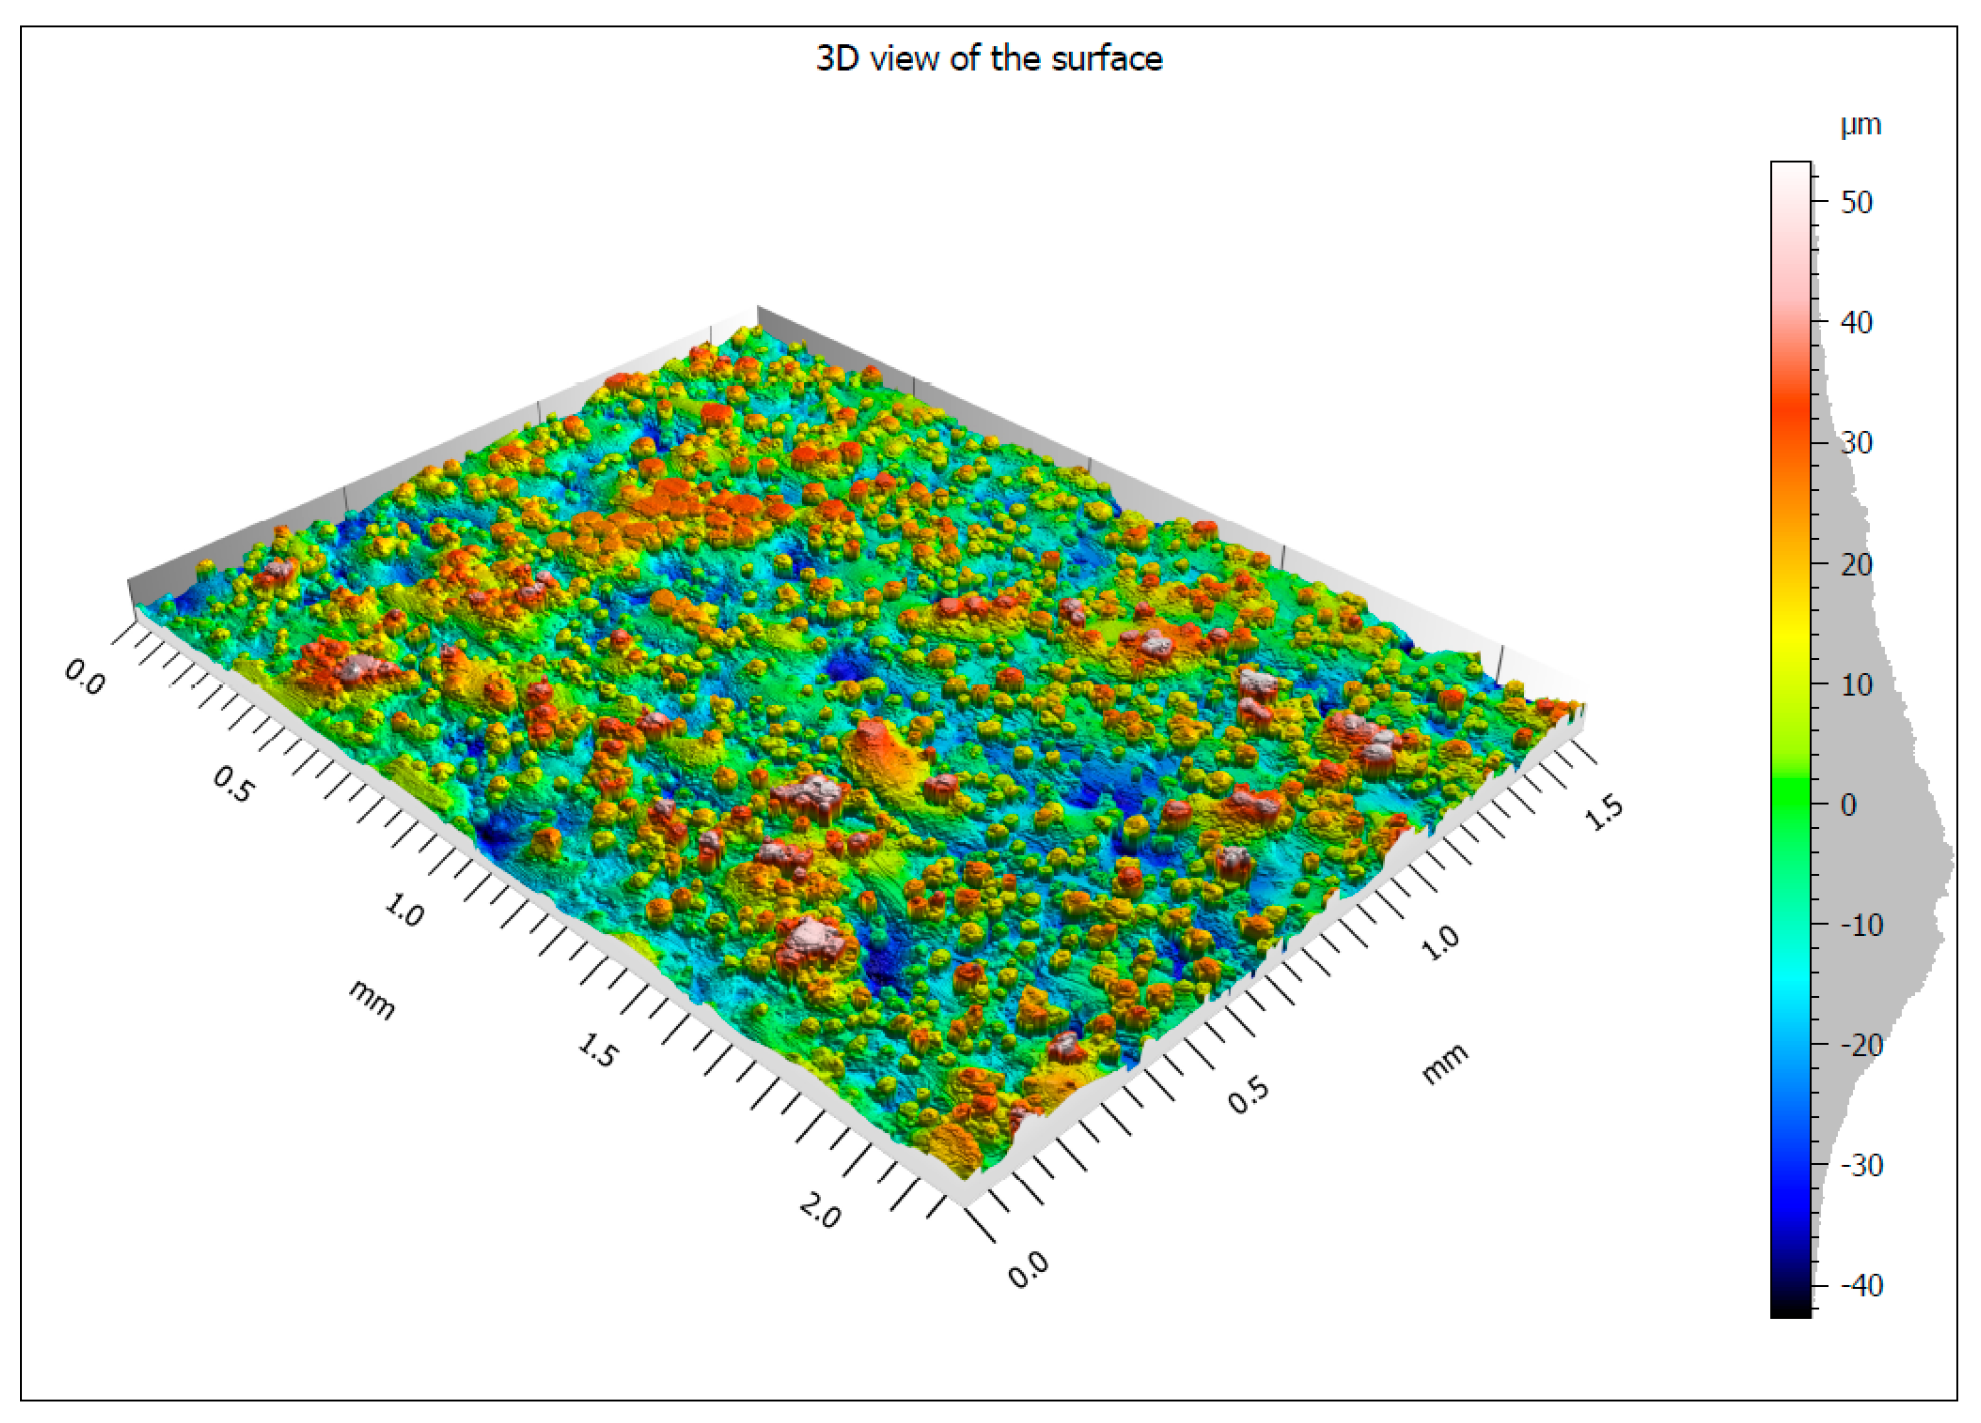
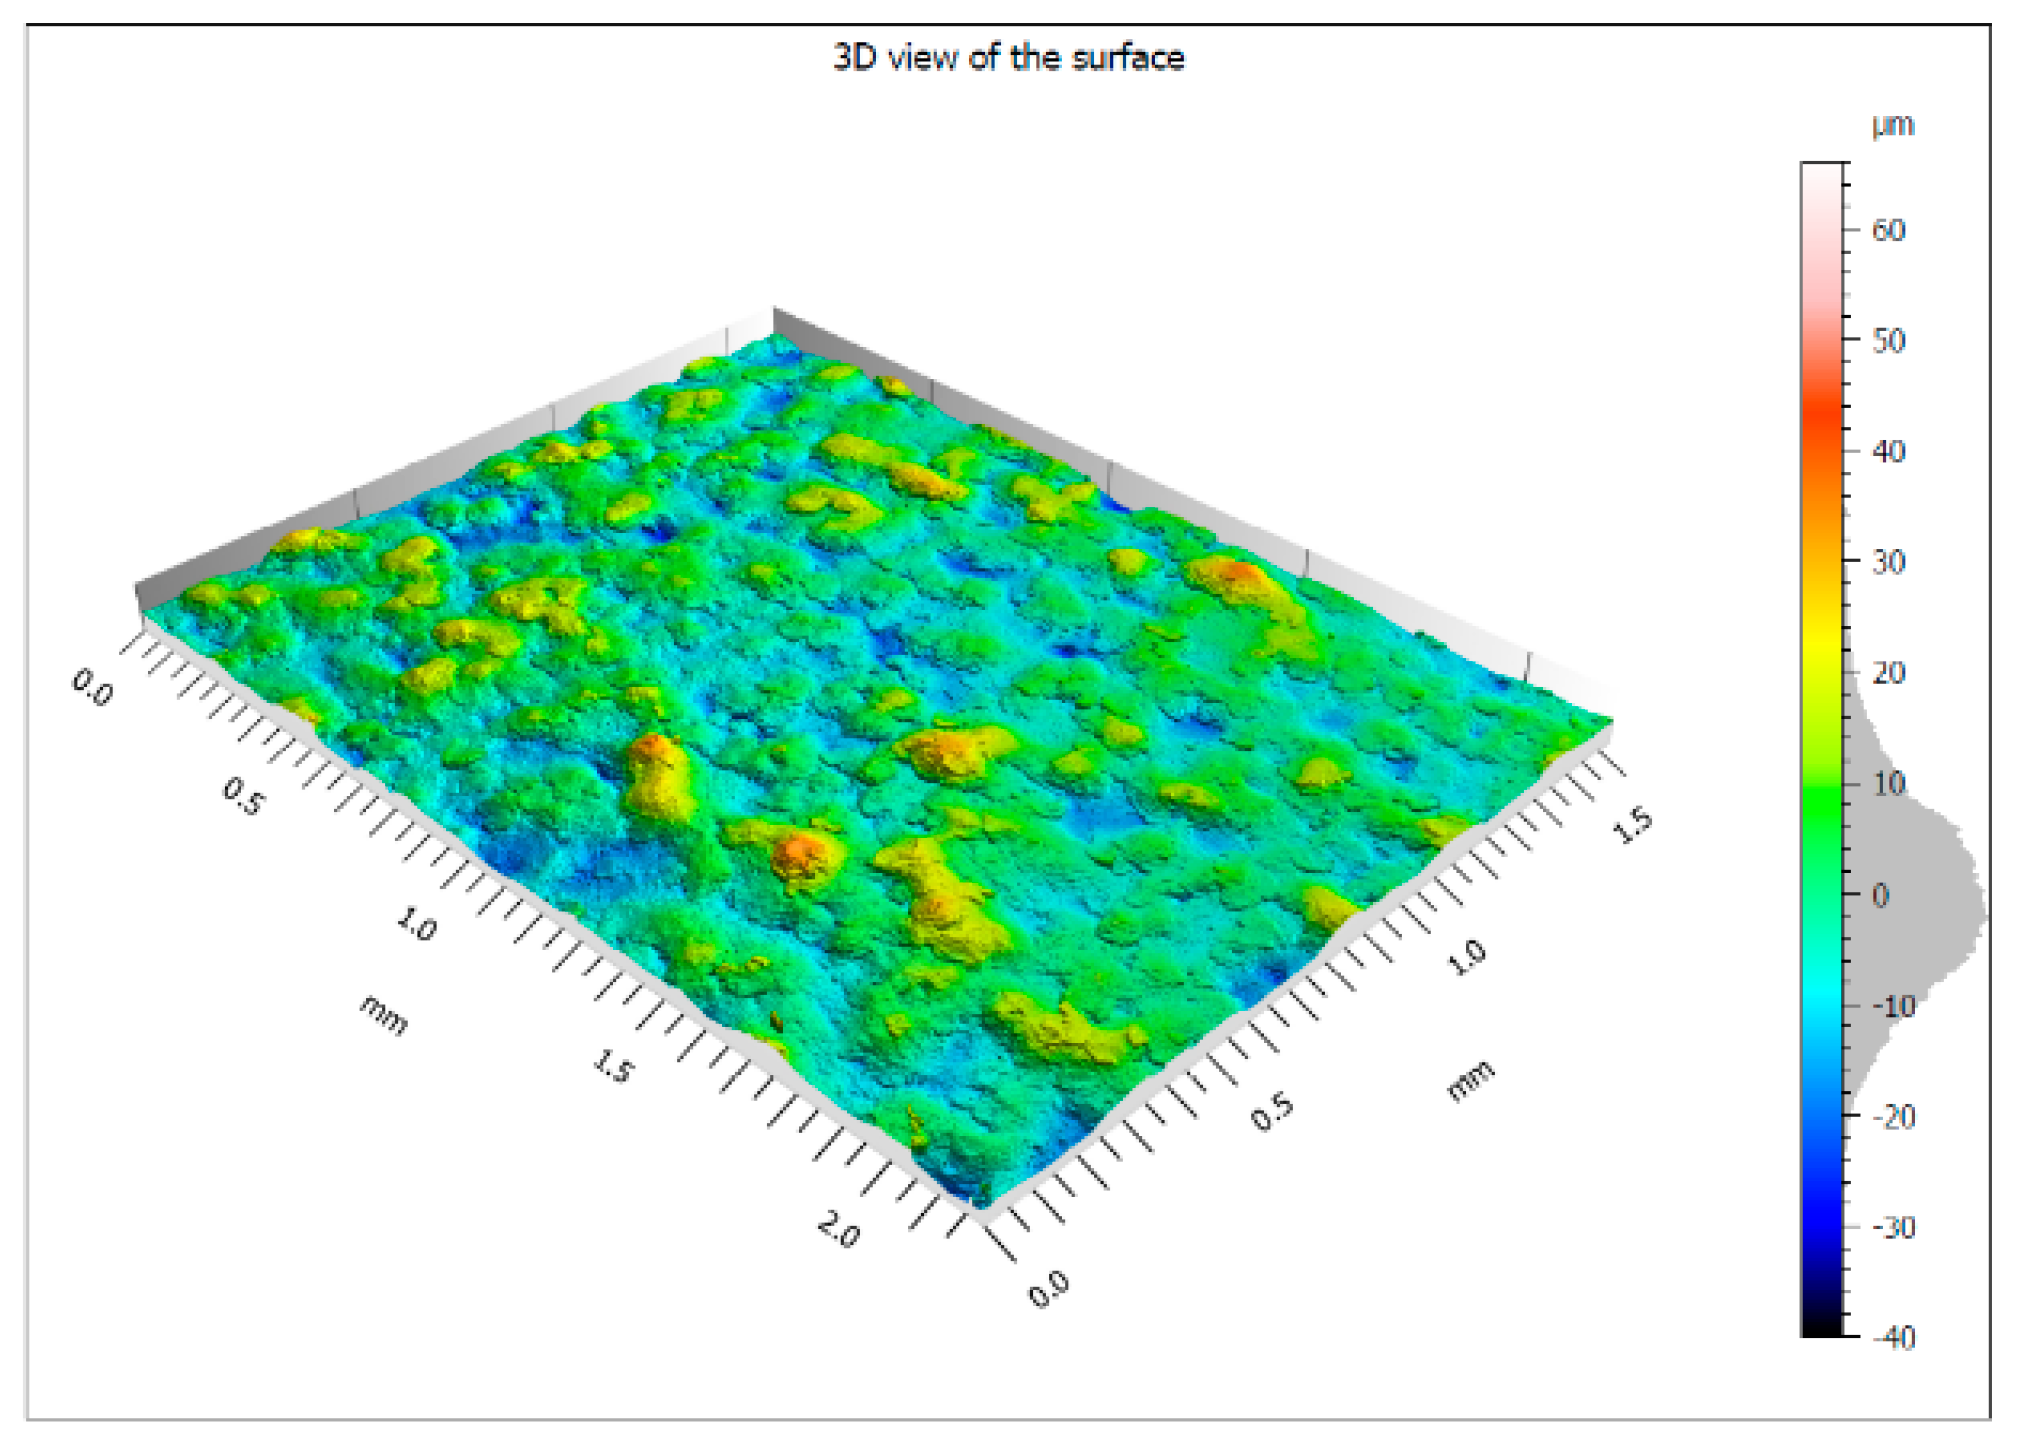
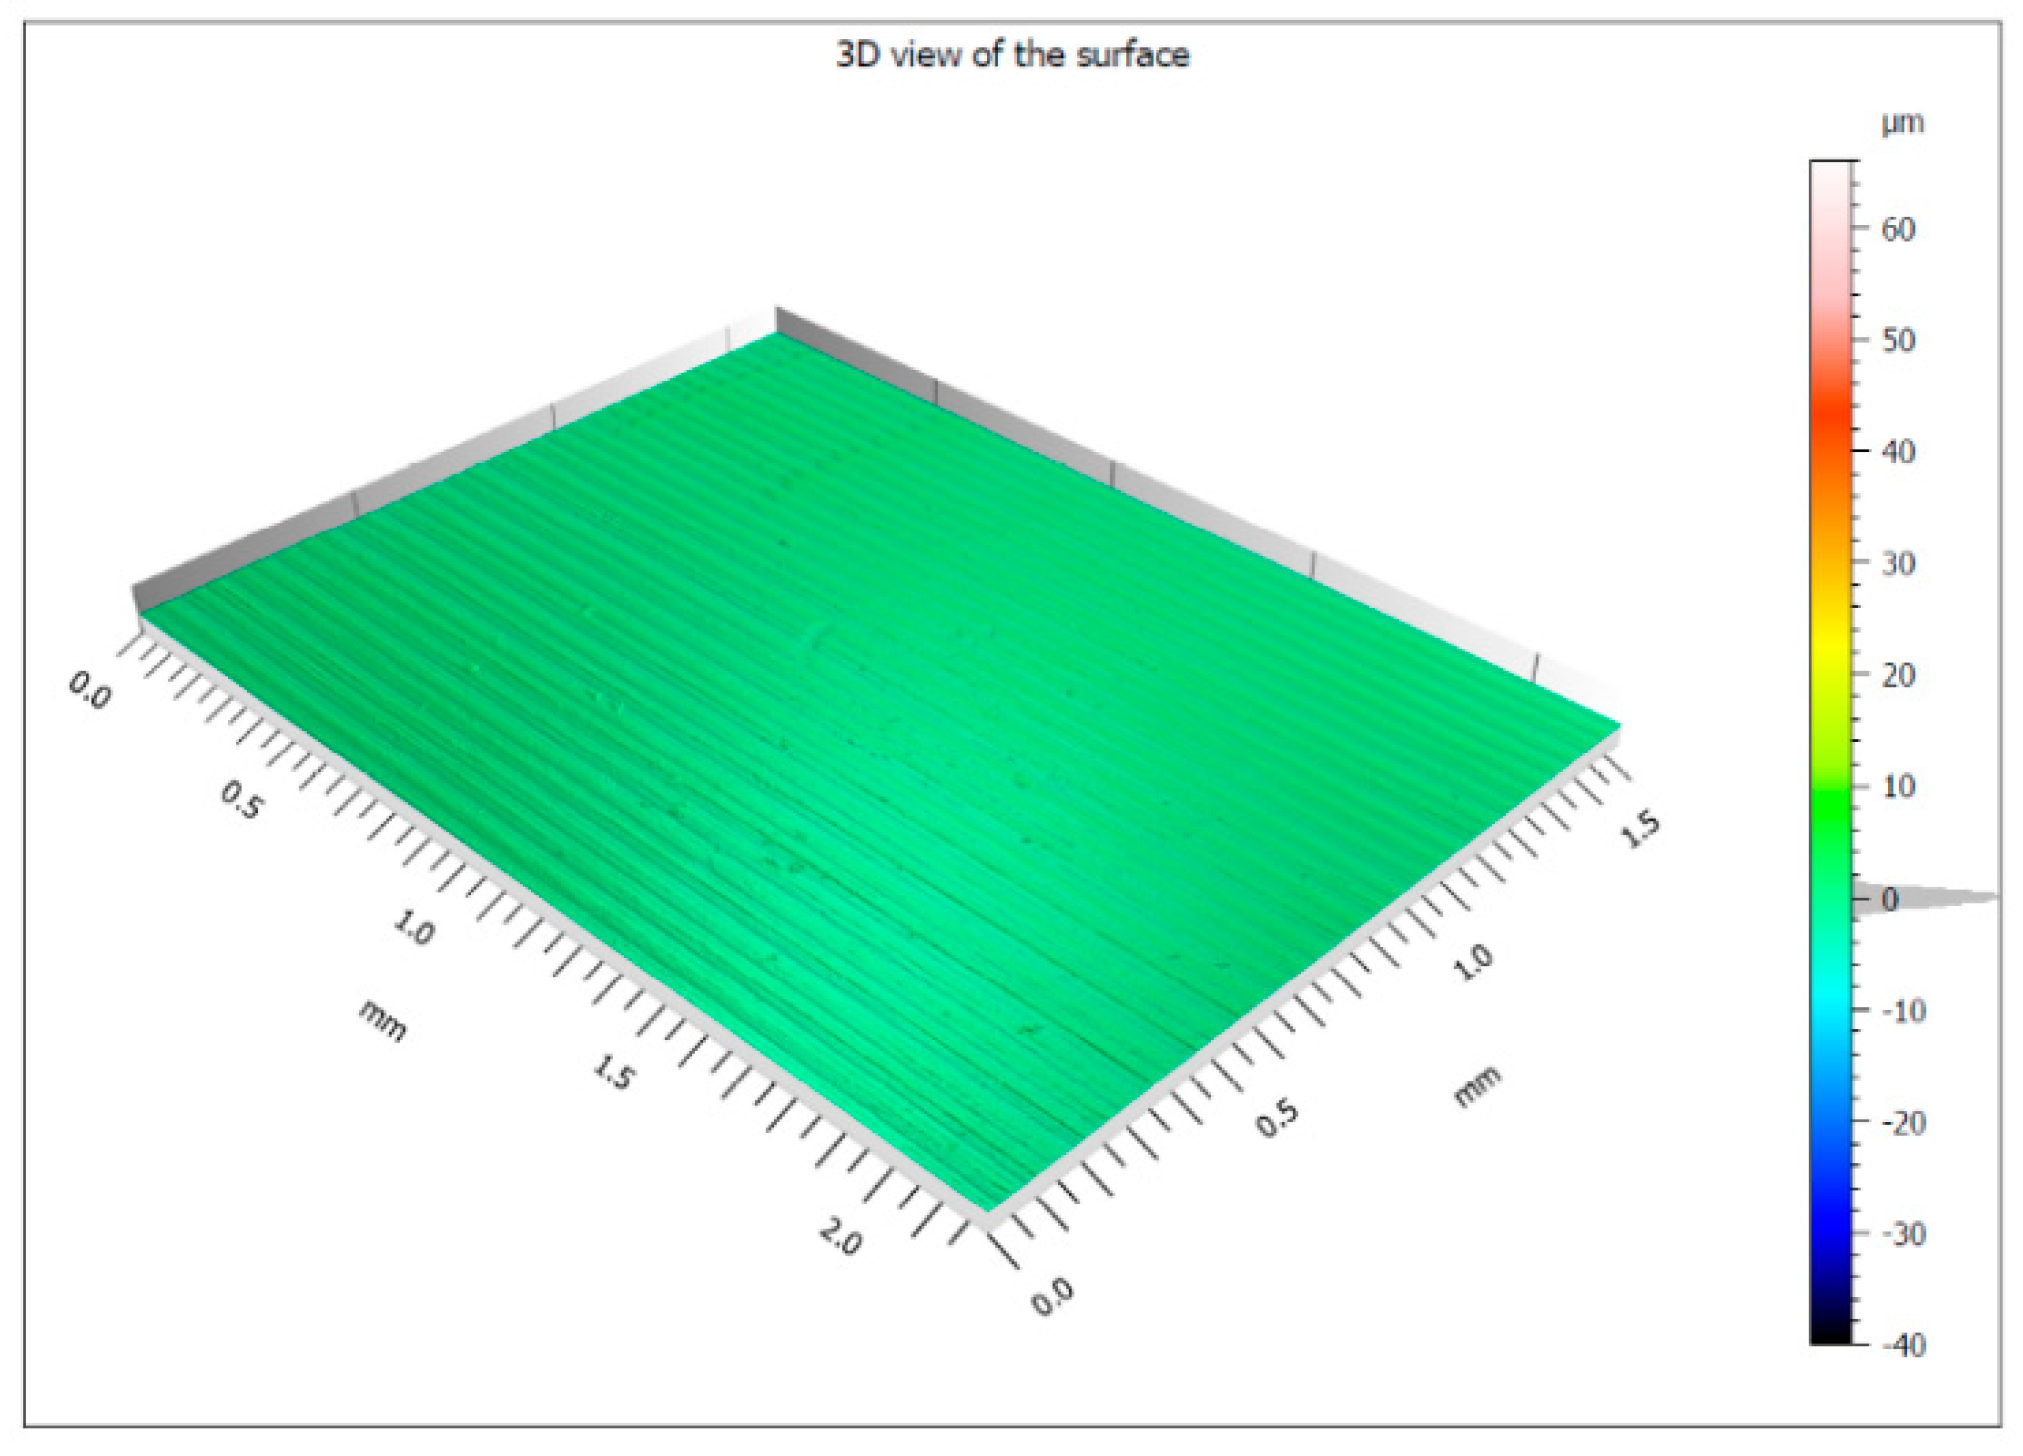
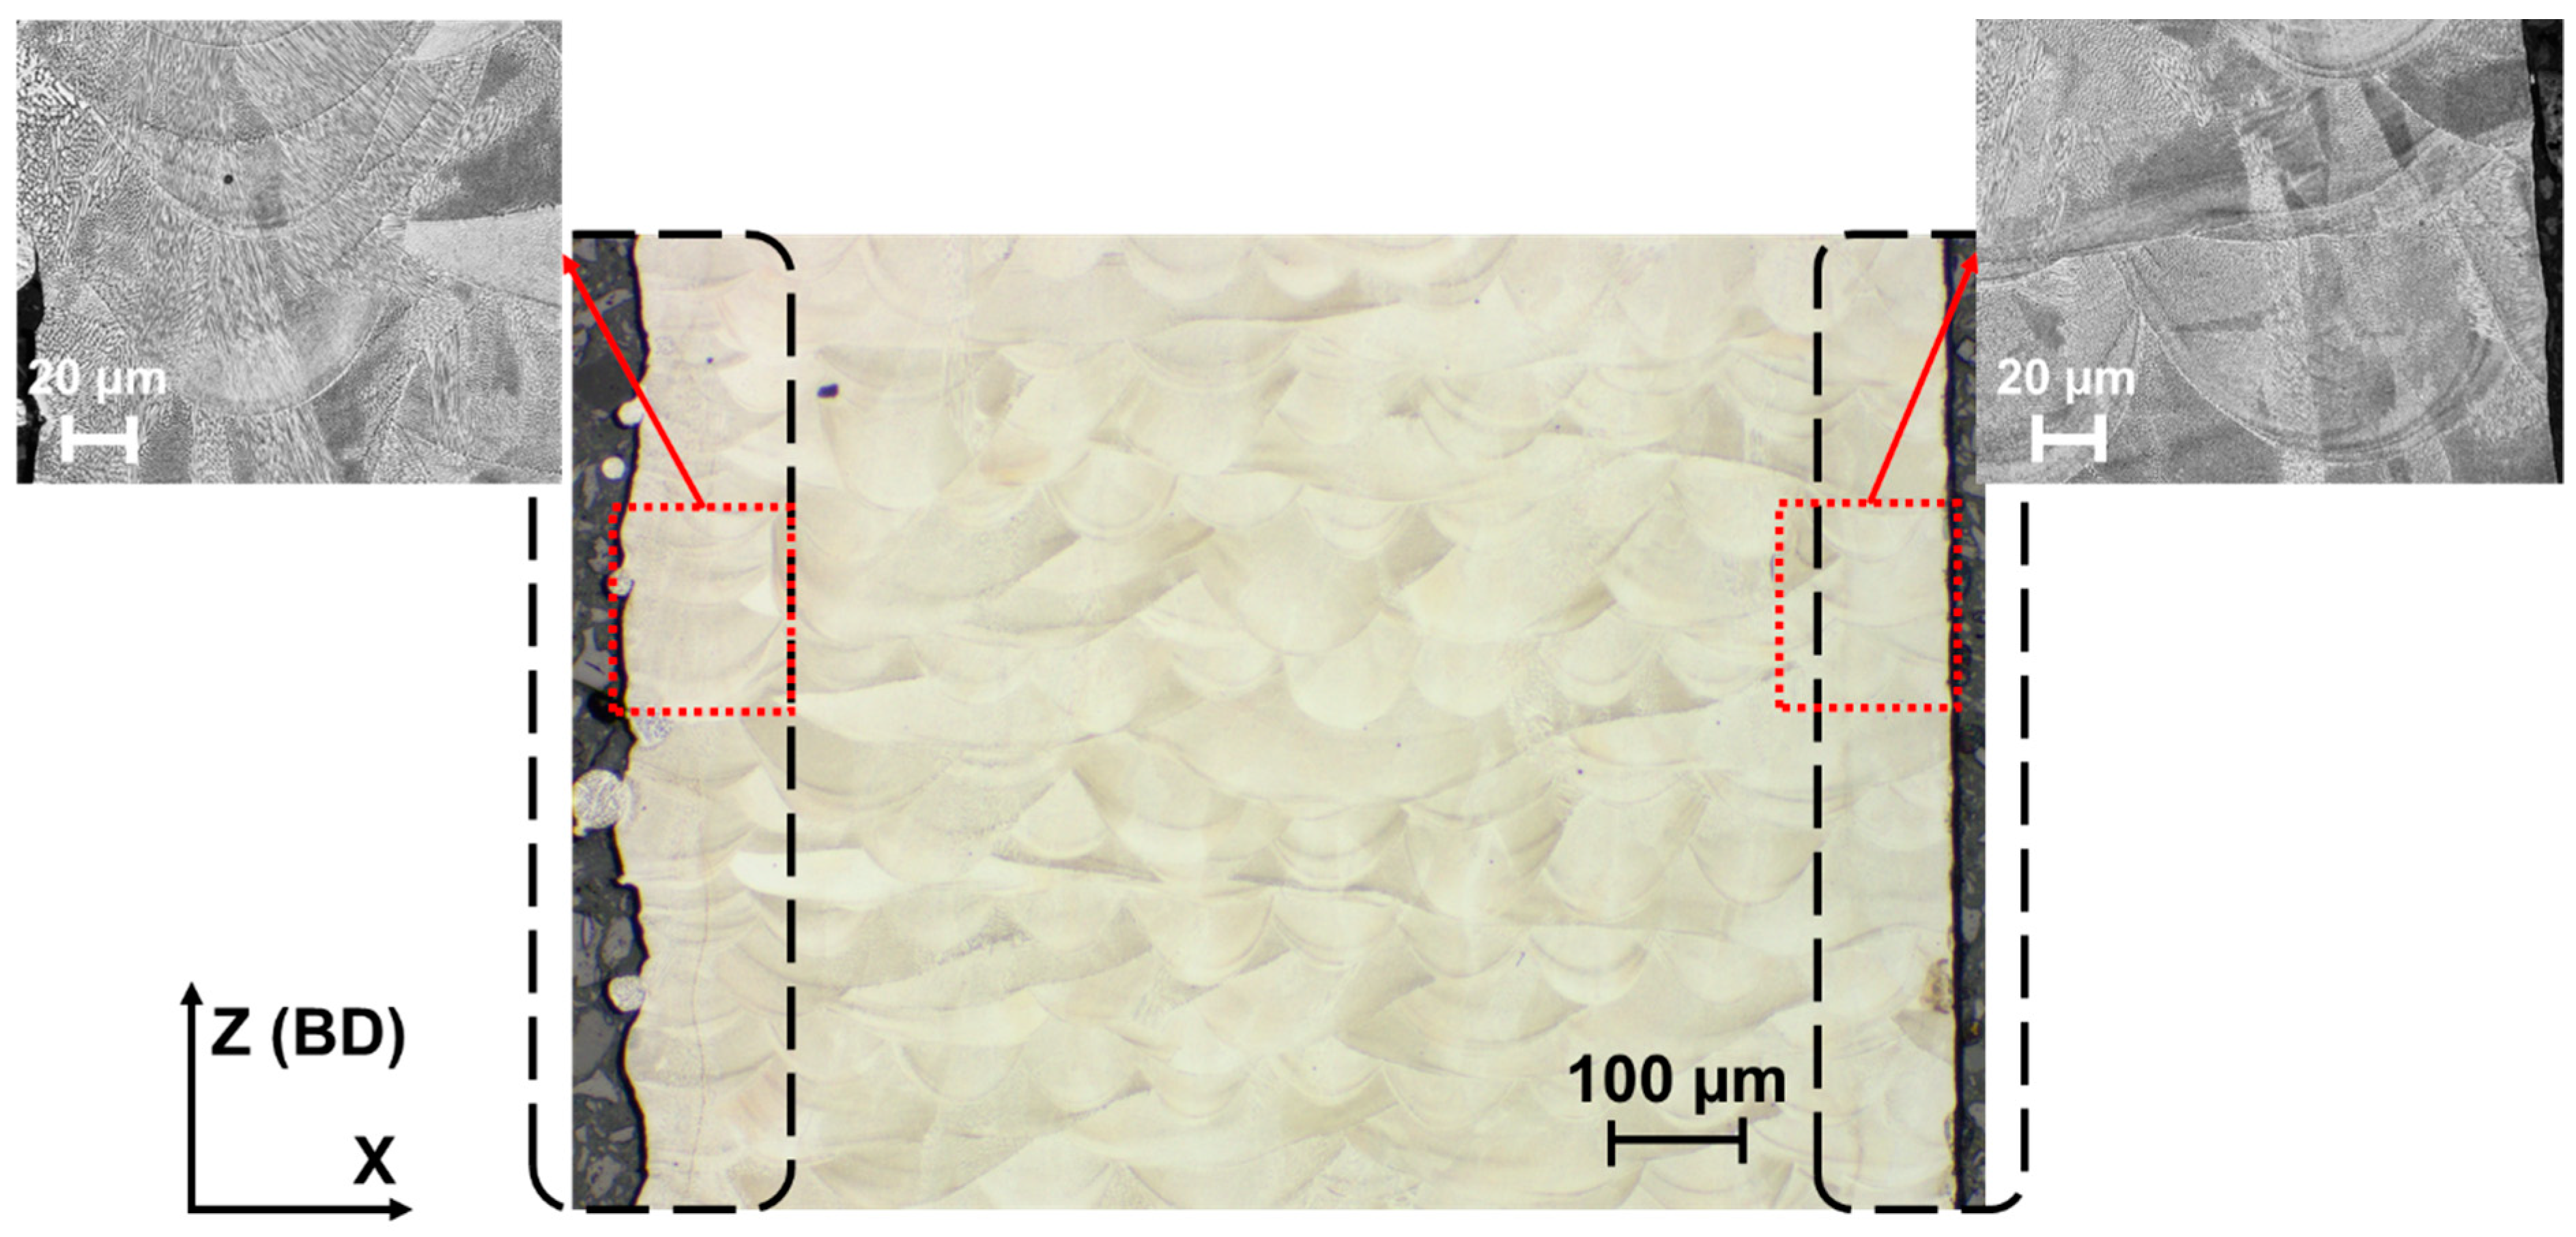
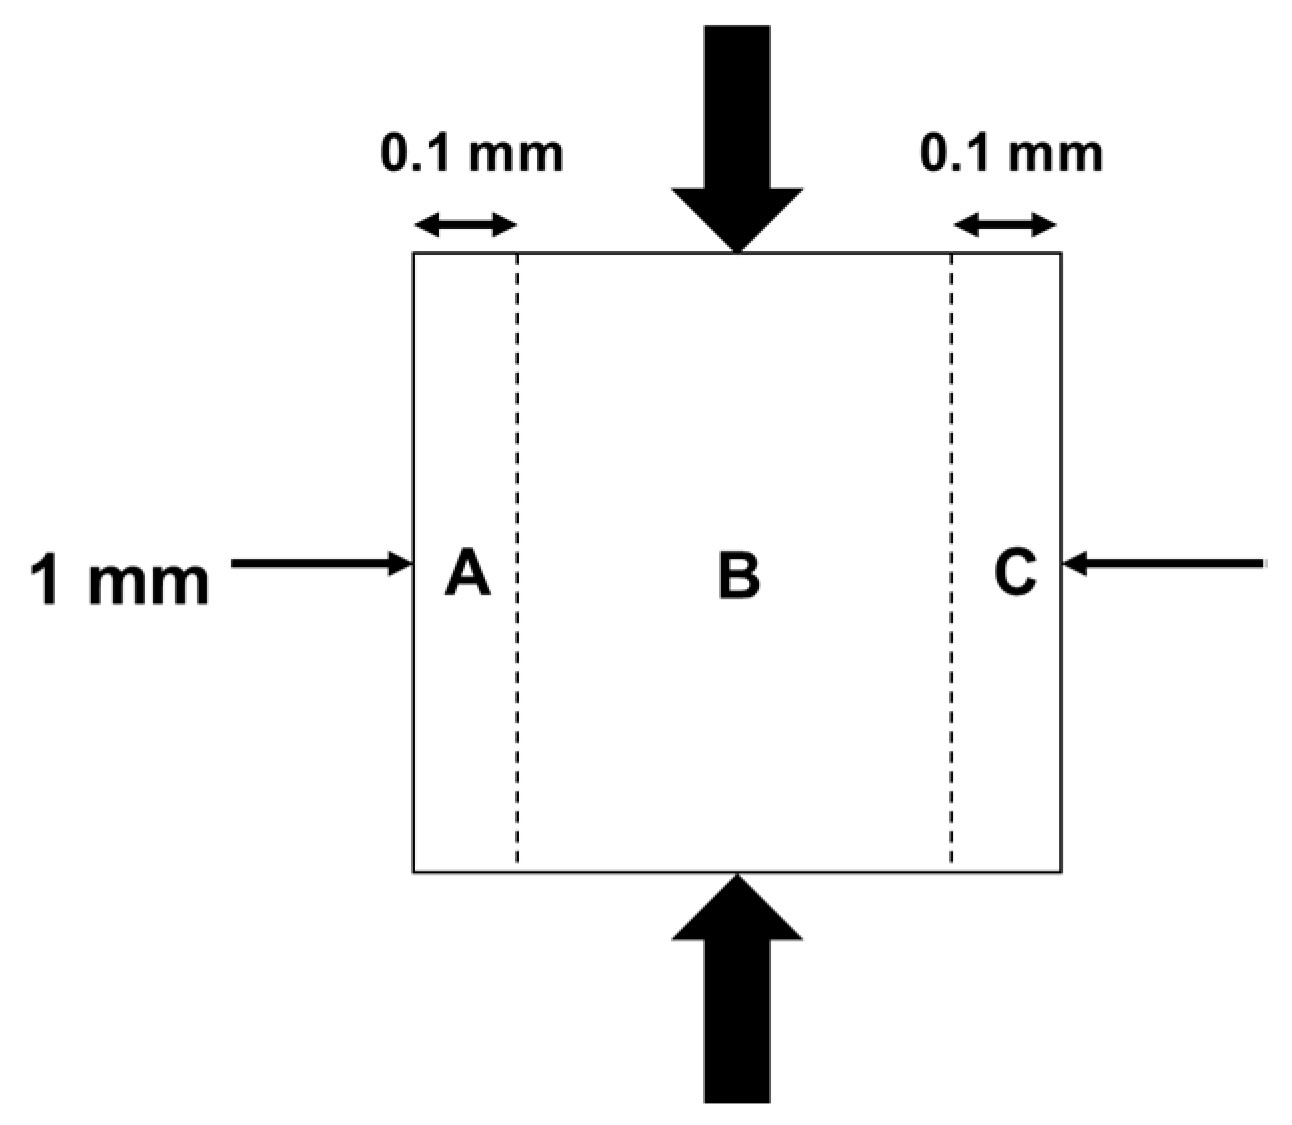
Figure 13 shows a simple cross-section sketch of surface regions (A, C) and the bulk region (B). This division is made on an approximate basis as the average width of a melt pool is about 100–150 µm. This means that there are about 8–10 melt pools in a cross-section thickness of 1 mm (which was confirmed analytically in
Figure 8). The surface treatments such as sandblasting and turning have different effects. Sandblasting would add residual stress to the surface grains, which may then become slightly hardened, whereas turning will get rid of the surface grains completely (seen in
Figure 8 and
Figure 9) as the material removal was 3 mm to reach the same final dimensions as the as-printed sample compared with. The regions A, C are supposed to be the softened surface regions, depleted in dislocation density, thus having weaker load-bearing capacities as compared to region B. Now, it can be assumed that LB-PBF-fabricated 316L in terms of bulk properties can be viewed as a heavily deformed version of conventionally manufactured 316L owing to increased dislocation density. When a part such as this is loaded in compression, the plausible softer surface microstructure (regions A and C) constitutes a weaker load-bearing surface part, while the interior of the specimens, i.e., about 0.7–0.8 mm of actual microstructure, which is dislocation-hardened, displays the strongest load-bearing part. Hence, this kind of composite structure leads to a reduction in average peak strength (or load bearing properties) as compared to expected bulk values. This has been observed elsewhere [
14], where the tensile yield strength also started to drop when specimens were reduced in section thickness, and a similar phenomenon could be the reason. When adding surface treatments to this loading condition, sandblasting supposedly creates a work-hardened surface, which should improve the properties of the surface [
29,
30], but the overall effect on compressive peak strength is limited as the blasting effect is normally shallow. It is suggested that the dislocation hardening of the bulk is still predominant in determining the overall compressive response, as seen by the only 0.85% increase in average peak strength from Sets A→C, whereby the overall change in buckling behavior is not prominent. However, when the surface zone is removed completely via turning, only fully hardened bulk is left, whereby the whole cross-section can equally carry the load. This also means that the specimen should increase in load-bearing capacity when passing from section thickness of 0.8 mm–1 mm, considering that the plausible soft surface zone is 0.1 to 0.15 mm. To further depict potential effects of differences in dislocation, this would need further validation by means of, e.g., transmission electron microscopy (TEM) and assessment of dislocation movement via in situ heat treatment in a TEM with samples extracted from the surface and bulk of the specimen, which would represent the next stage in analysis for the research conducted. Another way forward could be to conducta nanoindentation testing, which develops hardness maps across thin cross-sections, thus providing localized hardening profiles.


