Article

Optimization of Activated Tungsten Inert Gas Welding Process Parameters Using Heat Transfer Search Algorithm: With Experimental Validation Using Case Studies

1
Department of Mechanical Engineering, School of Technology, Pandit Deendayal Energy University, Raisan, Gandhinagar 382007, India
2
School of Engineering Practice & Technology, McMaster University, Hamilton, ON L8S 4L8, Canada
3
Department of Mechanical Engineering, McMaster University, Hamilton, ON L8S 4L8, Canada
4
Department of Automated Mechanical Engineering, South Ural State University, Lenin Prosp. 76, 454080 Chelyabinsk, Russia
5
School of Mechanical and Design Engineering, University of Portsmouth, Portsmouth PO1 3DJ, UK
6
Department of Mechanical Engineering, I.K. Gujral Punjab Technical University, Main Campus-Kapurthala, Punjab 144603, India
*
Author to whom correspondence should be addressed.
Metals 2021, 11(6), 981; https://doi.org/10.3390/met11060981
Submission received: 1 June 2021 / Revised: 13 June 2021 / Accepted: 17 June 2021 / Published: 19 June 2021
(This article belongs to the Special Issue High-Productivity Welding of Metals and Alloys)

Abstract

:
The Activated Tungsten Inert Gas welding (A-TIG) technique is characterized by its capability to impart enhanced penetration in single pass welding. Weld bead shape achieved by A-TIG welding has a major part in deciding the final quality of the weld. Various machining variables influence the weld bead shape and hence an optimum combination of machining variables is of utmost importance. The current study has reported the optimization of machining variables of A-TIG welding technique by integrating Response Surface Methodology (RSM) with an innovative Heat Transfer Search (HTS) optimization algorithm, particularly for attaining full penetration in 6 mm thick carbon steels. Welding current, length of the arc and torch travel speed were selected as input process parameters, whereas penetration depth, depth-to-width ratio, heat input and width of the heat-affected zone were considered as output variables for the investigations. Using the experimental data, statistical models were generated for the response characteristics. Four different case studies, simulating the real-time fabrication problem, were considered and the optimization was carried out using HTS. Validation tests were also carried out for these case studies and 3D surface plots were generated to confirm the effectiveness of the HTS algorithm. It was found that the HTS algorithm effectively optimized the process parameters and negligible errors were observed when predicted and experimental values compared. HTS algorithm is a parameter-less optimization technique and hence it is easy to implement with higher effectiveness.

1. Introduction

The TIG welding process is always a widely sought process wherever exceptional quality requirements are intended such as pressure parts for oil refining vessels [1]. This is because of its fluxless operation and shielding through inert gases. The TIG welding process is also successfully applied for dissimilar welded joints without welding imperfections [2]. TIG welding was observed to be a very useful technique for stainless steels, high-carbon steels, nickel-based superalloys, etc. [3,4,5,
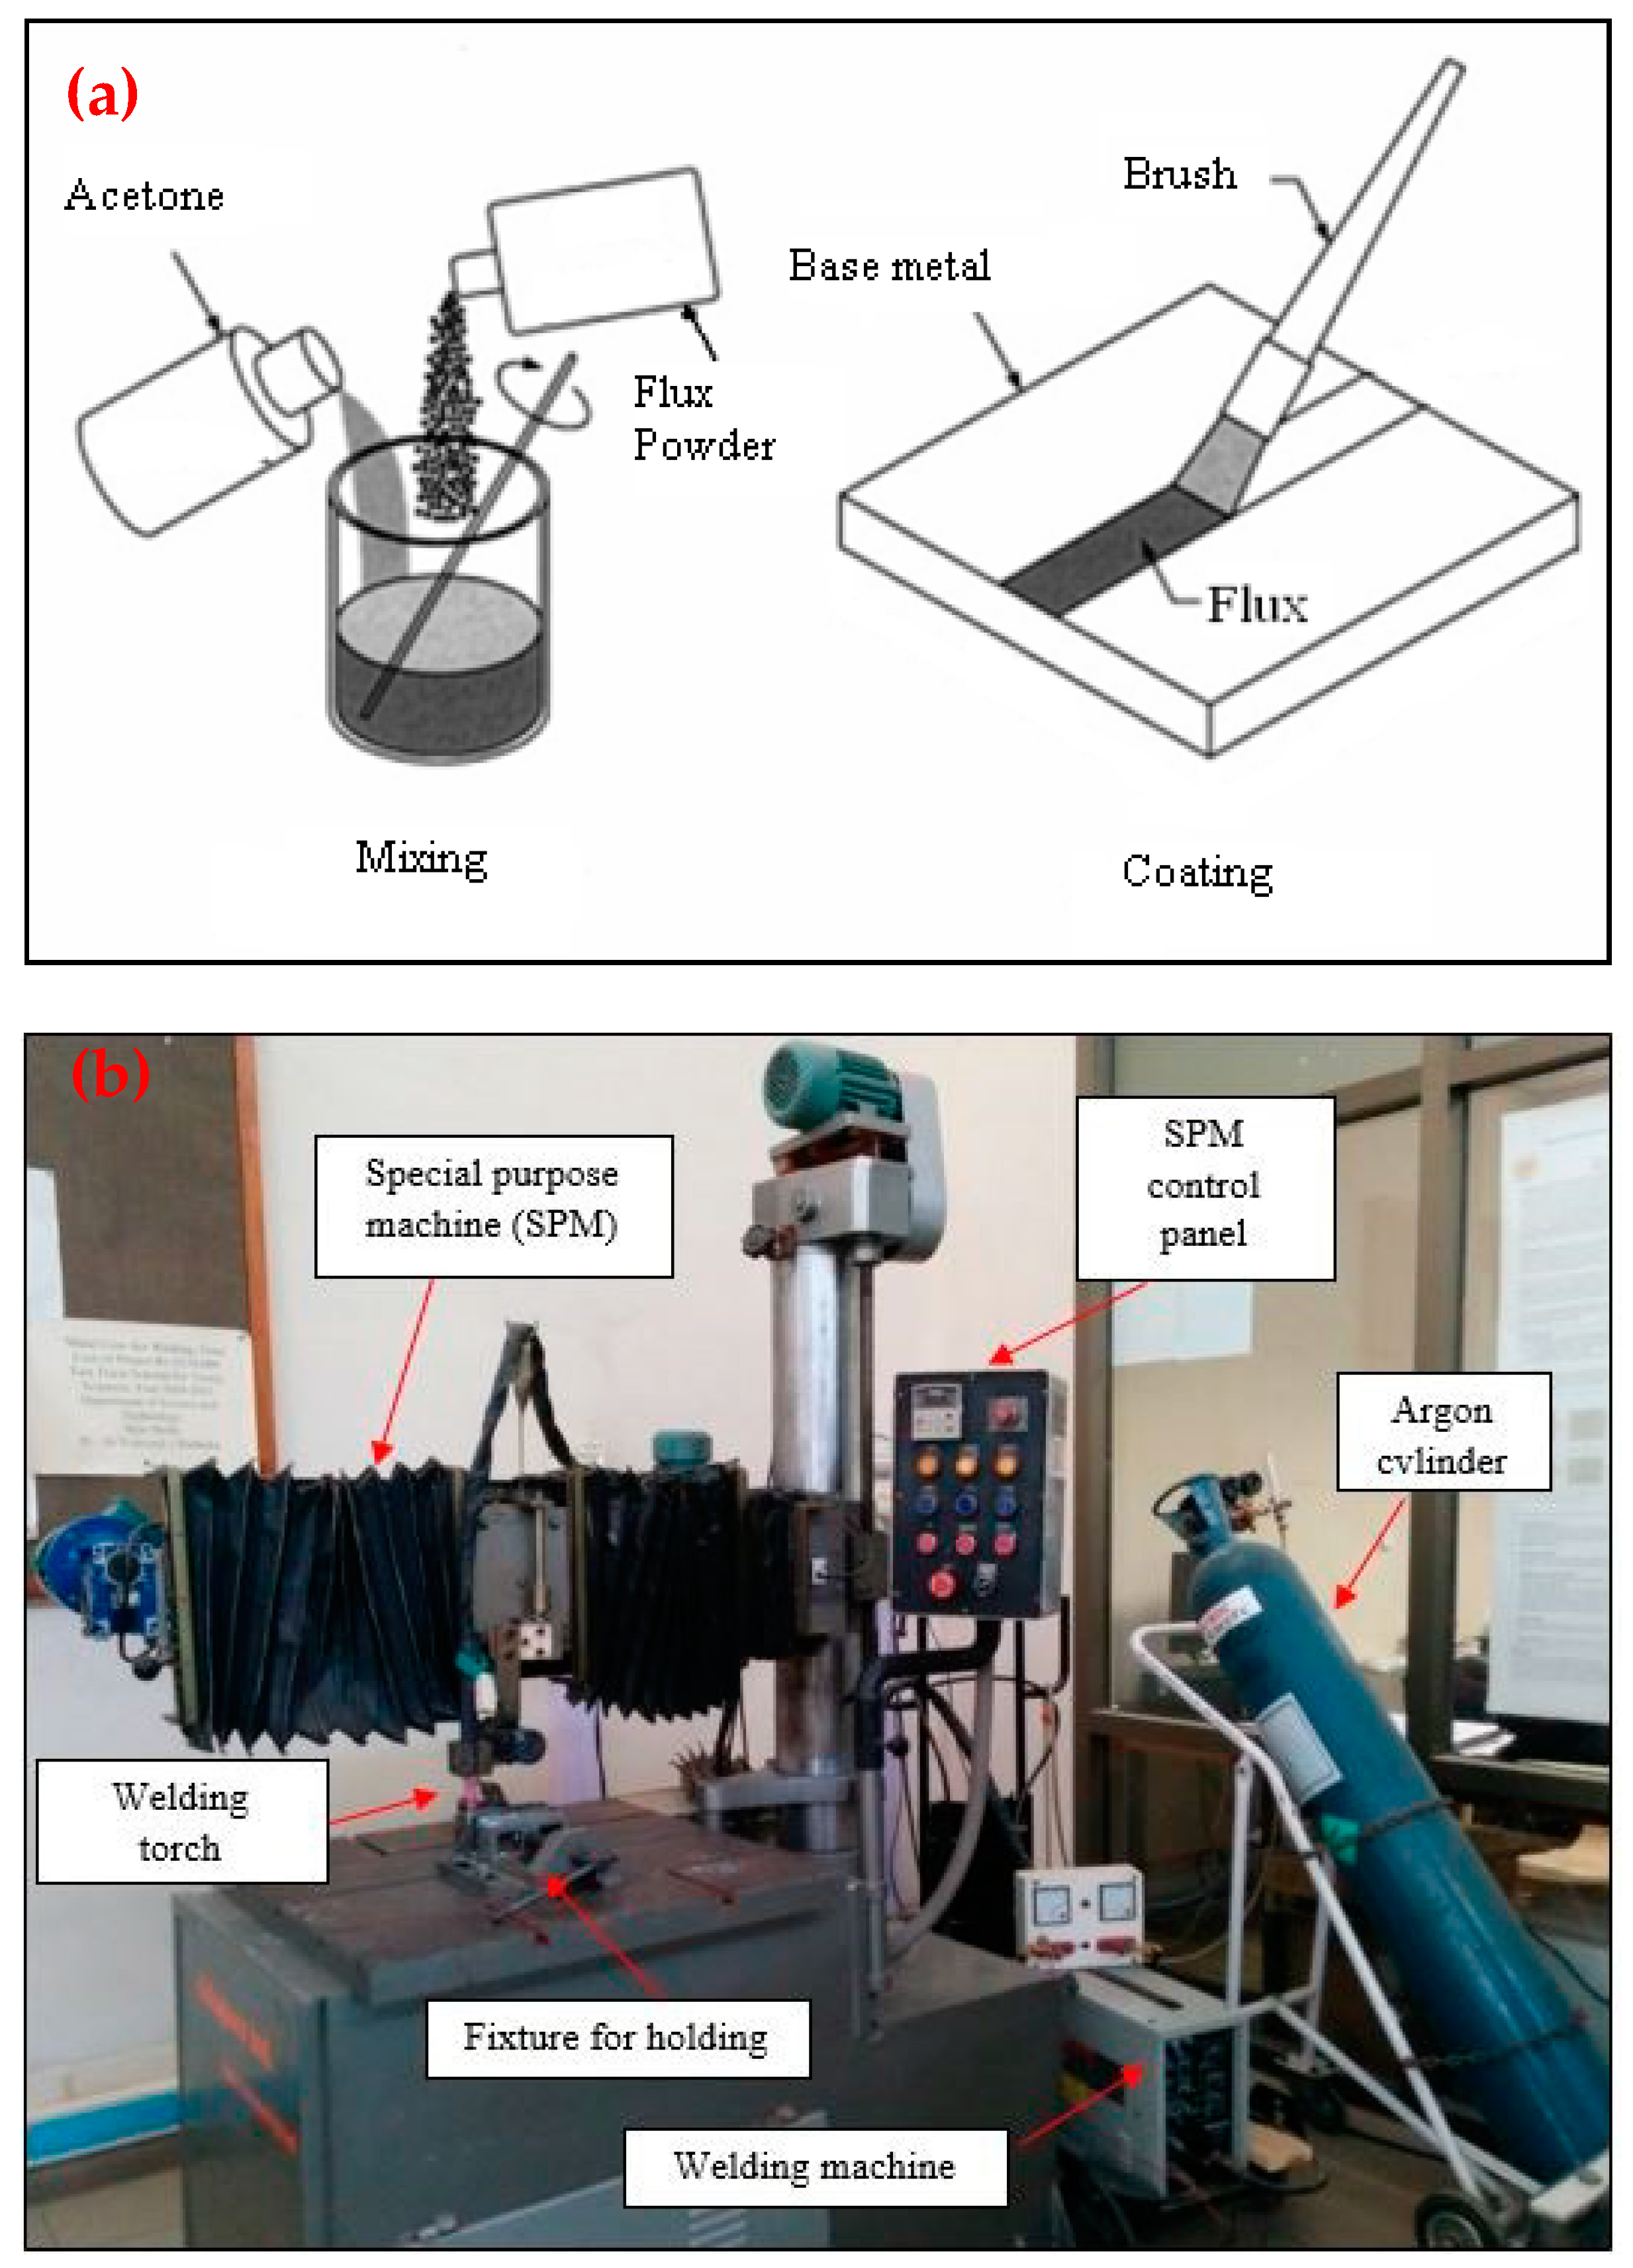
6]. However, limited productivity of the process, particularly for single pass operations, are always a problem. Maximum penetration of 3–3.5 mm is achieved by singles pass operation of TIG welding in autogenous mode. On the other hand, enhanced penetration capability of activated TIG (A-TIG) welding process in comparison to conventional TIG welding process is gaining a lot of popularity, particularly for the single-pass autogenous mode of operation [7,8,9,10,11]. The technique was developed at Paton Electric Institute in Ukraine in 1960 and since then a variety of research has surfaced about the development of the technology [12,13]. The technique involves application of a chemical compound (known as flux) on the upper surface of a plate. The flux powder is converted to a paste by adding alcoholic reagents and a skinny layer of this flux paste is smeared on the surface by using a paintbrush. On carrying out autogenous TIG welding, the flux particles quickly reach the melting arc temperatures, inducing various intensifying physical phenomena such as Reversed Marangoni, Arc constriction, etc. [14]. As a consequence, a large amount of increment in the depth of penetration has been reported with the use of this technology. However, the success of the technology depends on the selection of the flux formulation, corresponding to the chemical composition of the base metal and suitable welding parameters. Pursuant to this, a variety of studies were reported for utilization of A-TIG welding process on low alloy steels [15,16,17], stainless steel [10,18,19,20], advanced alloy steels [21,22,23] and even non-ferrous metals [24] using different fluxes and welding process parameters. The final weld quality for the required application is of great importance for the fabrication of the components. The shape attributes of the weld bead, i.e., Depth of Penetration (DOP), Bead Width (BW), Width of Heat-Affected Zone (HAZ), and Depth-to-Width ratio (D/w) are the primary considerations for attaining the required quality of the welded joint, such as toughness and tensile strength. These welded joint features are reliant on the input parameters. Thus, the primary step for process development is the optimum setting of the process parameters and a tool for predicting the required final weld shape [25]. Several approaches for the prediction and optimization of welding procedure parameters such as the RSM technique, Taguchi method and Artificial Neural Network (ANN), etc., have been described in open literature with a fairly high success rate [26,27,28].
Furthermore, these techniques are often combined with advanced evolutionary optimization algorithms for the optimization of process parameters. The need for using an advanced evolutionary algorithm is because the welding processes are very complex and have multifaceted interactions between input and output parameters. Put differently, the welding processes are a multi-input process requiring advanced optimization techniques for designing optimal welding processes. In addition to this, engineering applications require simultaneous optimum values of more than one quality response. If those quality responses are optimized individually, there might be a different set of input parameters for each of these output responses which requires a large set of experiments. Additionally, sometimes the dependencies of the output and input parameters might also be conflicting with each other, making the optimization problem even more complex to solve [29]. This technique of optimizing more than one quality response simultaneously is also termed as a multi-objective optimization technique. Various methodologies were established to solve multi-objective optimization problems, out of which the weighted additive utility function (WAUF) technique is used extensively for welding problems. In this technique, appropriate weights are assigned to all the output responses and are combined in a single objective function which is further analyzed to get optimized results. Several attempts have been reported for the multi-objective optimization of welding parameters with different optimization algorithms, among which Genetic Algorithm (GA) is the most preferred [30,31,32]. However, one caution in the approach is the fact that the GA technique functions under a precise set of allocated values of algorithm-specific parameters. The selection of allocated values will dictate the effectiveness of the results achieved which may differ from user to user. Thus, parameter-less novel optimization algorithms have been developed recently which are equally effective and easier to implement [33].
Heat Transfer Search (HTS) developed by the authors Patel and Savsani [34] is one such technique which uses three distinct phases (conduction, convection and radiation) to arrive at a global optimum value. Since its inception, HTS has been used extensively for solving optimization problems for different applications. Degertekin et al. [35] applied the HTS technique for the sizing optimization, particularly for truss structures. Three design examples were discussed in the study which demonstrated that HTS formulated better designs than those found by other state-of-the-art metaheuristic optimization methods. The convergence capability of HTS was also comparable with the other methods. The authors also presented the robustness of the HTS algorithm in the studies. Raja et al. [36] implemented the HTS technique to obtain the optimal design of the fin-and-tube heat exchanger. Seven different case studies were used to study the ability of the HTS technique for the fin-and-tube heat exchanger by comparing it with GA, Particle Swarm Optimization (PSO) and Ant Bee Colony (ABC) algorithms. It was reported that there was a 16.25% reduction in total weight and a 9.02% reduction in total annual cost for the heat exchanger with the implementation of the HTS algorithm. Tejani et al. [37] successfully applied the HTS algorithm for optimization in structural problems including the size, shape and topology of the trusses. Similarly, Patel et al. [38] used the HTS algorithm for optimization of the parameters of a turbojet engine by considering the variables such as fuel consumption, efficiency, and thrust. Thus, it can be observed that HTS is suited for and has been effectively applied to study a variety of optimization problems. However, to the best of the authors’ knowledge, no study has been reported on the application of HTS for the optimization of A-TIG welding process parameters.
This study addresses the optimization of the A-TIG welding process parameters for 6 mm thick carbon steel metal using TiO2 flux, namely, DOP, HAZ, D/w ratio (also termed as Aspect ratio) and Heat Input (HI). In optimizing these parameters, Length of the arc (L), Welding current (I), and Travel speed (T) are selected as input parameters. Box–Behnken design (BBD) approach of RSM is used for the generation of mathematical models and the HTS algorithm is used for optimization. The unique feature of the study is that four different case studies involving single- and multi-objective optimization problems have been formulated and analyzed using HTS. These case studies will be very useful to the relevant industries for direct application.

2. Materials and Methods

The present work is pivoted to optimize machining variables of the A-TIG process for application on carbon steels. In the current study, 6 mm thick carbon steel was selected as the base material. Table 1 shows the chemical composition of SA 516 Gr. 70 steel material. Autogenous TIG welding (Panasonic, New Delhi, India) was used to perform bead-on-plate trials after applying TiO2 as an activating flux.

2.1. Selection of Process Parameter

In a welding process, the input parameters have a significant effect on the weld bead geometry and ultimately the entire quality of the welded joint. The autogenous TIG welding process parameters selected for obtaining the optimal values of DOP, HAZ, D/w ratio and HI were length of the arc (L), welding current (I) and torch travel speed (T). All other welding parameters were kept constant with values specified in Table 2. The working ranges for all selected parameters were fixed by conducting pilot experimental runs. This was carried out by varying one parameter at a time while keeping the other two constant. The working range was decided by inspecting the welded surface for visual surface defects and erratic underfill. The upper and lower limits of the selected parameters are specified in Table 3.

2.2. Design Matrix as per the Response Surface Methodology

RSM is a widely used modelling technique which is used to develop a mathematical relationship between the machining variables and output responses [40,41]. RSM consists of both modelling and statistic approaches. These are helpful for the investigations and to conduct a study of objectives which is influenced by multiple variables [15,42]. In this work, RSM was used to create the relationship between the machining variables of the welding process and the selected output response parameters. In general, the aim will be to find the corresponding values of machining variables for which the selected output response variables will achieve their optimum. The RSM technique also produces the required inputs for design and process optimization and gives multiple responses [43]. The present problem was a three-level three-factor problem. To reduce the number of experiments and to improve the reliability of test results, experiments were scheduled based on the RSM technique. Box–Behnken design (BBD) approach at three-level was selected for the given problem. The set of experiments, as per BBD, to be performed were computed using design expert software, as shown in Table 4.

2.3. Experimentation as per Design Matrix

The experiments were carried out according to the computed design matrix, as shown in Table 4. A total of 17 bead-on-plate trials were conducted with appropriate care to exclude the effect of the fit-up quality (gap, edge and displacement) on the welding process. The plate thickness of 6 mm was cut into strip forms (100 mm × 15 mm), which were ground on a surface grinder to remove surface impurities, and then cleaned with acetone just before welding. Figure 1a shows the preparation and application of activating flux. Before welding, titanium dioxide (TiO2) flux was applied at the center of the strip. Subsequently, the flux in its actual powdered form could not be applied evenly on the surface. Hence, acetone was mixed with the powder to convert it into a paste which can be applied effectively, as shown in Figure 1a. As acetone tends to vaporize rapidly, a fine and evenly distributed layer of oxide flux remains on the surface. Flux thickness was taken to be uniform for all trials at approximately 0.15 mm and width was 10 mm at the center, as seen in Figure 1a. This was ensured by computing the density and volume of flux to be applied. For the existing setup, a GTAW power source of 200A with a 25% duty cycle along with a customized special-purpose machine for automatic torch movement was used to conduct the experiments. Figure 1b shows the A-TIG welding setup with Panasonic. During the welding trials, the welding arc was moved along the center of the plate while controlling all the parameters, whereas arc voltage was measured and analyzed.

2.4. Evaluation of Bead-on-Plate Samples

After welding, the samples for macrostructure observation were extracted from the center of the welded plate and were subjected to mechanical grinding, polishing (240, 400, 600, 800, 1000 grits one after other), followed by etching with 2% nital solution. Macroscopy studies were carried out using a traveling Vernier microscope (Make: RADICAL Instruments, Ambala, India) and different weld bead dimensions (DOP, BW and HAZ width) were measured as shown in Figure 2. Additionally, arc voltage was measured for each trial and HI was calculated. HI value was calculated as per Equation (1). Apart from giving the enhanced DOP, one of the important functions of activating flux is also to enhance the depth-to-width ratio (D/w) wherein the narrower bead is obtained at the expense of deeper penetration. Thus, the D/w ratio is also selected as one of the quality parameters to optimize in addition to DOP, HAZ width and HI. The observed values of output parameters are summarized in Table 5.
H I = Voltage   × Current   × 60 Travel   Speed   × 1000

2.5. Optimization Using HTS Algorithm

In the current study, the HTS algorithm was used for optimization. The HTS algorithm, which was developed by Patel and Savsani [34], functions on the philosophy of heat transfer happening due to the system molecules interacting with the surroundings for reaching thermal equilibrium. The HTS algorithm incorporates three phases, namely, conduction, convection and radiation, to reach an equilibrium state. In this approach, an equal chance is considered for all these three modes of heat transfer and any one of these three modes of heat transfer phases is selected randomly for each generation. The HTS algorithm is modified with a casually spawned population, where the system has ‘n’ number of molecules (i.e., population size) and the temperature level (i.e., design variables). In the following stage, the population is restructured in every generation by any one of these casually selected heat transfer modules. Additionally, the updated solution in the HTS algorithm is established if it is found to have an improved functional value. In the subsequent iteration, the poorest results of the population are substituted by the best solutions.

2.5.1. Conduction Phase

The solutions are well-run in the conduction phase as per the below equations:
X j , i = { X k , i + ( R 2 X k , i ) ,   i f   f ( X j ) > f ( X k ) X j , i + ( R 2 X j , i ) ,   i f   f ( X j ) < f ( X k ) ; i f   g g m a x C D F
X j , i = { X k , i + ( r i X k , i ) ,   i f   f ( X j ) > f ( X k ) X j , i + ( r i X j , i ) ,   i f   f ( X j ) < f ( X k ) ; i f   g > g m a x C D F
where X j , i is the updated solution; j = 1, 2, …, n; k is a casually selected solution; jk; k   (1, 2, …, n); i is a randomly selected variable of design; i (1, 2, …, m); gmax is the specified maximum number of generation; CDF is the factor of conduction; R is the variable of probability; R [0, 0.3333]; ri [0, 1] is a homogeneously disseminated random number and f is the optimization function.

2.5.2. Convection Phase

The solutions are efficient in the convection phase as per the equations given below.
X j , i = X j , i + R × ( X τ s X m s × T C F )  
T C F = { a b s ( R r i ) ,   i f   g g m a x C O F r o u n d ( 1 + r i ) ,   i f   g > g m a x C O F  
where X j , i is the updated solution; j = 1, 2, …, n; I = 1, 2, …, m. R is the variable of probability, COF is the factor of convection; R [0.6666, 1]; ri [0, 1] is a homogeneously dispersed random number; Xs is the surrounding temperature and Xms is the system mean temperature; TCF is a factor of temperature change.

2.5.3. Radiation Phase

The solutions are updated in the radiation phase as per the below equations.
X j , i = { X j , i + R × ( X k , i X j , i ) ,   i f   f ( X j ) > f ( X k )   X j , i + R × ( X j , i X k , i ) ,   i f   f ( X j ) < f ( X k )   ; i f   g g m a x R D F
X j , i = { X j , i + r i × ( X k , i X j , i ) ,   i f   f ( X j ) > f ( X k )   X j , i + r i × ( X j , i X k , i ) ,   i f   f ( X j ) < f ( X k )   ; i f   g > g m a x R D F
where X j , i is the updated solution; j = 1, 2, …, n; i = 1, 2, …, m; j ≠ k; k (1, 2, …, n), k is a casually designated molecule; RDF is the factor of radiation; R is the variable of probability; R [0.3333, 0.6666]; ri [0, 1] is a homogeneously disseminated random number.

2.6. Proposed Optimization Route

The measured values of output responses were analyzed with the BBD methodology and mathematical models were generated for individual response parameters (DOP, D/w, HAZ and HI). Further, the methodology represented in Figure 3 was followed for the optimization of the A-TIG welding process parameters. Furthermore, as shown in this figure, four different case studies were considered and analyzed. These case studies are formulated based on the different challenges which might be faced during the actual industrial operations.

3. Results and Discussions

3.1. Analyzing Weld Bead Morphology

The macrostructural analysis was carried out on the bead-on-a-plate welded trials and the morphological parameters of the weld bead were observed. A range of values of the response parameters was obtained, as included in Table 5. The maximum and minimum DOP values of 2.99 mm and 8.19 mm, respectively, were achieved. Apart from this, the beauty of the A-TIG process lies in enhancing the DOP at the expense of a reduction in bead width. Different values of this D/w ratio ranging from 0.40 to 1.65 were achieved against typical values of 0.4–0.5. A D/w ≥ 1 is highly desirable. During the A-TIG welding of carbon steels with TiO2, it can be noticed from the enhanced D/w ratios that the Reversed Marangoni effect is the dominant mechanism responsible for depth enhancement. It can also be concluded from the study that 6 mm thick carbon steel can be welded in a single pass using the TiO2 flux and corresponding welding parameter.

3.2. Mathematical Model Generation

The output response parameters in Table 5 were analyzed in the Design-Expert software to generate mathematical models. Quadratic models were developed for the response parameters. The ultimate regression model resulting in terms of procedure variables for the selected individual response factors is as follows:
D O P = 28.70578 3.66961 · x 1 + 0.78741 · x 2 0.61433 · x 3 + 1.47500 E 004 · x 1 · x 2 + 3.61375 E 003 · x 1 · x 3 1.73588 E 004 · x 2 · x 3 + 0.71178 · x 1 2 2.11632 E 003 · x 2 2 + 2.82174 E 003 · x 3 2
D / w = 14.10871 1.35415 · x 1 + 0.26035 · x 2 0.13985 · x 3 + 0.27858 · x 1 2 7.15176 E 004 · x 2 2 + 6.62591 E 004 · x 3 2
H I = 4.37672 0.76954 · x 1 + 1.05625 E 003 · x 2 0.049295 · x 3 + 4.59000 E 003 · x 1 · x 2 + 1.68677 E 004 · x 3 2
H A Z   W i d t h = 70.06150 0.21700 · x 1 + 0.86680 ·   x 2 + 0.043175 ·   x 3 + 0.034775   ·   x 1 · x 2 + 3.95000 E 003 · x 1 · x 3 + 5.22500 E 004 · x 2 · x 3 1.54525 ·   x 1 2 2.76812 E 003 · x 2 2 1.07938 E 003 ·   x 3 2
In the above equations, x1, x2 and x3 are arc length, welding current and travel speed, respectively. The mathematical representations achieved were investigated using the ANOVA technique and the results are as shown in Table 6. ANOVA analysis was conducted at a 95% confidence level. As seen in this table, the R2 value of close to 1 indicates that the models can predict the experimental data fairly accurately. The Adj. R-Squared and Pred. R-Squared values for the proposed models were found in close agreement. This shows that the models can effectively predict the output values close to the values which actually might have obtained when experimentally measured. The same can also be observed from Figure 4 which shows the closeness of predicted and the measured values of the responses. A close agreement between the experimentally obtained values and the model predicted values exists for the developed models. The Adeq. Precision values as shown in Table 6 are found to be substantially greater than 4. The Adeq. Precision measures the signal-to-noise ratio and greater than 4 values confirm the fact that these models are robust enough for navigating the entire problem design space.

3.3. Optimizing Efforts for Different Case Studies and Their Validation

3.3.1. Case I: Optimization of DOP

The prime benefit of using the A-TIG welding technique is the enhancement in the DOP similar welding parameters. For the present case, a single objective function that needs to be maximized was formulated (see Equation (12)) and optimized using the HTS algorithm.
O b j   ( v 1 ) = ( D O P )
The optimization results predicted the maximum attainable DOP as 8.2 mm and the corresponding input parameters are: arc length of 1 mm, welding current of 183, and travel speed of 80 mm/min. For these ideal settings, the responses of supplementary output variables were also forecasted, and a validation experiment was carried out at those parameters. However, as the objective was only the maximization of the DOP, other response parameters were not at their optimum values. The experimentally measured values of weld bead dimensions were recorded, as shown in Table 7. A negligible difference can be observed between the predicted and measured values. Put differently, the HTS algorithm embedded with the developed models (Equations (8)–(11)) is a good tool that is capable of forecasting and optimizing the welding parameters. This specific case will be extremely useful for industrial uses in which a substantial increase in DOP is required to join mid-thickness plates (6–8 mm) having only structural applications with negligible impact load. This is because the objective function is formulated without considering the HI and HAZ which directly affect mechanical strength.

3.3.2. Case II: Optimization of HI (for DOP ≥ 6.2 mm)

Apart from DOP, one of the major aspects of the welded joint quality is the Heat Input (HI). This is because HI governs the cooling rate, which subsequently governs the microstructure and thereby the impact strength. In general, a lower HI is always desirable since it promotes better mechanical properties, especially impact strength [44]. This case was formulated such that the objective function shall be to minimize HI when DOP is greater than or equal to 6.2 mm. The additional 0.2 mm penetration (in a 6 mm plate) was intended to ensure that full penetration is achieved. For this, the additional constraint was imposed in the HTS algorithm, and the objective function was formulated as:
O b j   ( v 2 ) f 2 = ( H I )
The optimized results are as shown in Table 8 and are predicted as arc length of 1 mm, welding current of 173A, and travel speed of 91.82 mm/min. After achieving the DOP of 6.2 mm, the smallest value of HI was predicted as 1.48 kJ/mm. The corresponding output and input parameter values are also calculated as included in Table 8. Confirmatory trials were carried out at the closest possible input values on the machine, i.e., an arc length of 1 mm, welding current of 175A, and travel speed of 90 mm/min. The error between the projected and experimentally achieved output values was calculated and was found to be negligible, which establishes the capability of the HTS algorithm to optimize welding processes. The case will be useful for welding components of 6 mm thickness in a single pass with requirements of increased impact strength. The lowest HI after adequate DOP can ensure the same.

3.3.3. Case III: Simultaneous optimization of D/w, HI, and HAZ width (for DOP ≥ 6.2 mm)

The simultaneous optimization of the input parameters is of great importance since the nature of welding problems is always complex. In this case, for the multi-objective optimization approach, the entire set of output parameters were combined in a single objective function by assigning the intended weights to each. Apart from increasing DOP, A-TIG welding also has an inherent advantage of reducing the BW and thereby increasing the D/w ratio. Additionally, HAZ is one of the major areas prone to service failures and so the lower HAZ width can increase the reliability of the welded part. Thus, an objective function, wherein after achieving a minimum 6.2 mm penetration the D/w ratio shall be maximized while HI and HAZ width shall be minimized. The entire objective function is subjected to minimization. HI and HAZ are subjected to minimization, while D/w is subjected to maximization. Thus, during course of optimization, the HTS algorithm is formulated as below.
O b j   ( v 3 ) = w 1 × ( H I ) + w 2 × ( D / w ) w 3 × ( H A Z )
The weights were taken as w 1 = 0.6 ;   w 2 = 0.3   ;   w 3 = 0.1 . The weights are always decided according to the designers’ choice and in the current case, maximum weightage is given to HI followed by HAZ and D/w. The constraint of DOP ≥ 6.2 was imposed over the optimization problem. The welding parameters corresponding to the optimum values of the objective function are welding current 182 A, arc length of 1 mm and travel speed of 93.9 mm/min. The corresponding values of the resultant output responses are presented in Table 9. Validation trials were also carried out at the closest possible set of input parameters permitted by the equipment (welding current 180 A, an arc length of 1 mm and travel speed of 95 mm/min). The resulting weld bead dimension values achieved are summarized in Table 9. As seen in the table, the error between the measured and predicted values are acceptable, clearly indicating that the HTS algorithm can be employed for the multi-objective optimization of the A-TIG welding parameters. This case is relevant to the welding problems in which a balance of DOP and mechanical properties are needed.

3.3.4. Case IV: Simultaneous optimization of DOP, D/w, HI and HAZ width

In this final case, the objective function was designed to simultaneously optimize all the response parameters. The entire objective function is subjected to minimization. In Equation (15), HI and HAZ is subjected to minimization while DOP and D/w is subjected to maximization. Thus, during course of optimization, the HTS algorithm is formulated as below.
O b j   ( v 4 ) = w 1 × (   D O P ) + w 2 × ( H I ) w 3 × ( D / w ) + w 4 × ( H A Z )
where the weights were assigned as w 1 = 0.5 ;   w 2 = 0.3   ;   w 3 = 0.1 ; w 4 = 0.1 .
To optimize the objective functions, the HTS algorithm was executed with 10,000 function evaluations. The optimized input process parameters were identified as torch travel speed—80 mm/min, length of arc—1 mm and welding current—192 A. The validation trial was carried out at arc length—1 mm, welding current—190 A, and travel speed—80 mm/min, and the measured values were recorded as shown in Table 10. Once again, the predicted and measured values were in close agreement, clearly indicating that the HTS algorithm equipped with the developed models is an excellent optimization tool for the welding processes.

3.4. Validation of HTS Algorithm via 3D Surface Plots

HTS algorithm is a newly developed algorithm and per the best of the authors’ knowledge, the study is the first attempt to optimize welding process parameters. To evaluate the effectiveness of this algorithm, 3D surface plots were generated for DOP by maintaining only one of the optimum input process parameters (arc length of 1 mm, welding current of 192 A and travel speed of 80 mm) generated by HTS at a time constant, while searching over the rest of the parameter space corresponding to the remaining parameters. DOP is selected as the quality parameter as one of the most important parameters for A-TIG welding. As shown in Figure 5a, it can be observed that maximum DOP values for arc length 1 mm would be 8.2 mm (indicated as a red area in the graph) at travel speed of 80–85 mm/min and the welding current value of around 190. Similarly, as seen in Figure 5b, at welding current of 192 A, the maximum DOP would be achieved at arc length close to 1 mm and travel speed of 80 mm/min which is indicated by a small red area at the corner. As seen in Figure 5c, for a constant travel speed of 80 mm/min, the maximum DOP would be achieved at an arc length of 1 mm and welding current close to 190 A. The value of DOP as obtained by the HTS algorithm for case 4 during the simultaneous optimization of all the output responses was predicted as 8.07 which is close to 8.2 (predicted by surface plots). The slight variation in the values is due to the weights assigned to DOP in the objective function. In studying the parameter space concerning DOP, from the contour plots, it is clear that the HTS algorithm is predicting the global optimum for DOP. Thus, it can be concluded that the HTS algorithm can be successfully employed for solving complex optimization problems in welding.

4. Summary

In this study, optimization of the A-TIG welding process was successfully carried out using a novel HTS algorithm. The A-TIG process parameters, namely, DOP, HI, D/w and HAZ, were optimized using a combination of RSM and HTS algorithms. It was concluded from the study that the mathematical models developed using the BBD approach of RSM were robust and capable of predicting the responses accurately. The models were integrated into the HTS algorithm that was applied successfully for single- and multi-objective optimization of the A-TIG welding parameters. The HTS algorithm was used in four different case studies, each having a different objective function. The optimized parameters achieved for these four case studies were validated by performing the experimental trials. The experimentally achieved values are in close agreement with the predicted optimized values (negligible error) depicted by HTS. 3D surface plots for DOP also proved the effective performance of HTS to optimize the objective function.

Author Contributions

Conceptualization, R.C., J.V., D.Y.P. and S.S. (Seshasai Srinivasan); methodology, R.C. and J.V.; software, V.K.P., D.Y.P. and S.S. (Seshasai Srinivasan); validation, J.V., S.S. (Seshasai Srinivasan) and R.C.; formal analysis, V.K.P., D.Y.P.; investigation, R.C. and J.V.; resources, D.Y.P.; data curation, J.V. and D.Y.P.; writing—original draft preparation, J.V., V.K.P., S.S. (Seshasai Srinivasan), R.C., D.Y.P., K.G. and S.S. (Shubham Sharma); writing—review and editing, J.V., V.K.P., S.S. (Seshasai Srinivasan), R.C., D.Y.P., K.G. and S.S. (Shubham Sharma); visualization, V.K.P.; supervision, R.C. and D.Y.P. All authors have read and agreed to the published version of the manuscript.

Funding

This research received no external funding.

Data Availability Statement

The data presented in this study are available in this article.

Conflicts of Interest

The authors declare no conflict of interest.

References

  1. Rezaei, A.; Ehsanifar, M.; Wood, D.A. Reducing welding repair requirements in refinery pressure vessel manufacturing: A case study applying six sigma principles. Int. J. Interact. Des. Manuf. 2019, 13, 1089–1102. [Google Scholar] [CrossRef]
  2. Rogalski, G.; Świerczyńska, A.; Landowski, M.; Fydrych, D. Mechanical and microstructural characterization of TIG welded dissimilar joints between 304L austenitic stainless steel and Incoloy 800HT nickel alloy. Metals 2020, 10, 559. [Google Scholar] [CrossRef]
  3. Jamrozik, W.; Górka, J.; Kik, T. Temperature-based prediction of joint hardness in TIG welding of inconel 600, 625 and 718 nickel superalloys. Materials 2021, 14, 442. [Google Scholar] [CrossRef] [PubMed]
  4. Arora, H.; Kumar, V.; Prakash, C.; Pimenov, D.; Singh, M.; Vasudev, H.; Singh, V. Analysis of sensitization in austenitic stainless steel-welded joint. In Advances in Metrology and Measurement of Engineering Surfaces; Springer: Singapore, 2021; pp. 13–23. [Google Scholar]
  5. Brykov, M.N.; Petryshynets, I.; Džupon, M.; Kalinin, Y.A.; Efremenko, V.G.; Makarenko, N.A.; Pimenov, D.Y.; Kováč, F. Microstructure and properties of heat affected zone in high-carbon steel after welding with fast cooling in water. Materials 2020, 13, 5059. [Google Scholar] [CrossRef]
  6. Stadler, M.; Freton, P.; Gonzalez, J.-J. Influence of welding parameters on the weld pool dimensions and shape in a TIG configuration. Appl. Sci. 2017, 7, 373. [Google Scholar] [CrossRef] [Green Version]
  7. Fujii, H.; Sato, T.; Lu, S.; Nogi, K. Development of an advanced A-TIG (AA-TIG) welding method by control of Marangoni convection. Mater. Sci. Eng. A 2008, 495, 296–303. [Google Scholar] [CrossRef]
  8. Tathgir, S.; Rathod, D.W.; Batish, A. Process enhancement using hydrogen-induced shielding: H2-induced A-TIG welding process. Mater. Manuf. Process. 2020, 35, 1084–1095. [Google Scholar] [CrossRef]
  9. Niagaj, J. Influence of Activated Fluxes on the Bead Shape of A-TIG Welds on Carbon and Low-Alloy Steels in Comparison with Stainless Steel AISI 304L. Metals 2021, 11, 530. [Google Scholar] [CrossRef]
  10. Balos, S.; Dramicanin, M.; Janjatovic, P.; Kulundzic, N.; Zabunov, I.; Pilic, B.; Klobčar, D. Influence of Metallic Oxide Nanoparticles on the Mechanical Properties of an A-TIG Welded 304L Austenitic Stainless Steel. Materials 2020, 13, 4513. [Google Scholar] [CrossRef] [PubMed]
  11. Balos, S.; Dramicanin, M.; Janjatovic, P.; Zabunov, I.; Klobcar, D.; Busic, M.; Grilli, M.L. Metal oxide nanoparticle-based coating as a catalyzer for A-TIG welding: Critical raw material perspective. Metals 2019, 9, 567. [Google Scholar] [CrossRef] [Green Version]
  12. Singh, A.K.; Kumar, M.; Dey, V.; Rai, R.N. A study to increase weld penetration in P91 steel during TIG welding by using activating fluxes. In Proceedings of the IOP Conference Series: Materials Science and Engineering, Hyderabad, India, 3–4 July 2017; p. 012099. [Google Scholar]
  13. Vidyarthy, R.S.; Dwivedi, D.K. Microstructural and mechanical properties assessment of the P91 A-TIG weld joints. J. Manuf. Process. 2018, 31, 523–535. [Google Scholar] [CrossRef]
  14. Vora, J.J.; Badheka, V.J. Experimental investigation on mechanism and weld morphology of activated TIG welded bead-on-plate weldments of reduced activation ferritic/martensitic steel using oxide fluxes. J. Manuf. Process. 2015, 20, 224–233. [Google Scholar] [CrossRef]
  15. Nagaraju, S.; Vasantharaja, P.; Chandrasekhar, N.; Vasudevan, M.; Jayakumar, T. Optimization of welding process parameters for 9Cr-1Mo steel using RSM and GA. Mater. Manuf. Process. 2016, 31, 319–327. [Google Scholar] [CrossRef]
  16. Arivazhagan, B.; Vasudevan, M. Studies on A-TIG welding of 2.25 Cr-1Mo (P22) steel. J. Manuf. Process. 2015, 18, 55–59. [Google Scholar] [CrossRef]
  17. Kumar, S.A.; Sathiya, P. Experimental investigation of the A-TIG welding process of Incoloy 800H. Mater. Manuf. Process. 2015, 30, 1154–1159. [Google Scholar] [CrossRef]
  18. Tseng, K.-H.; Wang, N.-S. GTA welding assisted by mixed ionic compounds of stainless steel. Powder Technol. 2014, 251, 52–60. [Google Scholar] [CrossRef]
  19. Tseng, K.-H.; Hsu, C.-Y. Performance of activated TIG process in austenitic stainless steel welds. J. Mater. Process. Technol. 2011, 211, 503–512. [Google Scholar] [CrossRef]
  20. Tseng, K.-H. Development and application of oxide-based flux powder for tungsten inert gas welding of austenitic stainless steels. Powder Technol. 2013, 233, 72–79. [Google Scholar] [CrossRef]
  21. Vora, J.J.; Badheka, V.J. Improved penetration with the use of oxide fluxes in activated TIG welding of low activation ferritic/martensitic steel. Trans. Indian Inst. Met. 2016, 69, 1755–1764. [Google Scholar] [CrossRef]
  22. Vora, J.J.; Badheka, V.J. Experimental investigation on effects of carrier solvent and oxide fluxes in activated TIG welding of reduced activation ferritic/martensitic steel. Int. J. Adv. Mech. Automob. Eng. 2016, 3, 1–5. [Google Scholar]
  23. Vora, J.J.; Badheka, V.J. Experimental investigation on microstructure and mechanical properties of activated TIG welded reduced activation ferritic/martensitic steel joints. J. Manuf. Process. 2017, 25, 85–93. [Google Scholar] [CrossRef]
  24. Marya, M. Theoretical and experimental assessment of chloride effects in the A-TIG welding of magnesium. Weld. World 2002, 46, 7–21. [Google Scholar] [CrossRef]
  25. Tomków, J.; Sobota, K.; Krajewski, S. Series: Mechanical Engineering. Influence of tack welds distribution and welding sequence on the angular distortion of tig welded joint. Facta Univ. Ser. Mech. Eng. 2020, 3, 611–621. [Google Scholar]
  26. Zhao, D.; Wang, Y.; Sheng, S.; Lin, Z. Multi-objective optimal design of small scale resistance spot welding process with principal component analysis and response surface methodology. J. Intell. Manuf. 2014, 25, 1335–1348. [Google Scholar] [CrossRef]
  27. Muhammad, N.; Manurung, Y.H.; Jaafar, R.; Abas, S.K.; Tham, G.; Haruman, E. Model development for quality features of resistance spot welding using multi-objective Taguchi method and response surface methodology. J. Intell. Manuf. 2013, 24, 1175–1183. [Google Scholar] [CrossRef]
  28. do Valle Tomaz, I.; Colaço, F.H.G.; Sarfraz, S.; Pimenov, D.Y.; Gupta, M.K.; Pintaude, G. Investigations on quality characteristics in gas tungsten arc welding process using artificial neural network integrated with genetic algorithm. Int. J. Adv. Manuf. Technol. 2021, 113, 3569–3583. [Google Scholar] [CrossRef]
  29. Katherasan, D.; Elias, J.V.; Sathiya, P.; Haq, A.N. Simulation and parameter optimization of flux cored arc welding using artificial neural network and particle swarm optimization algorithm. J. Intell. Manuf. 2014, 25, 67–76. [Google Scholar] [CrossRef]
  30. Vasudevan, M.; Bhaduri, A.K.; Raj, B.; Rao, K.P. Genetic-algorithm-based computational models for optimizing the process parameters of A-TIG welding to achieve target bead geometry in type 304 L (N) and 316 L (N) stainless steels. Mater. Manuf. Process. 2007, 22, 641–649. [Google Scholar] [CrossRef]
  31. Vasudevan, M.; Arunkumar, V.; Chandrasekhar, N.; Maduraimuthu, V. Genetic algorithm for optimisation of A-TIG welding process for modified 9Cr–1Mo steel. Sci. Technol. Weld. Join. 2010, 15, 117–123. [Google Scholar] [CrossRef]
  32. Ansaripour, N.; Heidari, A.; Eftekhari, S.A. Multi-objective optimization of residual stresses and distortion in submerged arc welding process using Genetic Algorithm and Harmony Search. J. Mech. Eng. Sci. 2020, 234, 862–871. [Google Scholar] [CrossRef]
  33. Vora, J.J.; Abhishek, K.; Ramkumar, P.J. Different methodologies for the parametric optimization of welding processes. In Advances in Welding Technologies for Process Development; CRC Press: Boca Raton, FL, USA, 2019; Volume 55. [Google Scholar]
  34. Patel, V.K.; Savsani, V.J. Heat transfer search (HTS): A novel optimization algorithm. Inf. Sci. 2015, 324, 217–246. [Google Scholar] [CrossRef]
  35. Degertekin, S.; Lamberti, L.; Hayalioglu, M. Heat transfer search algorithm for sizing optimization of truss structures. Lat. Am. J. Solids Struct. 2017, 14, 373–397. [Google Scholar] [CrossRef]
  36. Raja, B.; Patel, V.; Jhala, R.L.; Progress, E. Thermal design and optimization of fin-and-tube heat exchanger using heat transfer search algorithm. Therm. Sci. Eng. Prog. 2017, 4, 45–57. [Google Scholar] [CrossRef]
  37. Tejani, G.G.; Savsani, V.J.; Patel, V.K.; Savsani, P.V.; Engineering. Size, shape, and topology optimization of planar and space trusses using mutation-based improved metaheuristics. J. Comput. Des. Eng. 2018, 5, 198–214. [Google Scholar] [CrossRef]
  38. Patel, V.; Savsani, V.; Mudgal, A. Efficiency, thrust, and fuel consumption optimization of a subsonic/sonic turbojet engine. Energy 2018, 144, 992–1002. [Google Scholar] [CrossRef]
  39. Vora, J.J.; Abhishek, K.; Srinivasan, S. Attaining optimized A-TIG welding parameters for carbon steels by advanced parameter-less optimization techniques: With experimental validation. J. Braz. Soc. Mech. Sci. Eng. 2019, 41, 261. [Google Scholar] [CrossRef]
  40. Lostado Lorza, R.; Escribano García, R.; Martínez Calvo, M.Á.; Múgica Vidal, R. Improvement in the design of welded joints of EN 235JR low carbon steel by multiple response surface methodology. Metals 2016, 6, 205. [Google Scholar] [CrossRef] [Green Version]
  41. Liao, B.; Shi, Y.; Cui, Y.; Cui, S.; Jiang, Z.; Yi, Y. Mathematical model for prediction and optimization of weld bead geometry in all-position automatic welding of pipes. Metals 2018, 8, 756. [Google Scholar] [CrossRef] [Green Version]
  42. Zhang, B.; Chen, X.; Pan, K.; Wang, J. Multi-objective optimization of friction stir spot-welded parameters on aluminum alloy sheets based on automotive joint loads. Metals 2019, 9, 520. [Google Scholar] [CrossRef] [Green Version]
  43. Ibrahim, H.M.; Elkhidir, E.E. Response surface method as an efficient tool for medium optimisation. Trends Appl. Sci. Res. 2011, 6, 121–129. [Google Scholar] [CrossRef]
  44. Popović, O.; Prokić, R.; Burzić, M.; Milutinović, Z. The effect of heat input on the weld metal toughness of surface welded joint. In Proceedings of the 14th International Research/Expert Conference “Trends in the Development of Machinery and Associated Technology”, Mediterranean Cruise, Faculty of Mechanical Engineering, University of Belgrade, Belgrade, Serbia, 11–18 September 2010; pp. 11–18. [Google Scholar]
Figure 1. Schematic setup showing (a) preparation and application of activating flux, (b) in-house A-TIG welding setup.
Metals 11 00981 g001
Figure 2. Weld bead morphological dimensions: width of Heat-Affected Zone (HAZ), Bead Width (BW), Depth of Penetration (DOP).
Metals 11 00981 g002
Figure 3. The optimization route followed in this work.
Metals 11 00981 g003
Figure 4. Predicted values (by generated models) vs. actual values (experimentally measured) for (a) DOP, (b) HI, (c) Aspect ratio, (d) HAZ width.
Metals 11 00981 g004
Figure 5. 3D surface plots for DOP at constant (a) arc length of 1 mm; (b) welding current of 192 A; and (c) travel speed of 80 mm/min.
Metals 11 00981 g005aMetals 11 00981 g005b
Table 1. Chemical composition of SA 516 Gr. 70 steel (weight in %) [39].
CSPMnSiAlCuCrNiMoVTi
0.20.010.0131.10.210.023<0.02<0.015<0.015<0.015<0.01<0.005
Table 2. Fixed parameters for bead-on-plate trials [39].
Crater current200 A
Electrode typeTungsten (2% Thoriated)
Electrode diameter2.9 mm
Electrode angle18–20° (Blunt ground at the tip)
Shielding gasArgon (99.999% purity)
Gas flow rate10–12 L/min
Welding position1G PA
Electrode extension5–6 mm
Nozzle diameter8 mm
Table 3. Welding parameters and their levels [39].
ParametersUnitsNotationsFactor Levels
---−101
Arc lengthmmL123
Welding currentAI160180200
Travel speedmm/minT80100120
Table 4. Design Matrix as per BBD.
Exp. No.Coded ValuesActual Values
x 1 x 2 x 3 E (mm)I (A)TS (mm/min)
10002180100
2−1−101160100
3−1011180120
4−10−1118080
501−1220080
60−1−1216080
7−1101200100
80002180100
90002180100
1010−1318080
110002180100
120002180100
131−103160100
140112200120
150−112160120
161103200100
171013180120
Table 5. Experimentally measured values.
Exp. No.DOP (mm)BW (mm)VoltageHI (kJ/mm)D/wHAZ (mm)
14.497.1513.501.460.635.90
24.526.4113.201.270.714.01
35.223.8512.501.131.362.00
48.194.9813.201.781.655.20
56.507.5013.502.030.875.40
65.968.6412.501.500.695.96
74.795.7112.001.440.842.10
84.497.1513.501.460.635.90
94.487.1413.501.460.635.94
107.107.5114.501.960.955.68
114.506.9213.501.460.655.89
124.006.5613.501.460.615.90
133.728.5612.501.200.443.00
143.266.8014.401.440.483.20
152.997.5313.001.040.402.90
164.007.9114.501.740.513.88
174.425.9813.001.170.742.80
Table 6. ANOVA statistics for the generated models.
Response FeatureModelR2Adj. R-SquaredPred R-SquaredAdeq. Precision
DOPQuadratic0.99150.98060.957535.153
D/wForward regression0.95540.92860.822722.315
HAZQuadratic0.99450.98730.911330.717
HIBack elimination regression0.96850.95420.903729.315
Table 7. Validation results for case study 1.
Weld Bead Dimension Values
ConditionDOP (mm)BW (mm)Voltage (V)HI (kJ/mm)D/wHAZ Width (mm)
Predicted by HTS Algorithm8.245.2812.751.771.564.99
Experimentally measured values8.15.3312.541.741.525.14
% ERROR1.720.941.671.722.632.91
Metals 11 00981 i001
Table 8. Validation results for case study 2.
Weld Bead Dimension Values
ConditionDOP (mm)BW (mm)Voltage (V)HI (kJ/mm)D/wHAZ Width (mm)
Predicted by HTS Algorithm6.205.1613.091.481.204.82
Experimentally measured values6.325.0112.541.461.154.40
% ERROR1.892.994.381.364.349.5
Metals 11 00981 i002
Table 9. Validation results for case study 3.
Weld Bead Dimension Values
ConditionDOP (mm)BW (mm)Voltage (V)HI (kJ/mm)D/wHAZ Width (mm)
Predicted by HTS Algorithm6.205.0412.891.501.234.44
Experimentally measured values6.416.0514.251.621.064.32
% ERROR3.2716.79.57.4162.7
Metals 11 00981 i003
Table 10. Validation results for case study 4.
Weld Bead Dimension Values
ConditionDOP (mm)BW (mm)Voltage (V)HI (kJ/mm)D/wHAZ Width (mm)
Predicted by HTS Algorithm8.075.4214.831.821.494.12
Experimentally measured values8.156.0313.331.901.354.32
% ERROR0.9810.111.24.210.44.6
Metals 11 00981 i004
Publisher’s Note: MDPI stays neutral with regard to jurisdictional claims in published maps and institutional affiliations.

