1. Introduction
High-entropy alloys (HEAs) contain five or more elements at concentrations of 5–35%, and thus exhibit significant multi-element effects, e.g., high entropy, lattice distortion, sluggish diffusion and cocktail effects [
1,
2]. The effects generate anomalous properties in HEAs, such as high strength, good ductility, excellent fracture toughness and outstanding resistances to corrosion, radiation and fatigue [
3,
4]. Thus, HEAs with multiple-principal elements have received extensive attention and are also considered as potential candidates for engineering materials in the automotive, aerospace and marine fields.
The HEAs tend to form simple solid solution phases, such as face-centered cubic (FCC), body-centered cubic (BCC) or hexagonal close-packed (HCP) structures [
5,
6,
7,
8]. CoCrFeMnNi alloy is a typical FCC HEA and its main disadvantage is the low yield stress [
9]. Work hardening and refining hardening can be employed to increase the yield strength of HEA alloys [
10,
11]. Moreover, alloying is also an effective method to increase the yield stress by solid solution hardening or precipitation hardening [
12,
13,
14,
15,
16]. The FCC Al
0.3CoCrFeNi is the most widely studied precipitation hardening HEA alloy [
16,
17,
18,
19,
20]. It has been reported that two stable phases (L1
2 and B2 phases) with order structure can be favorably precipitated within the FCC matrix [
18,
21,
22]. With increasing temperature, phase transformations from FCC phase to a L1
2 phase and finally to a B2 phase can be observed in as-cast alloys [
18]. The L1
2 phase can be homogeneously precipitated within FCC matrix, but it has a low barrier effect on slip. In contrast, the B2 phase can generate stronger hardening effect than the L1
2 phase. However, the B2 phase has a high nucleation barrier and is only precipitated at above 700 °C in as-cast alloys [
21]. Pre-inducing crystal defects are expected to increase the nucleation sites for precipitation. Tang et al. [
23] found that refining grains can promote the precipitation of the B2 phase. In the nanocrystalline HEA, direct transformation from the FCC phase to the B2 phase was observed during annealing at 320 °C. Wang et al. [
24] used pre-tensile deformation (a strain of 10%) to promote the nucleation of the B2 phase during annealing at 700 °C. Moreover, cold-rolling was also usually employed to tailor the precipitation behavior and microstructure [
18,
19,
20,
22]. It has been found that profuse dislocations and some deformation twins can be formed in the Al
0.3CoCrFeNi matrix during cold-rolling. These defects via cold-rolling can also promote the precipitation of the B2 phase during subsequent annealing, leading to an increase in strength. In addition to the precipitation, recovery and recrystallization during annealing can also affect the mechanical properties [
20]. It has been reported that the amount of recrystallization is typically dependent on annealing temperature and independent of time [
20,
21,
22,
23,
24,
25]. Thus, annealing treatment at various temperatures might influence the recrystallization level of cold-rolled Al
0.3CoCrFeNi alloys. However, few studies have focused on the effect of recrystallization level on the precipitation behavior and mechanical properties in cold-rolled Al
0.3CoCrFeNi alloys. In the present work, cold-rolling is used to induce a severely deformed microstructure. Annealing treatment at different temperatures was carried out to investigate the precipitate behavior and recrystallization level. Finally, the mechanical properties were evaluated.
3. Results
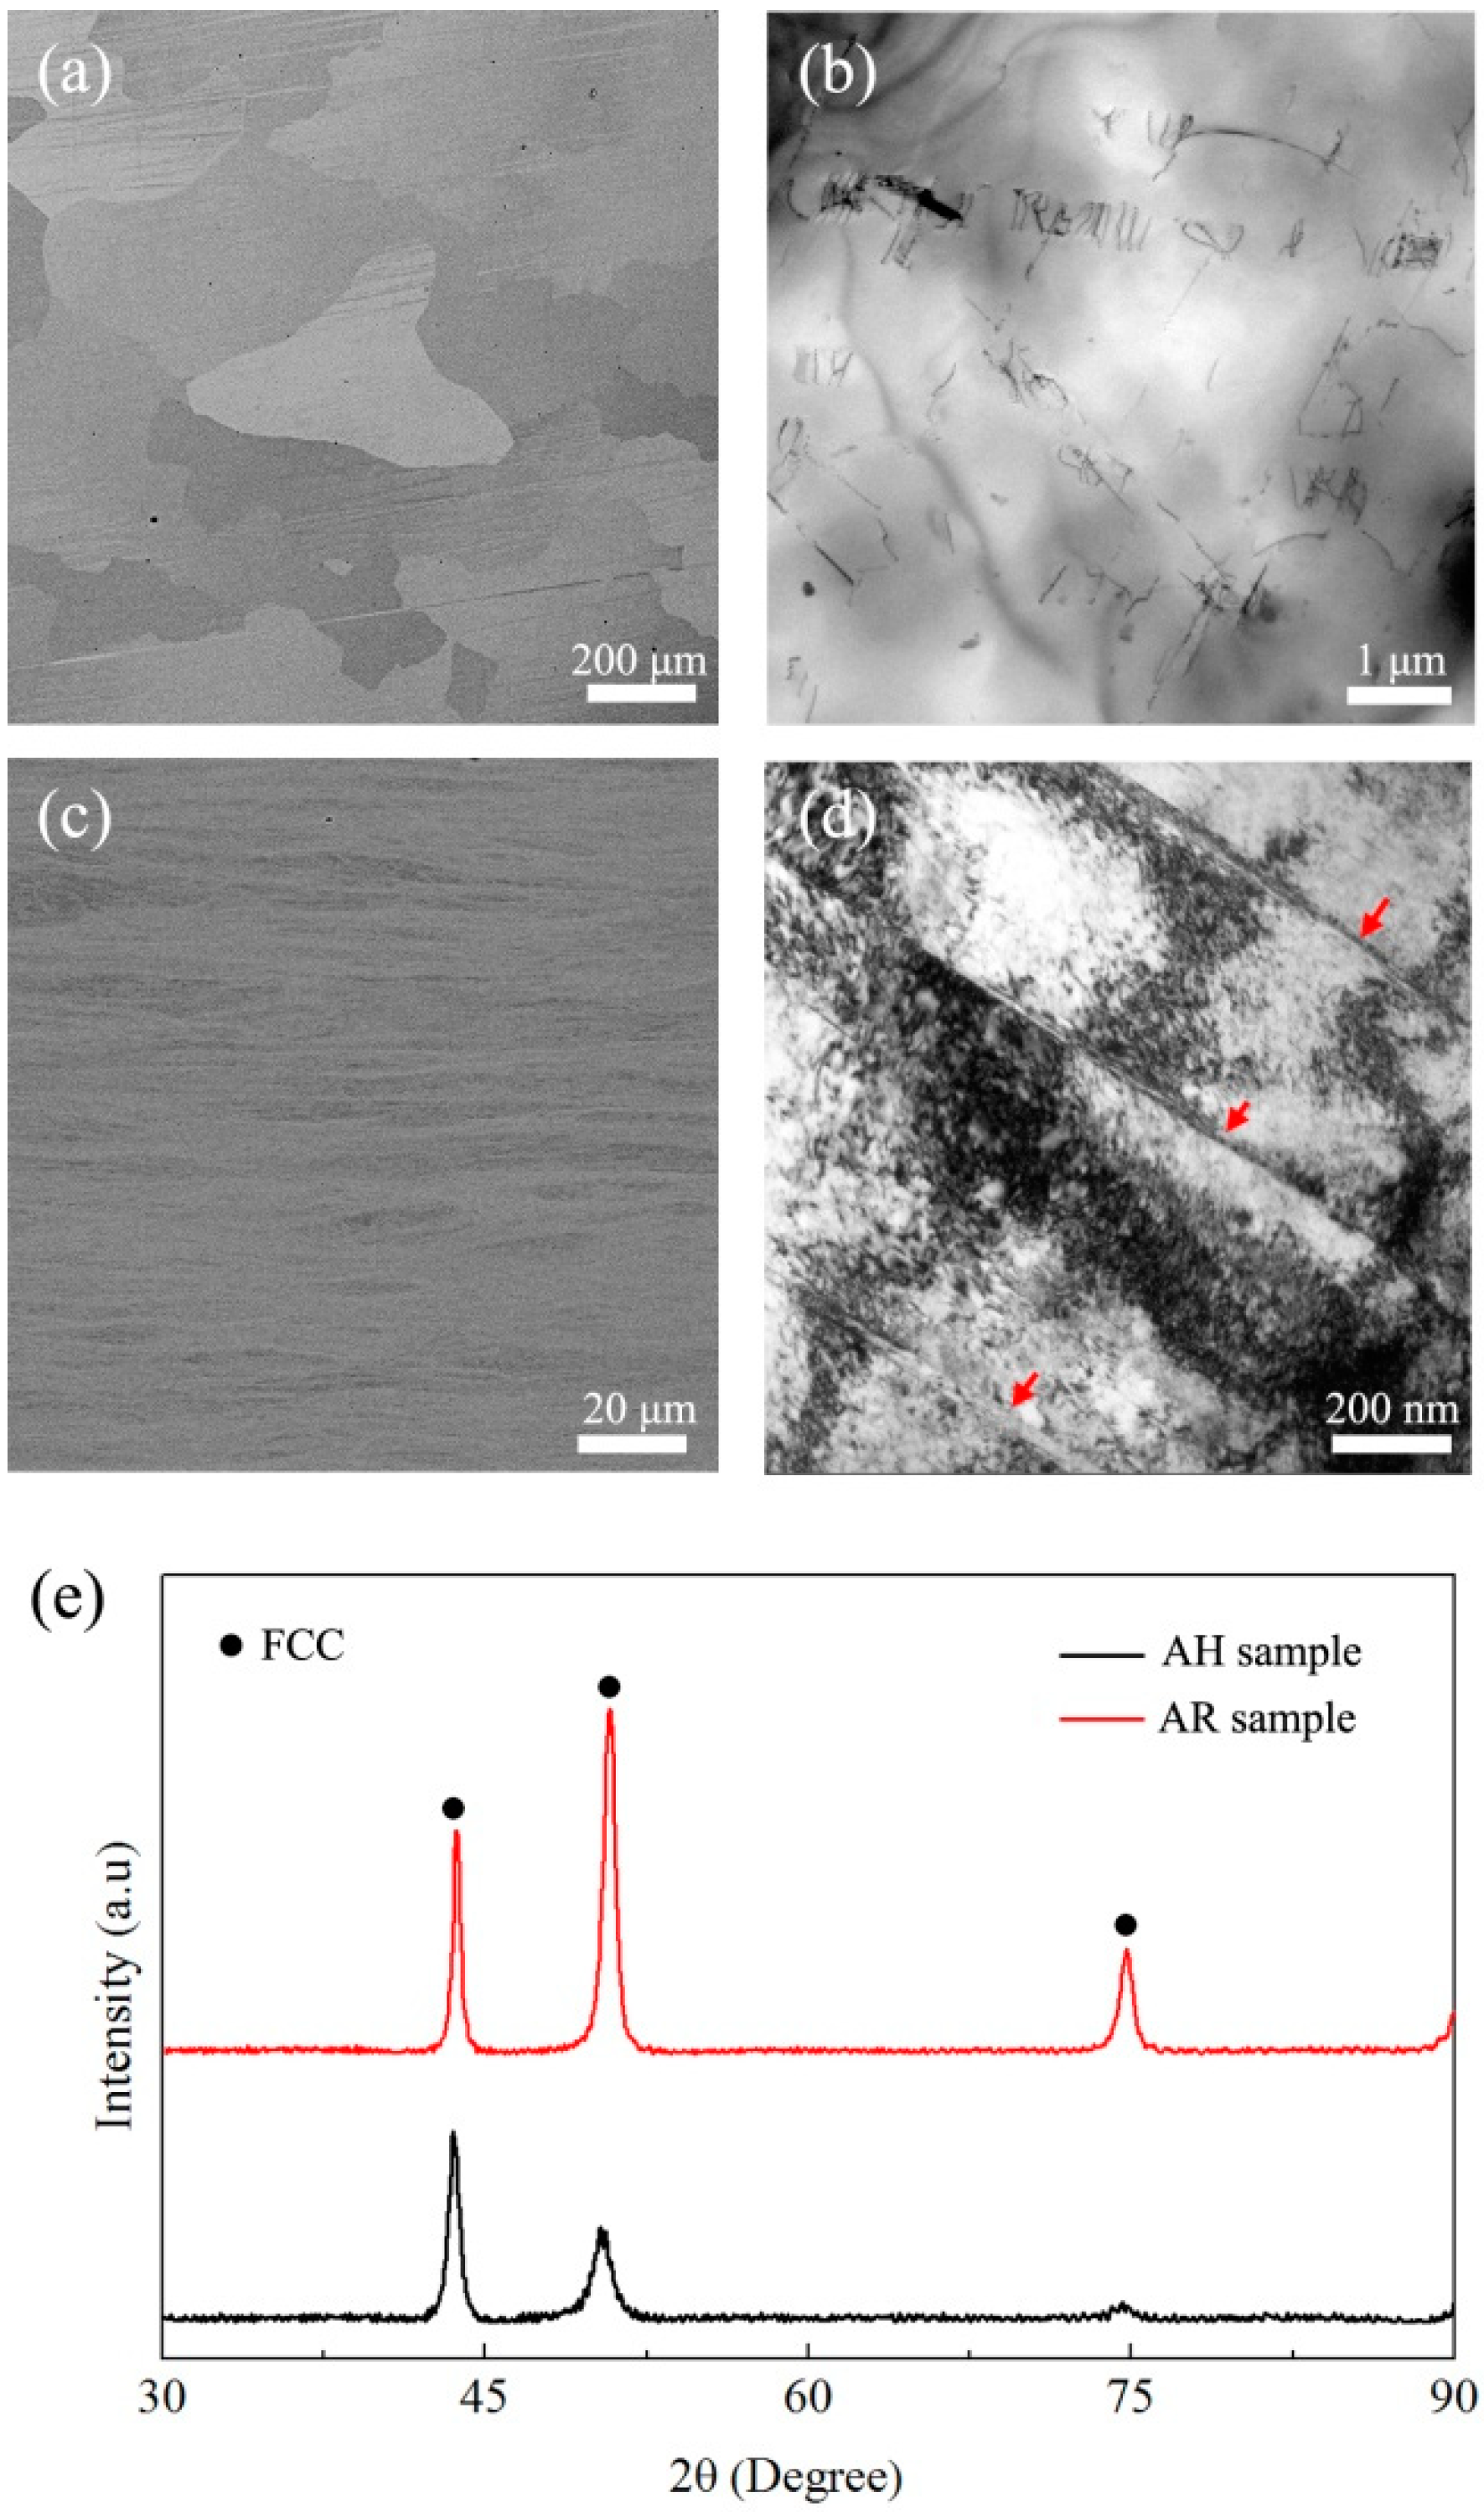
Figure 1a shows the SEM image of the AH sample. It was found that the AH sample has a single-phase structure with coarse grain size (>100 μm). The TEM bright-field image of the AH sample (see
Figure 1b) indicates that the overall contrast is relatively uniform, and no second phase is found. Moreover, some scattered dislocation lines can also be found within grains. After cold-rolling ~90%, initial coarse grains were deformed and broken, resulting in that the shape of grains are squashed into a fibrous deformation microstructure, as shown in
Figure 1c. The TEM image in
Figure 1d indicates that a high density of dislocations is formed during cold-rolling. Moreover, some deformation twins can also be found in the AR sample (see the red arrow in
Figure 1d). Such deformation twins have been observed in the deformed Al
0.3CoCrFeNi alloys by cold-rolling or tension at room temperature. This is attributed to the relatively low stacking fault energy [
27].
Figure 1e shows the XRD patterns of two alloys, confirming that the AH alloy has a single FCC phase without precipitates, and cold-rolling at room temperature retains such a single FCC phase structure.
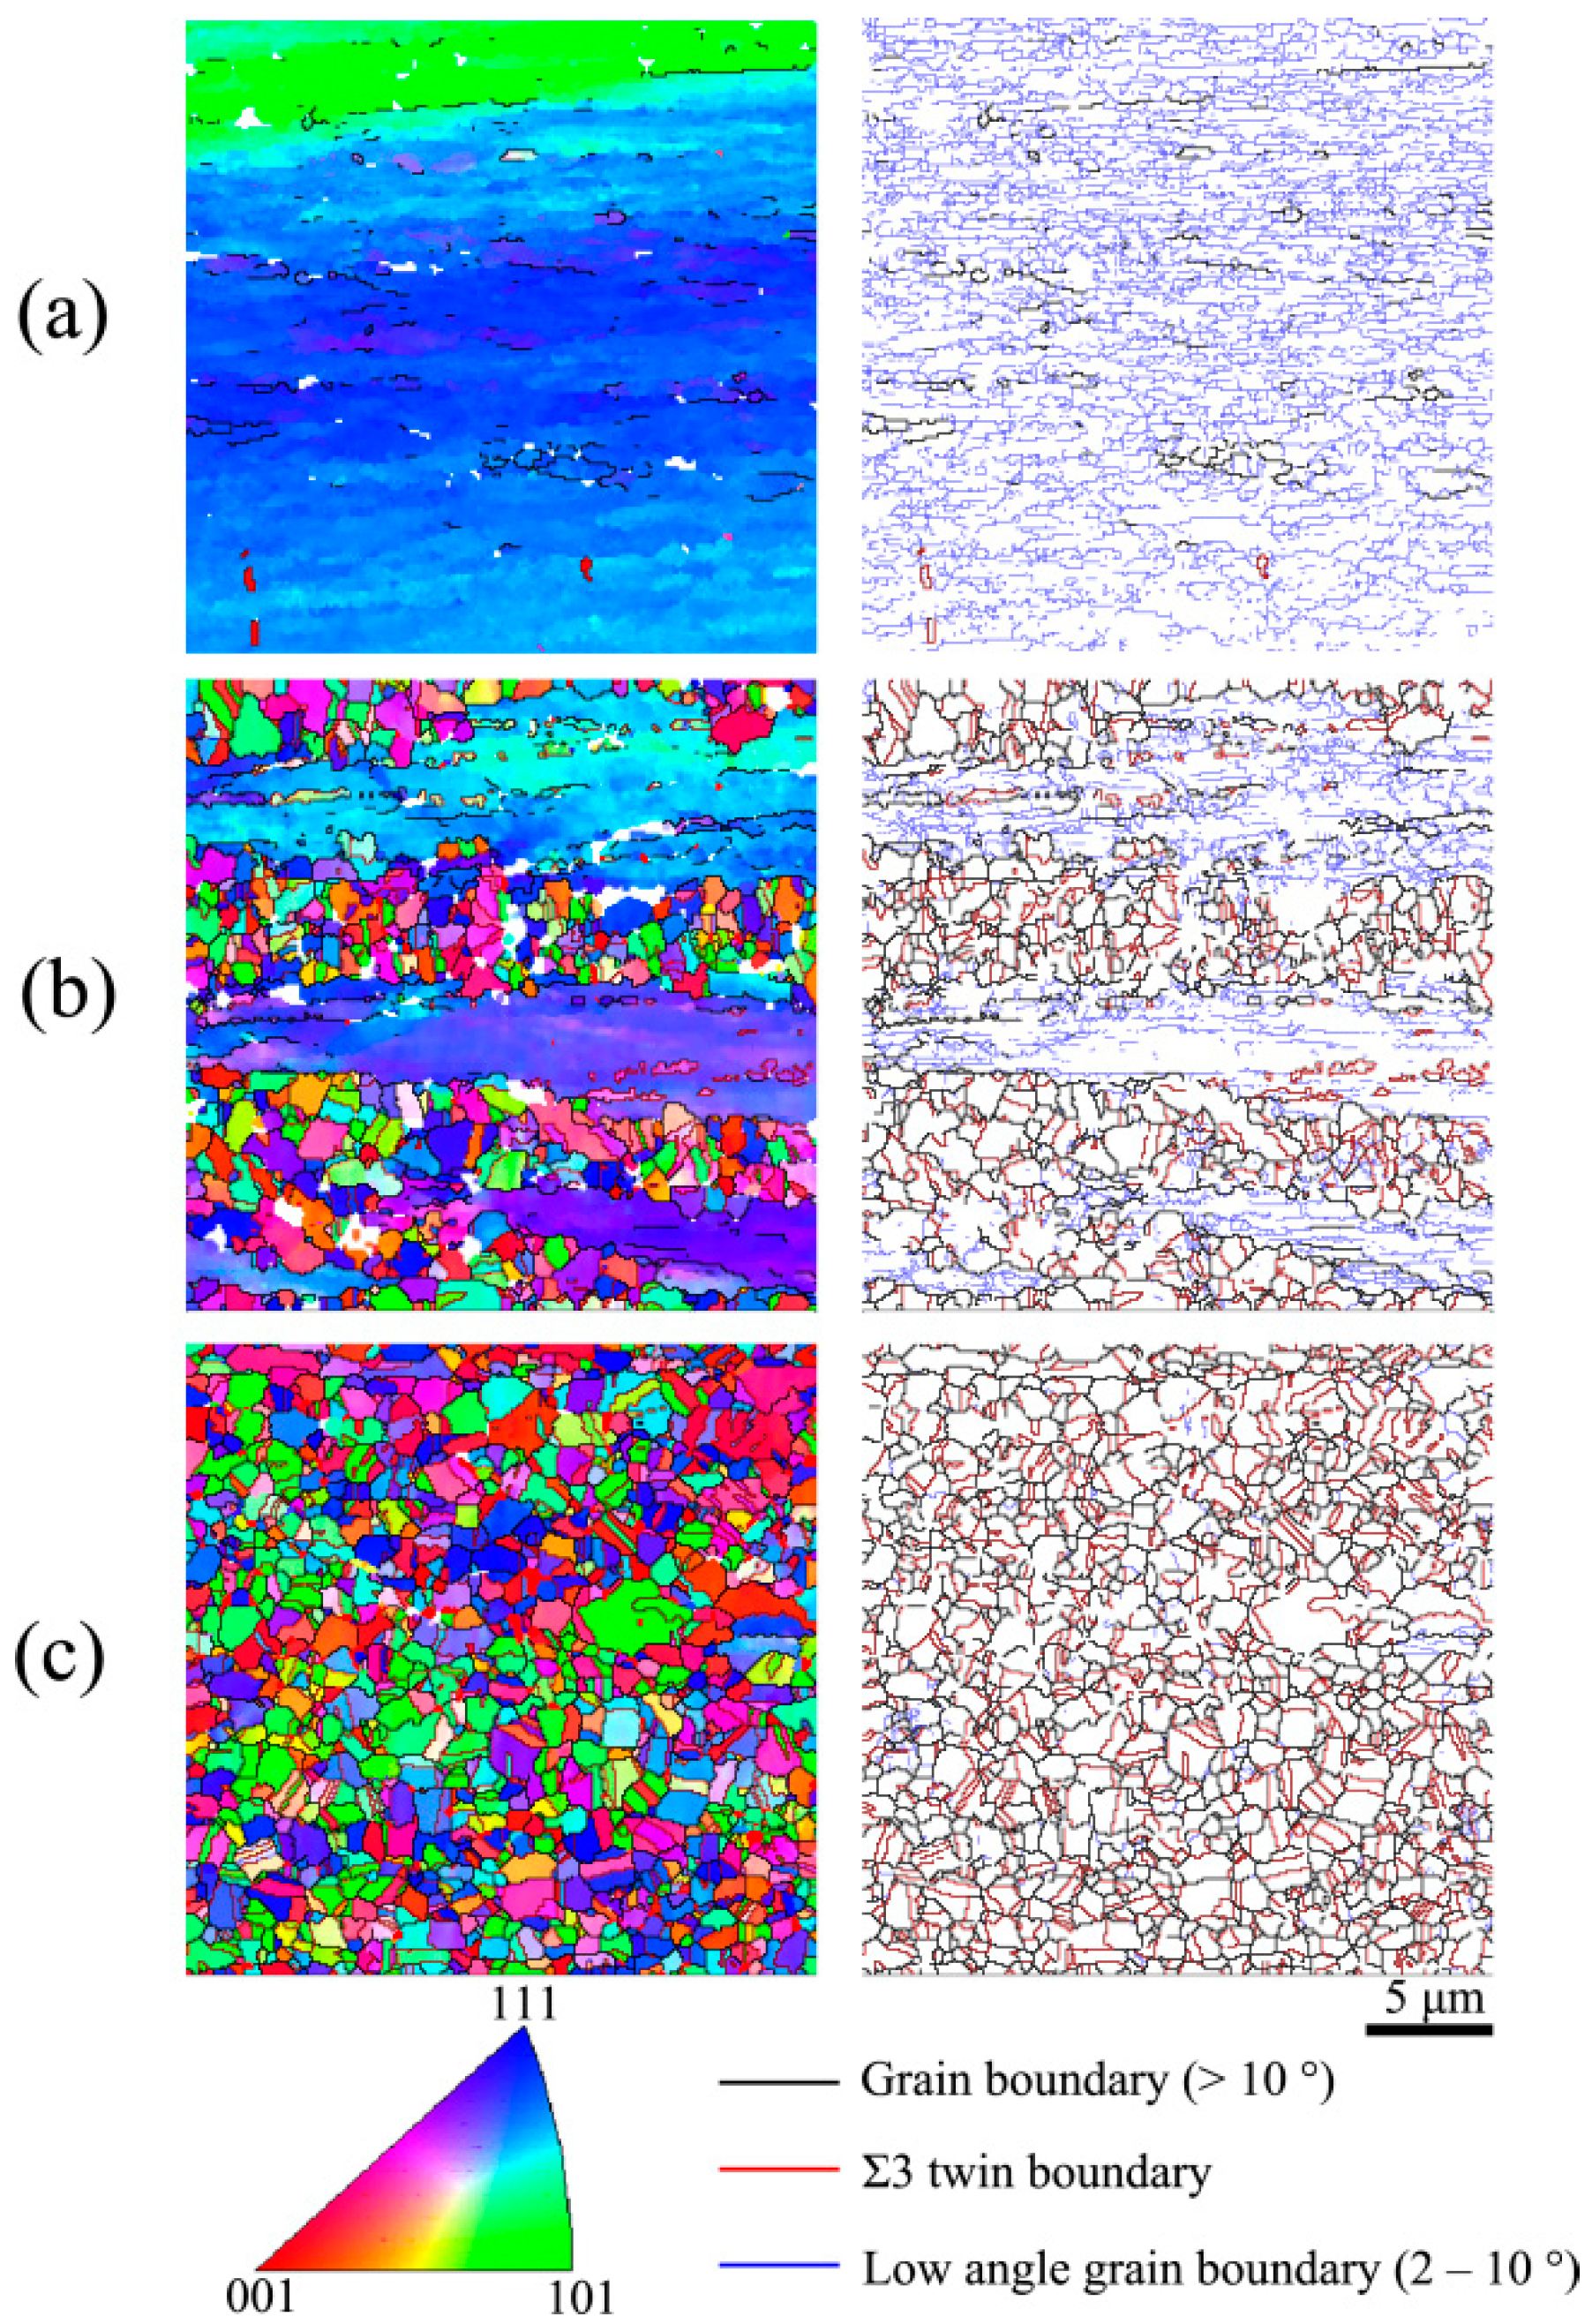
Figure 2 shows the EBSD maps of cold-rolled and annealed samples, indicating that annealing causes the evolution of low angle boundaries (LABs) in the AR sample. The density of LABs (the length of the LABs per area) is calculated and listed in
Table 2. After cold-rolling, a high density of LABs (~0.265 μm
−1) can be found within grains, which is related to profuse dislocations [
28]. Annealing treatment can remarkably reduce the density of LABs owing to static recovery and static recrystallization. When the annealing temperature is lower than 700 °C, a hetero-structure can be formed, which contains the recrystallized region (RS) and the non-recrystallized region (NRS).
Figure 2b shows the EBSD map of the AR660 sample. In the recrystallized regions, FCC matrix exhibits equiaxed fine grains (~1.25 μm) and very low LAB density (~0.011 μm
−1). Some non-recrystallized grains exhibit a fiber shape elongated along the RD. This indicates that a partial recrystallized microstructure can be generated when the annealing temperature is lower than 700 °C. The LAB density of the non-recrystallized region in the AR660 sample (~0.141 μm
−1) is lower than in the AR sample, owing to static recovery. With increasing annealing temperature to 800 °C, the density of LABs reduces to 0.009 μm
−1, and full recrystallization remarkably refines grains to form a uniform microstructure with an average grain size of ~1.31 μm. It was also found that annealing temperature exhibits little influence on recrystallized grain size. This might be attributed to the strong pining effect of the B2 phases on the movement of the boundary motion required for recrystallization growth [
20,
21,
22,
23,
24,
25,
26,
27,
28,
29]. Moreover, annealing twins can be formed within the recrystallized grains, which are identified as ~60° Σ3 twins. The density of Σ3 boundary is also calculated and listed in
Table 2. It was also found that annealing temperature has little influence on density of Σ3 twin boundaries within recrystallized grains. Moreover, a small amount of Σ3 twin boundaries can also be formed in the non-recrystallized grains.
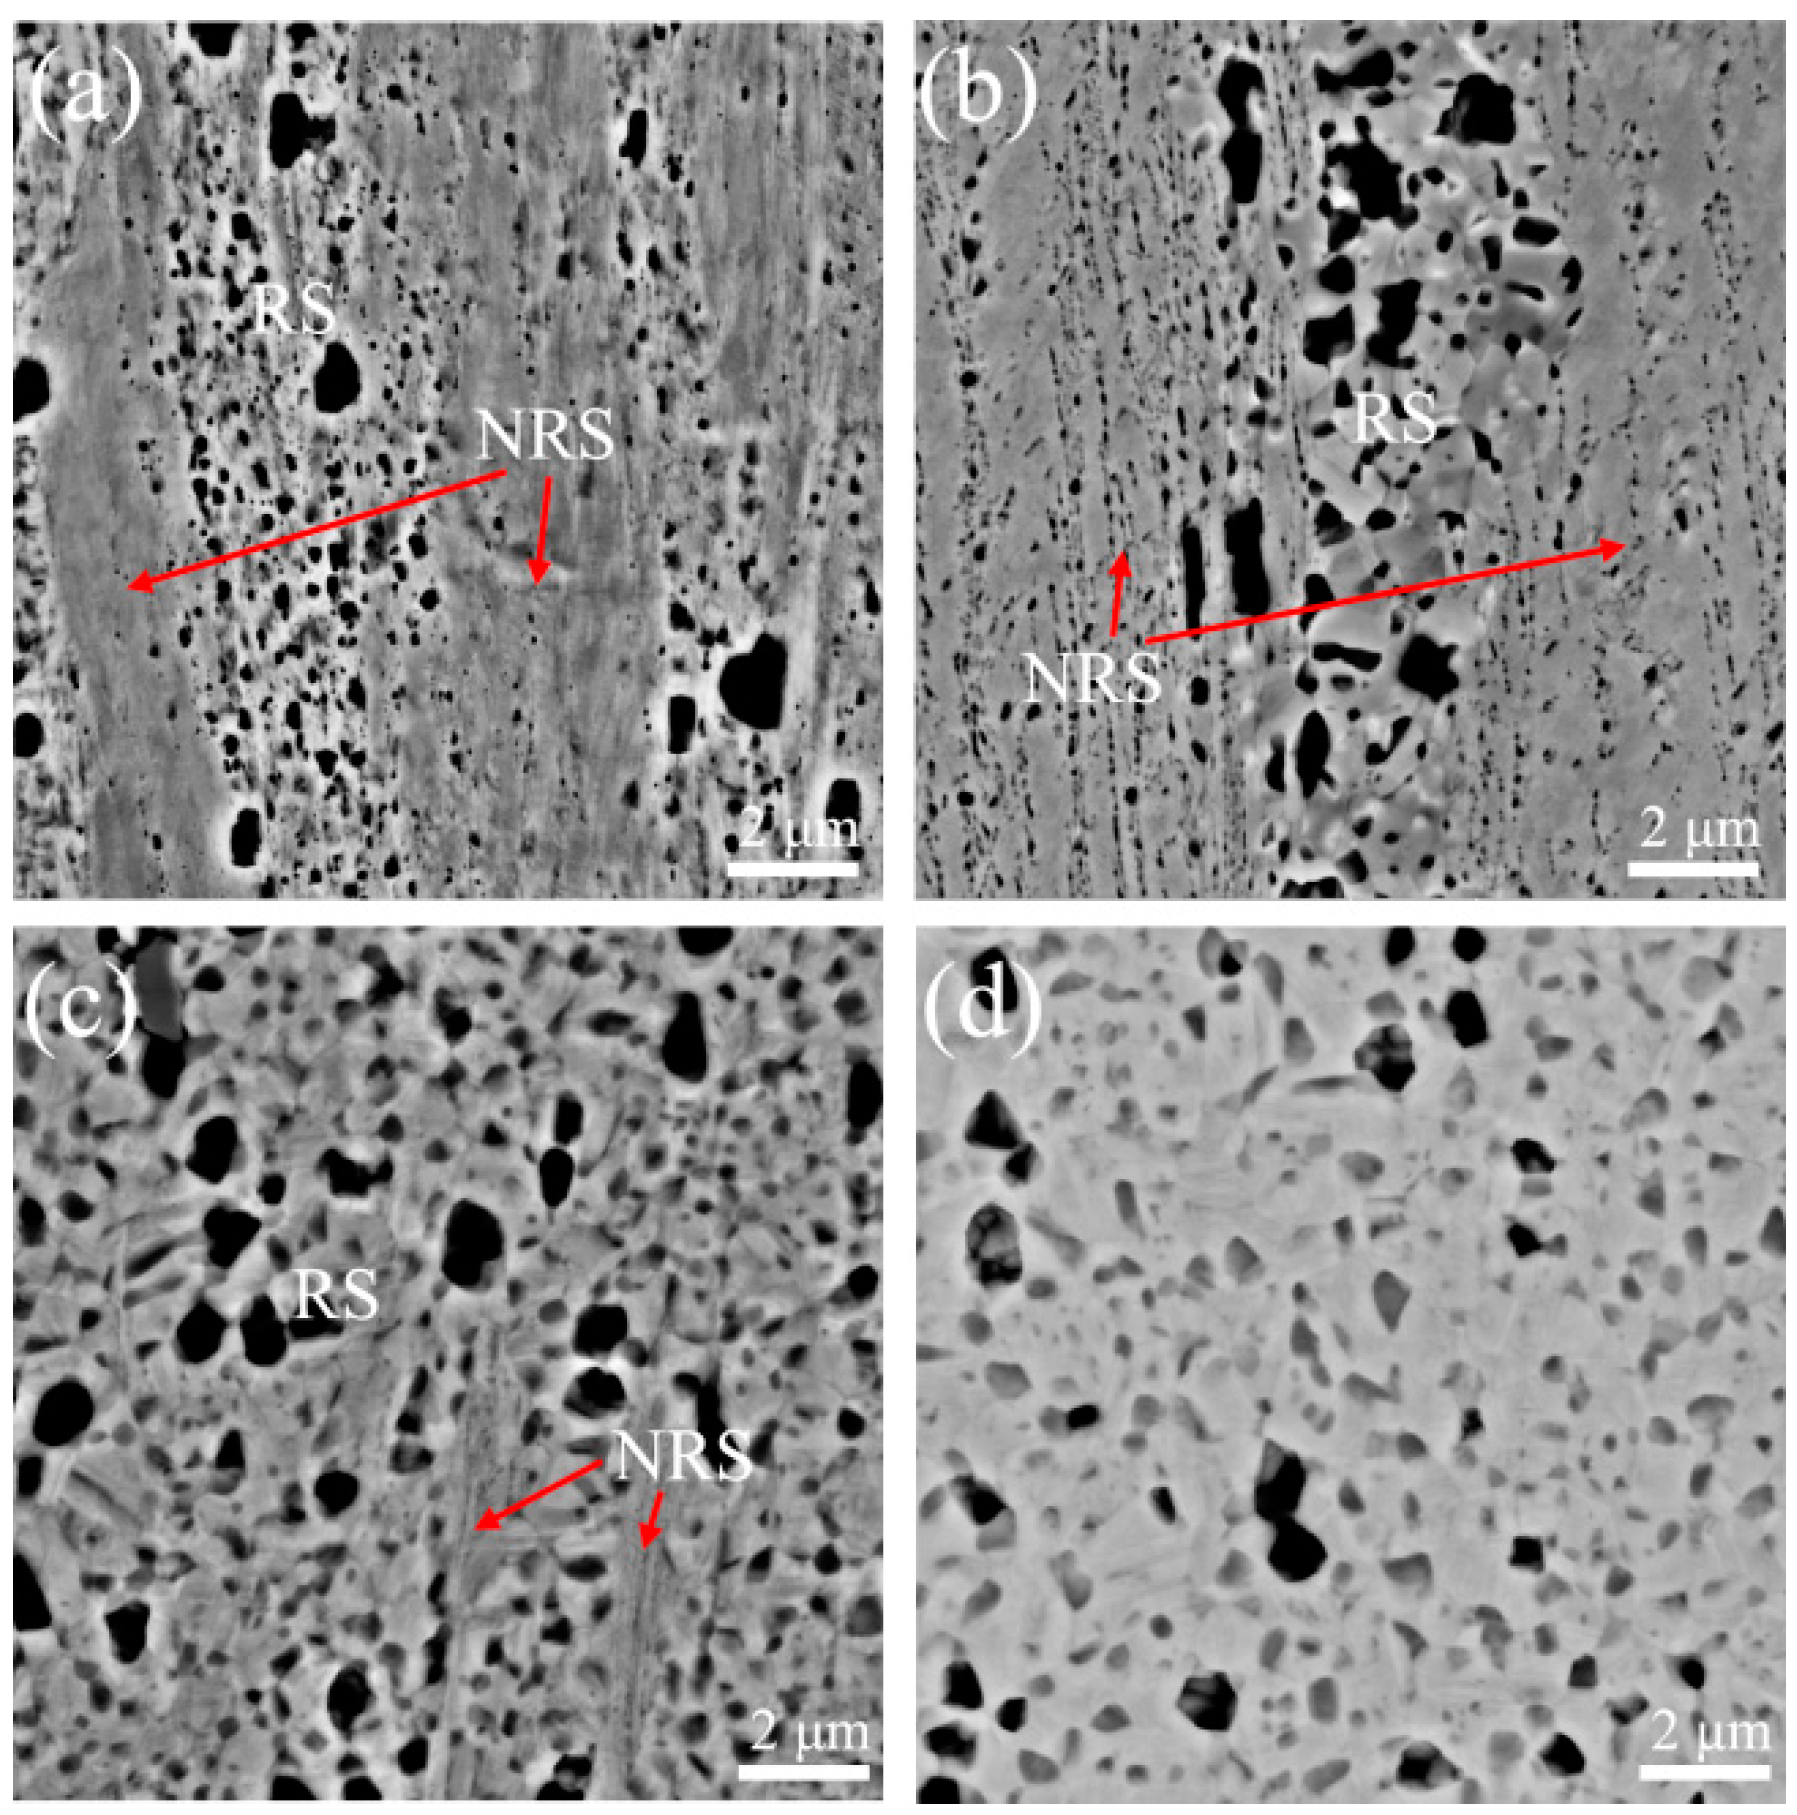
Figure 3 shows the SEM images of AR alloys annealed at various temperatures, indicating that annealing induces a large number of particles, and the feature of precipitate is largely dependent on the degree of recrystallization. Similar to
Figure 2, when the annealing temperature is lower than 700 °C, the microstructure usually contains a recrystallized region and a non-recrystallized region. In the recrystallized region, the precipitates have a coarse size. In contrast, precipitates within the non-recrystallized region are finer.
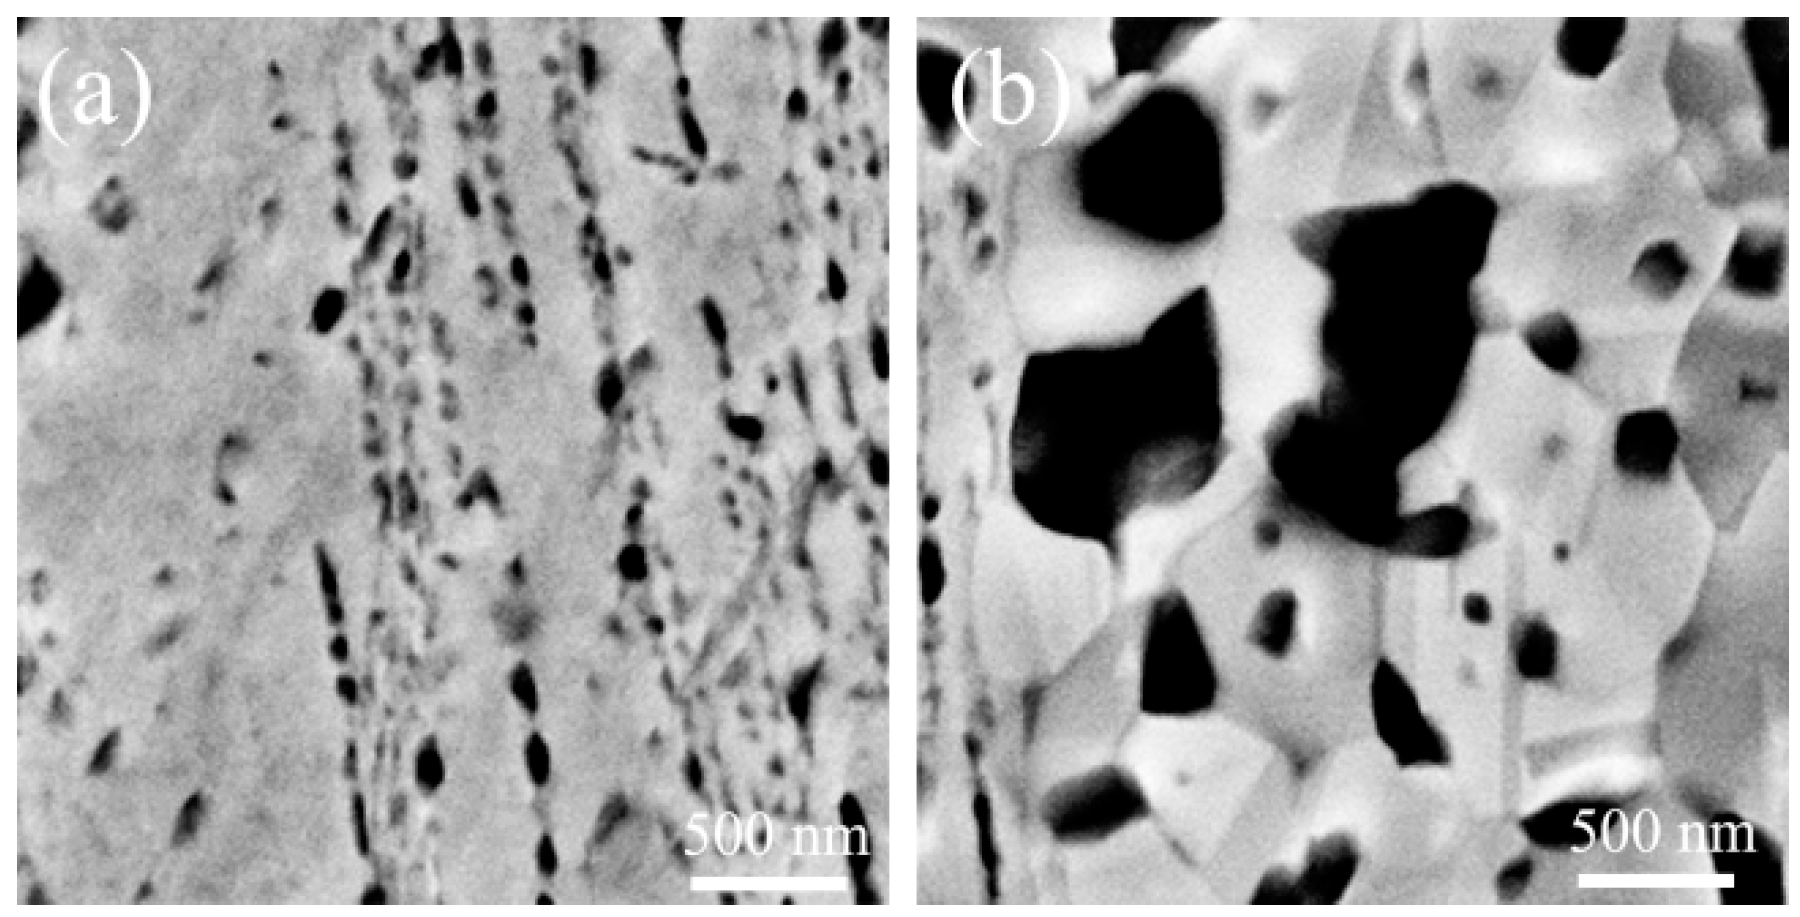
Figure 4 shows SEM images of the AR600 sample with high magnification. In the AR600 sample, the fine-scale elongated precipitates in the non-recrystallized region decorate the deformation bands. In the recrystallized region, coarse precipitates are usually located at the grain boundaries and some fine precipitates can also be found within recrystallized grains. The mean area per particle (A
p) and area fraction of particles (A
f) are summarized by five SEM images with an area of 18,496 μm
2, which are listed in
Table 3. This clearly shows that recrystallized regions have larger A
P and A
f than non-recrystallized regions. With increasing annealing temperature to 800 °C, the equiaxed precipitates are evenly distributed in the whole matrix due to the occurrence of complete recrystallization.
Table 3 also indicates that the annealing temperature has little influence on A
P and A
f in recrystallized regions.
Clearly, the recrystallization level will influence the distribution of precipitates with different size. The area fraction of the recrystallized region was calculated by using five SEM images with an area of 18,496 μm
2 and listed in
Table 4. For the AR590 sample, the area fraction of the recrystallized region is only 26.9%. With increasing annealing temperature, the area fraction of the recrystallized region increases. After annealing at 800 °C for 10 h, almost a fully recrystallized microstructure can be obtained.
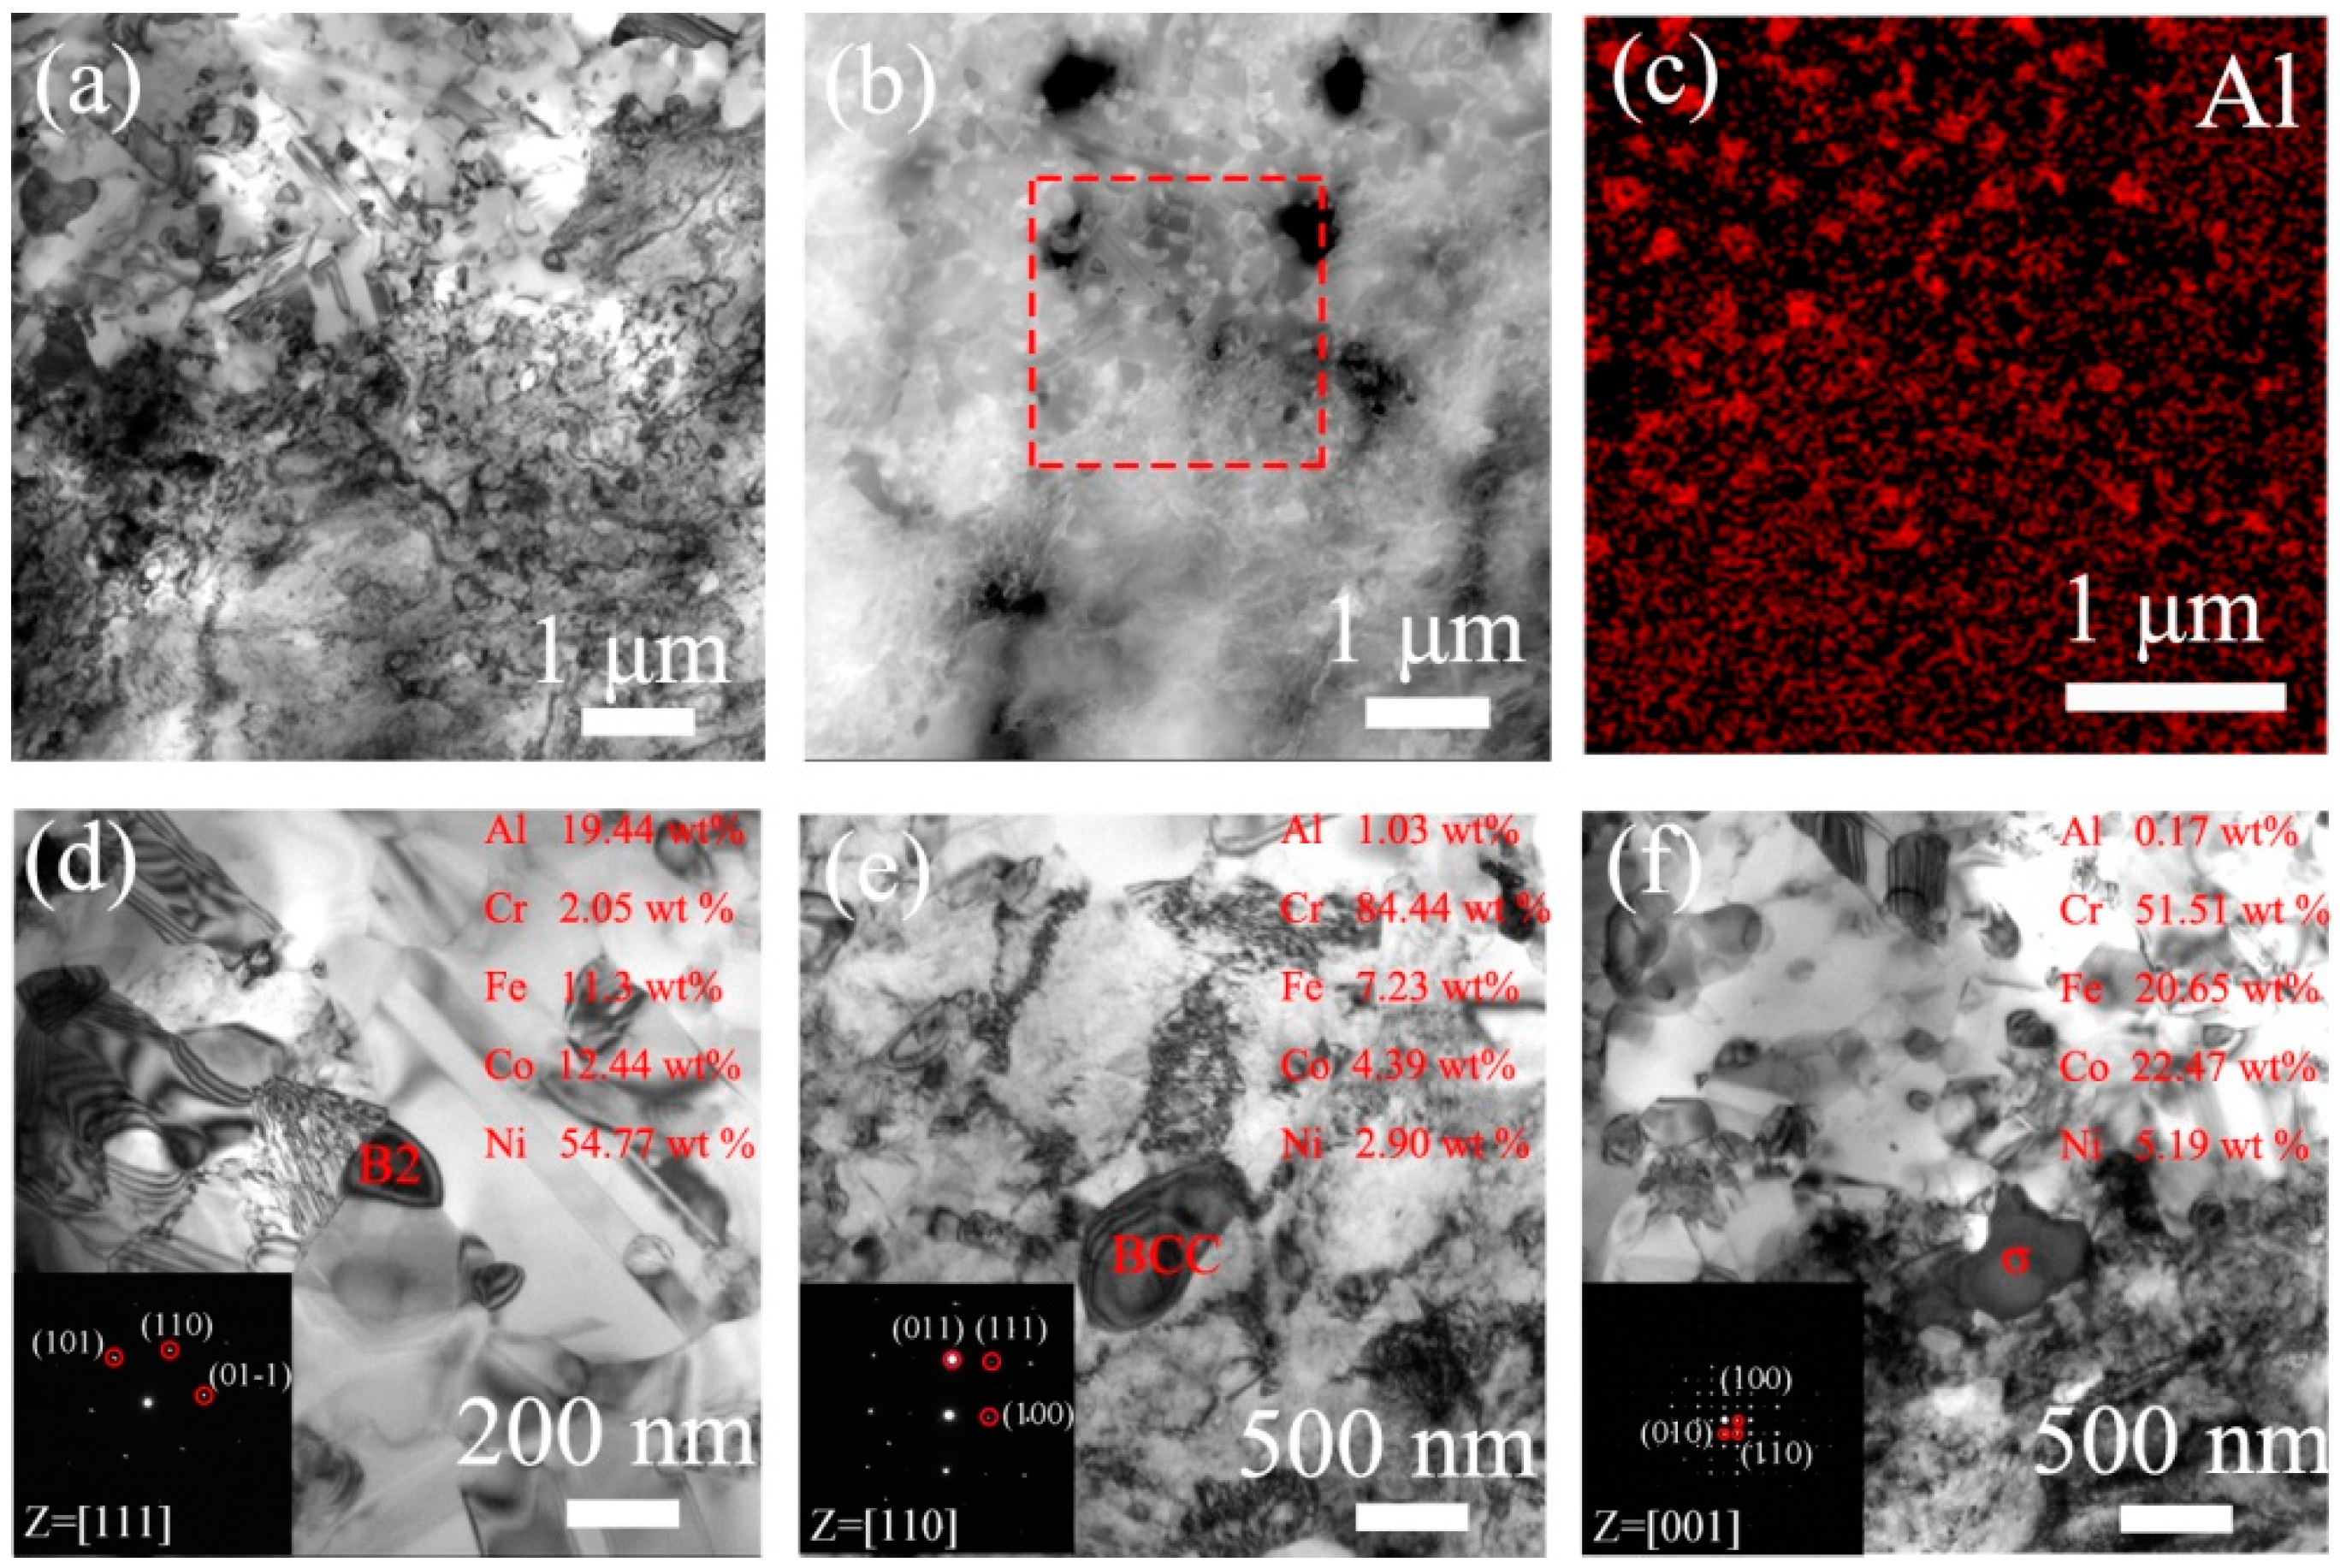
To further reveal the feature of precipitate, the TEM images of the AR590 sample are shown in
Figure 5. Numerous micro-sized precipitates are observed in the FCC grains in
Figure 5a,b. The Al-elemental energy dispersive spectrum of the region indicated by red dashed line in
Figure 5b is shown in
Figure 5c. The (Al-Ni)-rich B2 precipitate can be clearly identified in
Figure 5c. Apparently, the B2 precipitates possess a dominating proportion in the AR590 sample.
Figure 5d exhibits the morphology, composition and BCC structure of the B2 precipitate. The composition of the B2 precipitation acquired by TEM equipped with energy dispersive spectroscopy is Al=19.44%, Cr = 2.05%, Fe = 11.3%, Co = 12.44%, Ni = 54.77% in weight percentage. The SADP recorded from the B2 precipitate (see
Figure 5d) can be indexed firmly as the {111} bcc zone axis (ZA). This indicates that the B2 phase is an ordered BCC structure. In addition, the Kurdjumov–Sachs (K-S) relationship between B2 and the FCC matrix was reported, which is that the {110}
FCC is parallel to {111}
B2 while the {111}
FCC is parallel to {110}
B2 [
20]. Besides the Al-Ni rich second phase, the other two precipitates (Cr-rich BCC precipitate and Cr-Fe-Co-rich σ precipitate) were detected in AR590 specimen [
22]. The BCC phase consists of Al = 1.04%, Cr = 84.44%, Fe = 7.23%, Co = 4.39% and Ni = 2.9% in weight percentage. SADP shown in left bottom of
Figure 5e proves that the BCC phase has a BCC structure which is consistently indicted as the {110}bcc ZA. In contrast, the (Cr-Fe-Co)-rich σ phase is composed of elements Al = 0.17%, Cr = 51.51%, Fe = 20.65%, Co = 22.47% and Ni = 5.19% in weight percentage. The σ phase is a tetragonal structure, which is speculated by the bright field transmission electron microscope image with the corresponding {001} ZA diffraction pattern, as shown in
Figure 5f.
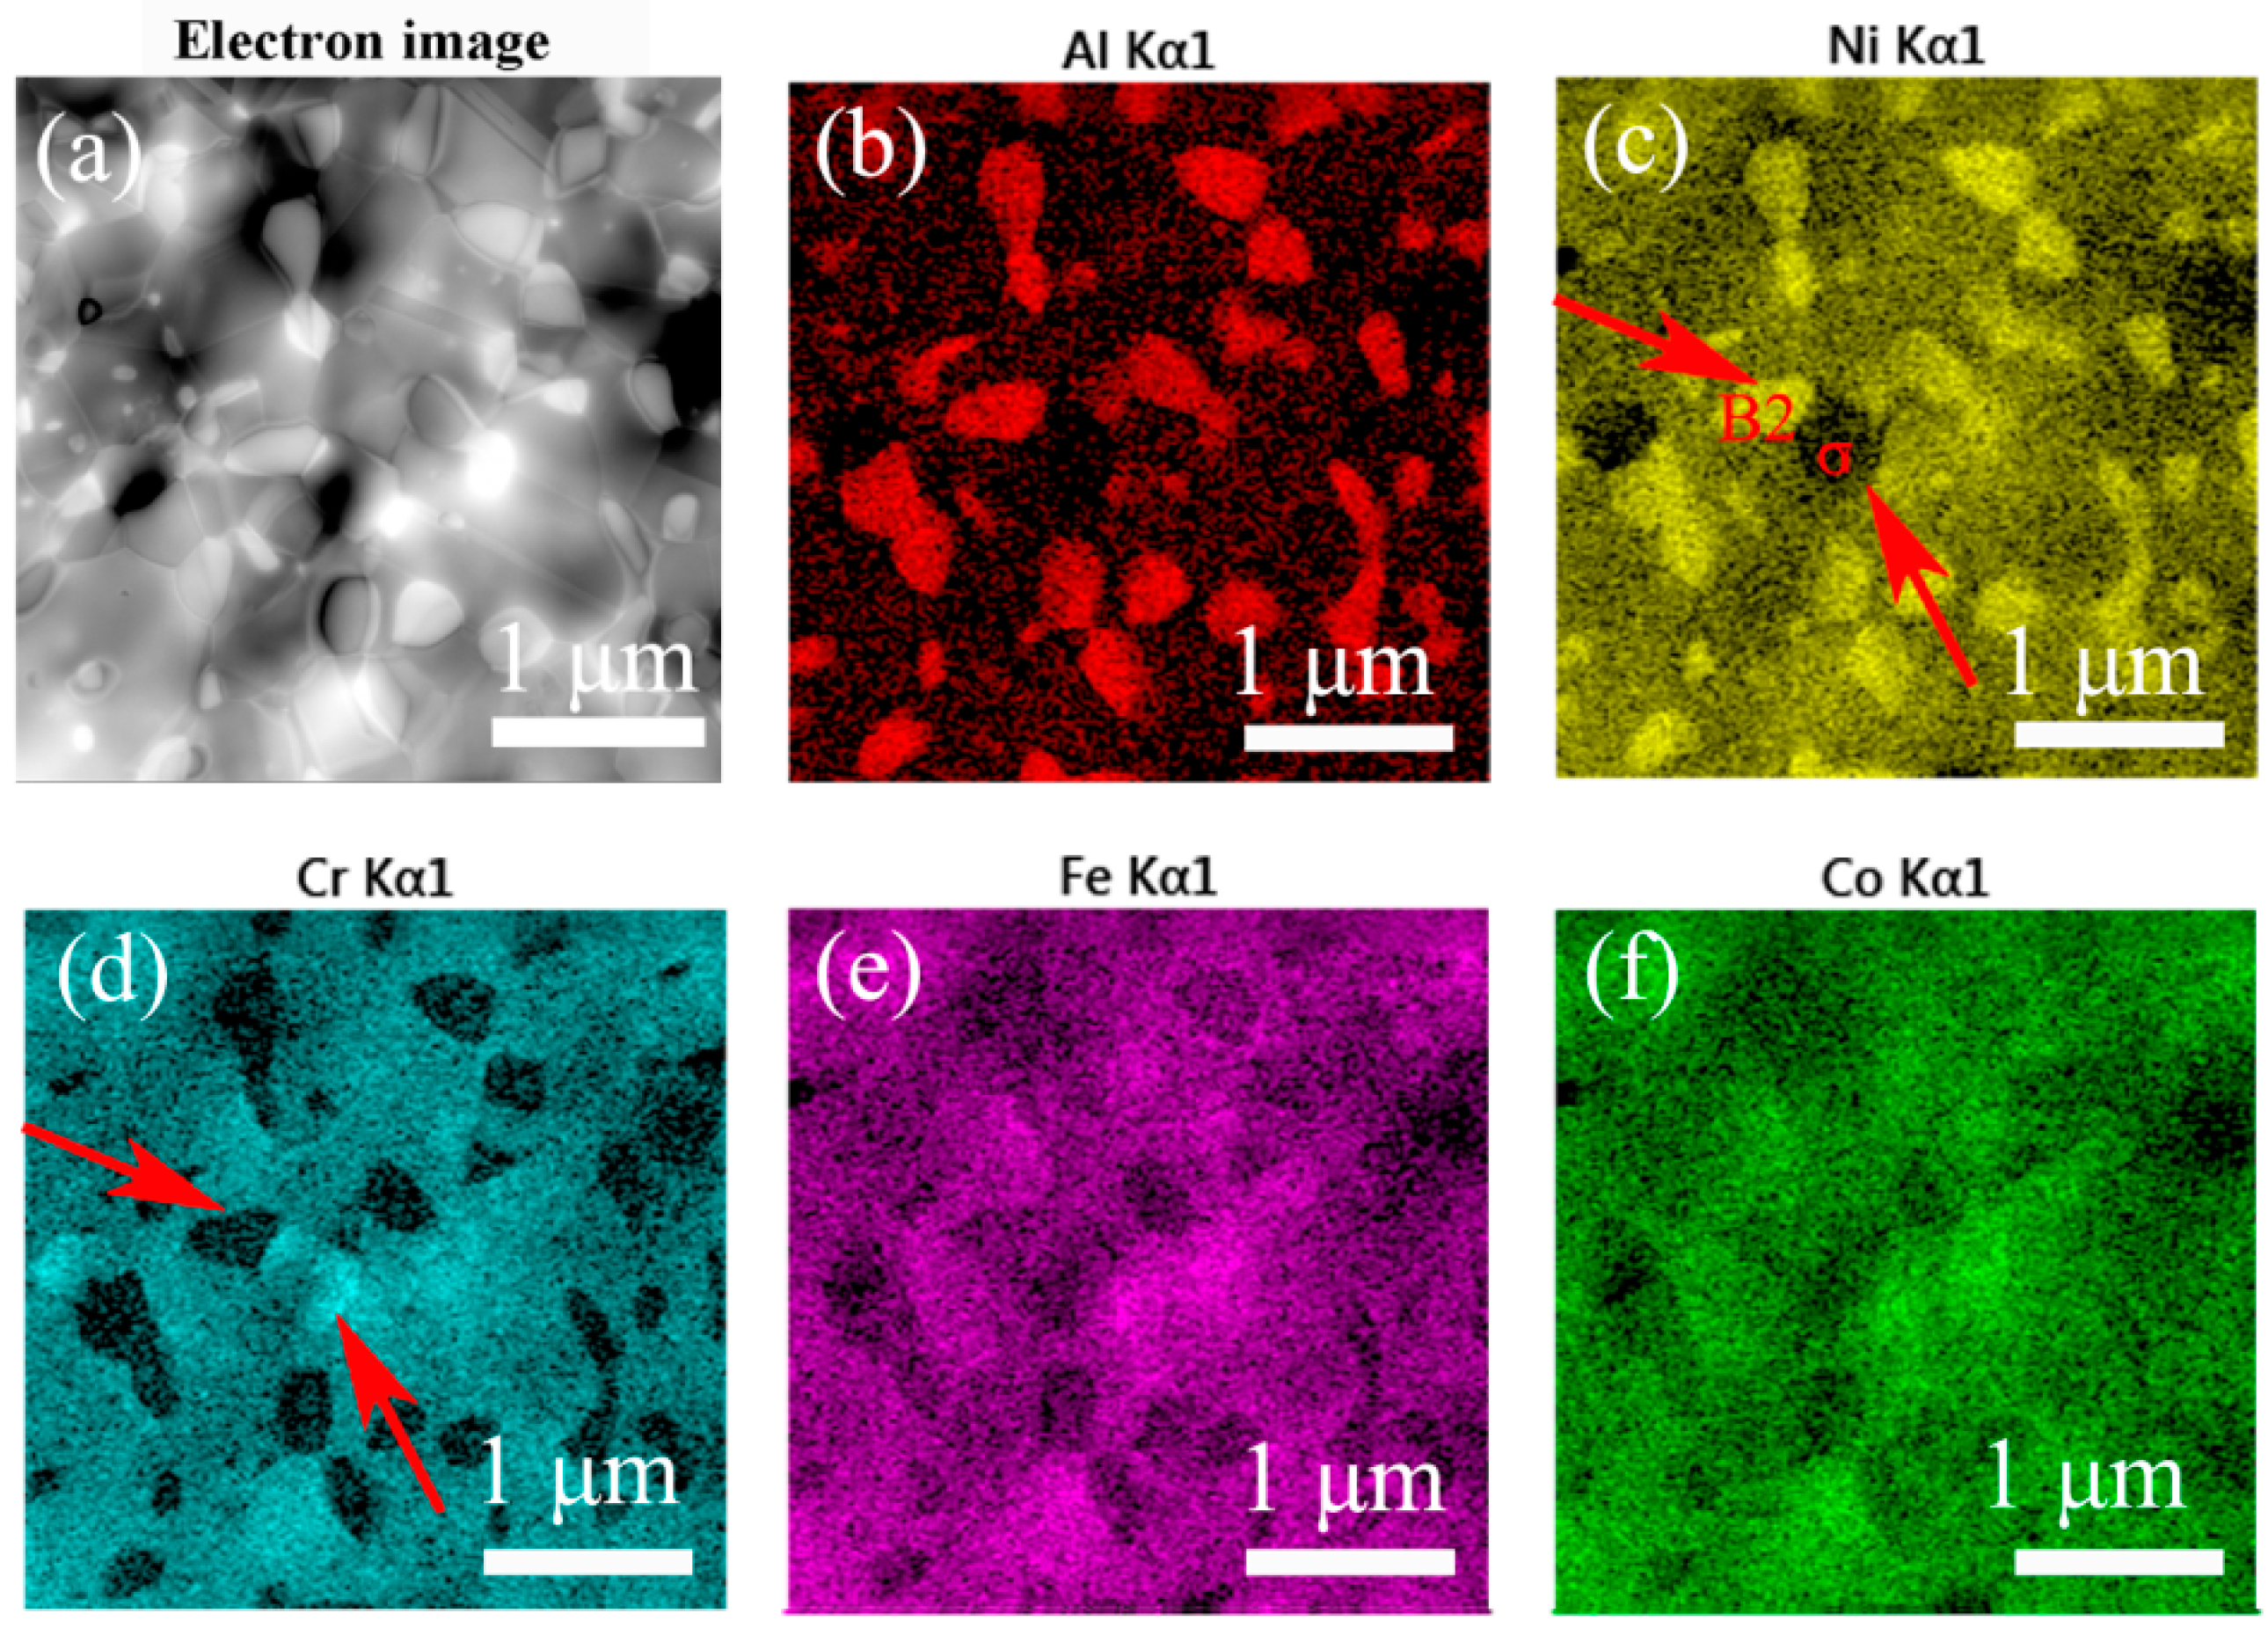
Figure 6 shows the STEM images and elemental energy spectra of the precipitates in the AR800 sample. Accompanied by the increase in annealing temperature, the size of the B2 precipitates in the AR800 sample is slightly larger than in the AR590 sample, as shown in
Figure 5c and
Figure 6b. With increasing annealing temperature, BCC phases disappear and the number of σ phases decreases. Furthermore, part of the (Al-Ni)-rich B2 phase and the (Cr-Fe-Co)-rich σ phase are attached to each other to nucleate, as indicated by the red arrow in
Figure 6c,d. It is able to account for the formation of the two precipitates from the element diffusion perspective. Previous studies have shown that the enriched elements of the B2 phase and the σ phase particles are opposite, making the two phases mutually promote precipitation and growth [
20].
Based on the above analysis, it can be seen that in the annealing temperature range of 590 °C to 800 °C, the B2 phase is the main precipitate.
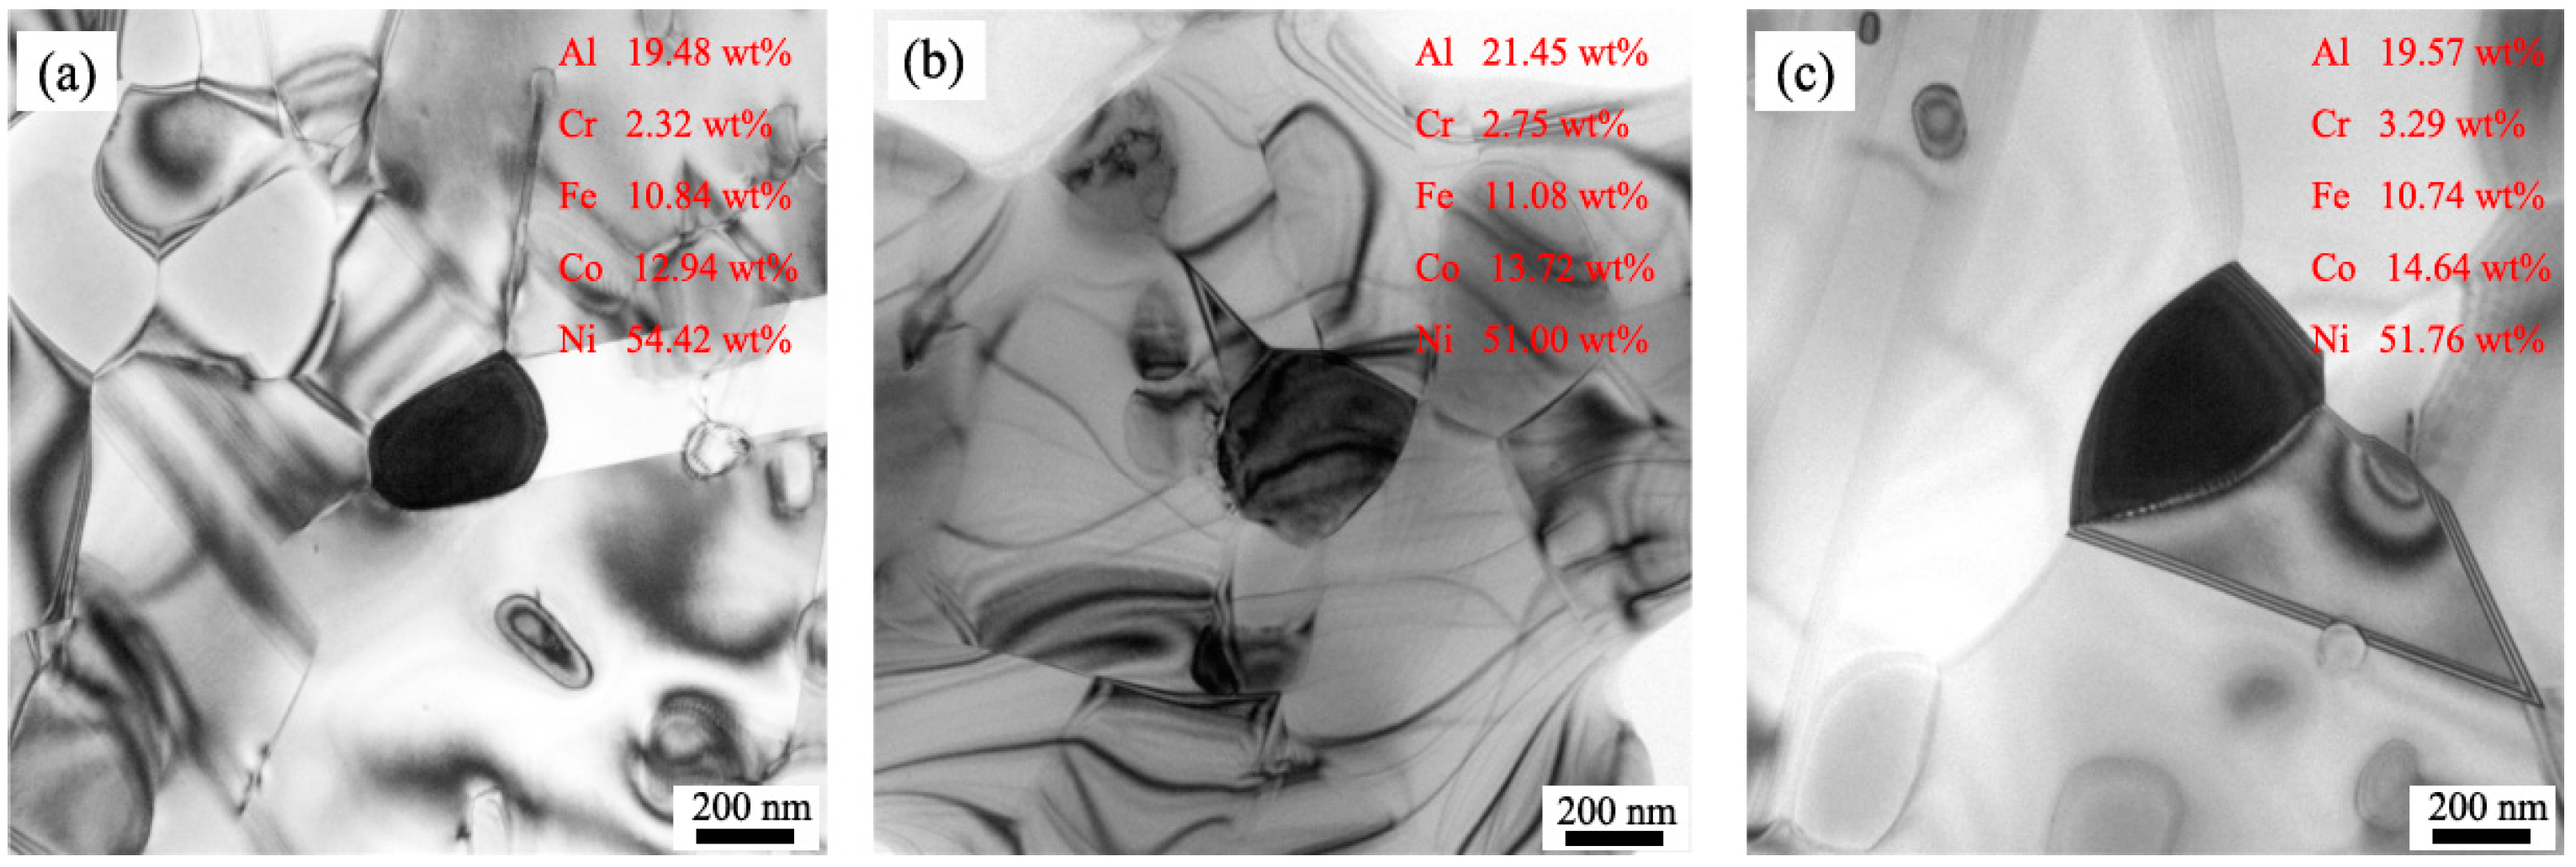
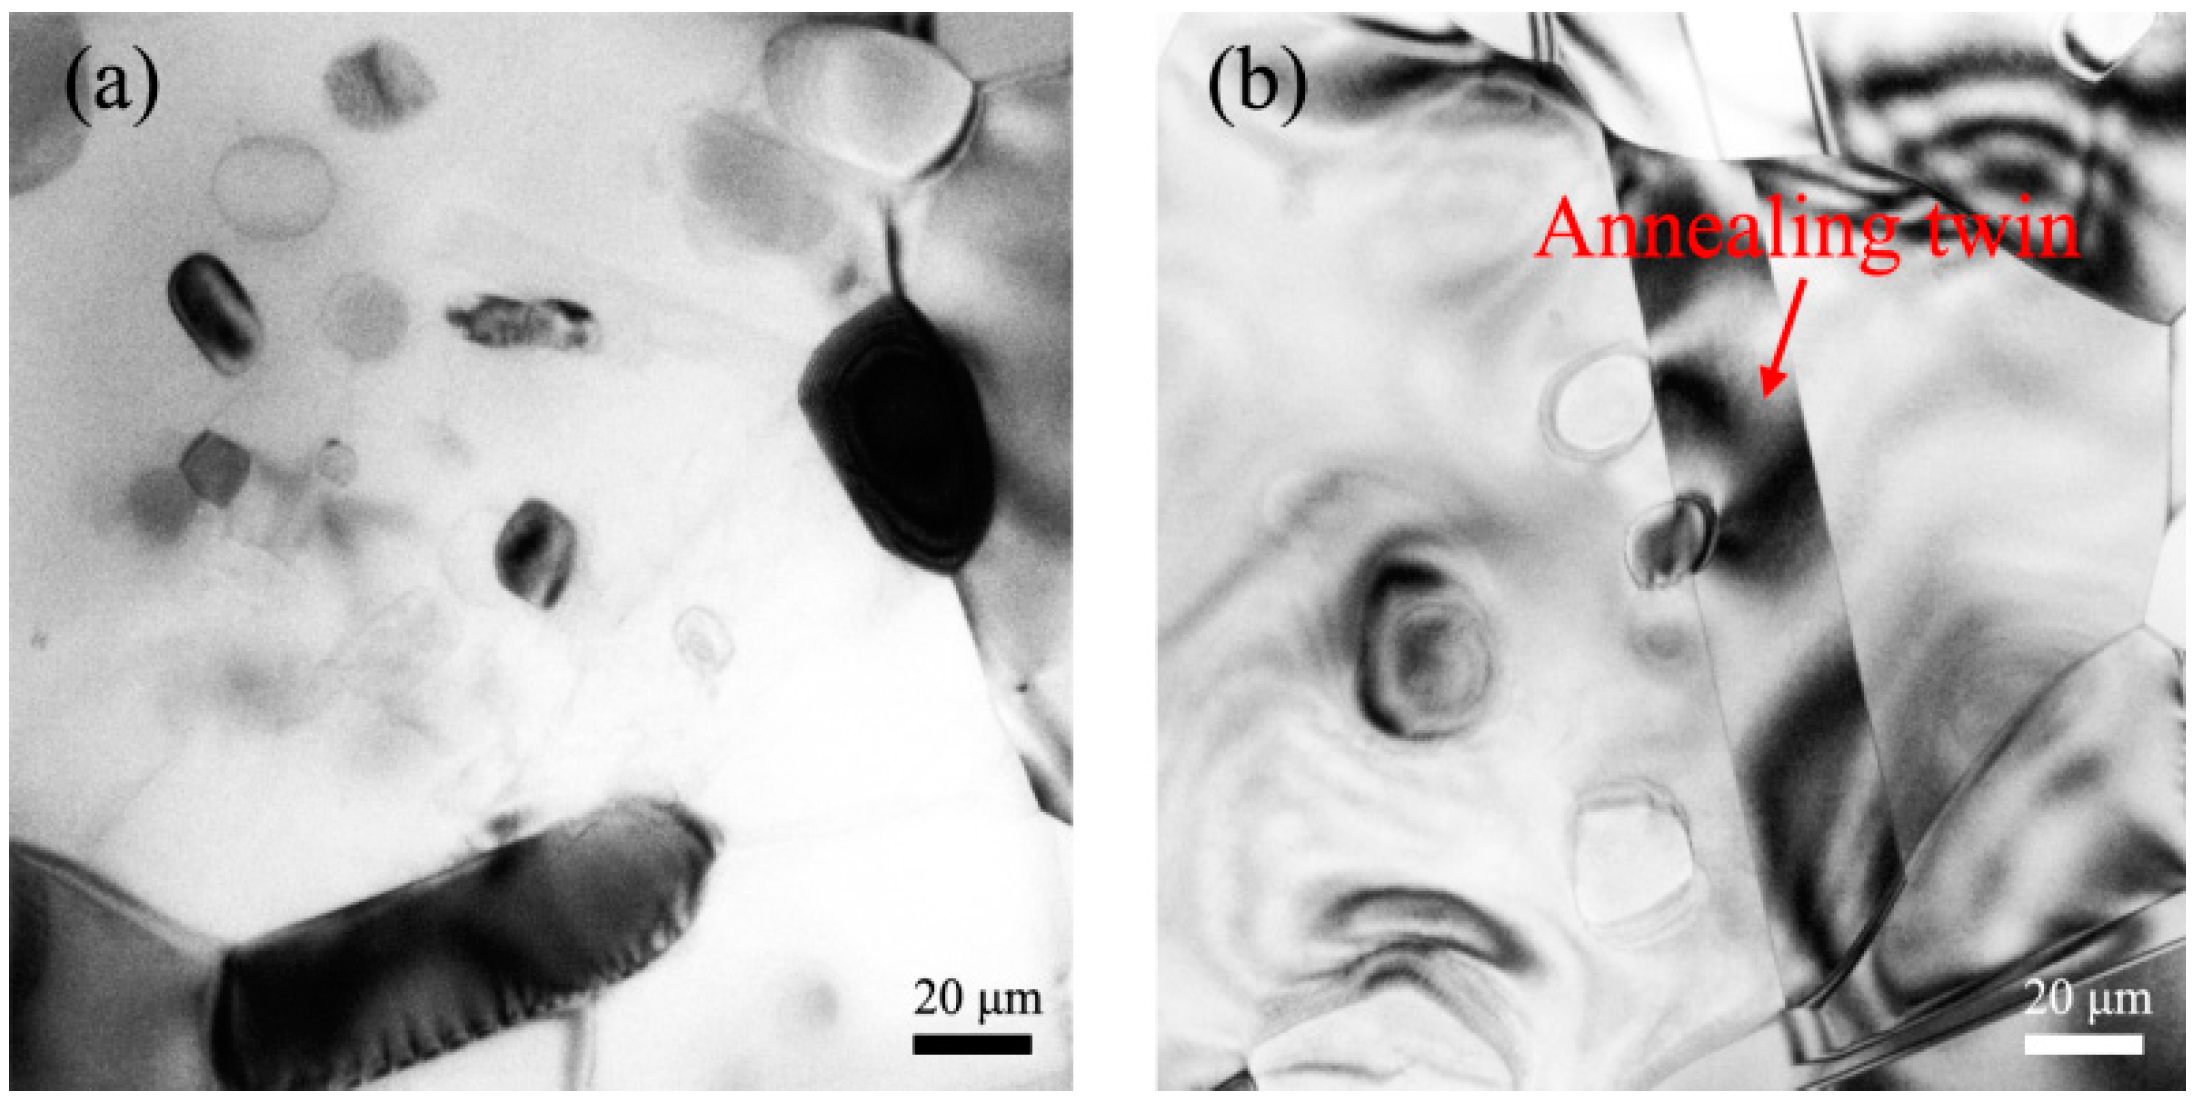
Figure 7 compares the chemical composition of the B2 phase in the samples annealed at various temperatures. It was found that annealing temperature has little influence on the chemical composition of the B2 phases. TEM bright field images of the AR800 sample are used to further reveal the nucleation and distribution of B2 precipitates, as shown in
Figure 8. The coarse B2 phases are favorably precipitated at the grain boundaries. Moreover, fine B2 phases are also precipitated within recrystallized grains and at the annealing twin boundaries. This is consistent with the results in
Figure 4. Moreover,
Figure 6b shows that the content of Al and Ni elements in the B2 phases within grains are lower than in the B2 phases at grain boundaries.
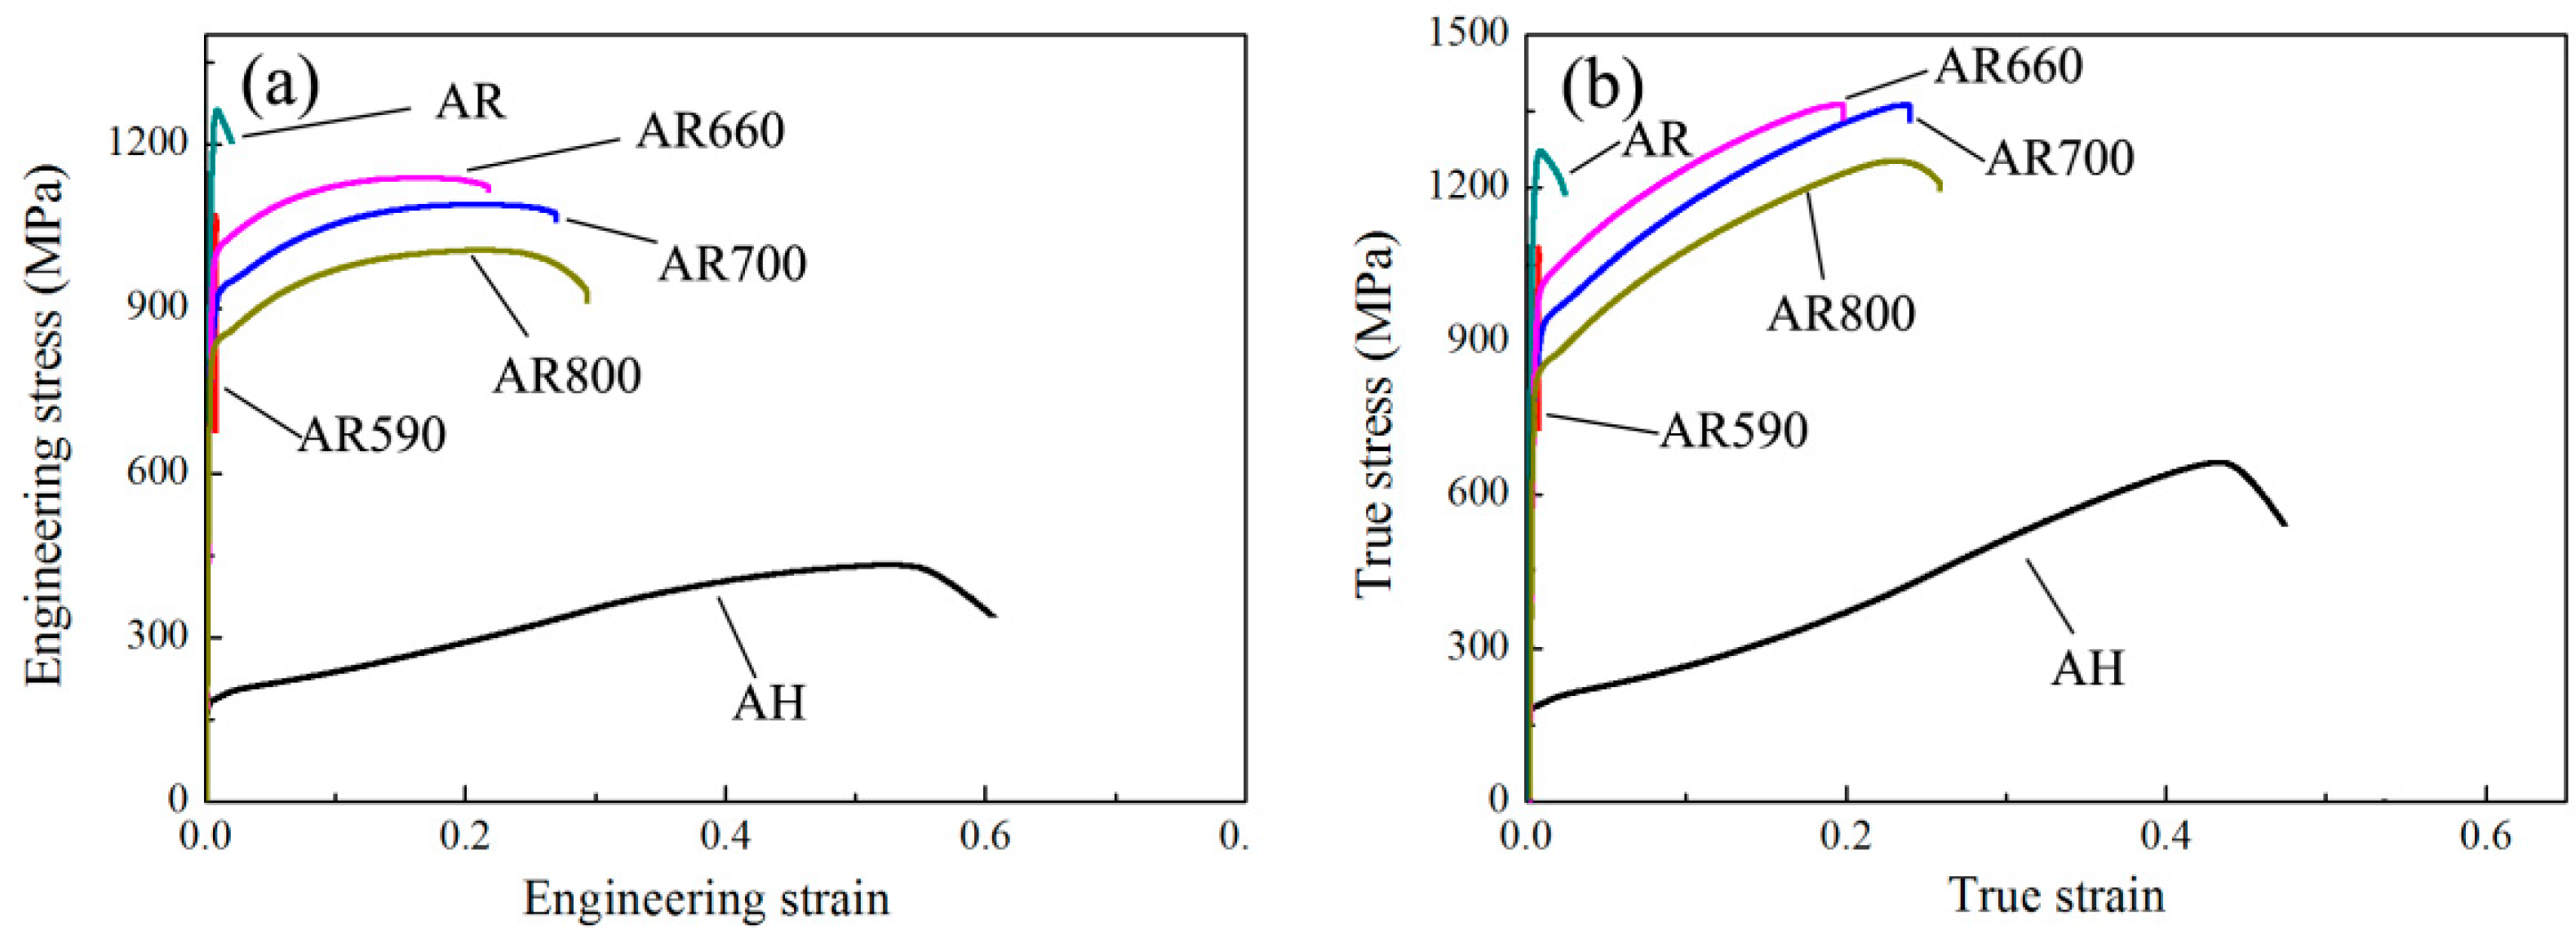
The tensile curves of the various samples are shown in
Figure 9. The mechanical properties are listed in
Table 5. The AH sample with a single FCC phase exhibits very low yield strength (~170 MPa) and large uniform elongation (~43.3%). Moreover, the AH sample exhibits a very low strain hardening rate in the beginning of deformation. This behavior is similar to that of low stacking fault energy alloys (e.g., CoCrFeMnNi HEA, TWIP steel et.) [
30,
31]. Cold-rolling remarkably enhances the yield strength to 1060 MPa. However, the uniform elongation is reduced to 0.4%. The increase in yield strength in the AR sample can be attributed to the high work hardening effect via cold-rolling. The strong barrier effect on the movement of dislocations leads to a very high strain hardening rate, which rapidly increases stress to peak strength of 1273 MPa. Annealing treatment induces the precipitation of second phases. It is considered that the B2 phase within grains can generate an Orowan hardening effect on the yield strength. However, annealing treatment reduces the yield strength of the AR sample. This can be mainly attributed to the softening effect via static recovery and recrystallization. The AR590 sample shows the deformation characteristics of brittle materials with almost no tensile ductility (~0.1%). With increasing annealing temperature to 660 °C, the tensile ductility is increased to 19.4%. Further increasing the annealing temperature can reduce the yield strength, but has a smaller effect on tensile ductility. For the AR800 sample, the work hardening effect via cold-rolling is fully eliminated and the yield strength is reduced to 837 MPa.


 and
and 


