
Transformation of the δ-Ferrite in SS2343 Austenitic Stainless Steel upon Annealing at 1050 °C, 1150 °C and 1250 °C

Abstract
:1. Introduction
2. Materials and Methods
2.1. Sampling
2.2. Annealing
2.3. Metallographic Analyses
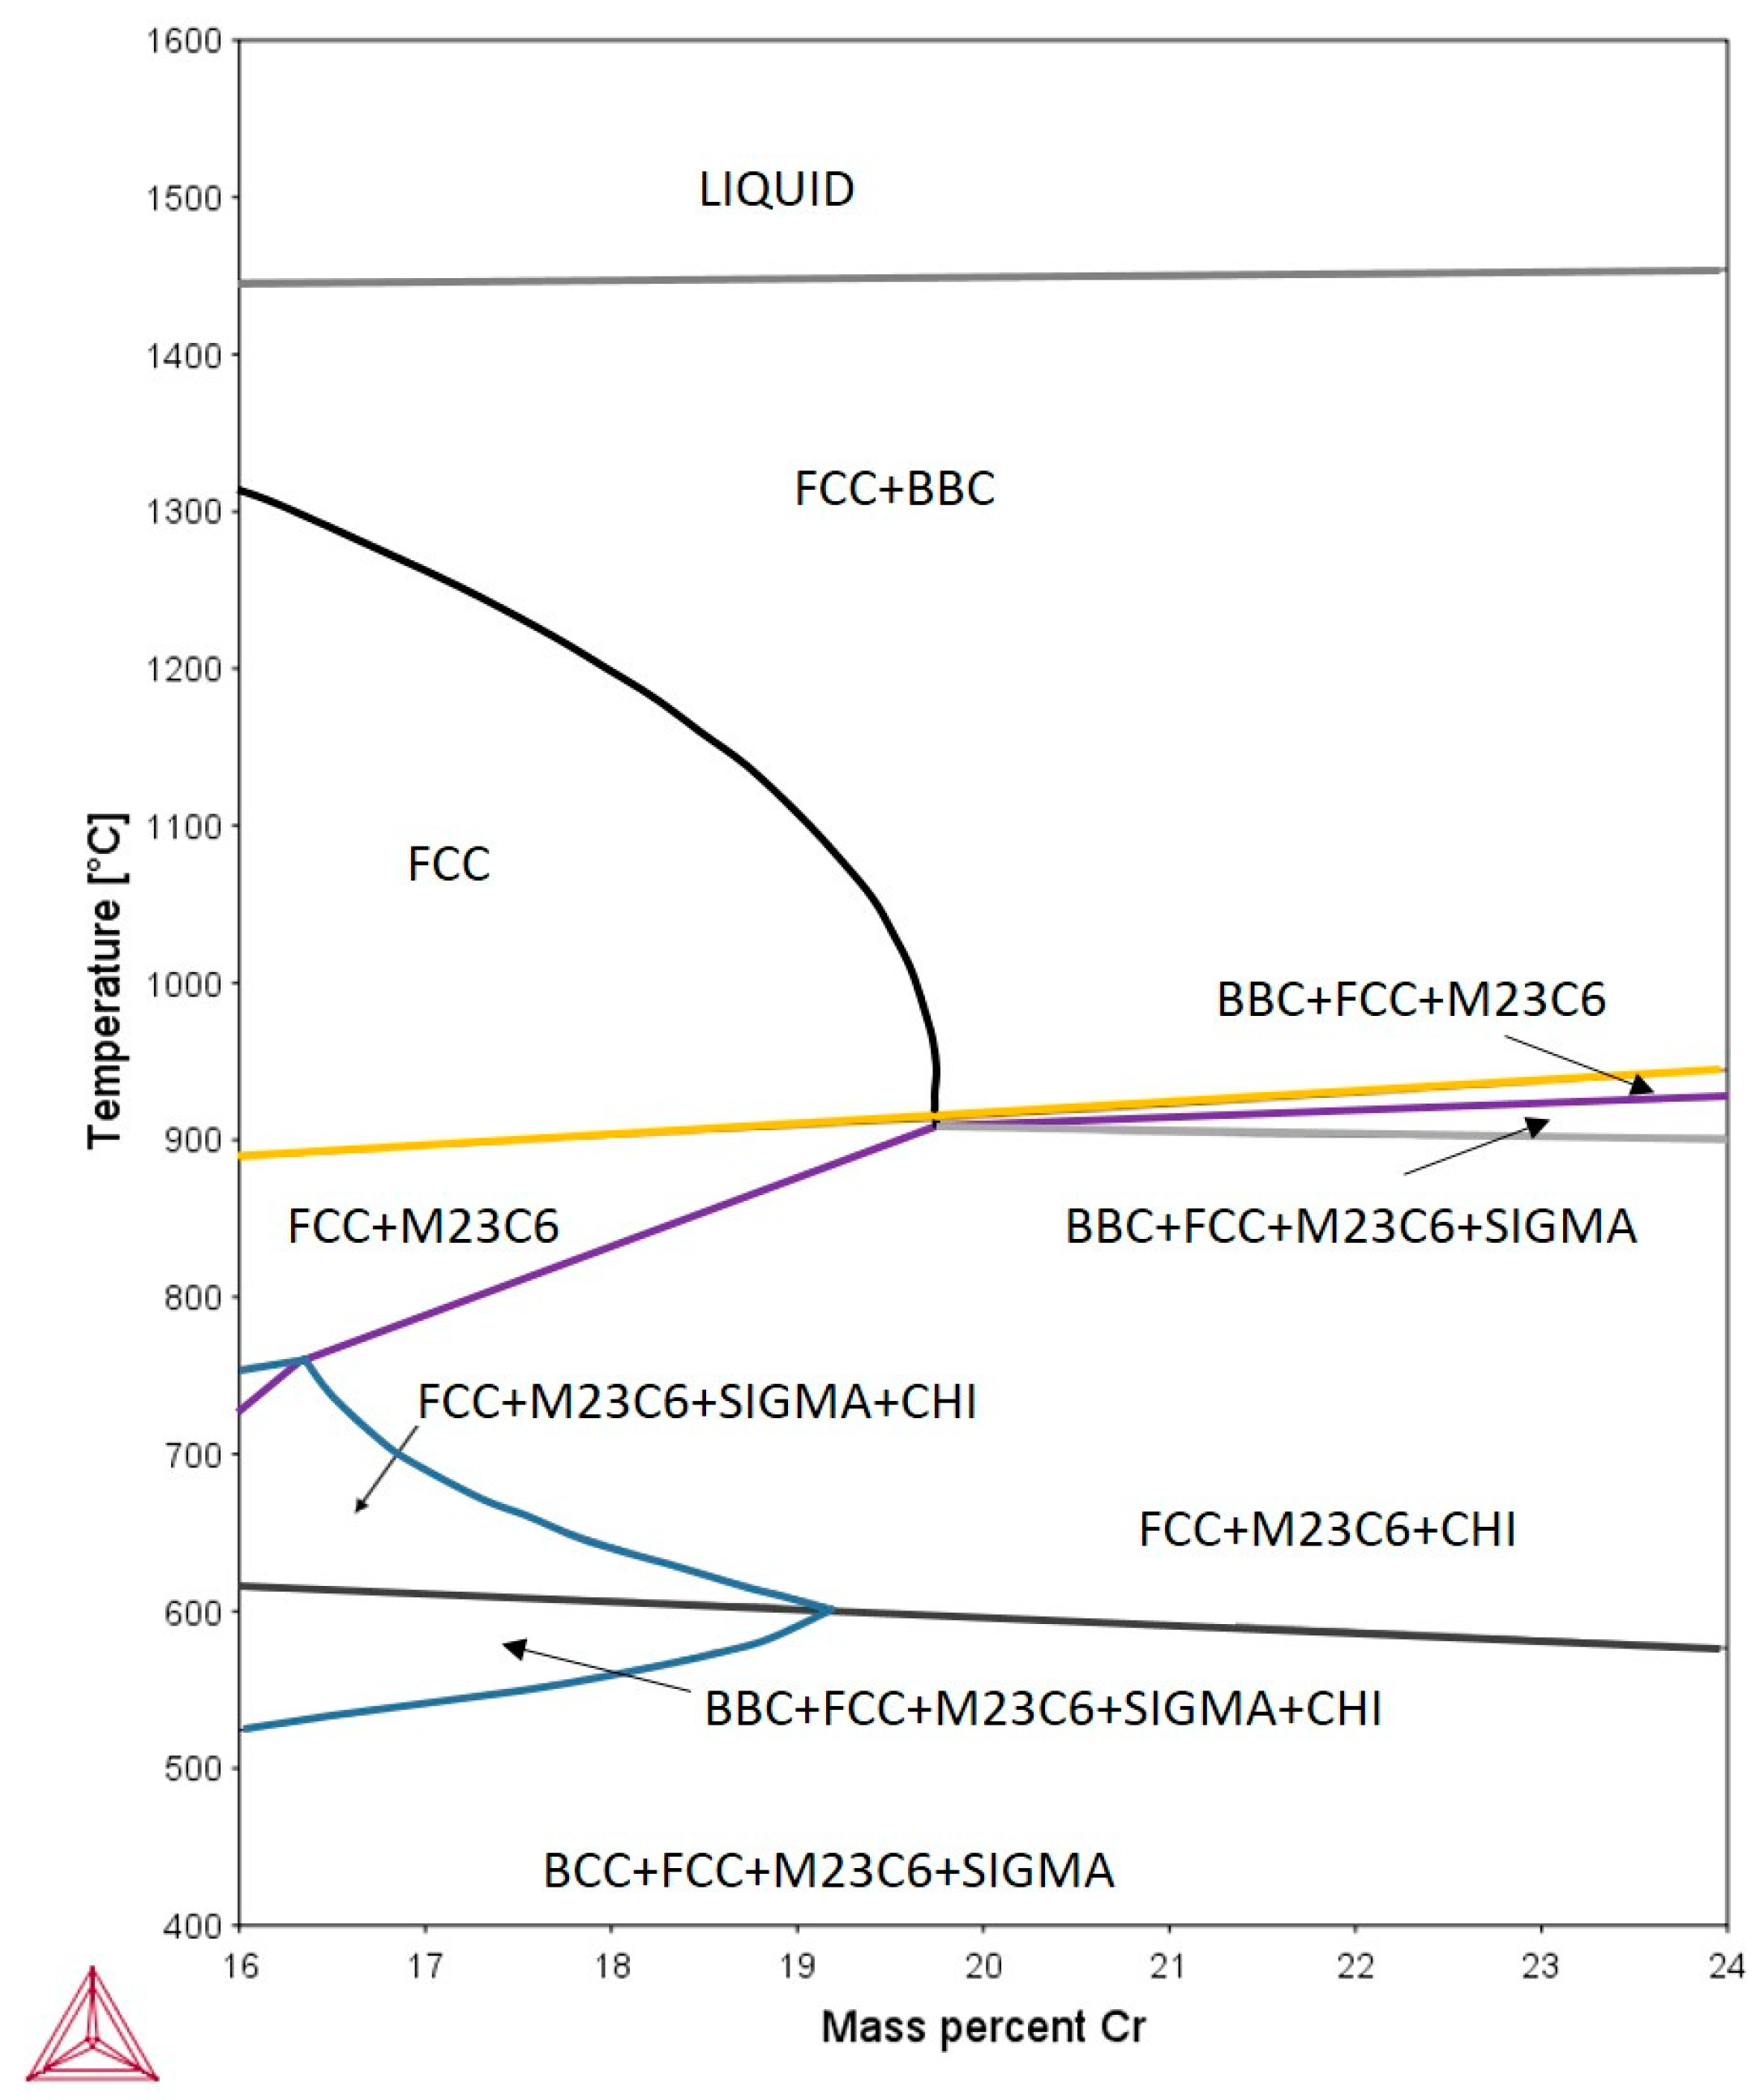
2.4. Thermodynamic Calculations
3. Results and Discussion
4. Conclusions
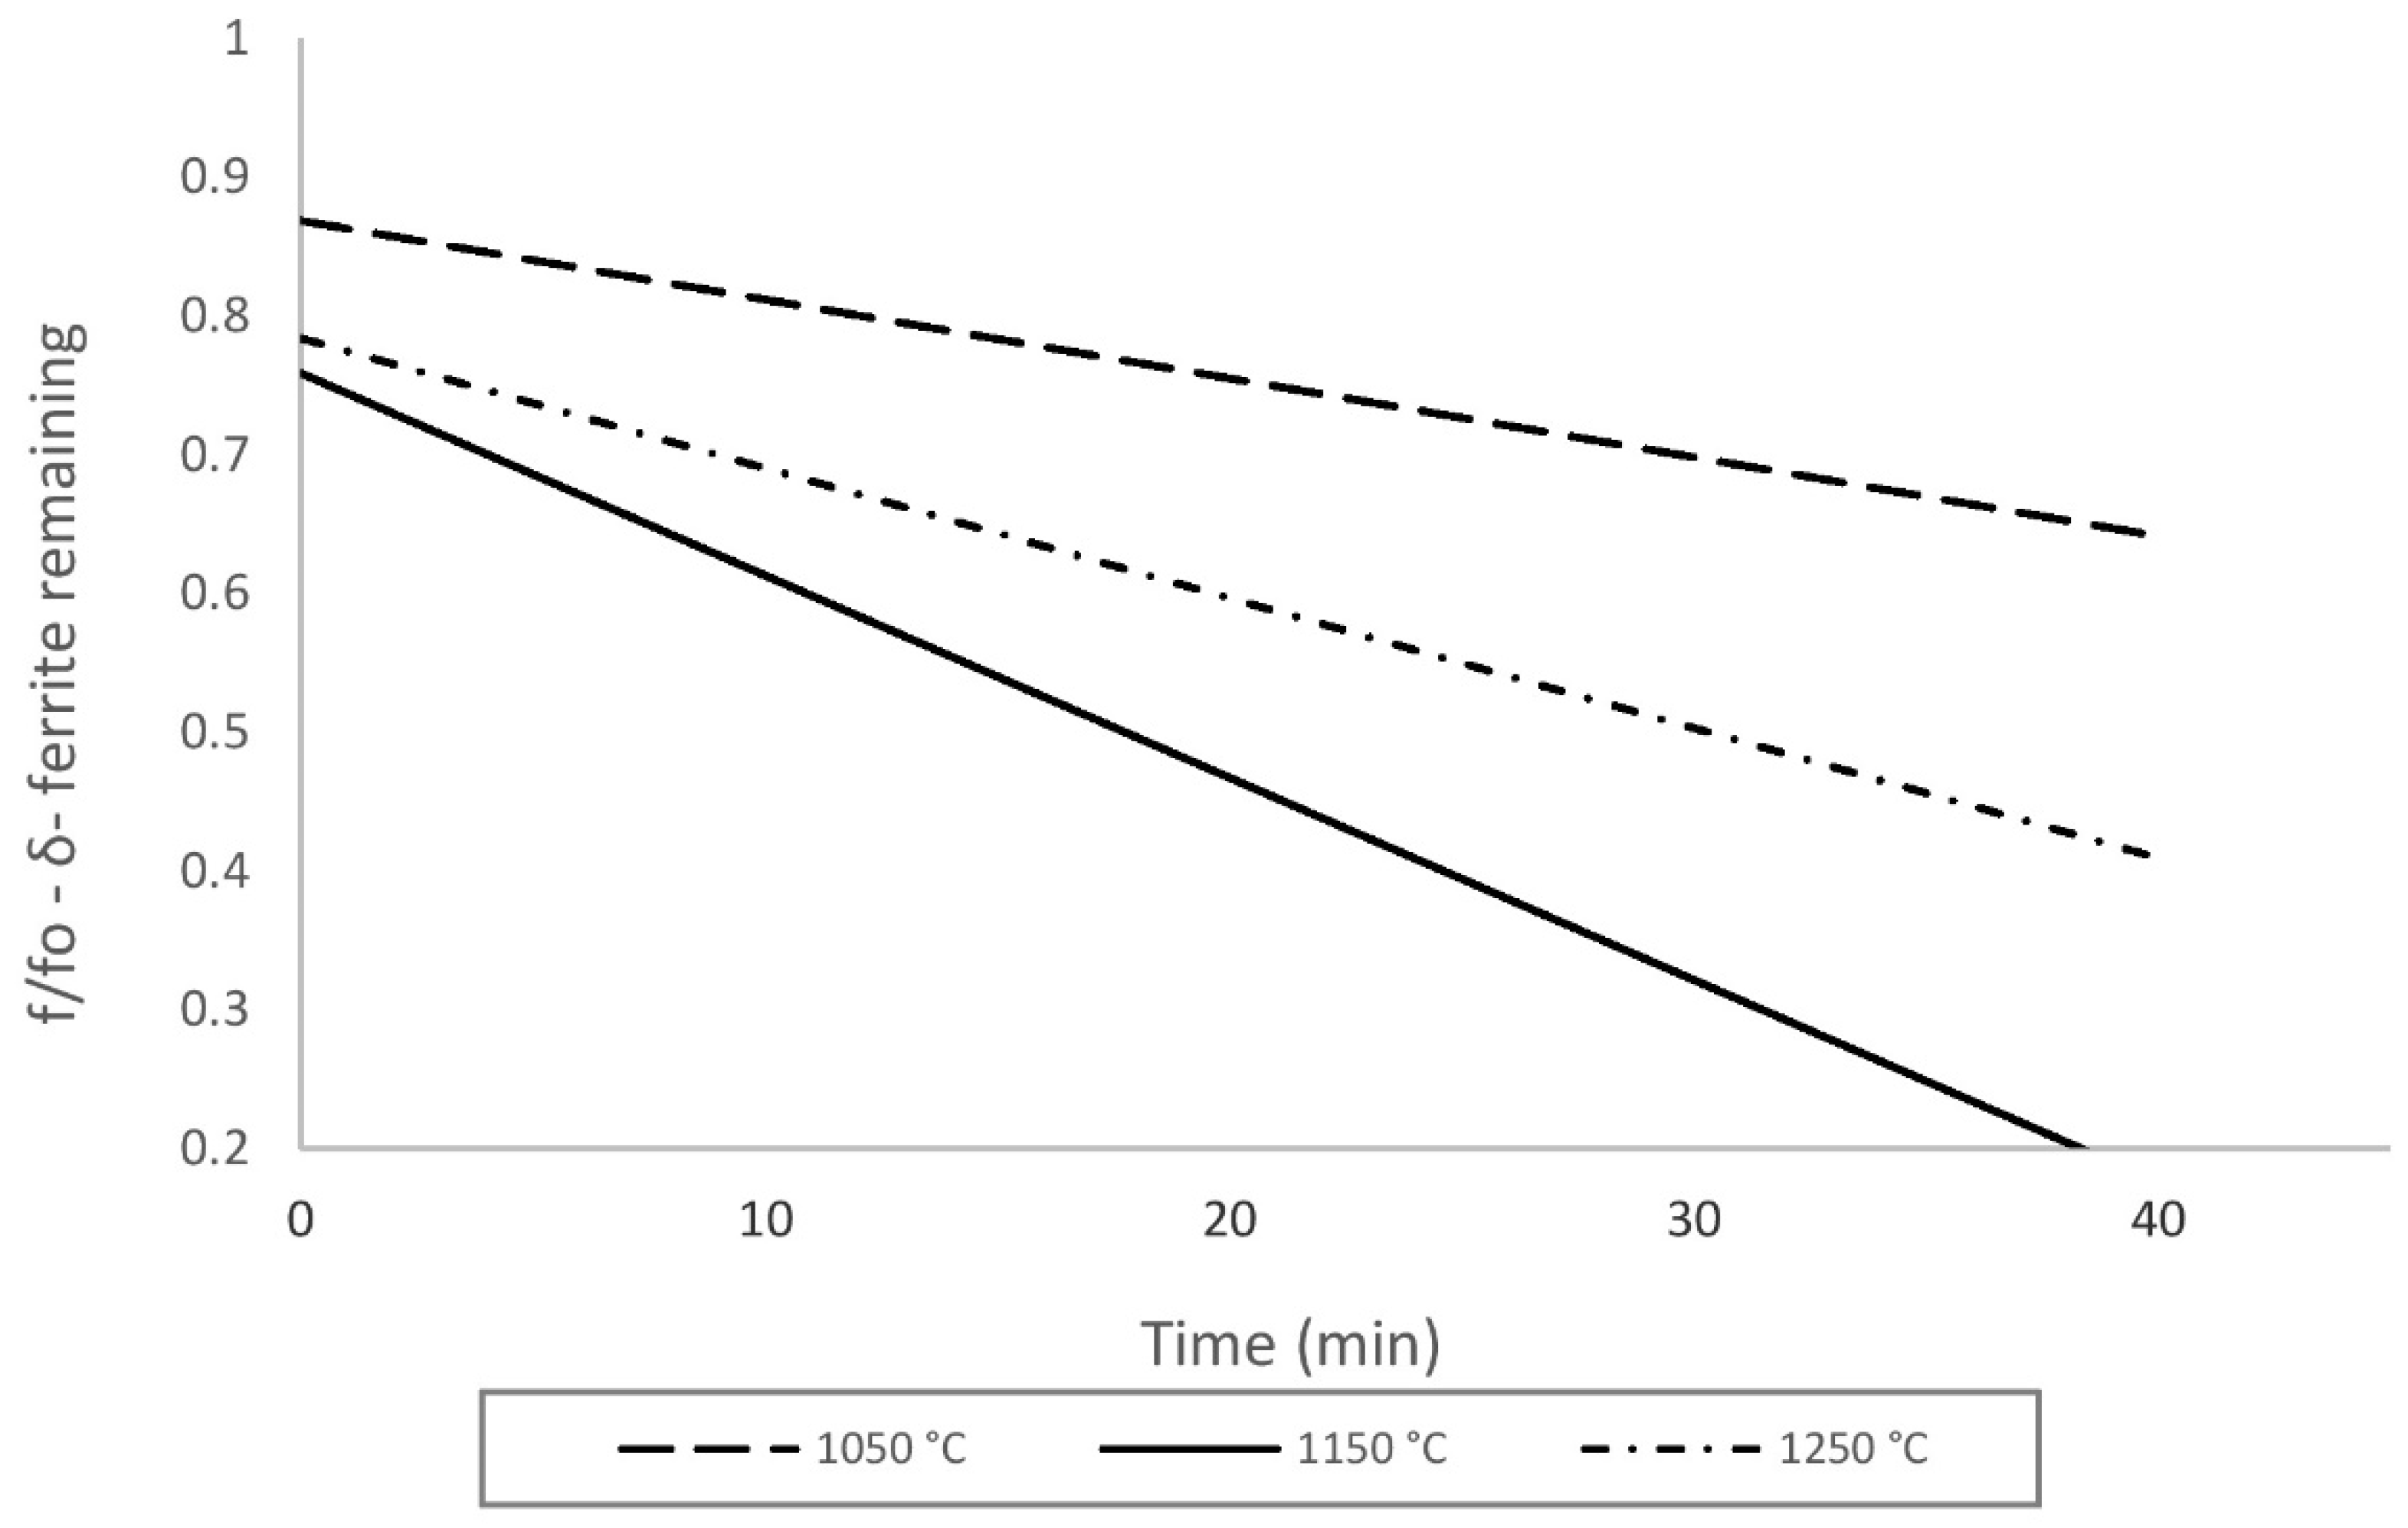
- After annealing at 1150 °C at 5 and 40 min, the content of δ-ferrite was reduced to 5.0 and 2.64 vol.%, respectively. Thus, about 60% or 80% the δ-ferrite is transformed by annealing.
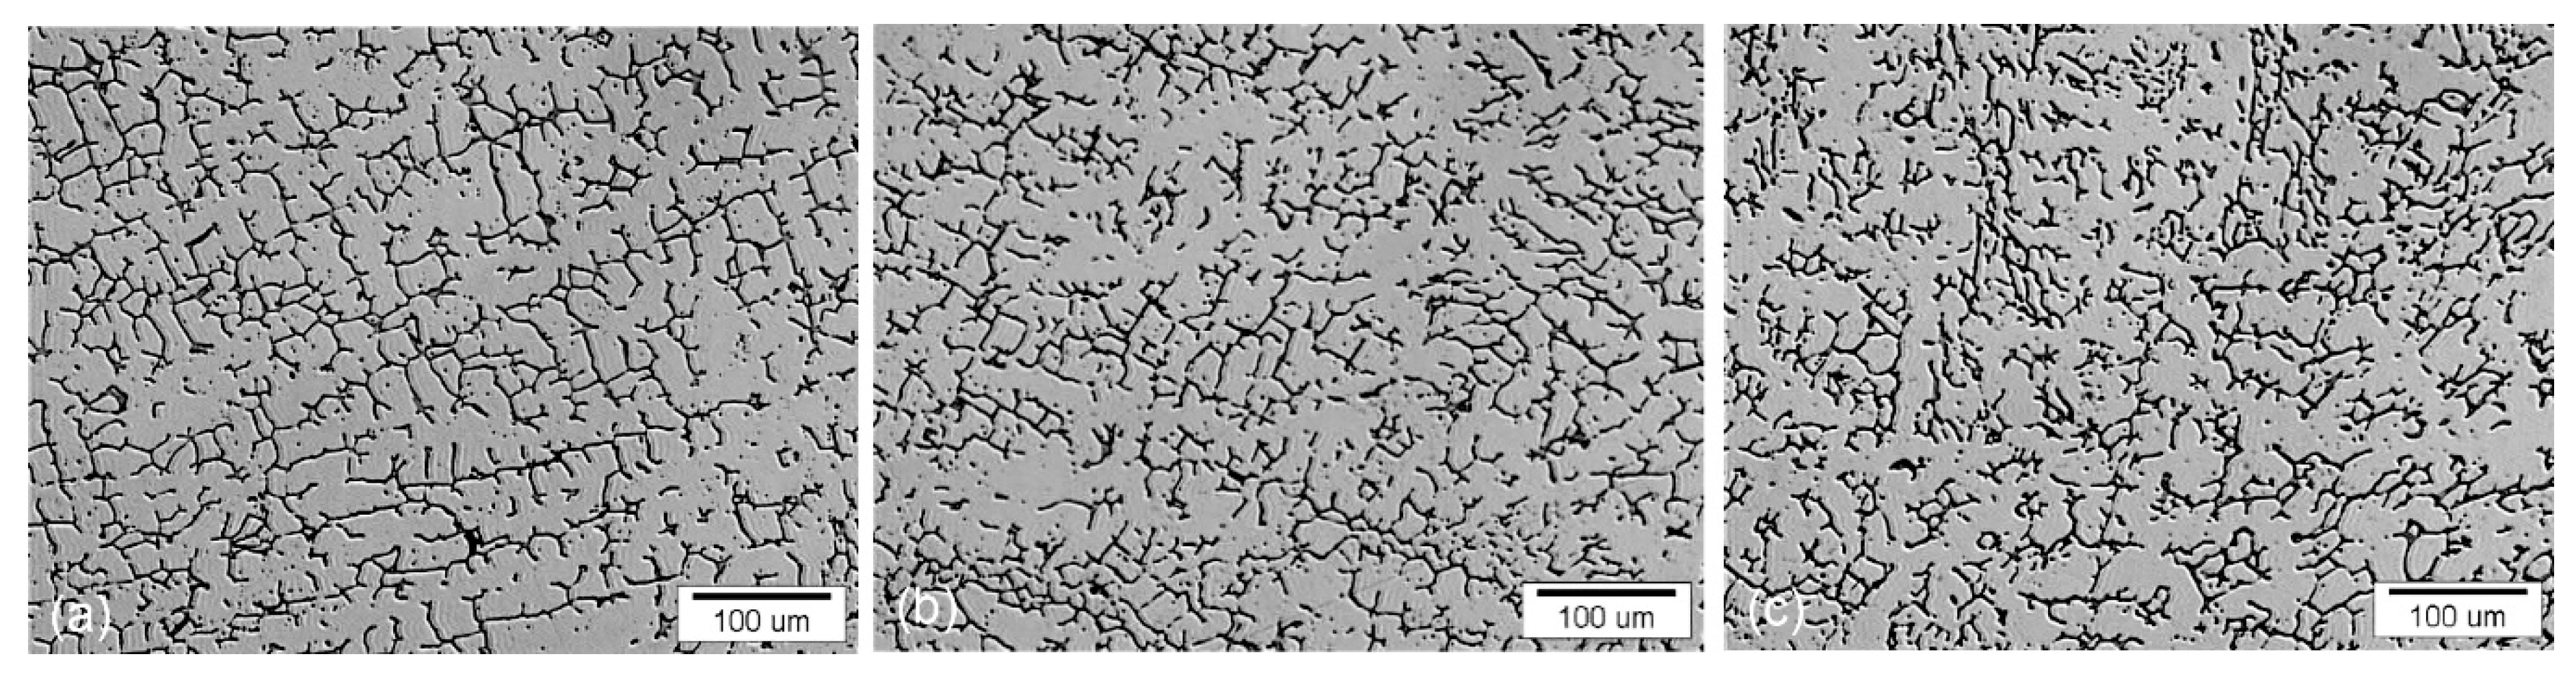
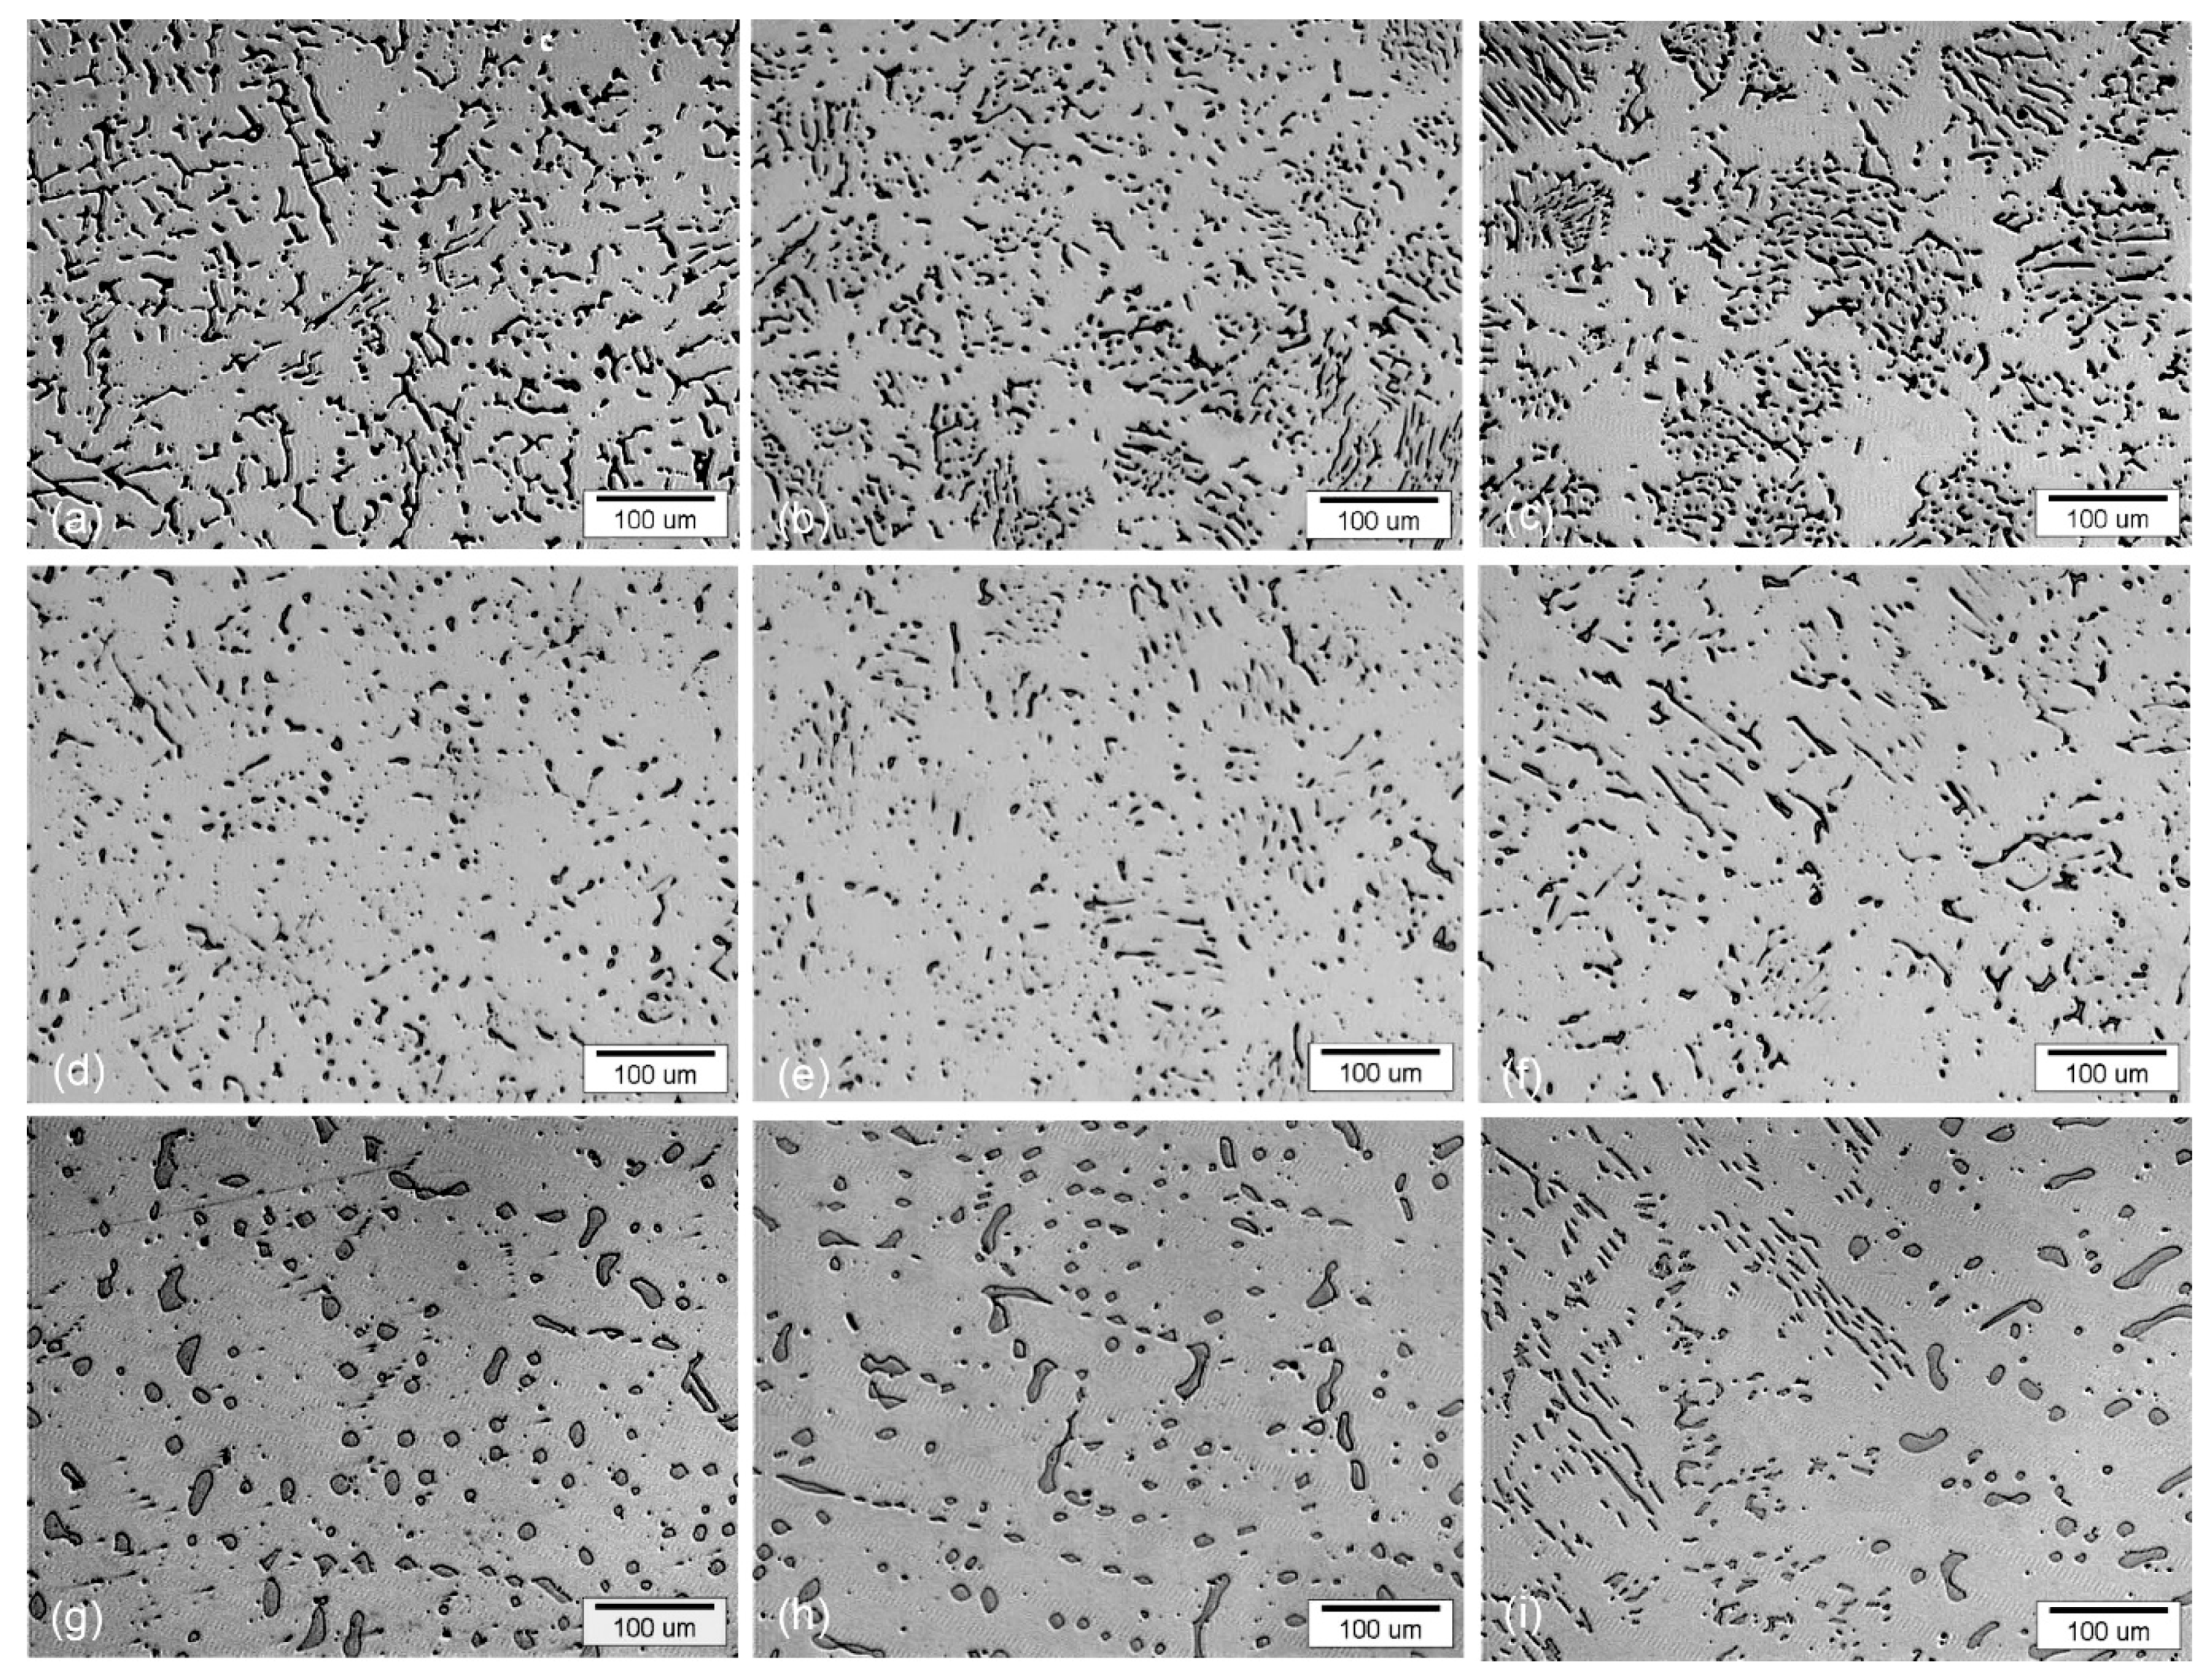
- After annealing at 1150 °C, the δ-ferrite dissolution and transformation process initiates in secondary arms and progresses also in primary arms, where dendritic network of δ-ferrite tends to break down and spheroidize.
- After annealing at 1250 °C, the dissolution of δ-ferrite was only ~50%. Morphologically is remaining δ-ferrite mostly spherical.
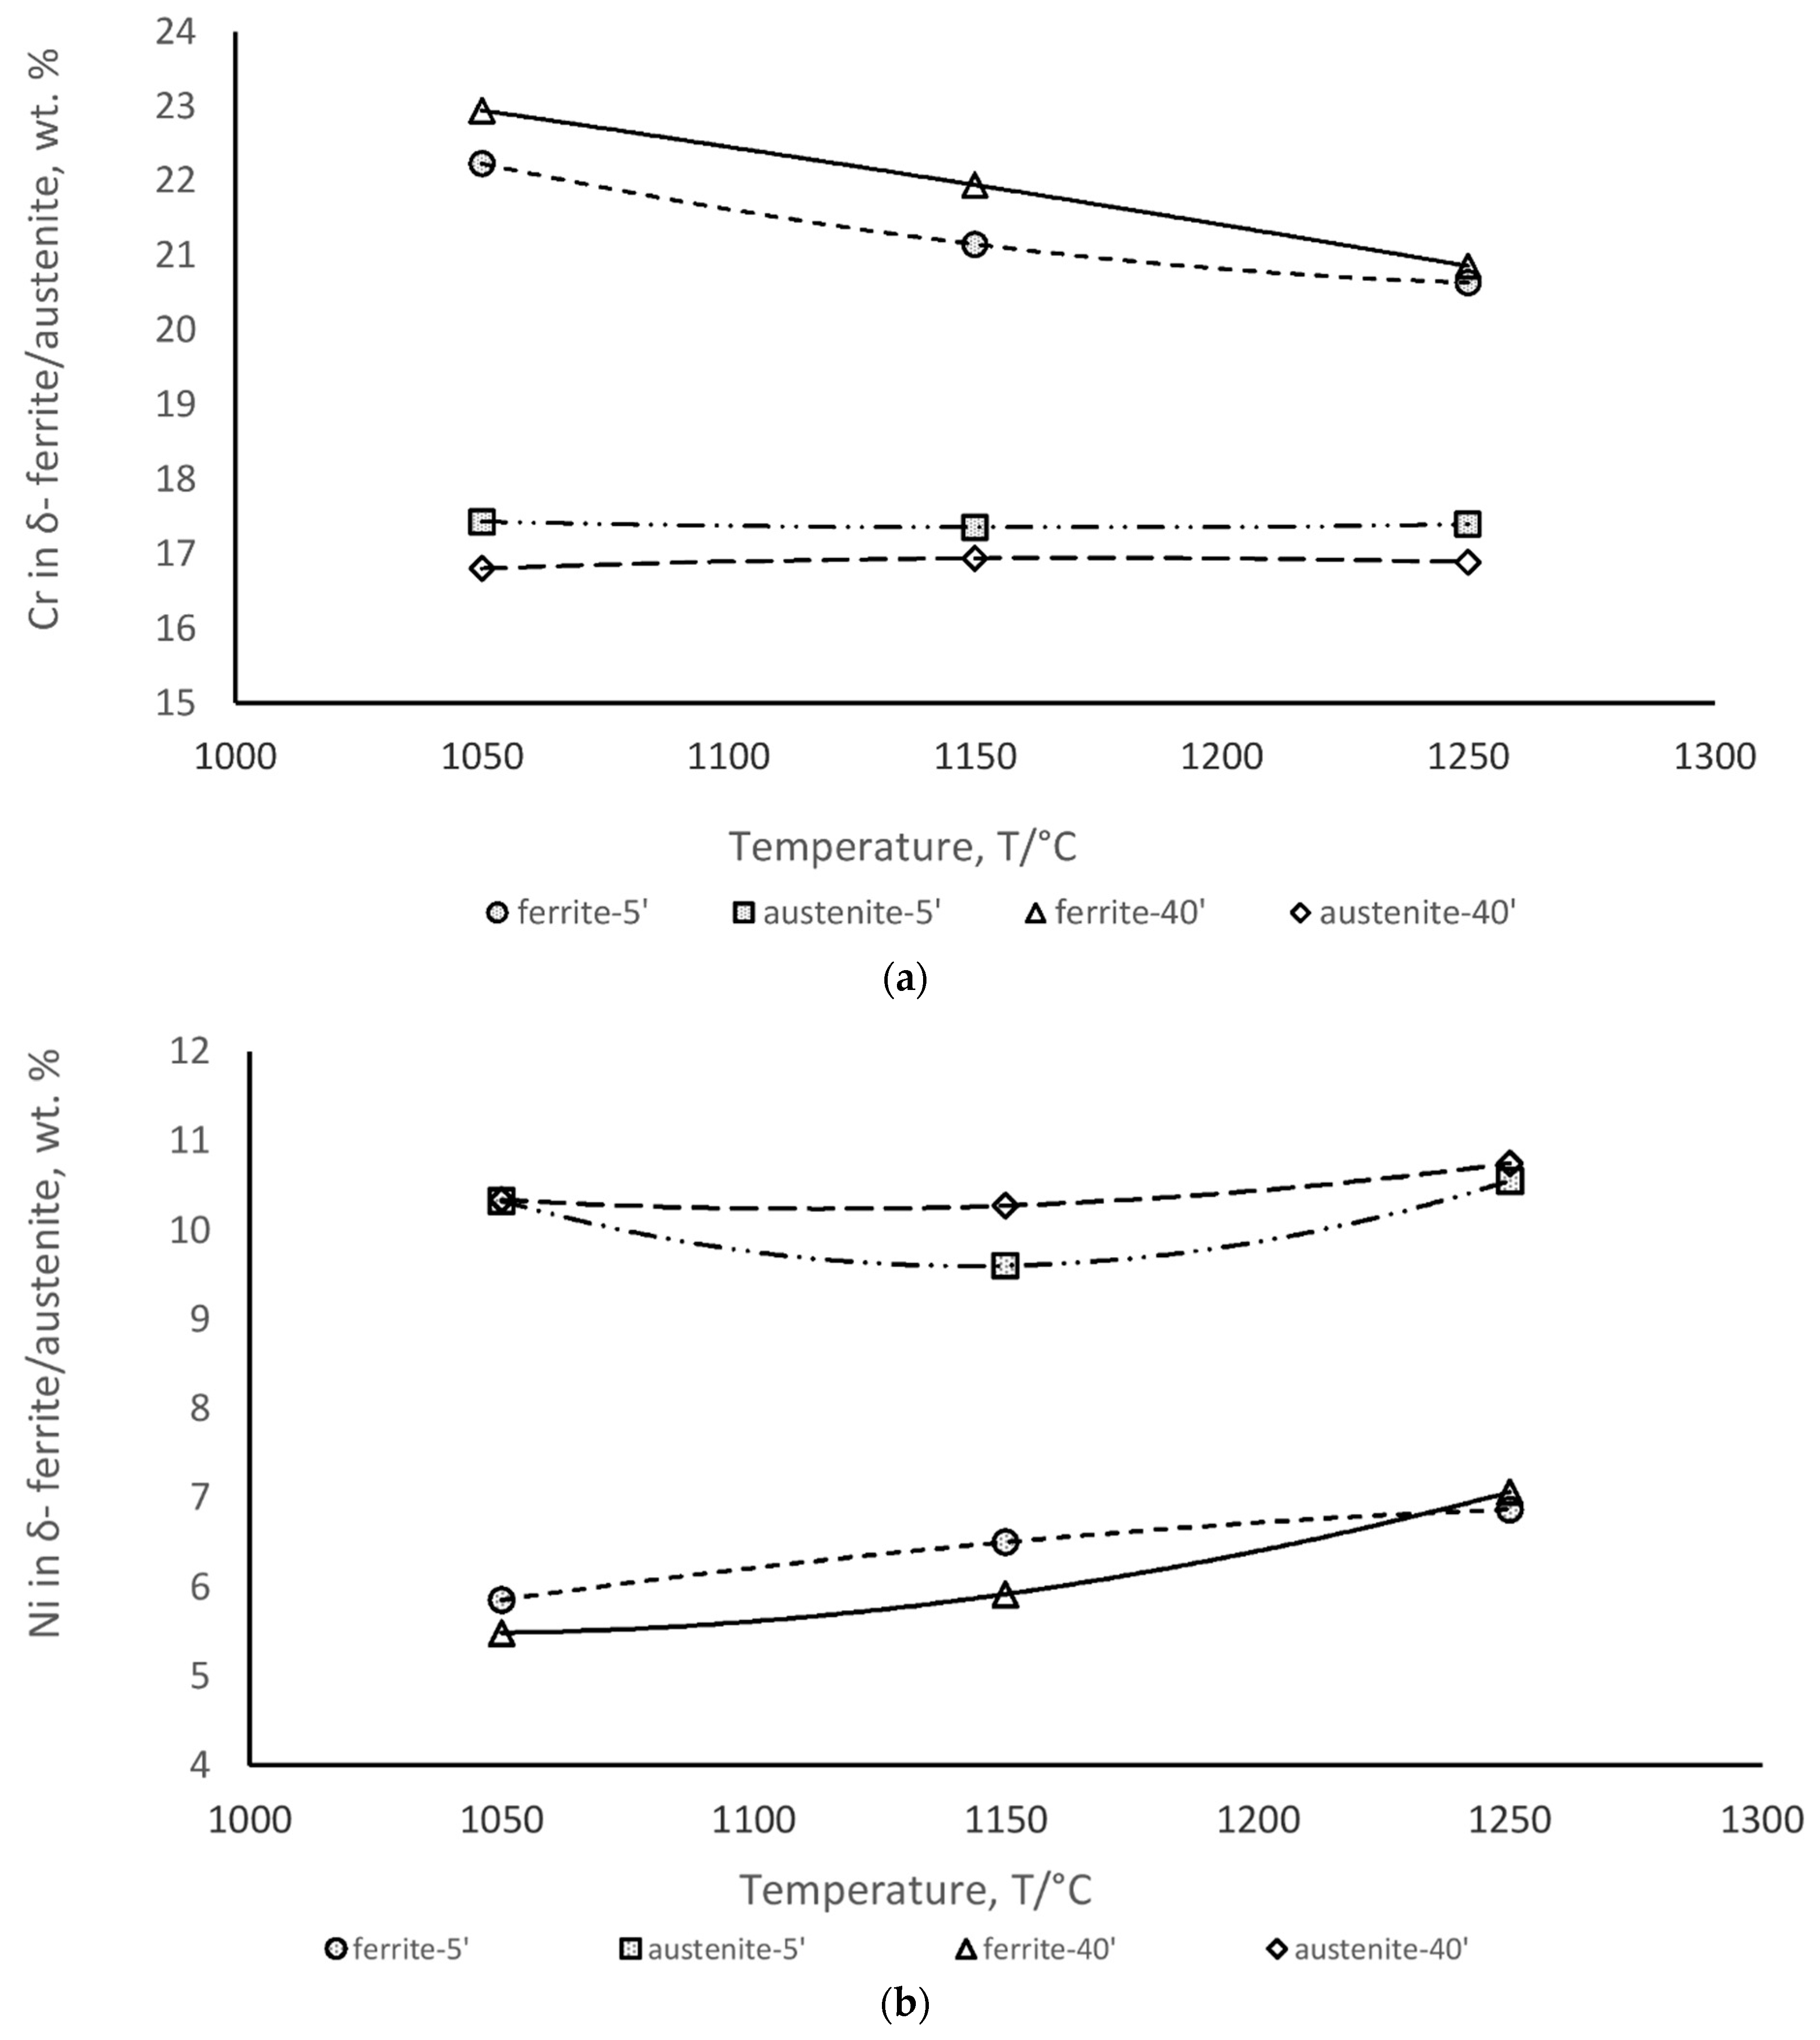
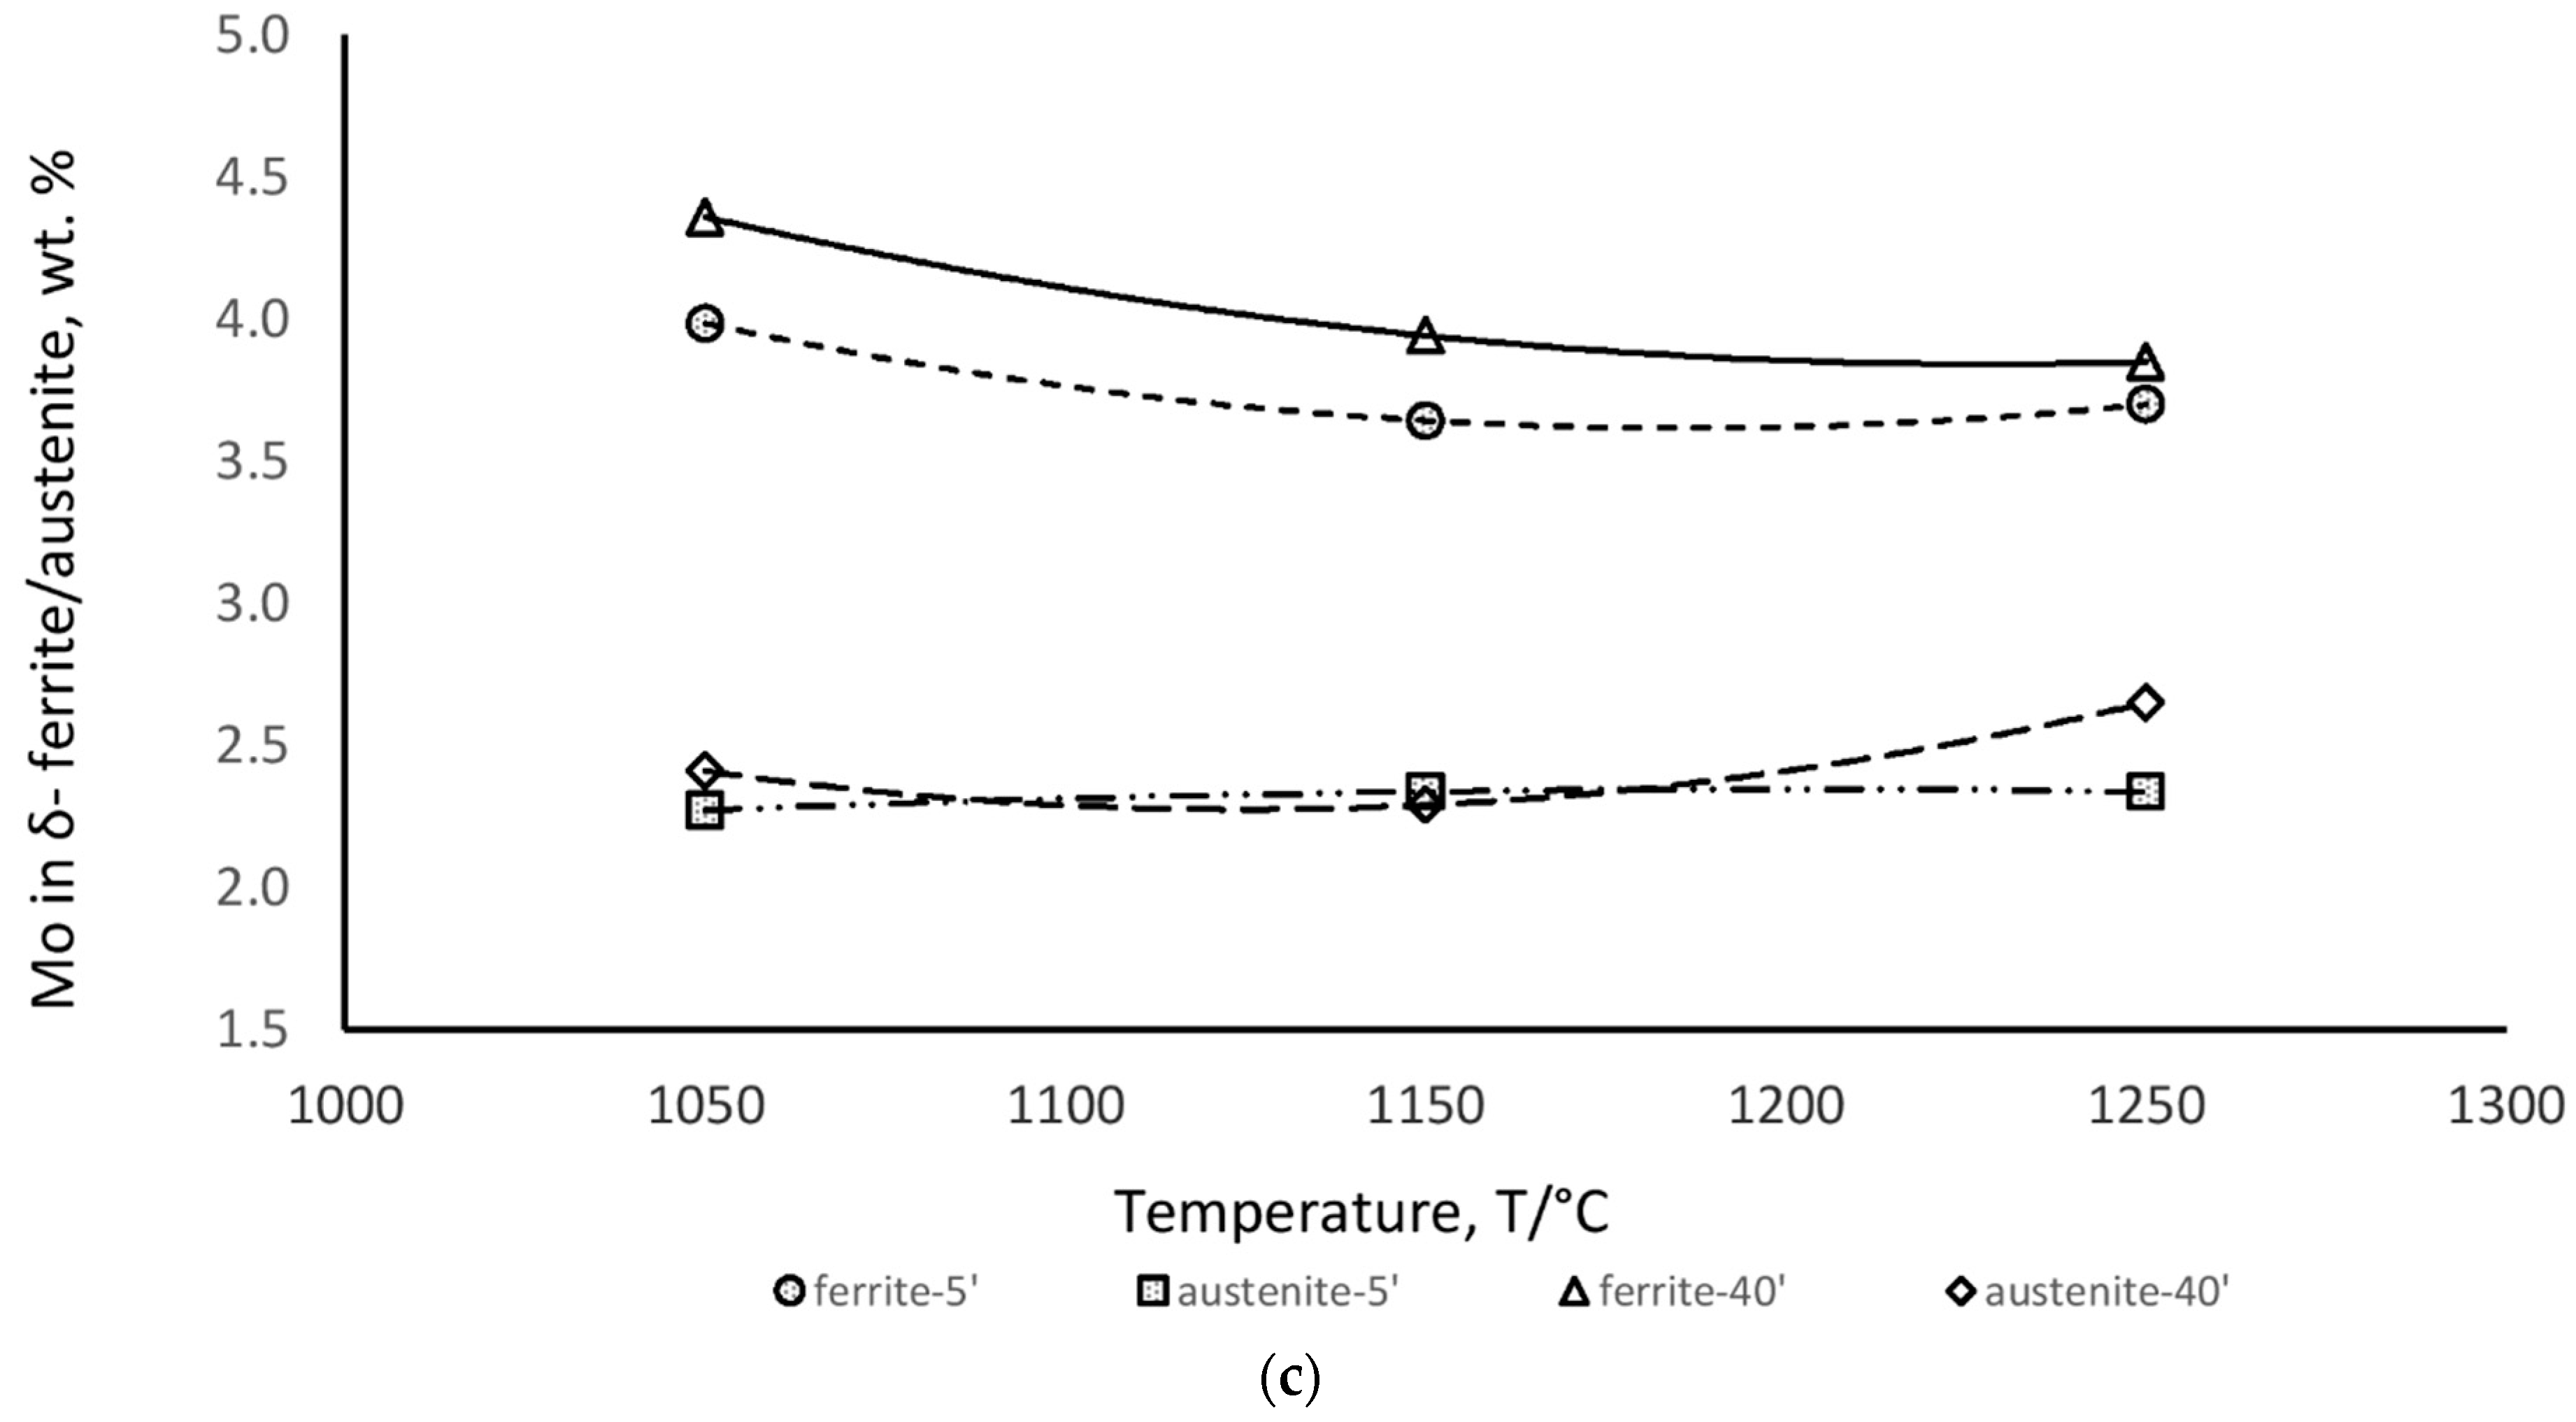
- Concentrations of Cr, Ni and Mo in the δ-ferrite during annealing are diffusion controlled and are approaching toward concentrations in matrix of SS2343.
Author Contributions
Funding
Institutional Review Board Statement
Informed Consent Statement
Conflicts of Interest
References
- Davis, J.R. Stainless Steels. ASM Specialty Handbook; ASM International: Geauga County, OH, USA, 1994. [Google Scholar]
- Steiner Petrovič, D.; Klančnik, G.; Medved, J. Differential scanning calorimetry study of the solidification sequence of austenitic stainless steel. J. Anal. Calorim. 2011, 105, 251–257. [Google Scholar] [CrossRef]
- Martorano, M.A.; Tavares, C.F.; Padilha, A.F. Predicting delta ferrite content in stainless steel castings. ISIJ Int. 2012, 6, 1054–1065. [Google Scholar] [CrossRef] [Green Version]
- Saied, M. Experimental and Numerical Modeling of the Dissolution of Delta Ferrite in the Fe-CR-N System: Application to Austenitic Stainless Steels; English. NNT: 2016GREAI016; Université Grenoble Alpes: Saint-Martin-d’Hères, France, 2016. [Google Scholar]
- Fu, J.W.; Yang, Y.S.; Guo, J.J.; Ma, J.C.; Tong, W.H. Microstructure evolution in ASI304 stainless steel during near rapid directional solidification. Mater. Sci. Technol. 2009, 25, 1013–1016. [Google Scholar] [CrossRef]
- Plaut, R.L.; Herrea, C.; Escriba, D.M.; Rios, P.R.; Padilha, A.P. A short review on properties and performance, wrought austenitic stainless steels at high temperatures: Processing, microstructure. Mater. Res. 2007, 10, 453–460. [Google Scholar] [CrossRef]
- Padilha, A.F.; Tavares, C.F. Delta ferrite formation in austenite stainless steel. Mater. Sci. Forum 2013, 730–732, 733–738. [Google Scholar]
- Shankar, V.; Gill, T.P.S.; Mannan, S.L.; Sundarsan, S. Solidification cracking in austenitic stainless steel welds. Sadhana 2003, 28, 359–382. [Google Scholar] [CrossRef]
- Inoue, H.; Koseki, T. Clarification of solidification behaviors in austenitic stainless steels based on welding process. Nippon Steel Tech. Rep. 2007, 95, 62–70. [Google Scholar]
- Inoue, H.; Koseki, T. Solidification mechanism of austenitic stainless solidified with primary ferrite. Acta Mater. 2017, 124, 430–436. [Google Scholar] [CrossRef]
- Janovec, J.; Šuštaršič, B.; Medved, J.; Jenko, M. Phases in austenitic stainless steels. Mater. Tehnol. 2003, 37, 307–312. [Google Scholar]
- Andersson, J.O.; Helander, T.; Höglund, L.; Shi, P.; Sundman, B. Termo-calc DICTRA, computational tool for materials science. Calphad 2002, 26, 273–312. [Google Scholar] [CrossRef]
- Calliari, I.; Breda, M.; Gennari, C.; Pezzato, L.; Pellizzari, M.; Zambon, A. Investigation on solid-state phase transformation in a 2510 duplex stainless steel grade. Metals 2020, 10, 967. [Google Scholar] [CrossRef]
- Koseki, T.; Flemings, M.C. solidification of undercooled Fe-Cr-Ni alloys part II-microstructural evolution. Metall. Mater. Trans. 1996, 27, 3226–3240. [Google Scholar] [CrossRef]
- Tümer, M.; Yilmaz, R. Characterization of microstructure, chemical composition and toughness of multipass welded joint of austenitic stainless steel AISI 316L. Int. J. Adv. Manuf. Technol. 2016, 87, 2567–2579. [Google Scholar] [CrossRef]
- Laxminarayana, P.; Chennaksava Reddy, A. Quantification of delta ferrite in austenitic stainless steel cast investments shell moulds. In Proceedings of the 4th National Conference on Materials and Manufacturing Processes, Hyderabad Pradesh, India, 8–9 August 2008; pp. 62–65. [Google Scholar]
- Scheller, P.R.; Bleck, W.; Flesch, R. Effect of residual elements on hot-crack susceptibility of austenitic stainless steel. Steel Res. Int. 2004, 75, 672–679. [Google Scholar] [CrossRef]
- Jang, A.Y.; Lee, D.J.; Lee, S.H.; Shim, J.H.; Kang, S.W.; Lee, H.W. Effect of Cr/Ni equivalent ratio on ductility-dip cracking in AISI 316L weld metals. Mater. Des. 2011, 32, 371–376. [Google Scholar] [CrossRef]
- Argains-Juarez, C.R.; Vazuez, A.; Garza-Montes-de-Oca, N.F.; Colas, R. Sensitization of austenitic stainless steel due to the occurrence of δ-ferrite. De Gruyter Corros. Rev. 2018, 37, 179–186. [Google Scholar] [CrossRef]
- Mateša, B.; Samardžič, I.; Dunder, M. The influence of heat treatment on delta ferrite transformation in austenitic stainless steel welds. Metalurgija 2012, 51, 229–232. [Google Scholar]
- Kobayashi, S.; Sowada, K.; Hara, T.; Kushima, H.; Kimura, K. The formation and dissolution of residual δ-ferrite in ASME grade 91. Mater. Sci. Eng. A 2014, 592, 241–248. [Google Scholar] [CrossRef]
- Sasikala, G.; Ray, S.L.; Mannan, S.L. kinetic of transformation of delta ferrite during creep in a type 316(N) stainless steel weld metal. Mater. Eng. A 2003, 359, 86–90. [Google Scholar] [CrossRef]
- Raghunathan, V.S.; Seetharaman, V.; Venkadesan, S.; Rodriquez, P. The influence of post weld heat treatments on structure, composition and amount of ferrite in type 316 stainless steel welds. Metall. Trans. A 1979, 10A, 1683–1689. [Google Scholar] [CrossRef]
- Cho, J.Y.; Czerwinski, F.; Szpunar, J.A. The effect of reheating condition on ferrite content in austenitic stainless steel slabs. J. Mater. Sci. 2000, 35, 1997–2003. [Google Scholar] [CrossRef]
- Goković-Gekić, A.; Avdušinović, H.; Hodžć, A.; Mandžuka, E. Effect of temperature and time on decomposition of δ-ferrite in austenitic stainless steel. Rmz-MG 2020, 67, 65–72. [Google Scholar] [CrossRef]
- Ciuffini, A.F.; Barella, S.; Di Cecca, C.; Gruttadauria, A.; Mapelli, C.; Mombelli, D. Isothermal austenite–ferrite phase transformations and microstructural evolution during annealing in super duplex stainless steels. Metals 2017, 7, 368. [Google Scholar] [CrossRef] [Green Version]
- Gruttadauria, A.; Barella, S.; Mapelli, C.; Mombelli, D. Influence of different soaking times at 1050 °C on UT response due to microstructure evolution of 2205 duplex stainless steel. Metals 2020, 10, 503. [Google Scholar] [CrossRef] [Green Version]
- Marin, R.; Combeau, H.; Zollinger, J.; Dehmas, M.; Rouat, B.; Lamontagne, A.; Loukashenko, N.; Lhenry-Robert, L. σ-phase formation in super austenitic stainless steel during directional solidification and subsequent phase transformations. Met. Mater. Trans. A 2020, 51, 3526–3534. [Google Scholar] [CrossRef]
- Bermejo, M.A.V.; Wessman, S. Computational thermodynamics in ferrite content prediction of austenitic stainless steel weldments. Weldments World 2019, 63, 627–635. [Google Scholar] [CrossRef] [Green Version]
- ThermoCalc Software Package. 2017. Available online: https://thermocalc.com (accessed on 11 January 2021).
- Allahyari, A.A.; Farhangi, H.; Hadavi, S.M.M. Investigation of aging heat treatment on microstructure and mechanical properties of 316L austenitic stainless steel weld metal. Wit Trans. Eng. Sci. 2005, 51, 63–71. [Google Scholar]
- Arnaldo, F.J.; Jorge, O.; Rodrigo, M. Ferrite quantification methodologies for methodologies for duplex stainless steel. J. Aerosp. Technol. Mang. São José Dos Campos. 2016, 8, 357–362. [Google Scholar]
- Kim, S.H.; Moon, H.K.; Kang, T.; Lee, C.S. Dissolution kinetics of delta ferrite in AISI 304 stainless steel produced by strip casting process. Mater. Sci. Eng. 2003, A356, 390–398. [Google Scholar] [CrossRef]
- Gokul, O.S.; Byeong, S.K.; Ho, J.L.; Changheui, J. Evaluation of the thermal aging of δ-ferrite in austenitic stainless steel welds by electrochemical analysis. Sci. Rep. 2018, 8, 1–17. [Google Scholar]
- Ratke, P.D. Study of the Effects of Heat Treatment on Delta-ferrite in Cast Austenitic Stainless Steel. Master’s Thesis, Oklahoma State University, Stillwater, OK, USA, 1988. Available online: https://hdl.handle.net/11244/15698 (accessed on 9 April 2021).


| Element | C | Si | Mn | Cr | Ni | Mo | Ti | Al | P | S | N |
|---|---|---|---|---|---|---|---|---|---|---|---|
| wt.% | 0.023 | 0.75 | 1.52 | 17.4 | 10.8 | 2.62 | 0.005 | 0.009 | 0.052 | 0.017 | 0.0135 |
| tolerance wt.% | ±0.003 | ±0.02 | ±0.05 | ±0.2 | ±0.2 | ±0.05 | ±0.001 | ±0.001 | ±0.002 | ±0.002 | ±0.002 |
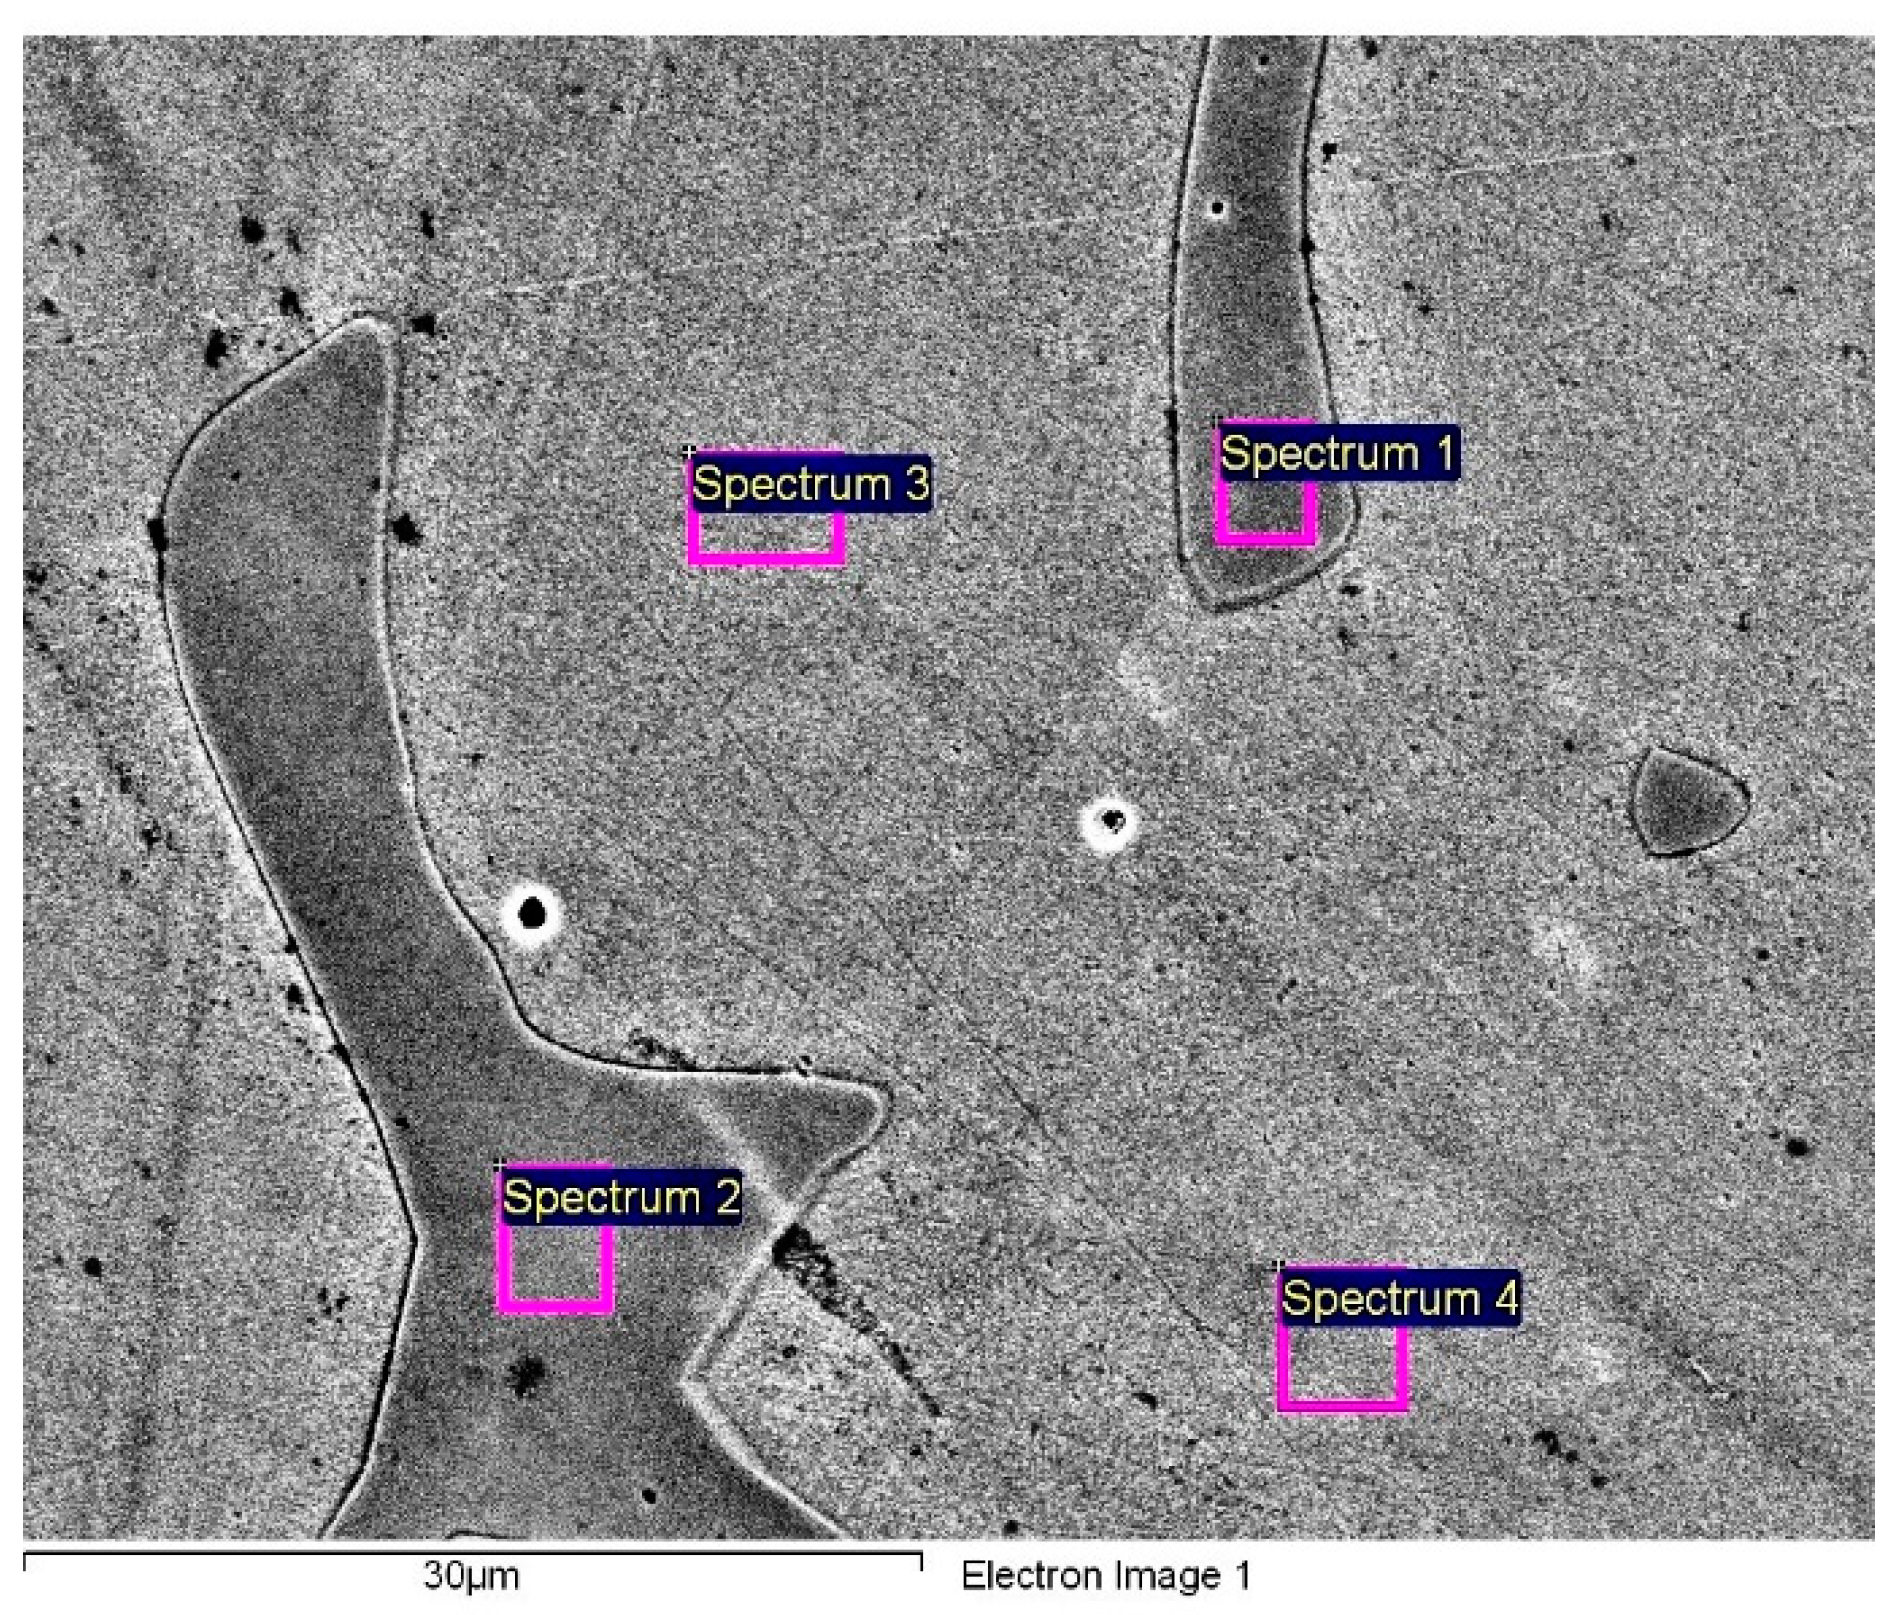
| Spectrum | Si | P | S | Cr | Mn | Fe | Ni | Mo |
|---|---|---|---|---|---|---|---|---|
| 1 | 0.40 | 0.00 | 0.00 | 25.37 | 1.62 | 63.14 | 4.25 | 5.21 |
| 2 | 0.47 | 0.13 | 0.00 | 24.73 | 1.40 | 63.92 | 4.84 | 4.51 |
| 3 | 0.46 | 0.00 | 0.23 | 18.40 | 1.76 | 68.36 | 9.48 | 1.30 |
| 4 | 0.44 | 0.00 | 0.00 | 17.92 | 1.48 | 67.95 | 10.51 | 1.70 |
Publisher’s Note: MDPI stays neutral with regard to jurisdictional claims in published maps and institutional affiliations. |
© 2021 by the authors. Licensee MDPI, Basel, Switzerland. This article is an open access article distributed under the terms and conditions of the Creative Commons Attribution (CC BY) license (https://creativecommons.org/licenses/by/4.0/).
Share and Cite
Arh, B.; Tehovnik, F.; Vode, F. Transformation of the δ-Ferrite in SS2343 Austenitic Stainless Steel upon Annealing at 1050 °C, 1150 °C and 1250 °C. Metals 2021, 11, 935. https://doi.org/10.3390/met11060935
Arh B, Tehovnik F, Vode F. Transformation of the δ-Ferrite in SS2343 Austenitic Stainless Steel upon Annealing at 1050 °C, 1150 °C and 1250 °C. Metals. 2021; 11(6):935. https://doi.org/10.3390/met11060935
Chicago/Turabian StyleArh, Boštjan, Franc Tehovnik, and Franci Vode. 2021. "Transformation of the δ-Ferrite in SS2343 Austenitic Stainless Steel upon Annealing at 1050 °C, 1150 °C and 1250 °C" Metals 11, no. 6: 935. https://doi.org/10.3390/met11060935