Article

Effect of Molybdenum Content on the Corrosion and Microstructure of Low-Ni, Co-Free Maraging Steels

1
Center of Excellence for Research in Engineering Materials, Deanship of Scientific Research, King Saud University, P.O. Box 800, Riyadh 11421, Saudi Arabia
2
Steel Technology Department, Central Metallurgical R&D Institute (CMRDI), Helawn 11421, Egypt
3
Department of Mechanical Engineering, College of Engineering, King Saud University, P.O. Box 800, Riyadh 11421, Saudi Arabia
*
Author to whom correspondence should be addressed.
Metals 2021, 11(6), 852; https://doi.org/10.3390/met11060852
Submission received: 11 April 2021 / Revised: 15 May 2021 / Accepted: 16 May 2021 / Published: 21 May 2021
(This article belongs to the Special Issue Advances in Corrosion and Protection of Materials)

Abstract

:
Molybdenum (Mo) is an important alloying element in maraging steels. In this study, we altered the Mo concentration during the production of four cobalt-free maraging steels using an electroslag refining process. The microstructure of the four forged maraging steels was evaluated to examine phase contents by optical microscopy, scanning electron microscopy (SEM), and X-ray diffraction (XRD) analysis. Additionally, we assessed the corrosion resistance of the newly developed alloys in 3.5% NaCl solution and 1 M H2SO4 solution through potentiodynamic polarization and electrochemical impedance spectroscopy (EIS) techniques. Furthermore, we performed SEM and energy-dispersive spectroscopy (EDS) analysis after corrosion to assess changes in microstructure and Raman spectroscopy to identify the presence of phases on the electrode surface. The microstructural analysis shows that the formation of retained austenite increases with increasing Mo concentrations. It is found from corrosion study that increasing Mo concentration up to 4.6% increased the corrosion resistance of the steel. However, further increase in Mo concentration reduces the corrosion resistance.

1. Introduction

Maraging steels are developed to combine superior high strength (yield strength commercially ranging from 1030 to 3450 MPa) and fracture toughness [1]. The small amount of carbon makes maraging steels different from regular steels; that is, they are reinforced by intermetallic compounds derived from supersaturated martensite during the age hardening of the malleable low-carbon iron (Fe)–nickel (Ni) lath martensitic matrix [2].
Recently, super-high-strength maraging steels have been broadly utilized in applications including the manufacture of airplanes, missiles, rocket motor cases, and gas turbines [3,4,5,6]. Maraging steels are normally low-carbon, Fe–Ni-based alloys with substantial amounts of cobalt (Co) and molybdenum (Mo) along with a small percentage of titanium (Ti) and aluminum (Al). However, the material can be altered by changing its composition according to the application [7,8]. Due to the low carbon content, maraging steels mostly exhibit a high degree of machinability [9]. Manufacture of such steels has been performed by adding or completely removing certain alloying elements to create maraging steel with good mechanical and corrosion-resistance properties.
Previous studies report that the durability of Fe–18% Ni matrix alloyed by Ti significantly decreases at higher strength levels due to the formation of low-temperature, Ti-rich, metastable NiTi (B2) or Ni3Ti during the aging process [10,11,12]. Similarly, higher Ti levels can decrease durability via grain-boundary precipitation of the TiC or TiCN, except in cases where the carbon content is kept low and thermomechanical processing is profoundly controlled. Therefore, this suggests that recently created maraging steels likely have low Ti content. Mo is another alloying component that is valuable for both strength and durability. Previous studies showed that Mo-rich zones precipitate during the aging of maraging steel and play an exceptionally critical role in maintaining the strength of steel [13,14,15,16]. The role of Mo in these processes has been evaluated in ranges of 3–5% based on its inhibition of embrittlement due to intergranular isolation of contaminants in grain boundaries and as a potential precipitation hardener [17].
The corrosion and corrosion resistance of maraging steels in sulfuric acid solution have been examined previously [18,19,20,21], revealing their elevated corrosion resistance in acidic solution relative to tempered martensite alloy steels. In the present study, we incorporated varied contents of Mo into four maraging steels using an electroslag refining (ESR) process in order to evaluate its effect on the corrosion-resistance and microstructure properties of the resulting steels. These four new low-Ni, Co-free maraging steels containing 0, 2.9, 4.6, and 9.8 wt% Mo were investigated to determine their corrosion behavior in 1 M H2SO4 and 3.5% NaCl solution using potentiodynamic polarization and electrochemical impedance spectroscopy (EIS) techniques.

2. Materials and Methods

2.1. Materials

In this approach, investigated steel specimens were prepared through open-air melting followed by remelting in electroslag furnace. The consumable electrodes for ESR were made in a 20 kg air induction furnace with estimated amounts of scrap and ferroalloys. The pouring temperature was about 1600 °C, and the metal was cast into 40 mm diameter and 600 mm high vertical chill molds. These were remelted through ESR process with and without inoculation of 0.05–0.07% Ti. The process was carried out in a water-cooled steel mold of 80 mm diameter connected to the negative end of a DC power source. The applied current and voltage were about 730 A and 25 ± 2 V, respectively, with mold water flow rate of 30 L/min and base-plate water flow of 20 L/min. After ESR, cooled ingots were taken out from the mold and homogenized in a muffle furnace at 975 °C for 8–9 h. To eliminate the probability of the presence of any cavities or pipes or any other internal defects, about 20 mm and 10 mm lengths were cut from the bottom and top of the ingots, respectively. Each ESR ingot was 20 kg in weight. The ESR ingots underwent forging. The chemical compositions of the four produced steels are given in Table 1. The chemical compositions are similar except for Mo content, which was changed from 0 to 10%. The steels are identified as M0, M2.9, M4.6, and M9.8 with 0.0, 2.9%, 4.6%, and 9.8% Mo, respectively (Table 1).

2.2. Optical Microscopic Observation

Initially, specimens were cut into pieces (1 × 1 × 0.5 cm3) from the sheets, and two samples of each grade were used for the tests. The specimens were properly polished with different grades of emery paper (120, 180, 500, and 1000) and cloth polishers. After mechanical polishing, the samples were etched in 10% ammonium persulfate and 10% nital solutions. Microstructural analysis was then performed using a Leica optical microscope (Leica, Wetzlar, Germany).

2.3. X-ray Diffraction (XRD)

The crystalline structure and phases of the forged steels were characterized by XRD using a Rigaku Ultima III X-ray Diffractometer (Rigaku, Tokyo, Japan) to record diffraction traces from monochromatic Cu Kα radiation applied at room temperature and at a scan rate of 2°/min. The crystallographic planes of X-ray diffraction were obtained from the inbuilt software of the X-ray machine.

2.4. Potentiodynamic Polarization

Potentiodynamic polarization was performed at a scan rate of 1 mV/s using a potentiostat (PC/750; Gamry Instruments, Warminster, PA, USA). Samples were degreased with acetone and ethanol solution after polishing, and a standard three-electrode system was used to measure the icorr and Ecorr of the samples. The reference electrode was a saturated calomel electrode, with graphite used as the counter electrode (the sample was used as the working electrode). NaCl solution (3.5 wt%) and 1 M H2SO4 solution were used as the electrolytes at room temperature. The corrosive mediums of 3.5% NaCl and 1.0 M sulfuric acid solution were prepared from analytical-reagent-grade sodium chloride, sulfuric acid, and double-distilled water. Both the NaCl solution and H2SO4 solution were kept in open-air condition. All the experiments were carried out at room temperature in the open atmosphere, under unstirred conditions. The surface area of samples exposed to the solution differed from sample to sample; however, during plotting, this was standardized according to the same sample area. Table 2 and Table 3 present the icorr and Ecorr values obtained by the Tafel extrapolation.

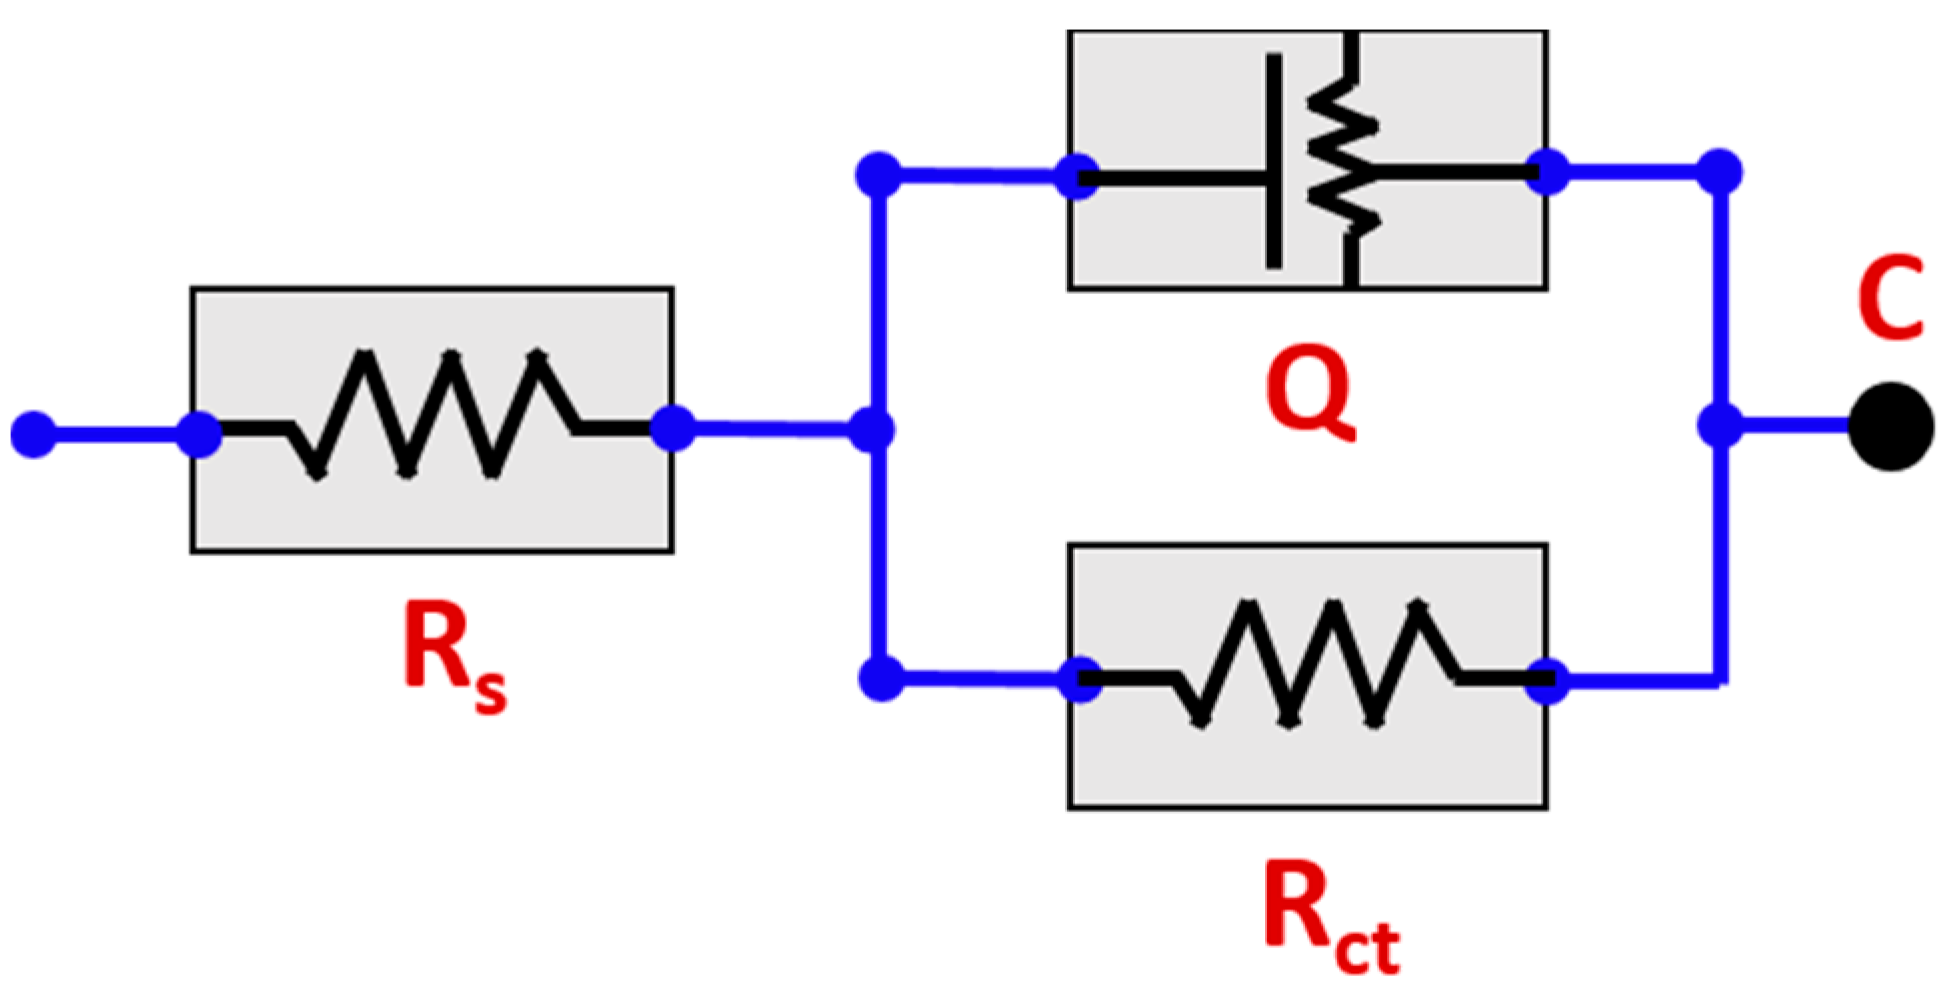
2.5. Electrochemical Impedance Spectroscopy (EIS)

EIS was performed using the potentiostat (Gamry Instruments) in a three-electrode system and at an amplitude range of 10 mV rms and a frequency interval of 0.1–30 kHz. These experiments were also done in the same solutions, i.e., 3.5% NaCl solution and 1.0 M H2SO4 solution. Here also all experiments were done at room temperature where solutions were kept in open air and unstirred condition. At each frequency, the absolute impedance and a Nyquist plot were obtained. The obtained impedance data were fit to an appropriate equivalent electrical circuit, with the fitting performed using a simplex fit mode and using both the real and imaginary components of the data. The impedance data were interpreted based on an equivalent electric circuit, and Nyquist plots were obtained at the open-circuit potential for all samples at different solutions.

2.6. Raman Spectroscopy

Raman estimations were performed using a RAMAN HR800 confocal micro-Raman spectrometer (Horiba Scientific, North Edison, NJ, USA) with backscattered calculation through a 10× (NA = 0.25) magnifying lens objective. An argon laser transmitting at a frequency of 514.5 nm was used as the excitation source, and the quantity of grating in the Raman spectrometer was 1800 grooves/mm. The Raman band of a silicon wafer at 520 cm−1 was utilized to align the spectrometer. Raman spectra were recorded in the broad range of 200–2000 cm−1. Corrosion products formed on the specimens were characterized with the help of Raman spectrometer using an excitation laser of 514.5 nm wavelength coupled with an Olympus optical microscope.

2.7. Scanning Electron Microscopy (SEM) and Energy-Dispersive Spectroscopy (EDS)

In this present work, scanning electron microscopy (SEM) was used to study the surface morphology of the maraging steel with different wt% of Mo, and EDS was used to determine the composition of the corrosion products on the surface of maraging steel. All the studies were carried out with Model JEOL JSM-6360. In this present study, 200× magnification was used. All the SEM images before and after corrosion are presented in results section.

3. Results and Discussion

3.1. Optical Microscopic Observation

Figure 1 shows the optical micrographs of the maraging steel produced by ESR and with different Mo contents. The microstructure displayed a lamellar morphology with packets of martensite within prior austenite grains. As the Mo concentration increased, the martensite packets became visible both due to the special etching along their boundaries and the martensite packets inside an austenite grain that failed to extend beyond the austenite grain boundary. The microstructure of M9.8 differed from the other samples according to the existence of interlath austenite, which was not fully resolved. However, we speculated that this interlath structure affected the corrosion-resistance properties.
These findings suggested that increasing the concentration of the alloying element (Mo) resulted in an increased tendency to form retained austenite. Compared with conventional casting methods, ESR enables lower local solidification time, allowing the formation of a very fine and well-distributed microstructure not present in other production methods used to produce maraging steel.

3.2. XRD Analysis

Figure 2 shows the XRD patterns for the as-received and differently heat-treated maraging-steel samples produced using ESR. The diffraction peaks α(110), α(200), and α(211) of the martensitic phase corresponded to diffraction angles of 44.5°, 65°, and 82.2°, respectively. Additionally, there was a weak diffraction peak (ϒ(111)) for the austenite phase at a diffraction angle of 43.5°. The samples mainly comprised a martensitic phase and a small amount of retained austenite phase, which arose from the microsegregation of solute elements (particularly Ni) at cellular boundaries during solidification. The enrichment of Ni stabilized the retained austenite, thereby allowing the detection of the austenite phase. Moreover, the diffraction peak intensity for the austenite phase in the sample became higher as Mo concentration increased. In the M9.8 sample, we observed reversion of the martensitic phase into the austenite phase. The austenite in maraging steel comprises retained austenite, and the reverted austenite forms mostly during the aging process by a diffusion-controlled reaction for overaging conditions.
It is clear from Figure 2 that the amount of retained austenite in ESR remelted steels depends mainly on the chemical composition of investigated steels. An increase in the amount of alloying element, i.e., Mo, is accompanied by an increase in the tendency to form retained austenite.

3.3. Potentiodynamic Polarization Analysis

We then assessed the effect of Mo on the corrosion-resistance properties of the developed steel. We found that this component improved the passive behavior of the protective films. Previous studies report that Mo improves chromium enrichment in the film without being incorporated [22,23]. Additionally, studies suggest that Mo in the compound breaks down into Mo particles, speeding the repassivation rate (anodic inhibitor) [24,25,26]. Furthermore, Mo expands the stability of the inner layers of oxide film [26] and diminishes the unfavorable action of sulfides on pitting resistance [27]. Figure 3 shows the potentiodynamic polarization curve of maraging steel in 3.5% NaCl solution.
In 3.5% NaCl solution, as seen in Table 2, the icorr value of the maraging steel gradually increased along with increases in the Mo content in the alloy, with similar results observed in 1 M H2SO4 solution. In both cases, with 9.8% Mo content, the M9.8 sample showed an increase in the icorr value. By studying the X-ray patterns, it can be seen that retained austenite of experiment steels increases with the increase in Mo content. On the other hand, the microstructure in Figure 1 shows that even at high magnification, retained austenite is not recognized in the studied steels except in specimen M9.8. In samples with lower Mo contents, austenite presents as lath austenite; on the other hand, the specimen containing 9.8 wt% Mo retained austenite aggregate in separate grains. So, the high corrosion of sample M9.8 may be attributed to the large amount of retained austenite and its morphology. Previous studies reported that Mo alone does not directly affect corrosion resistance but rather indirectly influence this property [28,29,30,31,32].
Figure 4 and Table 3 present the results of the potentiodynamic polarization study of maraging steel in 1 M H2SO4 solution. Interestingly, the rate of corrosion for M9.8 was worse in 1 M H2SO4 solution as compared with 3.5% NaCl solution, possibly due to the NaCl solution allowing Mo to produce a more protective layer.

3.4. EIS Analysis

We then used EIS to examine the corrosion resistance of the ESR steel samples in 1 M H2SO4 solution to determine their mechanistic and kinetic parameters and compare them with the results of potentiodynamic polarization. The Nyquist plots (Figure 5 and Figure 6) were examined by fitting the trial results to an equivalent circuit model (Figure 7). The circuit comprises a parallel combination of a consistent phase element (CPE, Q), the charge transfer resistance (Rct) relating to the corrosion response at the metal/electrolyte interface, and the solution resistance (Rs) between the working and reference electrode [33,34]. To diminish the effects of surface anomalies in the metal, CPE (Q) was brought into the circuit instead of a pure double-layer capacitance (Cdl), allowing a more precise fit [35,36]. Among these parameters, Rct is the factor that determines the corrosion resistance of composites. Because Rct is conversely relative to icorr, a higher Rct value correlates to a lower icorr value. The impedance of CPE can be presented as follows:
ZCPE = 1/Y0(jω)n,
where Y0 is the CPE constant, n is the exponent (phase shift), ω is the angular frequency, and j is the imaginary unit. CPE can represent resistance, capacitance, and inductance according to the estimations of n [37]. In all analyses, the estimated n ranged from 0.8 to 1.0, suggesting a capacitive response of CPE. From this circuit, we determined Rs, Rct, and Cdl (Table 4 and Table 5).
The Nyquist plots indicated that the impedance response of the samples gradually increased along with increases in Mo concentration. However, the smallest capacitive loop in a high-frequency region was observed in the M9.8 sample in both 3.5% NaCl and 1 M H2SO4 solutions, indicating that this sample showed the highest corrosion rate. Table 4 and Table 5 present all EIS parameters for all of the maraging steels. We found that the Rct value decreased gradually for samples up to M4.6, with the highest value observed for M9.8, confirming the lowest corrosion-resistance property in M9.8 sample as Rct is inversely proportional to the icorr value as mentioned earlier. Furthermore, this was supported by the potentiodynamic polarization results for M9.8. Comparing the diameters of the Nyquist plots, the curves in 3.5% NaCl solution showed increased diameters relative to those in 1 M H2SO4 solution, verifying the potentiodynamic results.

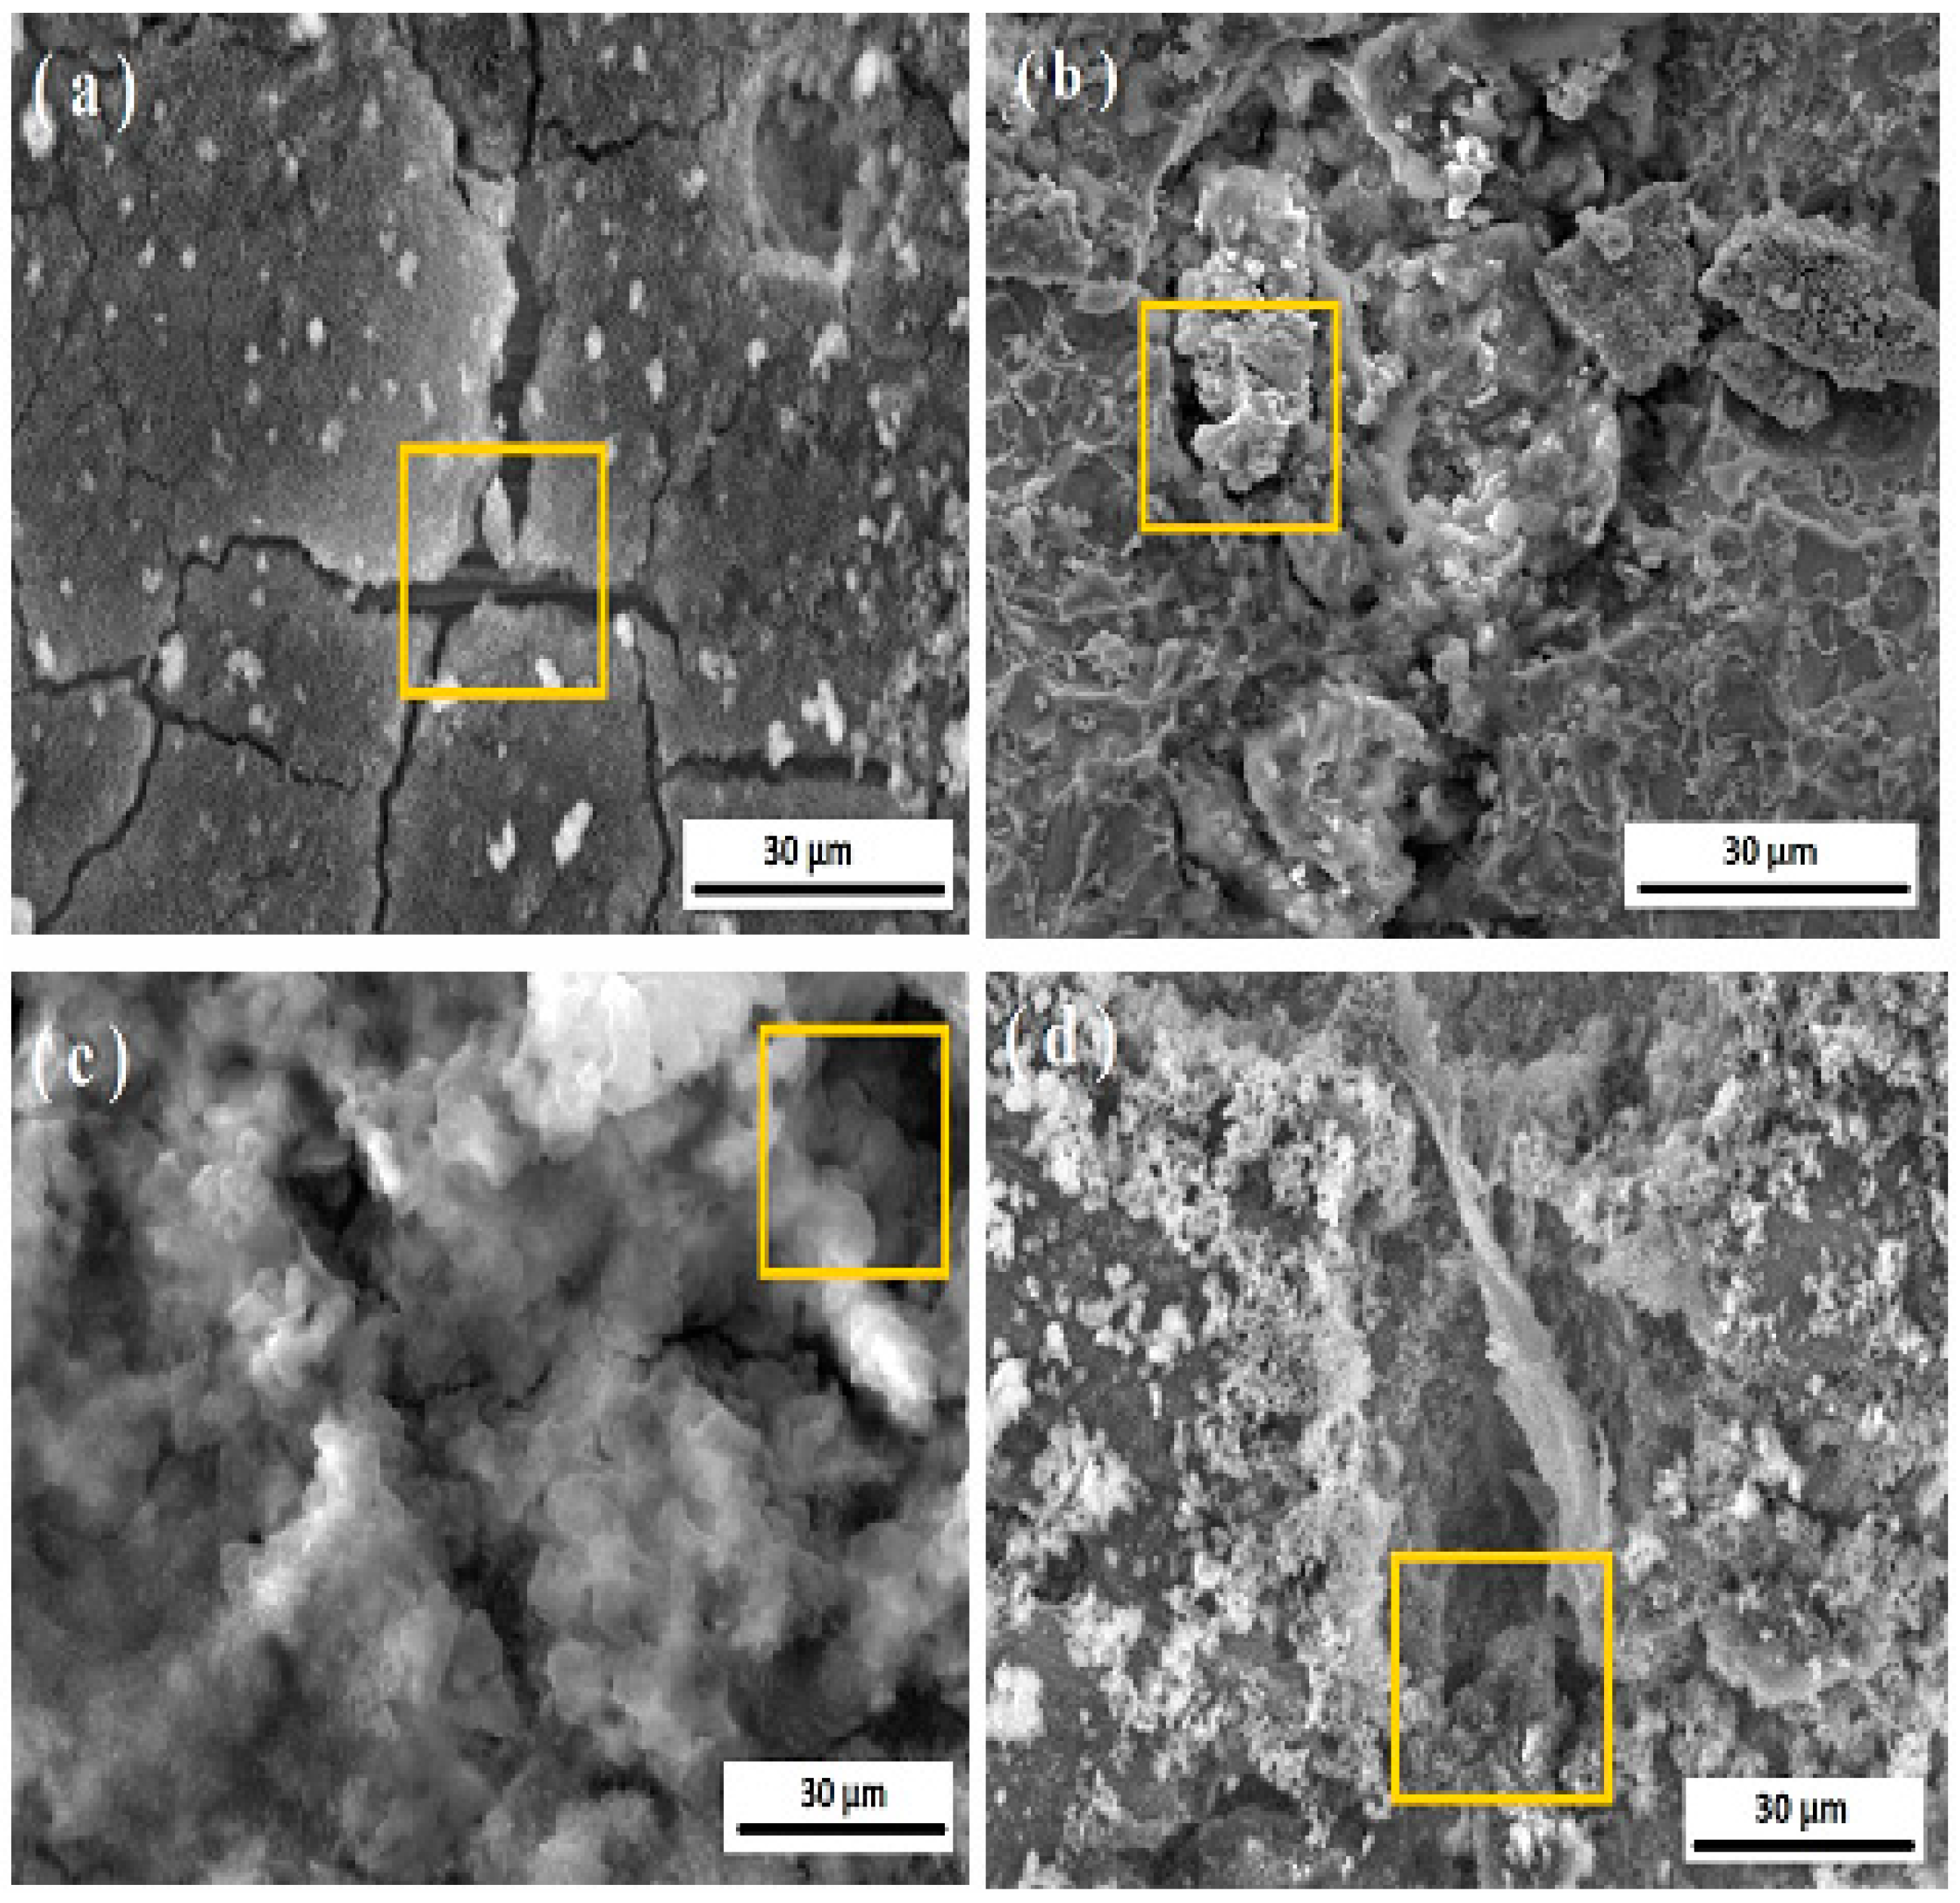
3.5. Scanning Electron Microscopy (SEM) Analysis

Figure 8 and Figure 9 show SEM images of the samples after corrosion in 3.5% NaCl solution and 1 M H2SO4 solution, respectively. It is well known that Mo affects the pitting resistance of the maraging steel by reducing pitting on the sample surface. Chloride is primarily responsible for surface pitting on materials. However, in the present study, the presence of more salt resulted in decreased corrosion resistance in NaCl solution relative to H2SO4 solution. Moreover, Mo increased the stability of the inner layers of the oxide film, resulting in minimal effect on the Ecorr value in both solutions. Furthermore, the surface of the M9.8 sample showed significant effects from both solutions relative to the other samples as a result of the decreased corrosion resistance associated with Mo.

3.6. Energy-Dispersive X-ray Spectroscopy (EDS) Analysis

Figure 10 shows the results of EDS analysis of the as-received and heat-treated maraging-steel samples in 3.5% NaCl solution. The EDS was completed on the yellow boxed portion as given in the SEM images in Figure 8. The EDS analysis data are given in Table 6 in wt%. The results showed that the Mo peak increased from samples M0 to M9.8, with peaks for Ti, C, Ni, and Fe also observed. The chloride peak was higher in the M9.8 sample relative to others, which is likely related to its decreased corrosion resistance and the associated increased number of chloride ions on the M9.8 surface.
Figure 11 shows the results of EDS analysis of the as-received and heat-treated maraging-steel samples in 1 M H2SO4 solution. The EDS was completed on the yellow boxed portion as given in the SEM images in Figure 10. The EDS analysis data are given in Table 7 in wt%. Similarly, peaks for Ti, C, Fe, and Ni were observed following their precipitation as carbides. Additionally, we observed an increase in the intensity of the Mo peak from samples M0–M9.8, with peaks for sulfur and oxygen ions also observed as the surface reacted with the SO4 ions present in the solution. Given the unfavorability of sulfur ions on pitting resistance, we found greater corrosive effects on the surface of the maraging-steel sample in H2SO4 solution.

3.7. Raman Spectroscopy Analysis

Raman spectroscopy analyses of the corroded surfaces of the samples following potentiodynamic polarization are shown in Figure 12 and Figure 13, for both solutions. Standard normal variate (SNV) model is an effective procedure to make the output data more comparable. In this method, the spectrum mean subtraction and standard spectrum deviation procedure is used. As long as the original scale of the spectra is not interesting, this is an efficient way of removing constant baseline effects and scaling differences from spectra. Previous studies reported that increases in the proportion of α-FeOOH and gamma * (total mass of γ-FeOOH, β-FeOOH, and magnetite) in the corrosion products suggest a decline in the corrosion rate [38,39]. In the present study, we identified α-FeOOH (280 cm−1) as a significant phase of the corrosion product present on a superficial level, and it was more prominent in the M9.8 sample relative to the others. This suggested that a higher level of α-FeOOH in the M9.8 sample promoted an increase in the corrosion rate. Additionally, higher amounts of α-FeOOH and gamma * (Figure 13) were observed in 1 M H2SO4 solution, indicating that the maraging steel showed a higher degree of corrosion in the presence of H2SO4 solution as compared to the NaCl solution. In the case of sulfate solution, a phase shift occurs at 310 cm−1 and a new peak is seen at 1000 cm−1. More γ-FeOOH occurs in sulfate solution at 80, 1320, and 1410 cm−1. For the same composition, only one peak at 1380 cm−1 occurs for the sample in chloride solution. The β-FeOOH phase occurs at 480 cm−1 only in the case of sulfate solution. No phase shift occurs for the δ-FeOOH phase, and it shows a peak at 400 cm−1. Only an extra peak at 610 cm−1 occurs in sulfate solution for δ- FeOOH.

4. Conclusions

Mo plays an important role as an alloying element by increasing the strength and toughness of maraging steel. Moreover, the tendency to form retained austenite increases along with increasing Mo concentrations. In the present study, we found that in both 3.5% NaCl solution and 1 M H2SO4 solution, the generated maraging steel exhibited improvements in corrosion resistance according to increasing Mo content up to 4.6%. However, corrosion resistance decreased at 9.8% Mo due to increased embrittlement in the alloy. These results were confirmed by the Nyquist plots, showing the same trends in corrosion behavior. Furthermore, Raman spectroscopy verified decreases in the corrosion rate due to the presence of higher fractions of corrosion products (α-FeOOH) in the M9.8 (9.8% Mo) sample.

Author Contributions

Conceptualization, A.H.S., H.H., and M.S.S.; data curation, A.H.S., H.H., and M.S.S.; formal analysis, A.H.S., H.H., and M.S.S.; funding acquisition, M.S.S.; investigation, A.H.S. and M.S.S.; methodology, A.H.S., H.H., and M.S.S.; resources, H.H.; supervision, A.H.S., H.H., and M.S.S.; writing—original draft, A.H.S., H.H., and M.S.S.; writing—review and editing, A.H.S., H.H., and M.S.S. All authors have read and agreed to the published version of the manuscript.

Funding

This project was supported by the NSTIP Strategic Technologies Program, grant number (12-ADV2465-02), Kingdom of Saudi Arabia.

Data Availability Statement

The experimental datasets obtained from this research work and then the analysed results during the current study are available from the corresponding author on reasonable request.

Acknowledgments

This project was supported by the NSTIP Strategic Technologies Program, grant number (12-ADV2465-02), Kingdom of Saudi Arabia.

Conflicts of Interest

The authors declare no conflict of interest.

References

  1. An, J.; Meng, F.; Lv, X.; Liu, H.; Gao, X.; Wang, Y.; Lu, Y. Improvement of Mechanical Properties of Stainless Maraging Steel Laser Weldments by Post-Weld Ageing Treatments. Mater. Des. 2012, 40, 276–284. [Google Scholar] [CrossRef]
  2. Li, Y.; Yan, W.; Cotton, J.D.; Ryan, G.J.; Shen, Y.; Wang, W.; Shan, Y.; Yang, K. A New 1.9 GPaMaraging Stainless Steel Strengthened by Multiple Precipitating Species. Mater. Des. 2015, 82, 56–63. [Google Scholar] [CrossRef]
  3. Rezek, J.; Klein, I.E.; Yahalom, J. Structure and Corrosion Resistance of Oxides Grown on Maraging Steel in Steam at Elevated Temperatures. Appl. Surf. Sci. 1997, 108, 59–165. [Google Scholar] [CrossRef]
  4. Ohue, Y.; Matsumoto, K. Sliding-Rolling Contact Fatigue and Wear of Maraging Steel Roller with Ion-Nitriding and Fine Particle Shot-Peening. Wear 2007, 263, 782–789. [Google Scholar] [CrossRef]
  5. Wang, W.; Yan, W.; Duan, Q.; Shan, Y.; Zhang, Z.; Yang, K. Study on Fatigue Property of a New 2.8 GPa Grade Maraging Steel. Mater. Sci. Eng. A 2010, 527, 3057–3063. [Google Scholar] [CrossRef]
  6. Poornima, T.; Nayak, J.; Shetty, A.N. Corrosion of Aged and Annealed 18 Ni 250 Grade Maraging Steel in Phosphoric Acid Medium. Int. J. Electrochem. Sci. 2010, 5, 56–71. [Google Scholar]
  7. Decker, R.F.; Floreen, S. International Symposium on Maraging Steels Recent Development and Applications. Pheonix, AZ, USA, 1998; Volume 1, pp. 1–88. [Google Scholar]
  8. Stiller, K.; Danoix, F.; Bostel, A. Investigation of Precipitation in a New Maraging Stainless Steel. Appl. Surf. Sci. 1996, 94–95, 326–333. [Google Scholar] [CrossRef]
  9. Klobčar, D.; Tušek, J.; Taljat, B.; Kosec, L.; Pleterski, M. Aging of Maraging Steel Welds During Aluminium Alloy Die Casting. Comput. Mater. Sci. 2008, 44, 515–522. [Google Scholar] [CrossRef]
  10. Viswanathan, U.K.; Dey, G.K.; Asundi, M.K. Precipitation hardening in 350 grade maraging steel. Metall. Trans. A 1993, 24, 2429–2442. [Google Scholar] [CrossRef]
  11. Vanderwalker, D.M. The precipitation sequence of Ni3Ti in Co-free maraging steel. Metall. Trans. A 1987, 18, 1191–1194. [Google Scholar] [CrossRef]
  12. Sha, W.; Ye, A.; Malinov, S.; Wilson, E.A. Microstructure and Mechanical properties of low nickel maraging steel. Mater. Sci. Eng. A 2012, 536, 129–135. [Google Scholar] [CrossRef]
  13. Peters, D.T.; Cupp, R.C. Kinetics of aging reactions in 18% Ni maraging steels. Trans. AIME 1966, 236, 1420. [Google Scholar]
  14. Tokunaga, Y.; Takagi, S. Bull. Jpn. Inst. Met. 1982, 21, 234. [Google Scholar] [CrossRef]
  15. Miner, R.E.; Jackson, J.K.; Gibbons, D.F. Internal Friction in 18 percent Ni Maraging steels. Trans. TMS-AIME 1966, 236, 1565–1570. [Google Scholar]
  16. Asayama, Y.J. Aging Behavior and Role of Mo Rich Zone on the Notch Toughness in 18%Ni Maraging Steels. Jpn. Inst. Metals 1985, 49, 972–980. [Google Scholar] [CrossRef] [Green Version]
  17. Hazarabedian, M.S.; Quadir, M.Z.; Iannuzzi, M. Characterization of Intergranular Phases in Precipitation Hardening Ni Alloy UNS N07725. Mater. Charact. 2020, 171, 110770. [Google Scholar] [CrossRef]
  18. Poornima, T.; Jagannatha, N.; Shetty, A.N. Studies on Corrosion of Annealed and Aged 18 Ni 250 Grade Maraging Steel in Sulphuric Acid Medium. Port. Electrochim. Acta 2010, 28, 173–188. [Google Scholar] [CrossRef]
  19. Sanatkumar, B.S.; Nayak, J.; Shetty, A.N. Corrosion Behavior of 18% Ni M250 Grade Maraging Steel under Weld-Aged Condition in Sulfuric Acid Medium. Chem. Eng. Commun. 2012, 199, 1610–1625. [Google Scholar] [CrossRef]
  20. Singh, A.K.; Shukla, S.K.; Quraishi, M.A.; Ebenso, E.E. Investigation of Adsorption Characteristics of N,N′-[(Methylimino)Dimethylidyne]di-2,4-Xylidine as Corrosion Inhibitor at Mild Steel/Sulphuric Acid Interface. J. Taiwan Inst. Chem. Eng. 2012, 43, 463–472. [Google Scholar] [CrossRef]
  21. Poornima, T.; JagannathaNayak, A. NityanandaShetty,3,4Dimethoxybenzaldehydethiosemicarbazone as Corrosion Inhibitor for Aged 18 Ni 250 Grade Maraging Steel in 0.5 M Sulfuric Acid. J. Appl. Electrochem. 2011, 41, 223–233. [Google Scholar] [CrossRef]
  22. Galvele, J.R.; Lumsden, J.B.; Staehle, R.W. Effect of Molybdenum on the Pitting Potential of High Purity 18% Cr Ferritic Stainless Steels. J. Electrochem. Soc. 1978, 125, 1204. [Google Scholar] [CrossRef]
  23. Yaniv, A.E.; Lumsden, J.B.; Staehle, R.W. The Composition of Passive Films on Ferritic Stainless. Electrochem. Soc. 1977, 124, 490–496. [Google Scholar] [CrossRef]
  24. Ogawa, H.; Omata, H.; Itoh, I.; Okada, H. Auger electron spectroscopic and electrochemical analysis of the effect of alloying elements on the passivation behavior of stainless steels. Corrosion 1978, 34, 53. [Google Scholar] [CrossRef]
  25. Sugimoto, K.; Sawada, Y. The Role of Alloyed Molybdenum in Austenitic Stainless Steels in the Inhibition of Pitting in Neutral Halide Solutions. Corrosion 1976, 32, 347–352. [Google Scholar] [CrossRef]
  26. da Cunha Belo, M.; Rondot, B.; Pons, F.; Le Hericy, J.; Langerous, J.P. Advances in Electronics and Electron Physics; Elsevier B.V.: Amsterdam, The Netherlands, 1977; Volume 61. [Google Scholar]
  27. Kolotyrkin, Y.M.; Freinman Korroziya, L.I. I Zashchitaot Korroziy, Protection of equipments from corrosion and salt deposition in geothermal systems, Izd. Winiti Moscow 1978, 5, 5. [Google Scholar]
  28. Floreen, S.G.R. The Strength and Toughness of Maraging Steels. Trans. As. Med. 1964, 57, 714. [Google Scholar]
  29. Miller, G.P.; Mitchell, W.L. Structure and Hardening Mechanisms of 18% Nickel-Cobalt-Molybdenum Maraging Steels. J. Iron Steel Inst. 1965, 203, 899–904. [Google Scholar]
  30. Baker, A.J.; Swann, P.R. Metallography of Maraging Steels. J. Appl. Phys. 1963, 34, 2505. [Google Scholar]
  31. Hättestrand, M.; Nilsson, J.-O.; Stiller, K.; Liu, P. Precipitation hardening in a 12%Cr–9%Ni–4%Mo–2%Cu stainless steel. Acta Mater. 2004, 52, 1023–1037. [Google Scholar] [CrossRef]
  32. Peters, D.T. Precipitate Reversion in 18% Ni-Co-Mo Steels. Trans. AIME 1968, 61, 62. [Google Scholar]
  33. Sherif, E.-S.M. Corrosion Behavior of Duplex Stainless Steel Alloy Cathodically Modified with Minor Ruthenium Additions in Concentrated Sulfuric Acid Solutions. Int. J. Electron. Sci. 2011, 6, 2284–2298. [Google Scholar]
  34. Singh, A.K.; Shukla, S.K.; Singh, M.; Quraishi, M.A. Inhibitive Effect of Ceftazidime on Corrosion of Mild Steel in Hydrochloric Acid Solution. Mater. Chem. Phys. 2011, 129, 68–76. [Google Scholar] [CrossRef]
  35. El Azhar, M.; Mernari, B.; Traisnel, M.; Bentiss, F.; Lagrenée, M. Corrosion Inhibition of Mild Steel by the New Class of Inhibitors [2,5-Bis(n-Pyridyl)-1,3,4-Thiadiazoles] in Acidic Media. Corros. Sci. 2001, 43, 2229–2238. [Google Scholar] [CrossRef]
  36. Seikh, A.H.; Halfa, H.; Baig, M.; Khan, S.M.A. Microstructure Characterization and Corrosion Resistance Behavior of New Cobalt-Free Maraging Steel Produced Through ESR Techniques. J. Mater. Eng. Perform. 2017, 26, 1589–1597. [Google Scholar] [CrossRef]
  37. Macdonald, J.R.; Johnson, W.B. Theory in Impedance Spectroscopy; Wiley: New York, NY, USA, 1987. [Google Scholar]
  38. Kamimura, T.; Hara, S.; Miyuki, H.; Yamashita, M.; Uchida, H. Composition and protective ability of rust layer formed on weathering steel exposed to various environments. Corros. Sci. 2006, 48, 2799–2812. [Google Scholar] [CrossRef]
  39. Yamashita, M.; Miyuki, H.; Matsuda, Y.; Nagano, H.; Misawa, T. The long term growth of the protective rust layer formed on weathering steel by atmospheric corrosion during a quarter of a century. Corros. Sci. 1994, 36, 283–299. [Google Scholar] [CrossRef]
Figure 1. Microstructure analyses of (a) M0, (b) M2.9, (c) M4.6, and (d) M9.8.
Metals 11 00852 g001aMetals 11 00852 g001b
Figure 2. XRD analysis of maraging steel with different molybdenum concentrations.
Metals 11 00852 g002
Figure 3. Potentiodynamic polarization curve of maraging steel in 3.5% NaCl solution.
Metals 11 00852 g003
Figure 4. Potentiodynamic polarization curve of maraging steel in 1 M H2SO4 solution.
Metals 11 00852 g004
Figure 5. Nyquist plot curves of maraging steel with different molybdenum (Mo) concentrations in 3.5% NaCl solution.
Metals 11 00852 g005
Figure 6. Nyquist plot curves of maraging steel with different Mo concentrations in 1 M H2SO4 solution.
Metals 11 00852 g006
Figure 7. Equivalent circuit diagram.
Metals 11 00852 g007
Figure 8. Scanning electron microscope (SEM) micrographs of maraging-steel samples: (a) M0, (b) M2.9, (c) M4.6, and (d) M9.8 in 3.5% NaCl solution.
Metals 11 00852 g008
Figure 9. SEM micrographs of maraging-steel samples: (a) M0, (b) M2.9, (c) M4.6, and (d) M9.8 in 1 M H2SO4 solution.
Metals 11 00852 g009
Figure 10. EDS spectra of the maraging steel after immersion in 3.5% NaCl solution.
Metals 11 00852 g010
Figure 11. EDS spectra of the maraging steel after immersion in 1.0 M H2SO4 solution.
Metals 11 00852 g011
Figure 12. Raman spectra of maraging steel with different Mo concentrations in 3.5% NaCl solution.
Metals 11 00852 g012
Figure 13. Raman spectra of maraging steel with different Mo concentrations in 1 M H2SO4 solution.
Metals 11 00852 g013
Table 1. Chemical composition (wt%) of produced steels.
Composition (%)CMnSiSPNiCrMoTiAlFe
Sample
M00.0260.100.0820.0090.01210.94.60.01.190.082Bal.
M2.90.0290.090.080.0110.01411.054.82.91.220.078Bal.
M4.60.0270.110.0780.0120.01111.14.74.61.210.085Bal.
M9.80.0250.120.0840.0150.00910.84.759.81.240.081Bal.
Table 2. Ecorr and icorr values of maraging steel in 3.5% NaCl solution.
Sampleicorr (A/cm2)Ecorr (VSCE)
M060−0.553
M2.94−0.356
M4.62−0.400
M9.8202−0.329
Table 3. Ecorr and icorr values of maraging steel in 1 M H2SO4 solution.
Sampleicorr (A/cm2)Ecorr (VSCE)
M0100−0.615
M2.9200−0.518
M4.651−0.318
M9.8602−0.416
Table 4. Electrochemical impedance parameters of maraging-steel samples in 3.5% NaCl solution.
SampleRct (ohm-cm2)nRs (ohm-cm2)Cdl (mMho)
M012.80.851.33
M2.99.20.861.76
M4.64.50.841.529
M9.8300.851.22
Table 5. Electrochemical impedance parameters of maraging-steel samples in 1 M H2SO4 solution.
SampleRct (ohm-cm2)nRs (ohm-cm2)Cdl (mMho)
M014.60.771.43
M2.98.70.861.23
M4.65.40.831.455
M9.832.20.7611
Table 6. EDS analysis data in 3.5% NaCl solution.
SampleFeMoClNiTiCTotal
M055.8010.915.38.89.2100
M2.940.73.118.517.79.710.3100
M4.638.94.825.313.810.86.4100
M9.835.69.932.611.85.34.8100
Table 7. EDS analysis data in H2SO4 solution.
SampleFeMoSNiTiCTotal
M057.5020.210.35.86.2100
M2.942.32.825.511.89.48.2100
M4.636.94.530.912.67.27.9100
M9.835.29.835.69.44.25.8100
Publisher’s Note: MDPI stays neutral with regard to jurisdictional claims in published maps and institutional affiliations.

