Article

Deformation Behavior and Microstructural Evolution of Inconel 625 Superalloy during the Hot Compression Process

1
State Key Laboratory of Solidification Processing, Northwestern Polytechnical University, Xi’an 710072, China
2
Chongqing Innovation Center, Northwestern Polytechnical University, Chongqing 401135, China
3
Beijing Aeronautical Manufacturing Technology Research Institute, Beijing 100024, China
*
Author to whom correspondence should be addressed.
Metals 2021, 11(5), 824; https://doi.org/10.3390/met11050824
Submission received: 18 April 2021 / Revised: 14 May 2021 / Accepted: 16 May 2021 / Published: 18 May 2021

Abstract

:
Hot deformation behavior and the microstructural evolution of Inconel 625 superalloy plates are investigated by hot compression tests in a range of working temperatures (800–1050 °C) and strain rates (0.001–1 s−1). The microstructural observation shows that a strong <110> texture forms when the processing temperature is below 950 °C, whose intensity decreases with the increases of the temperature, and it disappears when compressing above 950 °C. During the compression test, twin-related dynamic recrystallization (DRX) occurs in the investigated temperature range, and the intensity of twin-related DRX increases with the increases of the temperature. In addition, as the temperature increases, the intensity of continuum DRX decreases.

1. Introduction

Inconel 625 (IN625) superalloy is widely used in the aviation industry, oil extraction and chemical processing, and other fields because of its great high-temperature strength, oxidation resistance, and corrosion resistance [1,2,3,4]. In recent years, demand for the great comprehensive mechanical properties of IN625 alloy has increased seriously with the continuous expansion of application areas. During processing, the microstructure and mechanical properties are greatly affected by the coupled thermo-mechanical effects [5]. Therefore, it is vital to meticulously analyze the deformation behavior of IN625 alloy at different temperatures and strain rates.
Several studies have focused on the microstructure evolution and recrystallization behavior of IN625 alloy [6,7,8,9]. Gao et al. [10] studied the influence of the twin boundaries on the microstructural evolution and mechanical behavior of IN625 alloy and found that twin boundaries not only be good for grain refinement of the alloy, but also strengthen the alloy by interface strength mechanism. The influence of heat treatment processes on IN625 processed by laser powder bed fusion (LPBF) has been studied [11,12], and the results show that the tensile property is greatly influenced by the texture and an appropriate heat treatment process can improve the tensile properties and oxidation resistance of IN625 alloy. The hot deformation behavior of IN625 alloy has been studied by torsion test in different temperature and strain rate [13]. Results show that the strain to the peak stress varies with the temperature or the strain rate, and the ductility of the target alloy is improved in a certain temperature range (1050–1100 °C). However, the microstructural evolution is controlled by dynamic recrystallization (DRX) in low-medium stacking fault energy alloys, such as austenitic stainless steel, copper alloy, and nickel-based superalloys [14], etc. Guo et al. [15] developed the microstructural mechanism map for IN625 alloy and found DRX grain growth when the temperature was in the range of 1150–1200 °C and strain rate was in the range of 0.01–0.1 s−1, and the results also showed that the second-phase particles and carbides can facilitate the DRX processing. Jia et al. [16] have studied the DRX nucleation mechanism of IN625 alloy. Conclusions show that the DRX mechanism varies with the deformation temperature, i.e., continuous DRX (cDRX) and discontinuous DRX (dDRX) are dominant under 1100 °C and above 1100 °C, respectively. Licci et al. [17] found that a large amount of Σ3 g boundaries accompanied by the DRX process, and their fraction is positively correlated to strain rate and temperature. Li et al. [18] found that dDRX dominates the nucleation of DRX, accompanied by cDRX. DRX behavior of IN625 alloy fabricated by directed energy deposition has been studied by Hu et al. [19], and the results agree well with the results from Ref. [16]. Meanwhile, during the hot spinning process, the deformation temperature and strain rate are both a little lower than that in the above studies, which is in the range of 800–1050 °C and 0.001–1 s−1, respectively. Most of the studies show that DRX is greatly sensitive to the deformation condition. However, there are few studies on the twin-related DRX and cDRX behaviors in the process of hot spinning of superalloy. Therefore, detailed studying for the DRX process of IN625 alloy is of great significance to control the actual spinning process.
In this work, the microstructural evolution under different temperatures (800–1050 °C) or different strain rates (0.001–1 s−1) was analyzed. The aim of this work is to analyze the deformation behavior and the microstructural evolution of IN625 alloy under different deformation behavior and introduces the constitutive model considering the DRX phenomenon in detail kinetics.

2. Experimental Procedure

The as-received material is a rolled IN625 sheet with a thickness of 15 mm, and it has been annealed at 960 °C for 30 min. The chemical composition of IN625 is listed in Table 1. As shown in Figure 1, samples were cut into cylinders with size of 8 mm diameter and 12 mm height subsequently. The symmetry axis of the cylindrical samples was perpendicular to the rolling surface of IN625 sheet, and all surfaces of the samples were refined to a surface roughness of 3.2. Then, the hot compression tests were carried out on the Thermecmaster-Z thermo-physical simulation platform in the temperature range of 800–1050 °C and the strain rate range of 0.001–1 s−1. The samples were heated to the target temperature with a rate of 10 °C/s and hold for 5 min. The samples were immediately gas-cooled to room temperature with a rate of 50 °C/s when the deformation rate reached 65%.
In order to study the microstructural evolution characteristic of IN625 alloy during hot compression, the deformed samples were cut along the compression direction and the section was ground with sandpaper followed by mechanical polishing. Subsequently, the samples were electrolytically polished by using the electrolyte containing 5% hydrochloric acid alcohol solution on STRUERS Electrolytic Polisher, and the polishing voltage and temperature were 15 V and 10 °C, respectively. Then, electron backscattered diffraction (EBSD) analysis was performed in a Zeiss-Sigma500 scanning electron microscope, and the accelerating voltage is 20 kV. Finally, the EBSD results were analyzed using the Channel 5 software. The fraction of grain boundaries (GBs) with different misorientation can be extracted from the EBSD results, and the interval was divided by 1° to ensure the accuracy of the statistical results. It is considered that GBs with a misorientation less than 15° are low angle grain boundaries (LAGBs) [20,21,22], and GBs with misorientation in the range of 2°–5° are defined as sub-grain boundaries (SGBs) [23]. In order to count the slight deviation of the twin boundaries (TBs) as much as possible, GBs with misorientation in the range of 60° ± 3° are defined as TBs [24]. The fractions of LAGBs, SGBs, and TBs can be calculated from the previously derived statistical results of fraction of GBs with different misorientation.
The experimental temperatures and strain rates were selected and listed in Table 2 due to the temperature range of the actual spinning process is about 800–950 °C and the maximum strain rate is about 0.5 s−1.

3. Results and Discussion

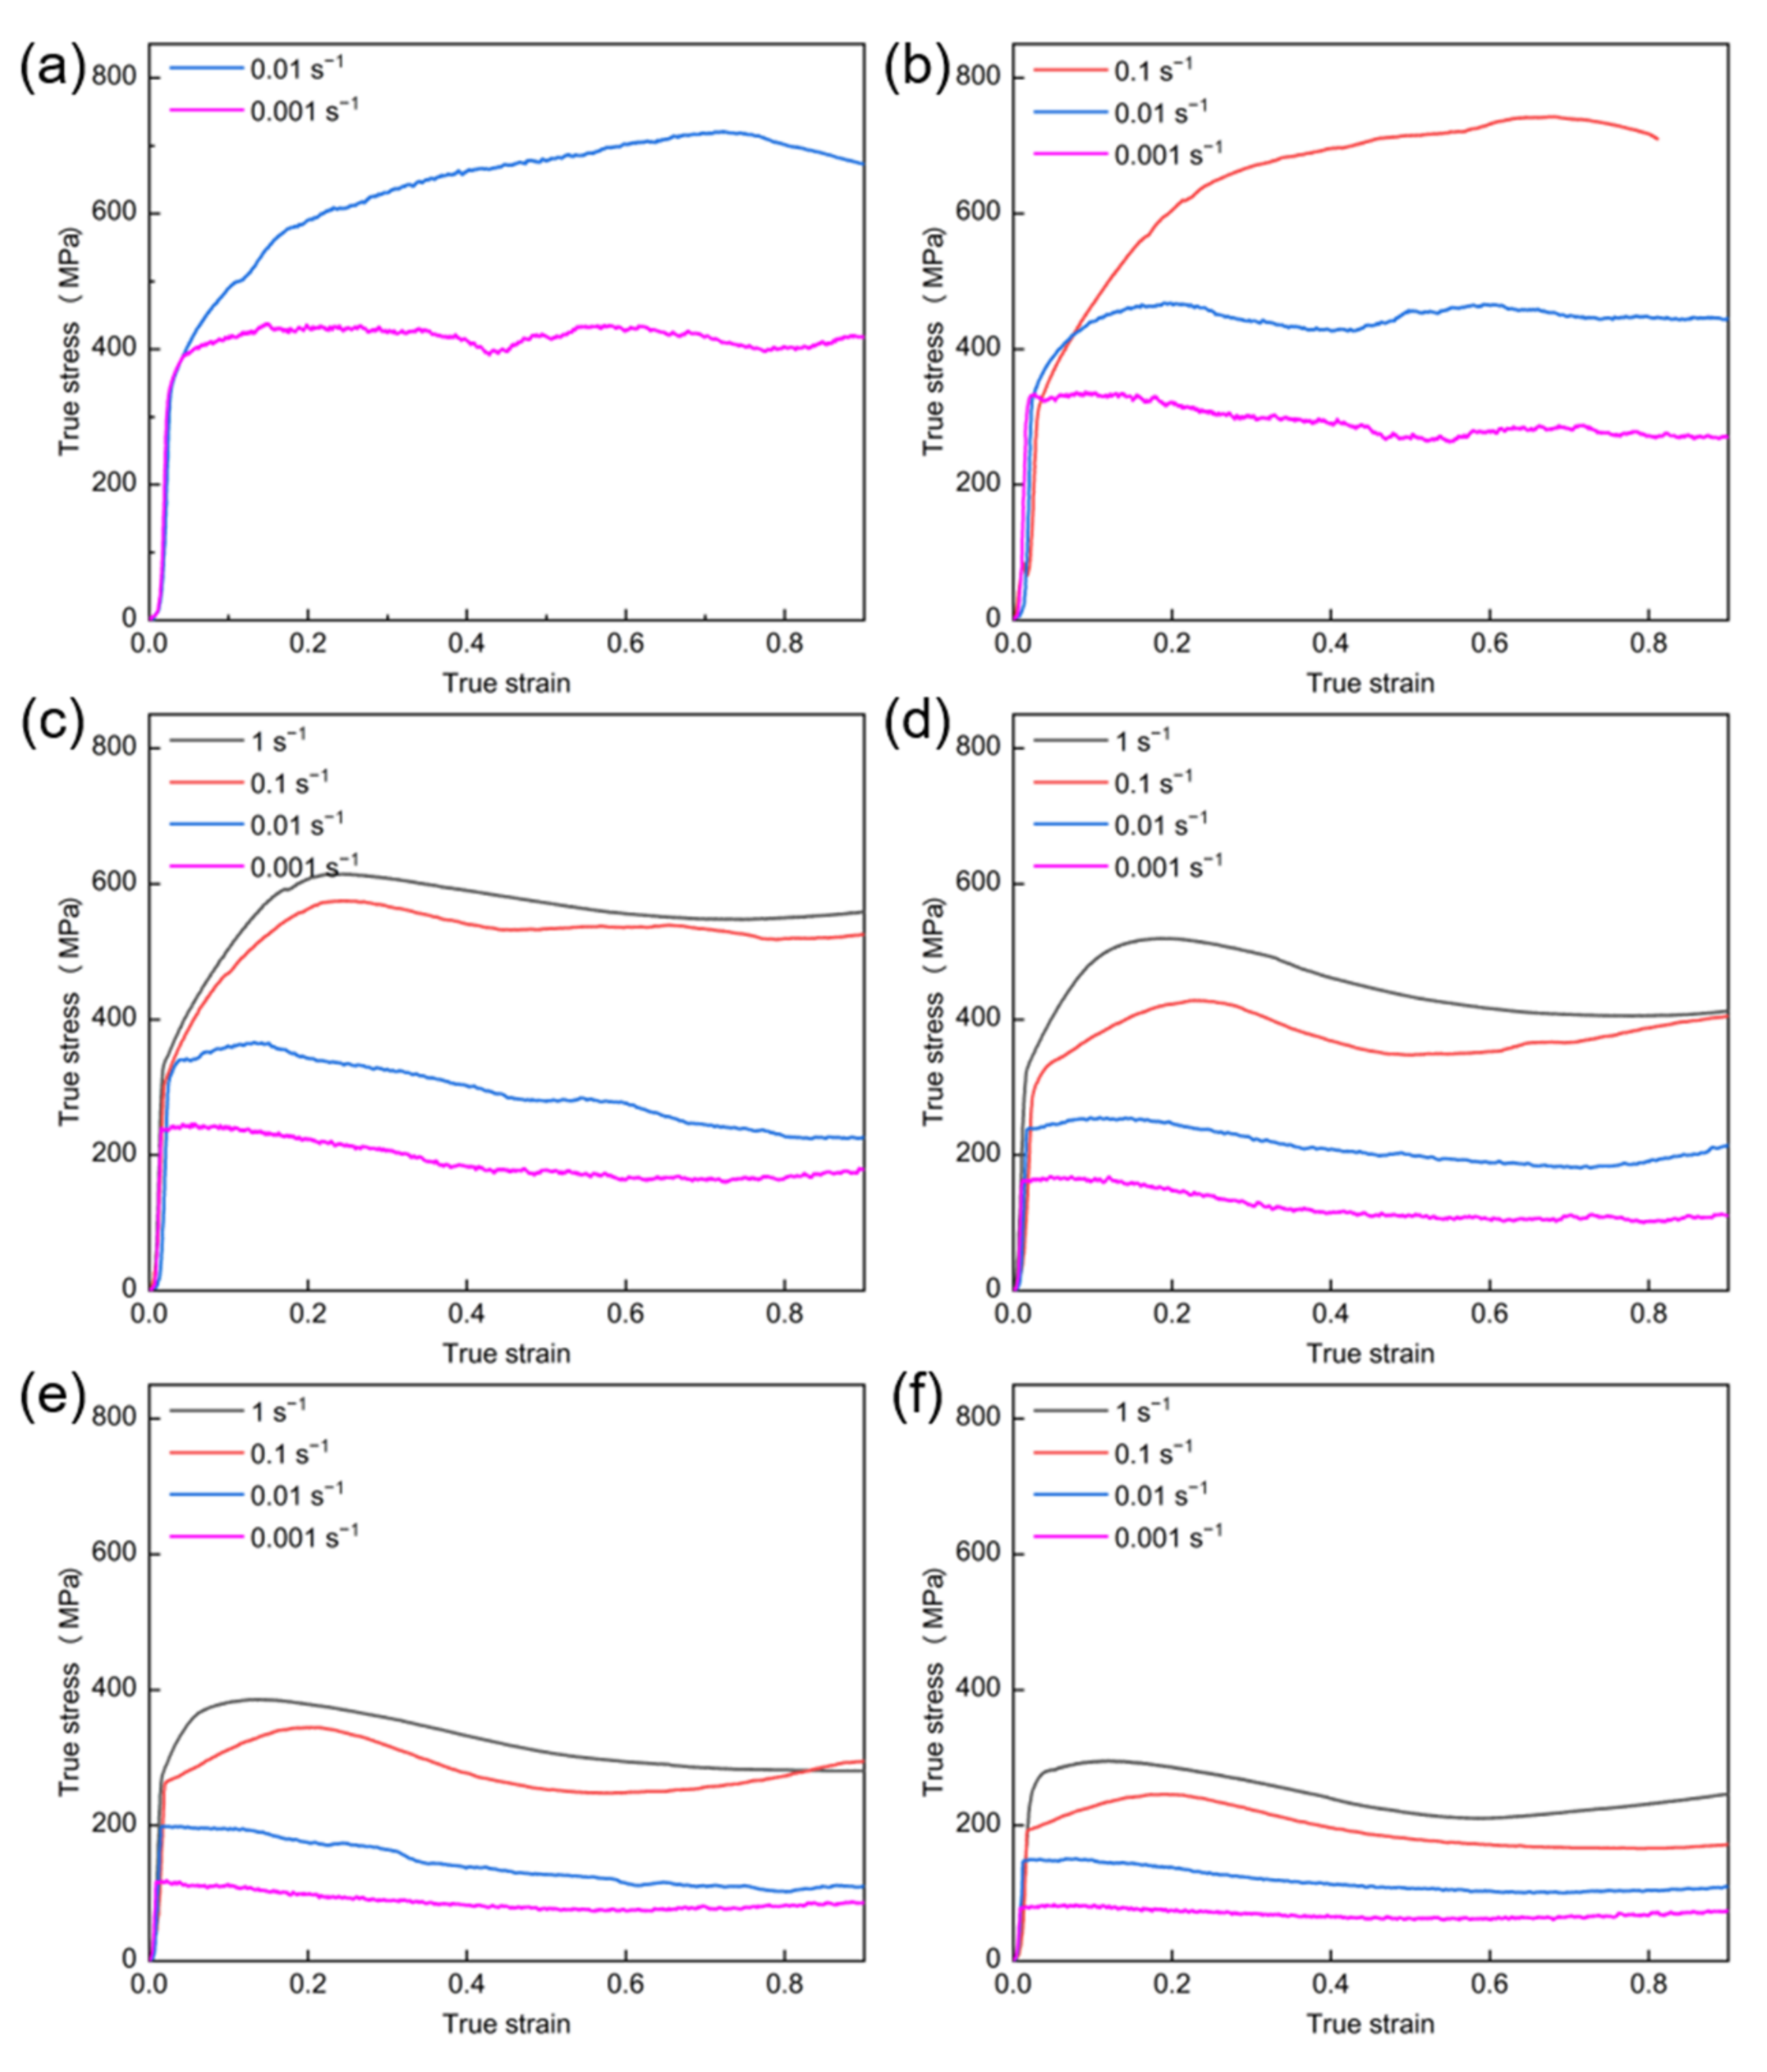
3.1. Deformation Behavior

Before the compression tests, a compression attempt was made at 800 °C, 1 s−1, and it was found that the strength of the sample was too high under this condition, the test machine power reached the limit in advance. In order to ensure the safety of the machine, in addition to the trial condition, the compression test has not been selected at 800 °C, 0.1 s−1 and 850 °C, 1 s−1, therefore, three curves are omitted in Figure 2a,b. All the test stress–strain curves at different temperatures and strain rates of IN625 superalloy are shown in Figure 2. It can be seen that the flow stress is seriously sensitive to temperature and strain rate. With the increase of the temperature or decrease of the strain rate, the stress significantly decreases. At the initial stage of deformation, obvious strain hardening causes stress to increase sharply, and the strain hardening rate gradually decreases to zero at the same process, and the stress reaches a peak. After that, the alloy softens due to recrystallization, and the stable flow stress is reached. Then, with the increase of temperature, the softening and hardening effects of IN625 alloy are increasingly weaker. However, under the condition with a low temperature and strain rate (800 °C, 0.001 s−1; 850 °C, 0.01 s−1 and 0.001 s−1; 900 °C, 0.1 s−1 and 0.01 s−1), the curve has obvious fluctuations (Figure 2a–c), caused by the poor stability at low temperatures and friction between the indenter and the specimen.
In general, nickel-based superalloy is considered to be the low stacking fault energy alloy, the high-temperature deformation is controlled by the discontinuous DRX, and the flow stress curves show an obvious dynamic softening effect [25]. Therefore, the flow stress curves show a three-stage (hardening-softening-stable) features. It is worth noting that dislocation creep is the dominant deformation mechanism during the high-temperature deformation process, so inconspicuous elastic deformation occurs in the process, and small stress will cause the inelastic deformation of the alloy. Yield strength of the alloy depends on the rate-independent creep threshold stress which is related to temperature. The creep threshold stress is assumed to be zero in this work, so the alloy shows complete visco-plastic features. Moreover, as shown in Figure 2d–f, the stress–strain curves tilt up at the end of the deformation, which is due to the friction between indenter and sample. Therefore, the correction is necessary to ensure that the compression process of the alloy is uniaxial compression. The friction coefficient is introduced into the calculation of the stress, such that:
σ = F π r 2 1 + m 3 3 2 r l
where F is the deformation force, r the instantaneous average radius, m the friction coefficient, and l the instantaneous length of the sample. The friction coefficient m can be calculated as follows:
m = R / H b 4 / 3 2 b / 3 3
where R is the deformed average radius, H the deformed height of the sample, and b the barrier coefficient. Then, b can be estimated by the following formula:
b = 4 Δ R R H Δ H
where △R is the difference between the radius of the end of the sample and the radius of the bulge, △H the reduction of the height of the sample. The flow stress curve under the condition of 1050 °C/0.01 s−1 is corrected by the above three formulas, and the new curve is shown in Figure 3. After the friction correction, the flow stress curve reaches a stable state at the end of the deformation.
The high-temperature deformation of metal is a typical thermal activation process. In general, the high-temperature deformation mechanism of metal is dislocation creep under the condition of high temperature or low stress, and the stress and strain rate follow the power law. Meanwhile, the power law is failed under the condition of low temperature or high stress, which is thought to be the transition from power law creep to the thermally activated slip of the dislocations. In order to describe the power law creep and the power law failure, a hyperbolic sine equation is adopted to quantitatively describe the relationship between stress and strain rates [26].
ε ˙ = A [ sinh ( α σ ) ] n exp ( Q R T )
When ασ < 0.8, the power-law creep stage, Equation (4) can be written as
ε ˙ = B σ n
When ασ > 0.8, the power-law failure stage, Equation (4) can be written as
ε ˙ = B exp ( β σ )
where ε ˙ is the strain rate, A the structure factor, α the stress level parameter, σ the peak stress or stable stress, n the stress component, Q the activated energy, R the gas constant, and T the absolute temperature. Taking the logarithm of both sides of Equations (5) and (6), respectively, gives:
ln ε ˙ = n ln σ + ln B
ln ε ˙ = β σ + ln B
All experimental peak stresses are listed in Table 3, and the relationships between the peak stress and strain rate are shown in Figure 4a,b. The values of n′ and β are the slopes of the parallel straight lines in the ln ε ˙ - ln σ and ln ε ˙ - σ plots, respectively. Using the linear fitting method, the values of n′ and β are calculated, and then the α is calculated from α = β/n′ = 0.003475.
Take the natural logarithm of Equation (1) and rearrange it as [27]
Q = R ln ε ˙ ln [ sinh ( α σ ) ] T × ln [ sinh ( α σ ) ] ( 1 / T ) ε ˙
Figure 4c,d show the variation of strain rate with the stress level and the variation of the stress level with the reciprocal of temperature, respectively. Activated energy Q can be calculated by the slopes of the Figure 4c,d, which is 394 kJ/mol. The Zener-Hollomon parameter [28], i.e., the temperature compensated strain rate parameter is expressed as
Z = ε ˙ exp ( Q R T )
Then, introduce Equation (4) into Equation (8) to get the relationship of ln Z - ln sinh ( α σ ) :
ln Z = ln A + n ln sinh ( α σ )
Introduce peak stress into the above formula to get the variation of ln Z with ln sinh ( α σ p ) (Figure 5), and by linear fitting method, the values of A and n can be computed as 7.41 × 10¹⁴ and 4.12, respectively. Then, rearranging the Equation (8) gives
σ = 1 α ln A Z 1 / n + A Z 2 / n + 1 0.5
Introducing the value that has been calculated according to the above formula, the thermal deformation kinetics equation of IN625 alloy is obtained:
σ = 1 0.003475 ln Z 7.41 × 10 14 1 / 4.12 + 1 + Z 7.41 × 10 14 2 / 4.12 0.5
In addition, the calculated activation energy of IN625 is 394 kJ/mol, which is larger than the self-diffusion activation energy of pure Ni. It is generally believed that the dynamic recovery is the dominant softening mechanism when the thermal deformation activation energy and diffusion activation energy are not much different, while DRX is the dominant high-temperature softening mechanism in the opposite case. Therefore, the high-temperature deformation mechanism of IN625 alloy is DRX. In addition, the stress exponent of IN625 alloy is 4.12, and the stress exponent of dislocation creep is usually in the range of 4–5, so the dominant deformation mechanism of IN625 alloy is dislocation creep.

3.2. Microstructural Evolution during Hot Compression Process

The initial microstructure of IN625 alloy is shown in Figure 6. It can be seen that the microstructure of IN625 alloy consists of equiaxed γ grains and a large number of twins with an average diameter of 19 μm. Since the nickel-based superalloy has low stacking fault energy, a large number of annealing twins tend to form after deformation and annealing treatment. The fractions of LAGBs, high angle grain boundaries (HAGBs) and TBs were 7.98%, 29.34% and 62.68%, respectively. As show in Figure 6c, there is no obvious texture in the microstructure after annealing, and the maximum pole density strength is about 6.7.

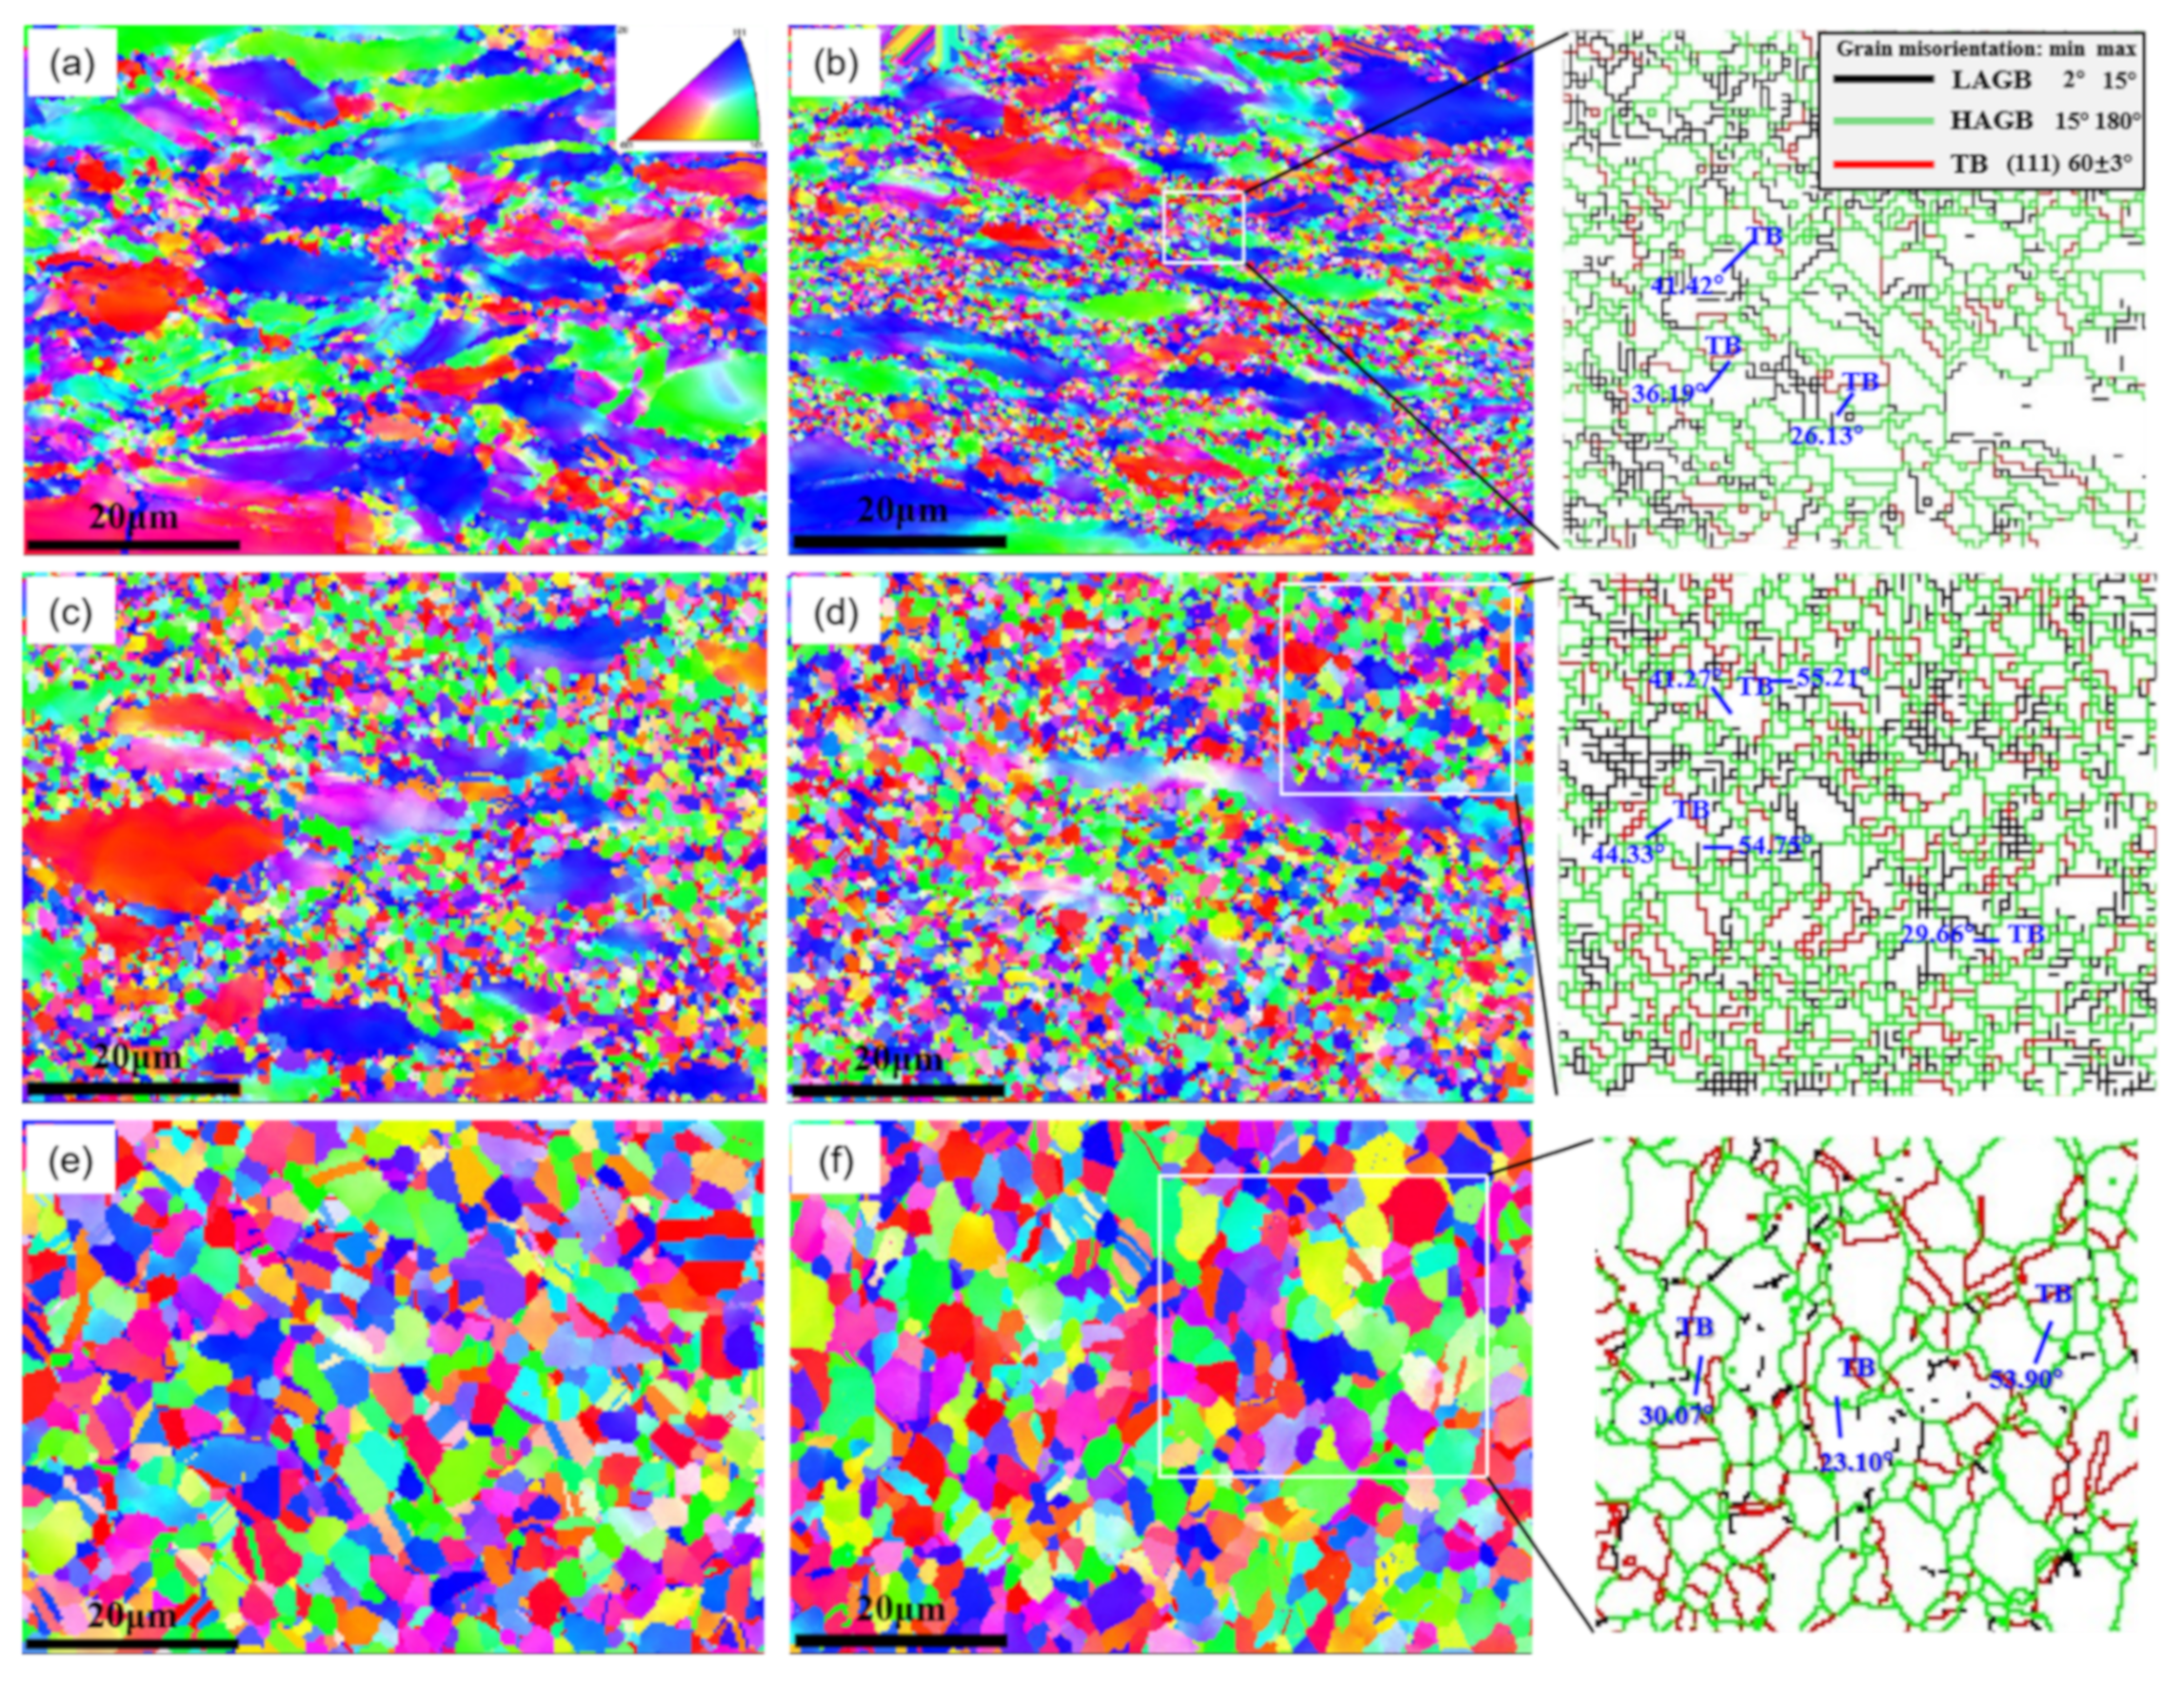
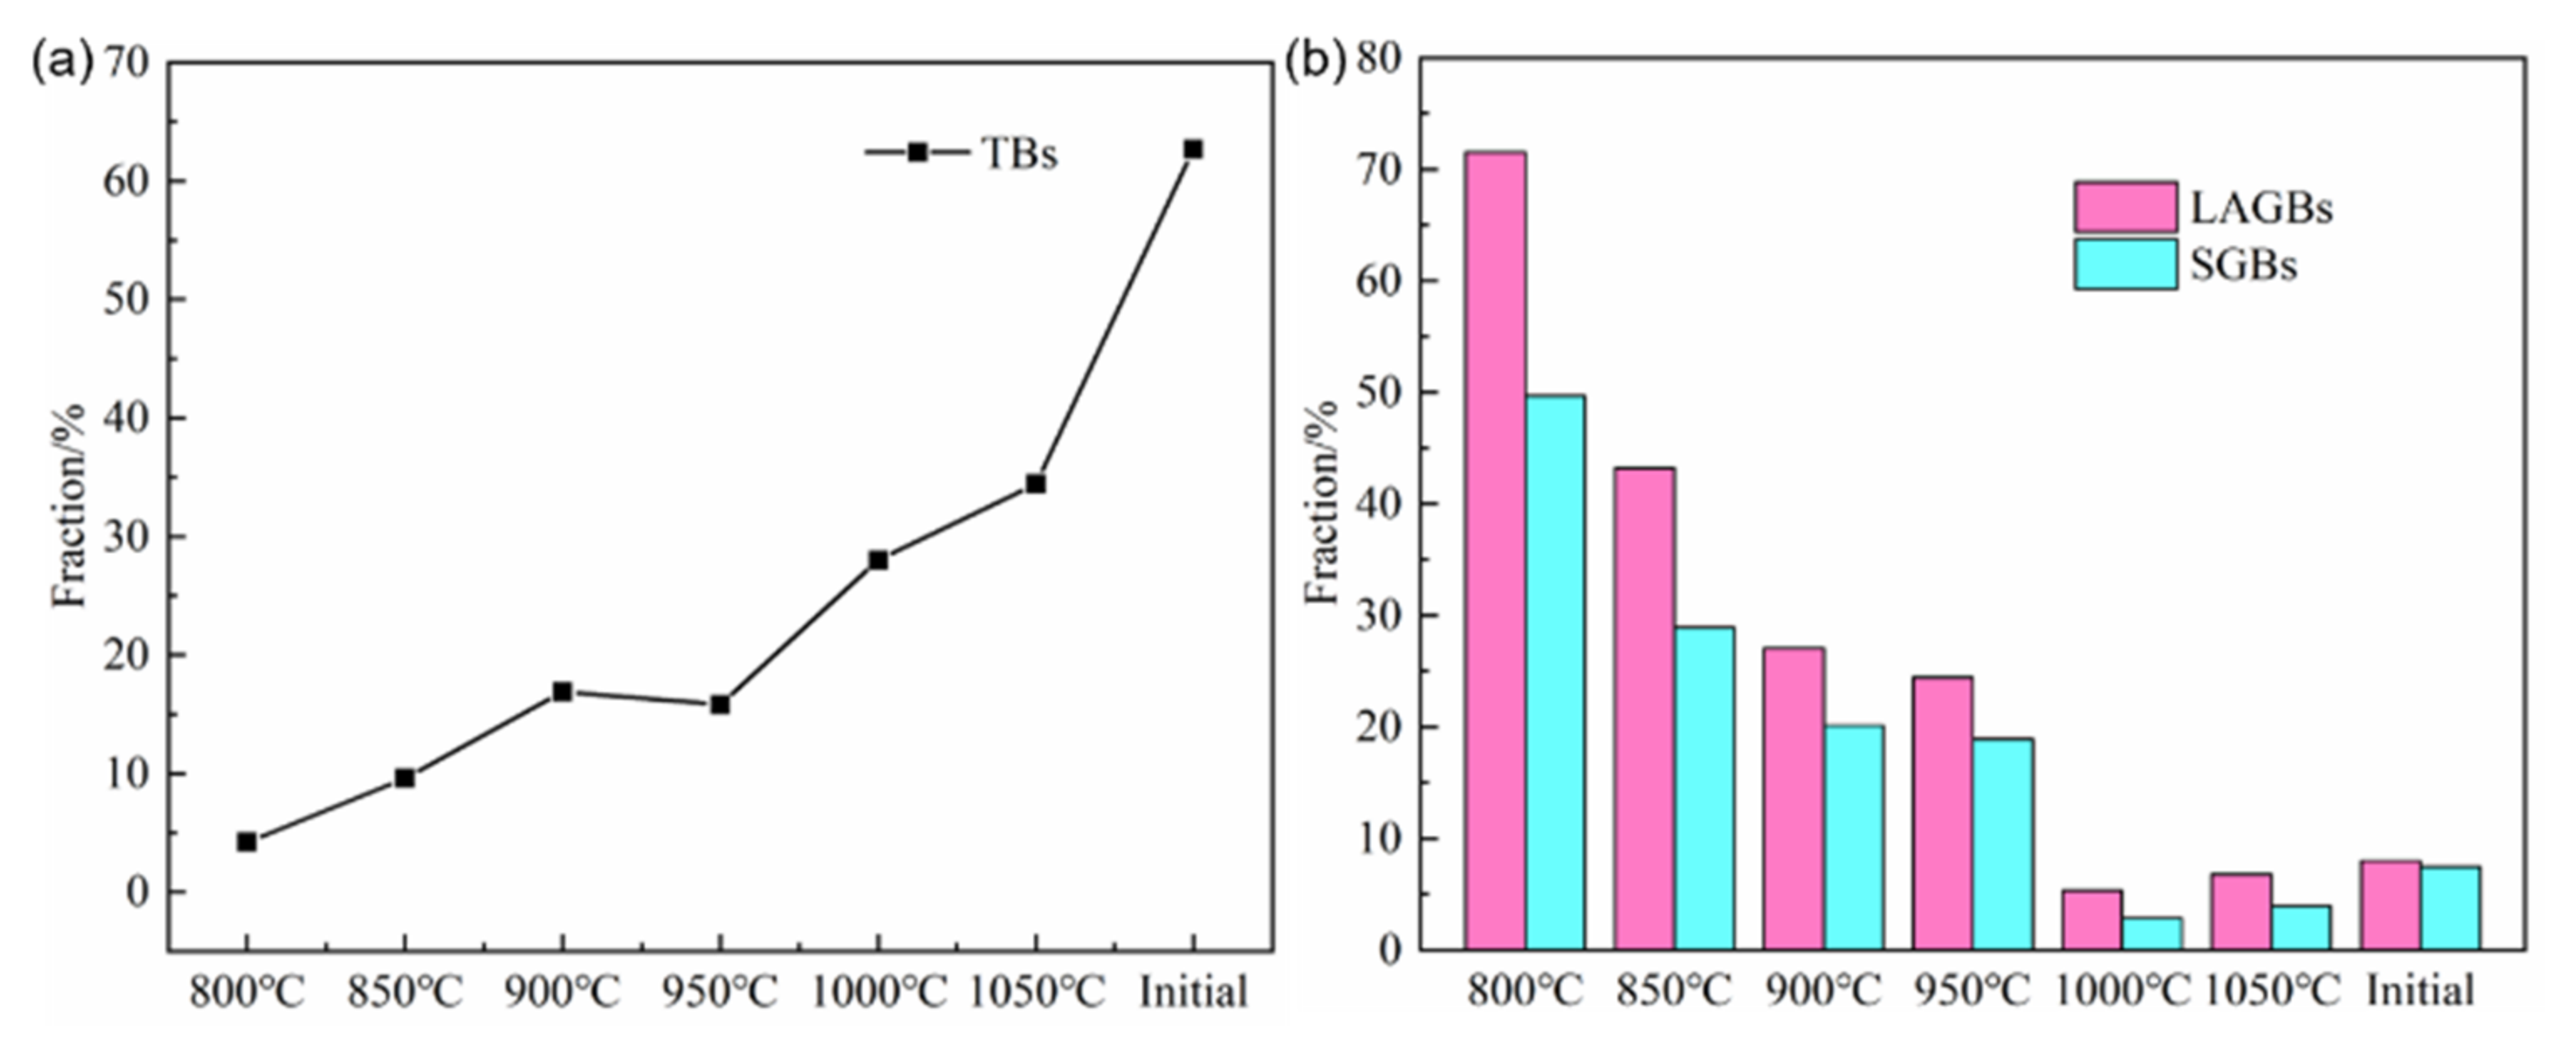
3.2.1. Effects of Deformation Temperature on the Microstructure Evolution

EBSD maps of the microstructure under different deformation temperatures with a constant strain rate of 0.01 s−1 are shown in Figure 7. It can be seen that large grains are elongated after deformation under relatively low temperatures (Figure 7a–c), while a lot of chain-like small DRX grains surrounded the large, deformed grains. When deforming at 950 °C, the DRX process is nearly completed and almost all of the large grains disappear. As shown in Figure 7d, a uniform microstructure with small size grains and random orientations can be obtained. Further increase the deformation temperature to 1000 °C and 1050 °C, the DRX grains grow up rapidly (Figure 7e,f). The grain misorientations shown in enlarged parts exhibit that twin-related DRX occurs during the compressing process. TBs were produced in the parent grains due to the migration of grain boundaries accompanied by the grain boundary bulging.
Figure 8 shows the grain boundary distribution of the microstructure after hot compression. The fraction of TBs increases with the increases of the temperature, it can be concluded that the intensity of twin-related DRX increases with the increases of the temperature. It is also found that the size of twins is small when the temperature is low, and large when the temperature is high (Figure 7b,d,f). So, the twin morphology changes a little when the temperature increases and there may be a different mechanism of twin-related DRX. When cDRX occurs, subgrains composed of LAGBs will form and then rotate, causing the LAGBs to transform into HAGBs. In other words, LAGBs can be used as a feature of cDRX of the alloy. Simultaneously, the fraction of LAGBs decreases with the increases of the temperature, and the ratio between SGBs and LAGBs is larger than 1/2, which further illustrates the changes in cDRX. Therefore, it can be seen that the intensity of cDRX decreases with the increases of the temperature.
The pole figures of the microstructure corresponding to Figure 7 are shown in Figure 9. It was found that there is a significant <110> texture appears when compressing in the temperature range of 800–900 °C (Figure 9a–c). When the deformation temperature is up to 950 °C, the <110> texture gradually disappears (Figure 9d–f). The maximum pole density decreases monotonously from 6.67 at 800 °C to 2.04 at 1000 °C. Note that the <110> texture induced by deformation below 900 °C will be eliminated by a higher temperature DRX process.

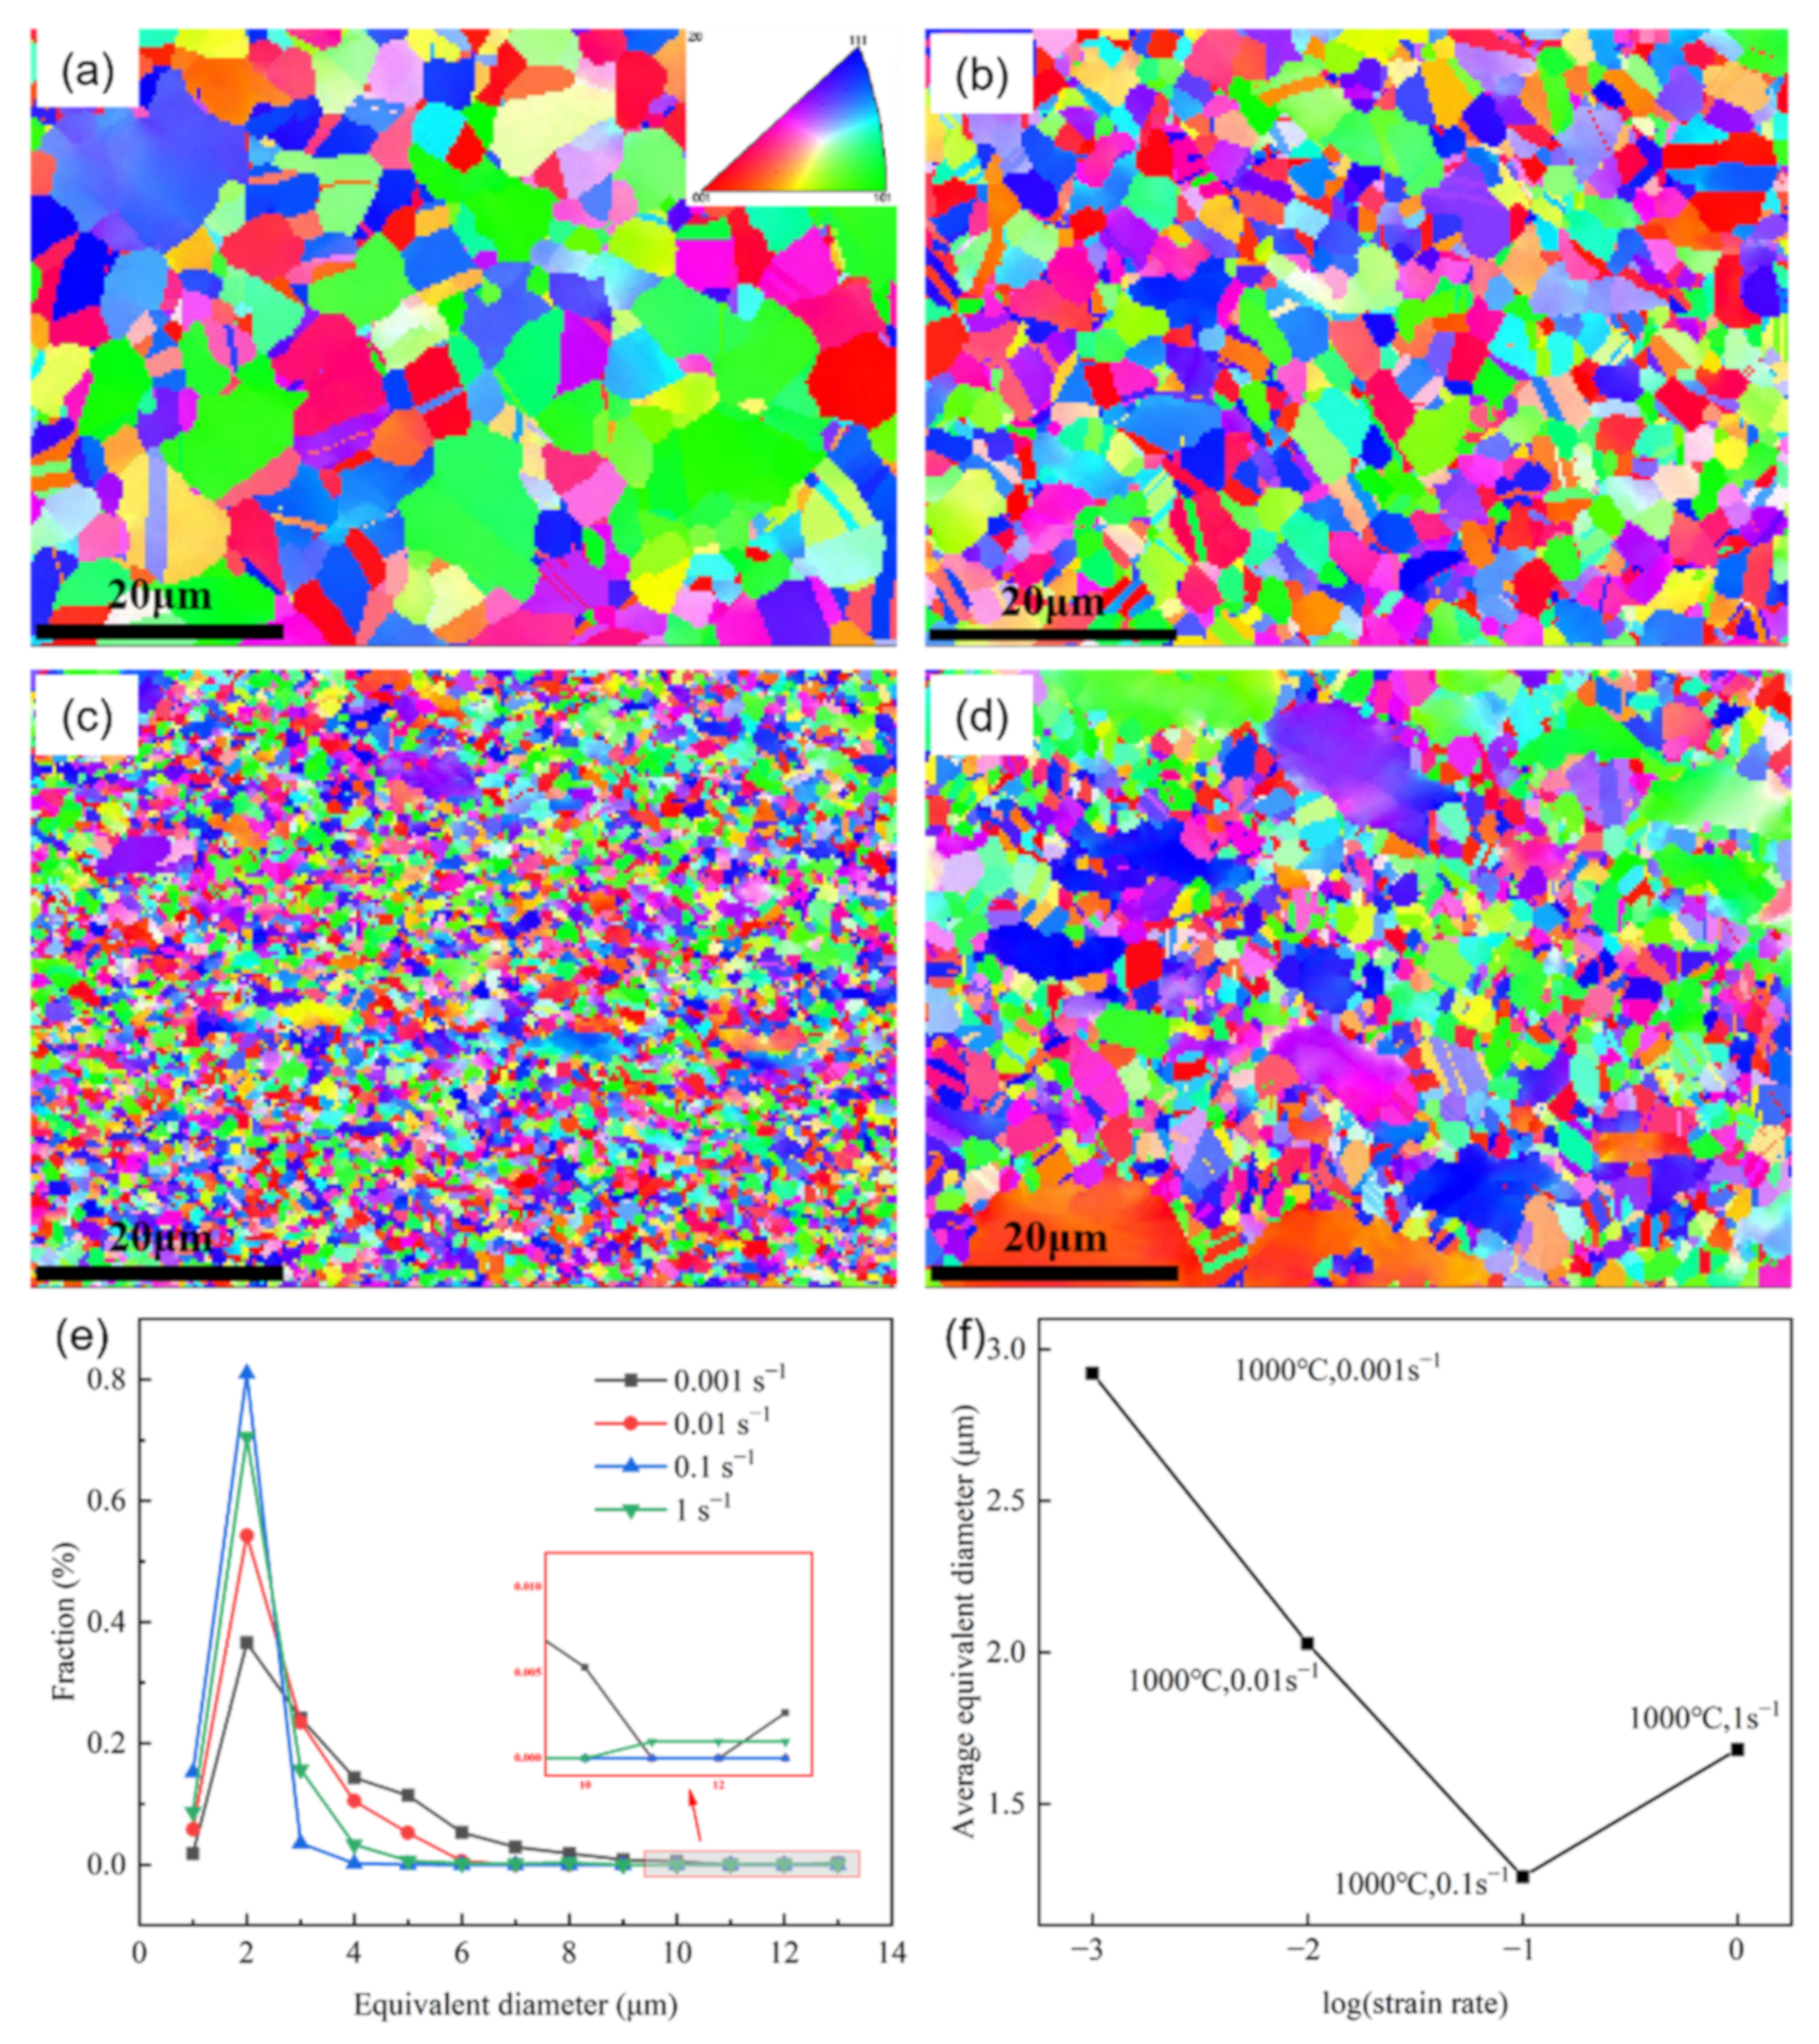
3.2.2. Effects of Strain Rate on the Microstructure
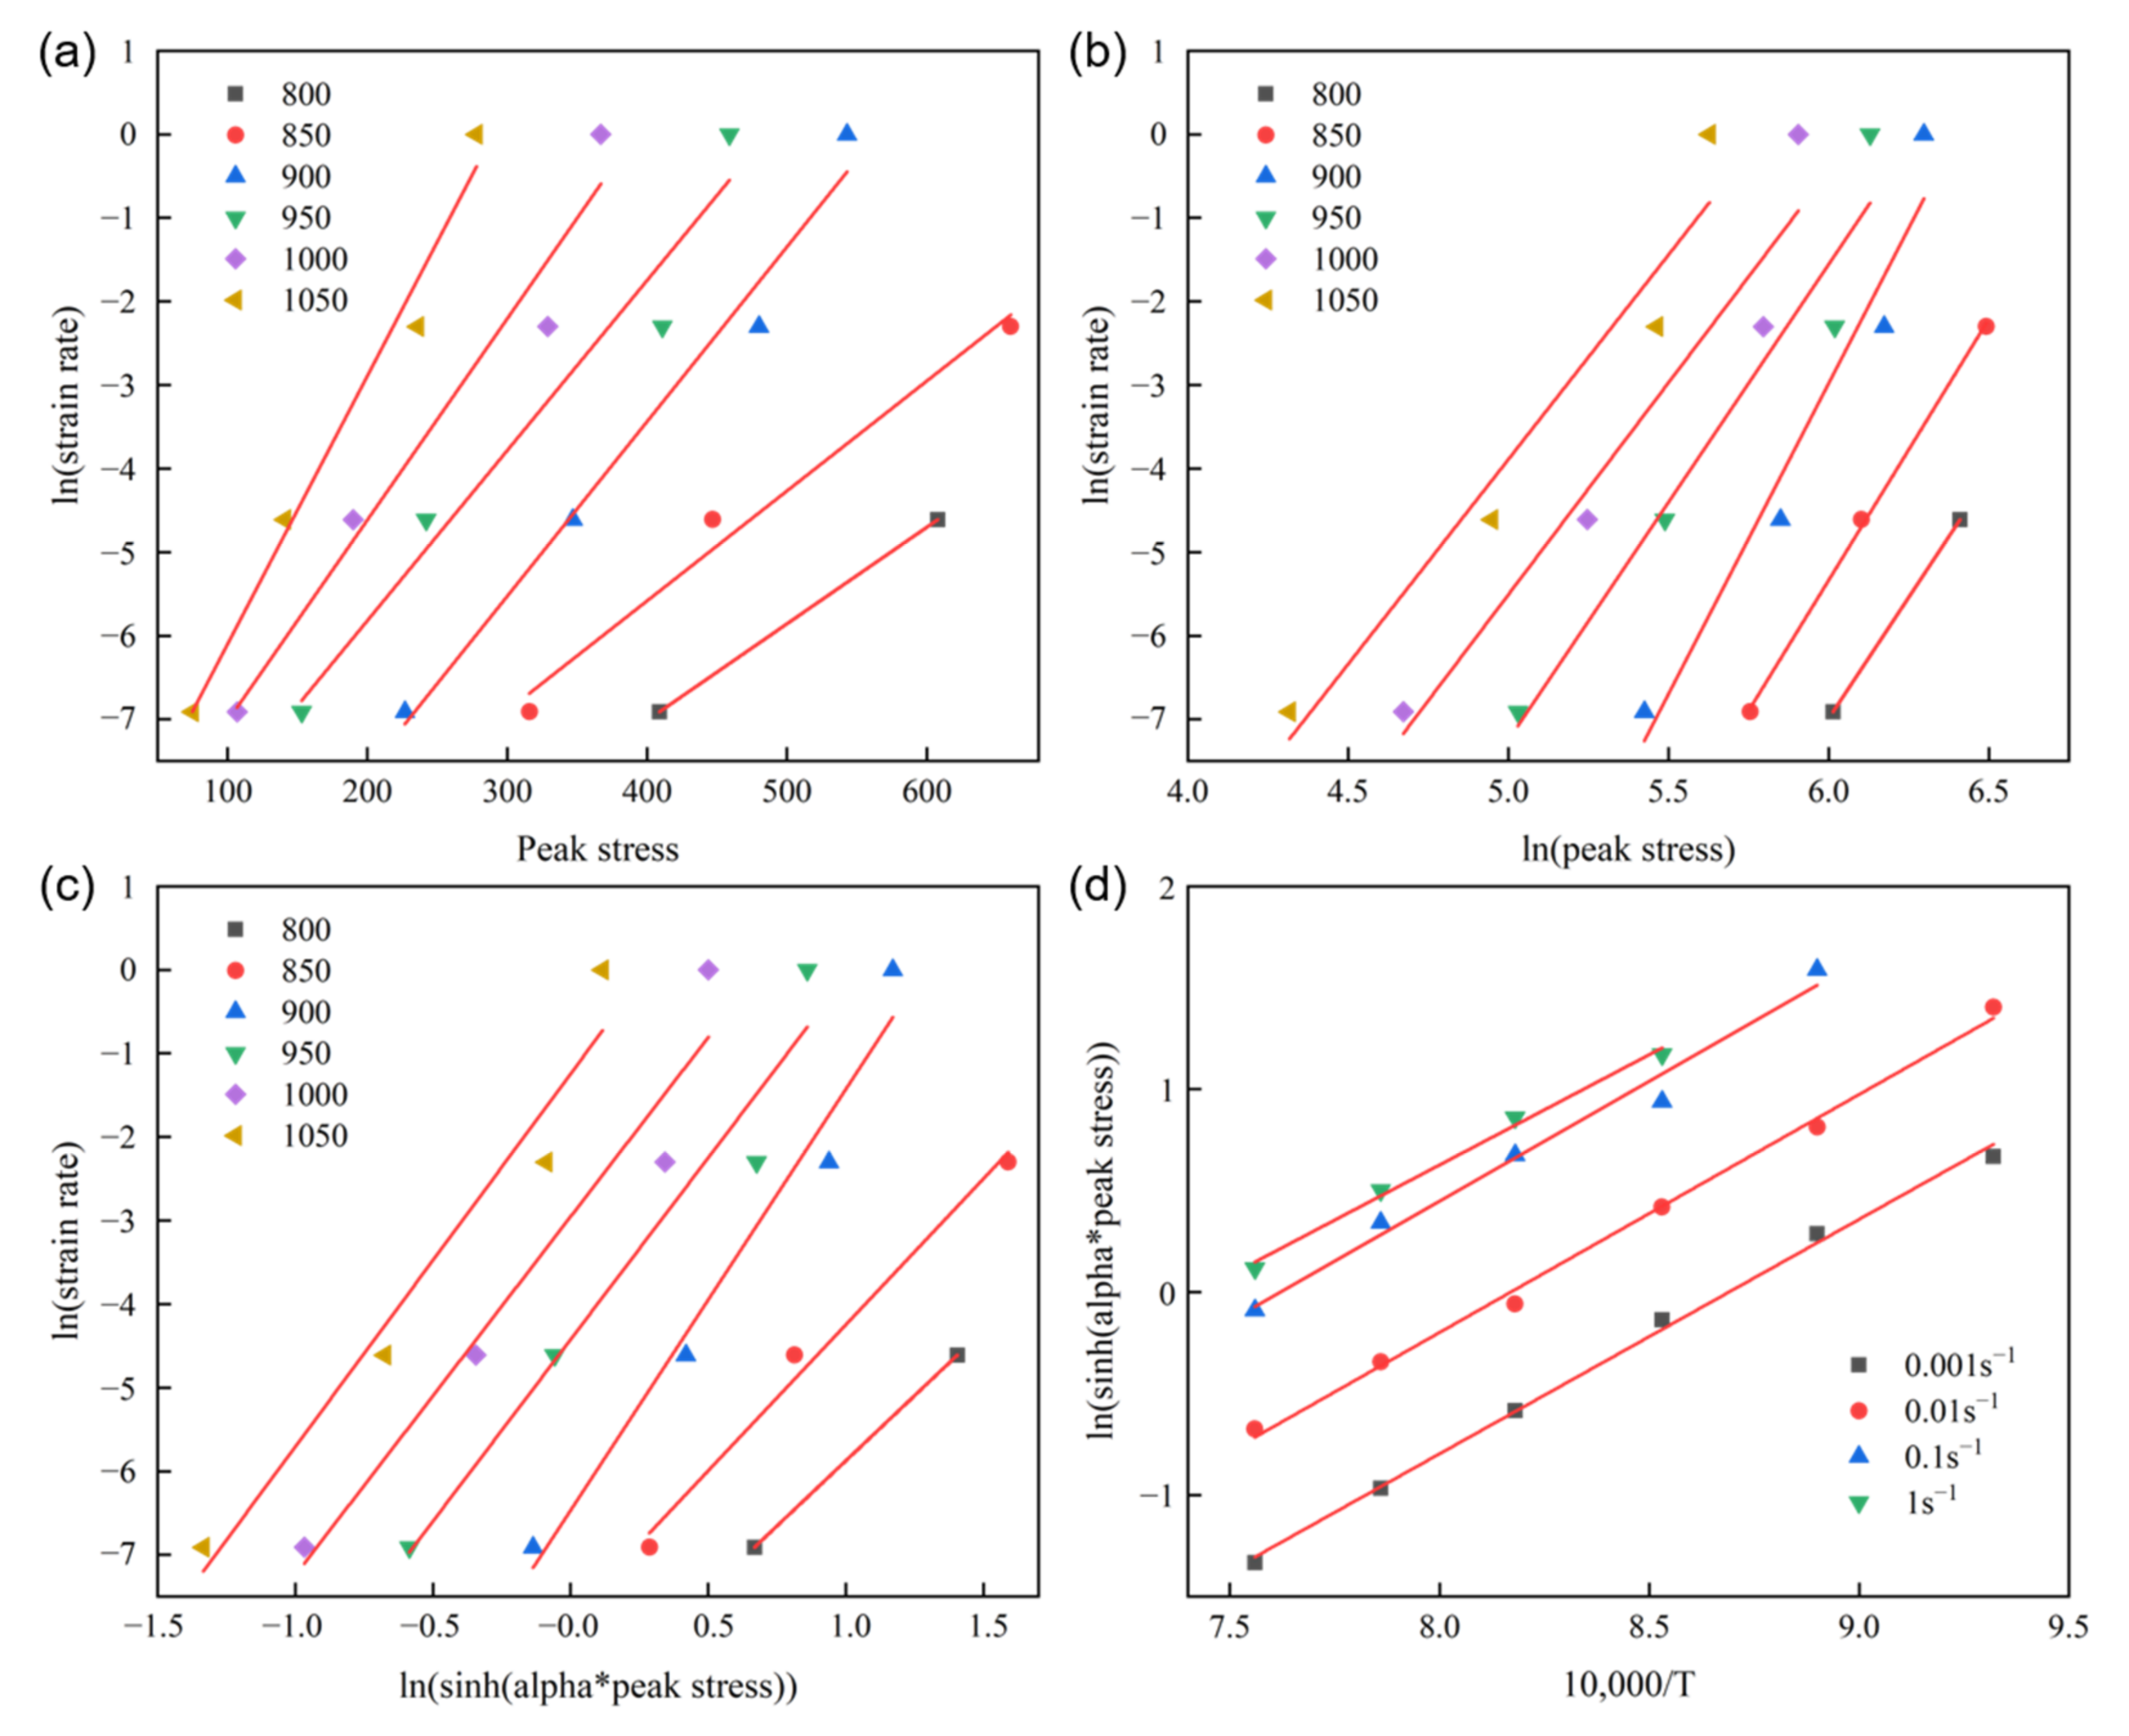
EBSD maps of the microstructure under different strain rates with the same deformation temperature are shown in Figure 10a–d. The equivalent diameter of grains was counted by Channel 5 software. As the EBSD maps were got with a step size of 0.3 μm, in order to ensure the statistical accuracy of the equivalent diameter of the grain, the grains whose equivalent diameter is less than three times the step size are ignored. The distribution of equivalent diameter of grains and variation of the averaged equivalent diameter of grains are shown in Figure 10e,f. It can be seen that, with the increase of the strain rate, the average equivalent diameter of grains decreases sharply, while the equivalent diameter is slightly increased when the strain rate is 1 s−1 (Figure 10f). When the strain rate during the hot deformation process is small, DRX is completed, and the grains have plenty of time to grow up and vice versa. So, there are many elongated grains in the microstructure that have not had time to recrystallize when the strain rate is 0.1 s−1 or 1 s−1 (Figure 10c,d). It can also be seen from Figure 10e that when the strain rate is large, the fraction of small-sized grains is large. PF of each microstructure under different condition corresponding to the EBSD maps in Figure 10 is shown in Figure 11. When the strain rate is 0.001 or 0.01, the <110> texture disappears and the maximum pole density is small when the average size of the grains is small, which is same as the results in Section 3.2.1. In addition, some elongated grains lead to the large maximum pole density (Figure 11c,d).
The content of grain boundary with different types corresponding to the microstructure in Figure 10 is counted, as shown in Figure 12. When complete DRX occurs, the ratios between LAGB and TB remain basically constant, which are 0.19 (0.001 s−1) and 0.199 (0.01 s−1).

3.3. DRX Kinetics

The flow stress decreases as DRX occurs when the deformation exceeds the critical strain. Therefore, the DRX kinetic curve can be described by the following formula [29]:
X d r x = σ d r v σ σ d r v s s σ d r x s s
where Xdrx is the DRX fraction. For simplicity, the extrapolated saturation stress is assumed to be the peak stress in this study. Generally, the critical strain for DRX is about 0.8εp, and according to the above assumptions, the critical strain is equal to the peak strain. Therefore, Equation (14) can be rewritten as
X d r x = σ p σ σ p σ s s
where σss denotes the stable flow stress.
The typical DRX curve is shown in Figure 13. It can be seen that the curves are S-shaped, and the velocity of DRX is fast and then slow. With the increase of the temperature or the decrease of the strain rate, the incubation period of DRX is shortened.
Additionally, the DRX fraction can be described by the JMA formula:
X d r x = 1 exp k ε ε c ε p n
where k the material parameter and n the Avrami exponent. As the critical strain is assumed to be equal to the peak strain in this study, Equation (16) can be rewritten as
X d r x = 1 exp k ε ε p ε p n
All DRX curves can be obtained by Equation (15) and then are fitted by Equation (17) to obtain the parameters k and n as listed in Table 4.
It can be seen from Table 4 that most of the parameter k is in the range of 0.1–0.2 except for some great deviation value, and there is no significant relationship between k and temperature or strain rate. Therefore, k is averaged as 0.16 in this study. Similarly, n is weakly dependent on temperature and strain rate under the tested condition in this work, because that most of the Avrami constants n is in the range of 1–2 and the average value of n is 1.56. According to the JMA equation, the DRX process is the one-dimensional nucleation and growth process of grains.
The activation energy has been calculated to 394 kJ/mol in Section 3.1, so Z parameter can be calculated by the following formula:
Z = ε ˙ exp 394000 R T
The variation of peak strain with Z parameter calculated from Equation (18) is shown in Figure 14. Obviously, the variation in peak strain and Z value exhibited a good linear correlation. The dependence of the peak strain on Z parameter is described by the following formula:
ε p = A p Z n p
where Ap and np are both material parameters.
By linear fitting, Ap and np are calculated to be 0.00126 and 0.138, respectively. It is obvious that the peak strain increases with the increases of Z parameter and is proportional to Z 0.138 . Therefore, the equation for the peak strain versus Z parameter of IN625 alloy can be written as
ε p = 0.00126 Z 0.138
The critical strain for the occurrence of DRX is proportional to the peak strain [30]. Therefore, it is believed that as the temperature increases or the strain rate decreases, the critical strain decreases, and the initiation of DRX would be earlier.

4. Conclusions

In this work, the microstructural evolution during high-temperature uniaxial compression has been studied and a reasonable constitutive model has been established. The main conclusions are as follows:
(1)
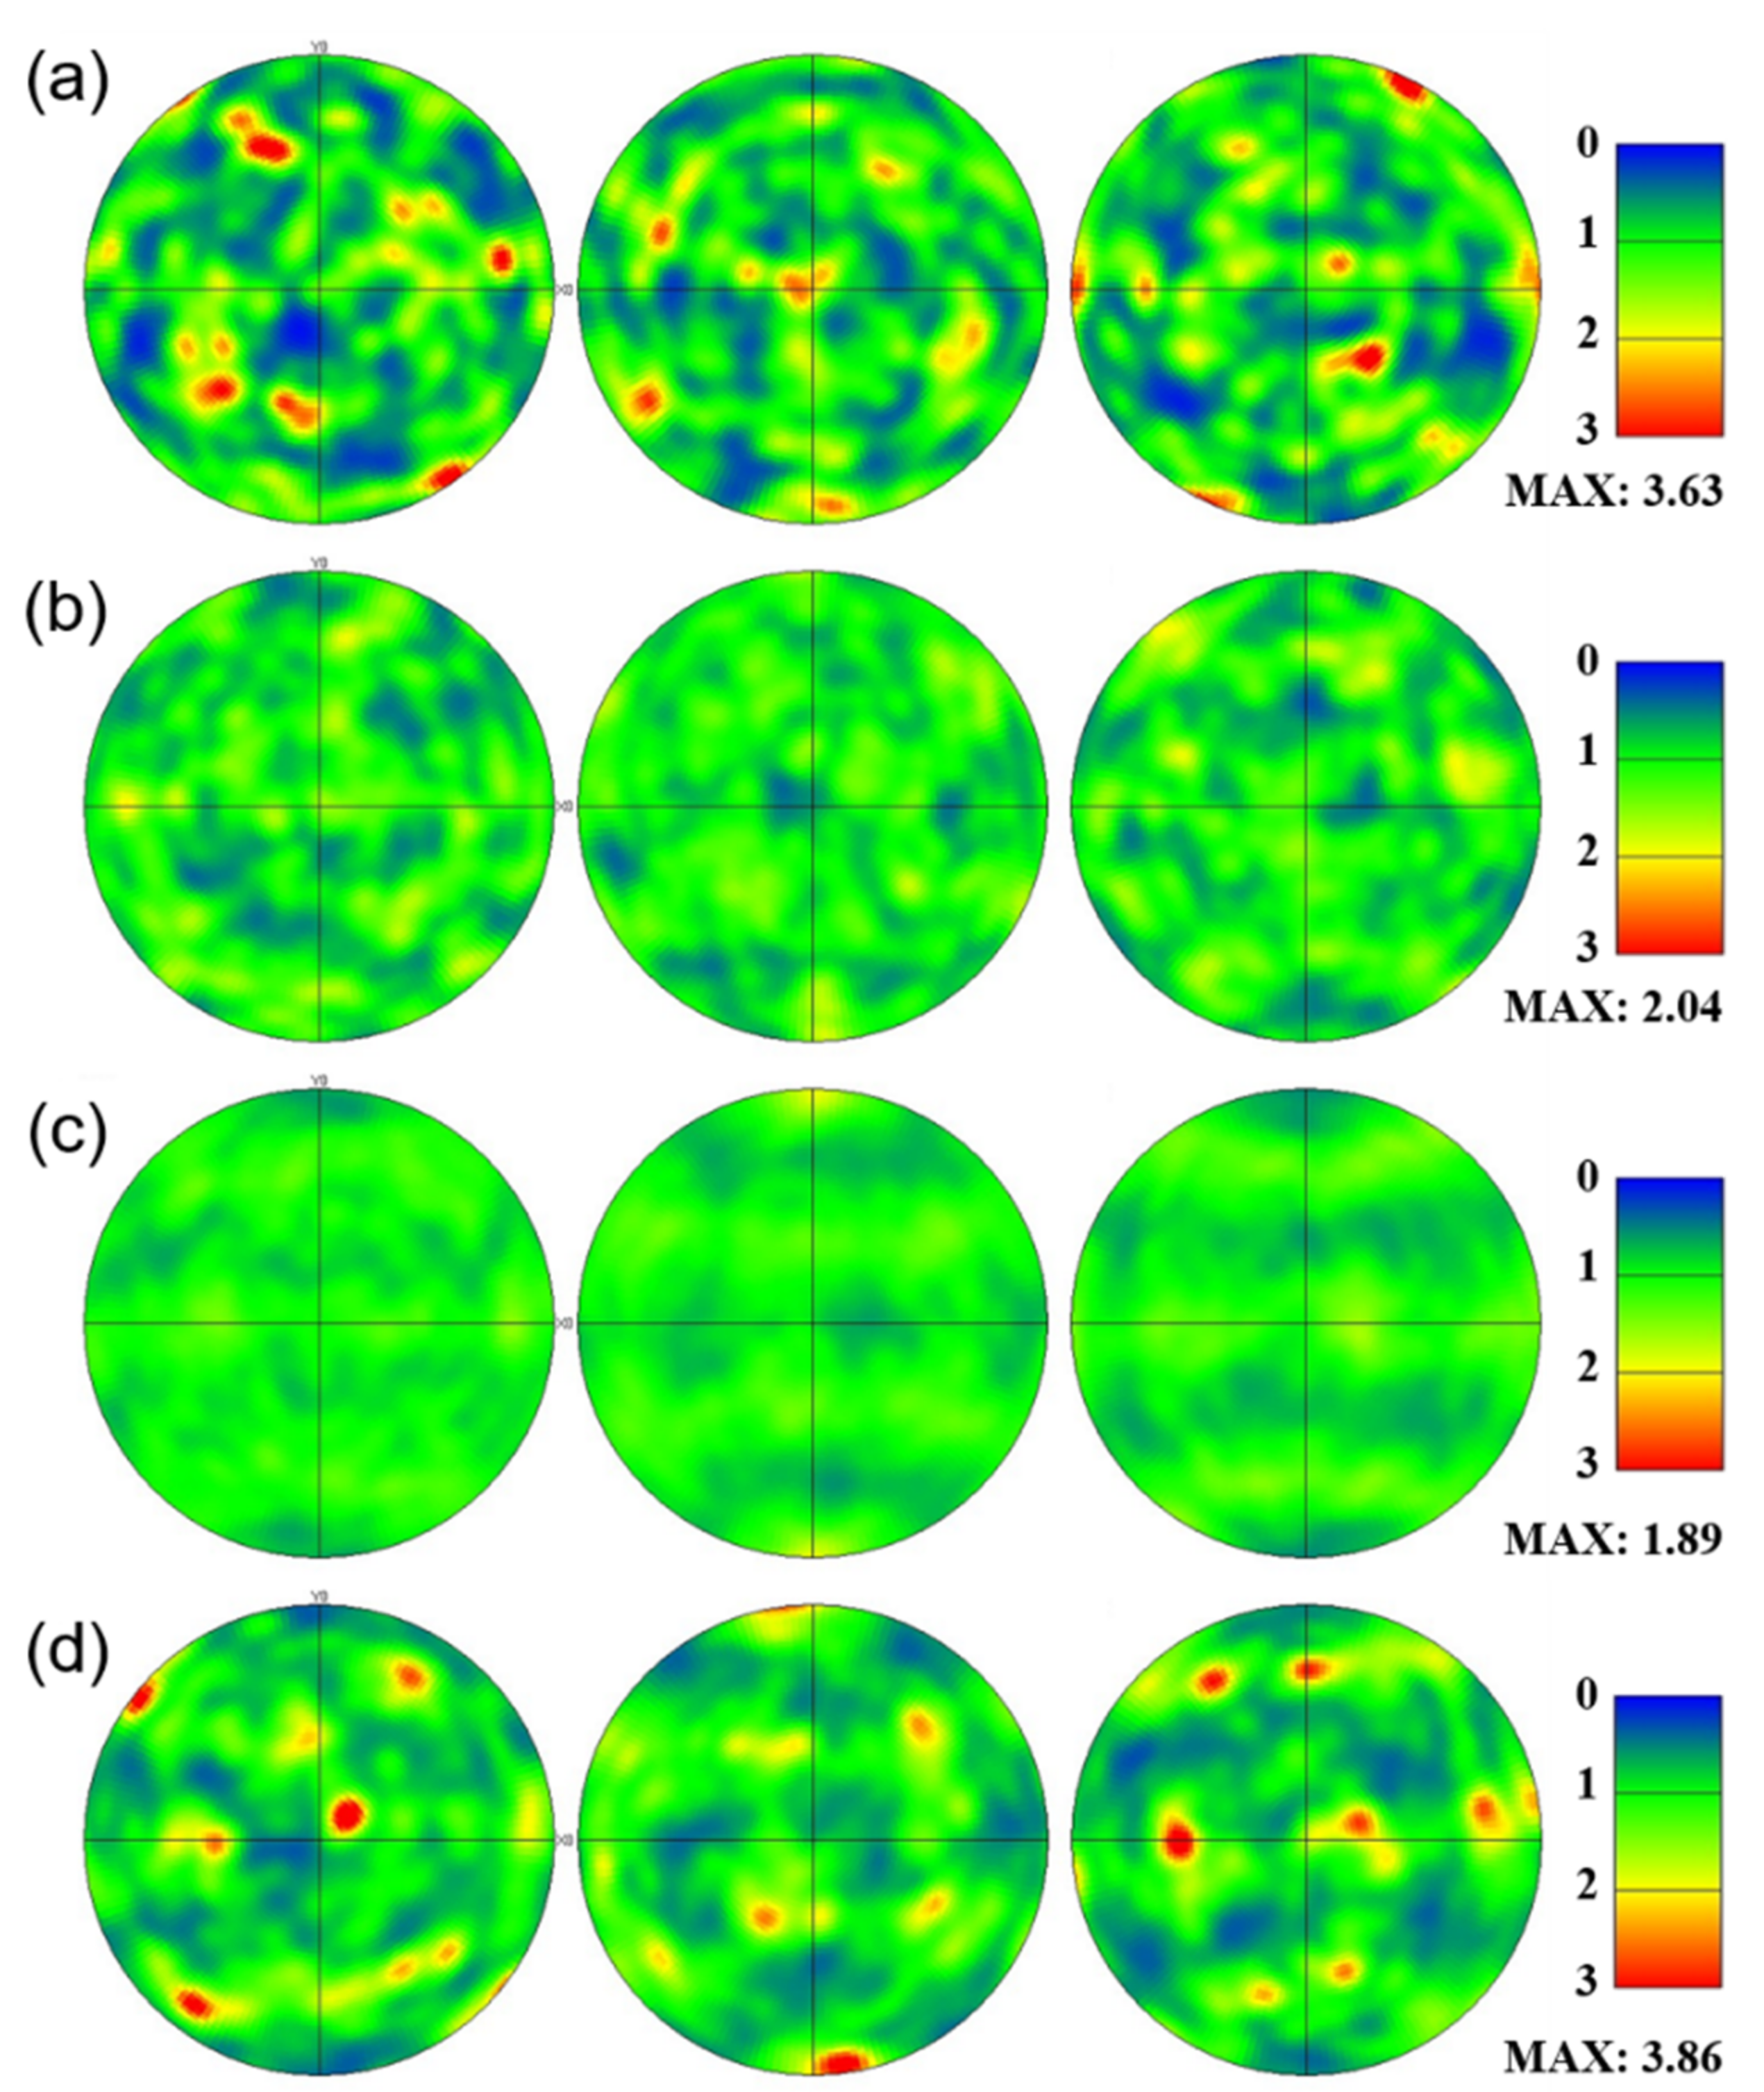
During the uniaxial compression test, a strong <110> texture appears in the microstructure when the temperature is below 950 °C, and the intensity of the texture decreases with the increases of the temperature.
(2)
Twin-related DRX occurs in the compressing process. The intensity of twin-related DRX increases with the increases of the temperature. Moreover, the changes of twin morphology may lead to changes in DRX mechanism, and the intensity of cDRX decreases with the increases of the temperature.
(3)
With the increases of the temperature or the decreases of the strain rate, the critical strain of DRX decreases, and thereby DRX is promoted.
(4)
This work has a strong guiding significance for the hot spinning formation process of superalloys.

Author Contributions

Conceptualization, F.C. and K.L.; methodology, B.T.; validation, B.T., D.L. and J.L.; formal analysis, B.T. and D.L.; investigation, F.C. and K.L.; data curation, B.T.; writing—original draft preparation, K.L.; writing—review and editing, B.T.; supervision, H.Z. and J.L.; funding acquisition, H.Z. All authors have read and agreed to the published version of the manuscript.

Funding

This research was funded by the National Natural Science Foundation of China, grant number No. 51674201.

Institutional Review Board Statement

Not applicable.

Informed Consent Statement

Not applicable.

Data Availability Statement

Not applicable.

Acknowledgments

We would like to thank the Analytical & Testing Center of Northwestern Polytechnical University for SEM testing.

Conflicts of Interest

The authors declare no conflict of interest.

References

  1. Liu, X.D.; Fan, J.K.; Zhang, P.Z.; Xie, J.; Chen, F.L.; Liu, D.G.; Yuan, R.G.; Tang, B.; Kou, H.C.; Li, J.S. Temperature dependence of deformation behavior, microstructure evolution and fracture mechanism of Inconel 625 superalloy. J. Alloy. Compd. 2021, 869, 159342. [Google Scholar] [CrossRef]
  2. Yu, L.J.; Marquis, E.A. Precipitation behavior of Alloy 625 and Alloy 625 plus. J. Alloy. Compd. 2019, 811, 151916. [Google Scholar] [CrossRef]
  3. Nguejio, J.; Szmytka, F.; Hallais, S.; Tanguy, A.; Nardone, S.; Godino Martinez, M. Comparison of microstructure features and mechanical properties for additive manufactured and wrought nickel alloys 625. Mater. Sci. Eng. A 2019, 764, 138214. [Google Scholar] [CrossRef]
  4. Huebner, J.; Kata, D.; Kusiński, J.; Rutkowski, P.; Lis, J. Microstructure of laser cladded carbide reinforced Inconel 625 alloy for turbine blade application. Ceram. Int. 2017, 43, 8677–8684. [Google Scholar] [CrossRef]
  5. Wang, Y.F.; Chen, X.Z.; Shen, Q.K.; Su, C.C.; Zhang, Y.P.; Jayalakshmi, S.; Singh, R.A. Effect of magnetic Field on the microstructure and mechanical properties of inconel 625 superalloy fabricated by wire arc additive manufacturing. J. Manuf. Process. 2021, 64, 10–19. [Google Scholar] [CrossRef]
  6. Tian, Y.; Chekir, N.; Wang, X.; Nommeots-Nomm, A.; Gauvin, R.; Brochu, M. Effect of heat treatments on microstructure evolution and grain morphology of alloy 625 with 0.4 wt.% boron modification fabricated by laser wire deposition. J. Alloy. Compd. 2018, 764, 815–823. [Google Scholar] [CrossRef]
  7. Li, C.; White, R.; Fang, X.Y.; Weaver, M.; Guo, Y.B. Microstructure evolution characteristics of Inconel 625 alloy from selective laser melting to heat treatment. Mater. Sci. Eng. A 2017, 705, 20–31. [Google Scholar] [CrossRef]
  8. Evans, N.D.; Maziasz, P.J.; Shingledecker, J.P.; Yamamoto, Y. Microstructure evolution of alloy 625 foil and sheet during creep at 750 °C. Mater. Sci. Eng. A 2008, 498, 412–420. [Google Scholar] [CrossRef]
  9. Safarzade, A.; Sharifitabar, M.; Shafiee, A.M. Effects of heat treatment on microstructure and mechanical properties of Inconel 625 alloy fabricated by wire arc additive manufacturing process. Trans. Nonferr. Met. Soc. China 2020, 30, 3016–3030. [Google Scholar] [CrossRef]
  10. Gao, Y.B.; Ding, Y.T.; Chen, J.J.; Xu, J.Y.; Ma, Y.J.; Wang, X.M. Effect of twin boundaries on the microstructure and mechanical properties of Inconel 625 alloy. Mater. Sci. Eng. A 2019, 767, 138361. [Google Scholar] [CrossRef]
  11. Marchese, G.; Parizia, S.; Rashidi, M.; Saboori, A.; Manfredi, D.; Ugues, D.; Lombardi, M.; Hryha, E.; Biamino, S. The role of texturing and microstructure evolution on the tensile behavior of heat-treated Inconel 625 produced via laser powder bed fusion. Mater. Sci. Eng. A 2020, 769, 138500. [Google Scholar] [CrossRef]
  12. Parizia, S.; Marchese, G.; Rashidi, M.; Lorusso, M.; Hryha, E.; Manfredi, D.; Biamino, S. Effect of heat treatment on microstructure and oxidation properties of Inconel 625 processed by LPBF. J. Alloy. Compd. 2020, 846, 156418. [Google Scholar] [CrossRef]
  13. López, B.; Urcola, J.J. Hot deformation characteristics of Inconel 625. Mater. Sci. Technol. 1996, 12, 673–678. [Google Scholar] [CrossRef]
  14. Sani, S.A.; Arabi, H.; Ebrahimi, G.R. Hot deformation behavior and DRX mechanism in a γ-γ/cobalt-based superalloy. Mater. Sci. Eng. A 2019, 764, 138165. [Google Scholar] [CrossRef]
  15. Guo, S.L.; Li, D.F.; Guo, Q.M.; Wu, Z.G.; Peng, H.J.; Hu, J. Investigation on hot workability characteristics of Inconel 625 superalloy using processing maps. J. Mater. Sci. 2012, 47, 5867–5878. [Google Scholar] [CrossRef]
  16. Jia, Z.; Sun, X.; Ji, J.J.; Wang, Y.J.; Wei, B.L.; Yu, L.D. Hot Deformation Behavior and Dynamic Recrystallization Nucleation Mechanisms of Inconel 625 during Hot Compressive Deformation. Adv. Eng. Mater. 2021, 23, 2001048. [Google Scholar] [CrossRef]
  17. Lizzi, F.; Pradeep, K.; Stanojevic, A.; Sommadossi, S.; Poletti, M.C. Hot Deformation Behavior of a Ni-Based Superalloy with Suppressed Precipitation. Metals 2021, 11, 605. [Google Scholar] [CrossRef]
  18. Li, D.F.; Guo, Q.M.; Guo, S.L.; Peng, H.J.; Wu, Z.G. The microstructure evolution and nucleation mechanisms of dynamic recrystallization in hot-deformed Inconel 625 superalloy. Mater. Des. 2011, 32, 696–705. [Google Scholar] [CrossRef]
  19. Hu, Y.L.; Lin, X.; Li, Y.L.; Zhang, S.Y.; Gao, X.H.; Liu, F.G.; Li, X.; Huang, W.D. Plastic deformation behavior and dynamic recrystallization of Inconel 625 superalloy fabricated by directed energy deposition. Mater. Des. 2020, 186, 108359. [Google Scholar] [CrossRef]
  20. Bonnekoh, C.; Lied, P.; Zaefferer, S.; Jäntsch, U.; Hoffmann, A.; Reiser, J.; Rieth, M. The brittle-to-ductile transition in cold-rolled tungsten sheets: Contributions of grain and subgrain boundaries to the enhanced ductility after pre-deformation. J. Nucl. Mater. 2020, 25, 100769. [Google Scholar] [CrossRef]
  21. Lang, Y.J.; Cai, Y.H.; Cui, H.; Zhang, J.S. Effect of strain-induced precipitation on the low angle grain boundary in AA7050 aluminum alloy. Mater. Des. 2011, 32, 4241–4246. [Google Scholar] [CrossRef]
  22. Yang, J.; Luo, J.; Li, X.Y.; Li, M.Q. Evolution mechanisms of recrystallized grains and twins during isothermal compression and subsequent solution treatment of GH4586 superalloy. J. Alloy. Compd. 2021, 850, 156732. [Google Scholar] [CrossRef]
  23. Wei, D.X.; Koizumi, Y.; Chiba, A. Discontinuous yielding and microstructural evolution of Ti-40 at.% Al alloy compressed in single α-hcp phase region. J. Alloy. Compd. 2017, 693, 1261–1276. [Google Scholar] [CrossRef]
  24. Xiang, L.; Tang, B.; Xue, X.Y.; Kou, H.C.; Li, J.S. Microstructural characteristics and dynamic recrystallization behavior of β-γ TiAl based alloy during high temperature deformation. Intermetallics 2018, 97, 52–57. [Google Scholar] [CrossRef]
  25. León-Cázares, F.D.; Monni, F.; Rae, C.M.F. Stress orientation dependence for the propagation of stacking faults and superlattice stacking faults in nickel-based superalloys. Acta Mater. 2020, 199, 209–224. [Google Scholar] [CrossRef]
  26. Sellars, C.M.; McTegart, W.J. On the mechanism of hot deformation. Acta Metall. 1966, 14, 1136–1138. [Google Scholar] [CrossRef]
  27. Wu, Y.T.; Liu, Y.C.; Li, C.; Xia, X.C.; Huang, Y.; Li, H.J.; Wang, H.P. Deformation behavior and processing maps of Ni 3 Al-based superalloy during isothermal hot compression. J. Alloy. Compd. 2017, 712, 687–695. [Google Scholar] [CrossRef]
  28. Zener, C.; Hollomon, J.H. Effect of strain rate upon plastic flow of steel. J. Appl. Phys. 1944, 15, 22. [Google Scholar] [CrossRef]
  29. Li, J.; Li, F.G.; Cai, J.; Wang, R.T.; Yuan, Z.W.; Ji, G.L. Comparative investigation on the modified Zerilli–Armstrong model and Arrhenius-type model to predict the elevated-temperature flow behaviour of 7050 aluminium alloy. Comput. Mater. Sci. 2013, 71, 56–65. [Google Scholar] [CrossRef]
  30. Samantaray, D.; Mandal, S.; Bhaduri, A.K. A comparative study on Johnson Cook, modified Zerilli–Armstrong and Arrhenius-type constitutive models to predict elevated temperature flow behaviour in modified 9Cr–1Mo steel. Comput. Mater. Sci. 2009, 47, 568–576. [Google Scholar] [CrossRef]
Figure 1. Schematic diagram of the samples for compression.
Metals 11 00824 g001
Figure 2. Stress-strain curve of IN625 in different temperature and strain rate: (a) 800 °C; (b) 850 °C; (c) 900 °C; (d) 950 °C; (e) 1000 °C; (f) 1050 °C.
Metals 11 00824 g002
Figure 3. Corrected curve under the condition of 1050 °C/0.01 s−1.
Metals 11 00824 g003
Figure 4. The relationship between peak stress, temperature and strain rate: the variation of logarithm of strain rate with the peak stress (a), ln (peak stress) (b), and ln(sinh(alpha*peak stress)) (c). And the variation of ln(sinh(alpha*peak stress)) with the temperature in (d).
Metals 11 00824 g004
Figure 5. The variation of peak stress with Z parameter.
Metals 11 00824 g005
Figure 6. Initial microstructure of IN625 superalloy (a) EBSD orientation map, (b) grain boundaries, (c) pole figures.
Metals 11 00824 g006
Figure 7. EBSD maps of the microstructure under different deformation temperatures: (a) 800 °C, (b) 850 °C, (c) 900 °C, (d) 950 °C, (e) 1000 °C, (f) 1050 °C. The enlarged parts of (b,d,f) exhibit the distribution of grain misorientations.
Metals 11 00824 g007
Figure 8. The variation of fraction of TBs (a), LAGBs and SGBs (b) in γ grains at different compression conditions.
Metals 11 00824 g008
Figure 9. Pole figures of the microstructure under different deformation temperatures: (a) 800 °C, (b) 850 °C, (c) 900 °C, (d) 950 °C, (e) 1000 °C, (f) 1050 °C.
Metals 11 00824 g009
Figure 10. EBSD maps of the microstructure under different strain rate: (a) 1000 °C, 0.001 s−1, (b) 1000 °C, 0.01 s−1, (c) 1000 °C, 0.1 s−1, (d) 1000 °C, 1 s−1. Distribution of equivalent diameter of grains (e) and dependence of average equivalent diameter on strain rate (f).
Metals 11 00824 g010
Figure 11. PF of the microstructure under different strain rate: (a) 1000 °C, 0.001 s−1, (b) 1000 °C, 0.01 s−1, (c) 1000 °C, 0.1 s−1, (d) 1000 °C, 1 s−1.
Metals 11 00824 g011
Figure 12. The variation of fraction of TBs (a), LAGBs and SGBs (b) in γ grains at strain rates.
Metals 11 00824 g012
Figure 13. The DRX fraction and its fitting curve under different deformation condition: (a) 1050 °C, 0.001 s−1, (b) 1050 °C, 0.1 s−1, (c) 950 °C, 0.001 s−1.
Metals 11 00824 g013
Figure 14. The variation of peak strain under different conditions with Z parameter
Metals 11 00824 g014
Table 1. Chemical composition of IN625 alloy (in wt%).
NiCoCrFeMoCuNb
63.8<0.00521.952.078.200.0173.44
AlTiMnSiPCS
0.170.17<0.0050.130.0020.039<0.001
Table 2. Hot compression conditions for IN625 alloy.
Temperature (°C)80085090095010001050
Strain rate (s−1)10.10.010.001
Deformation (%)65
Table 3. Peak stress under different deformation condition.
Temperature (°C)
80085090095010001050
Strain Rate (s−1)0.00140931622715310775
0.01608447347242190141
0.1-660480411329236
1--543459367278
Table 4. Parameter k and n under different deformation condition.
Temperature (°C)
80085090095010001050
knknknknknkn
Strain Rate (s−1)1----------0.192.3
0.1--------1.031.60.591.4
0.01----0.131.80.261.50.171.50.111.6
0.001----0.101.70.131.40.201.40.141.7
Publisher’s Note: MDPI stays neutral with regard to jurisdictional claims in published maps and institutional affiliations.

