Article

Structural Evolution in Wet Mechanically Alloyed Co-Fe-(Ta,W)-B Alloys

1
Institute of Physics, Faculty of Science, P. J. Šafárik University in Košice, Park Angelinum 9, 041 54 Košice, Slovakia
2
Institute of Materials and Quality Engineering, Faculty of Materials, Metallurgy and Recycling, Technical University of Košice, Letná 9, 042 00 Košice, Slovakia
3
Institute of Experimental Physics, Slovak Academy of Sciences, Watsonova 47, 040 01 Košice, Slovakia
*
Author to whom correspondence should be addressed.
Metals 2021, 11(5), 800; https://doi.org/10.3390/met11050800
Submission received: 18 February 2021 / Revised: 14 April 2021 / Accepted: 10 May 2021 / Published: 14 May 2021

Abstract

:
In the present study, the effect of wet mechanical alloying (MA) on the glass-forming ability (GFA) of Co 43 Fe 20 X 5.5 B 31.5 (X = Ta, W) alloys was studied. The structural evolution during MA was investigated using high-energy X-ray diffraction, X-ray absorption spectroscopy, high-resolution transmission electron microscopy and magnetic measurements. Pair distribution function and extended X-ray absorption fine structure spectroscopy were used to characterize local atomic structure at various stages of MA. Besides structural changes, the magnetic properties of both compositions were investigated employing a vibrating sample magnetometer and thermomagnetic measurements. It was shown that using hexane as a process control agent during wet MA resulted in the formation of fully amorphous Co-Fe-Ta-B powder material at a shorter milling time (100 h) as compared to dry MA. It has also been shown that substituting Ta with W effectively suppresses GFA. After 100 h of MA of Co-Fe-W-B mixture, a nanocomposite material consisting of amorphous and nanocrystalline bcc-W phase was synthesized.

1. Introduction

Amorphous alloys are still the subject of scientific interest due to their outstanding combinations of physical, chemical, electrochemical and mechanical properties such as high tensile strength and hardness, extreme elastic strain limit [1,2], or higher corrosion resistance [3,4]. Amorphous materials are commonly prepared through the rapid solidification of melt, casting, forging, evaporation, sputtering and mechanical alloying. Co-based amorphous alloys represent a very attractive group of materials with interesting properties. For example, Co-Fe-Ta-B alloys show the best glass-forming ability (GFA) and wide supercooled liquid region of 70 K [5]. Along with this, they also exhibit the highest values of compressive yield strength (over 5000 MPa) [6]. Co-based amorphous alloys are also interesting for their magnetic behavior, like their high permeability, excellent soft magnetic properties, i.e., extraordinary low coercive force of 0.25 A/m, zero magnetostriction [7], giant magnetoimpedance [8] and excellent corrosion resistance [2]. For these reasons, they are the subject of lasting experimental study. Considering the mechanical properties, the best performance shows an alloy with the composition Co 43 Fe 20 Ta 5.5 B 31.5 [6,9], which exhibits an ultra-high fracture strength of 5185 MPa, ultra-high Young´s modulus of 268 GPa and large supercooled region of 72 K [10]. In order to further enhance its GFA, a few research groups investigated the effect of alloying base alloy composition Co 43 Fe 20 Ta 5.5 B 31.5 by selected elements: Mo, Si [6], Cr, Si [11], Nb [12], Cu, Si [13], Ni, Si [14], Ni, Nb, Si [15].
However, metallic glasses produced by rapid solidification techniques suffer from the limitations imposed by chemical composition range due to the mutual constrained solubility of elements or their largely different melting points. Reaching the precise composition can be difficult or impossible by melting, especially when pure elements have different physical properties. Another problem is that the alloy prepared by rapid quenching usually needs a critical cooling rate greater than 10 3 K/s, which means that the final dimensions of samples are restricted to a few millimeters. An effective approach to overcome the limited solubility of elements is represented by mechanical alloying. Mechanical alloying (MA) is a solid-state powder-processing technique involving the repeated welding, fracturing, and re-welding of powder particles in a high-energy ball mill [16]. MA enables the preparation of alloys with more varied constituents, which gives rise to unusual metallic glass compositions beyond the standard mutual solubility limits recognized in phase diagrams. The consolidation of amorphous powder via hot-pressing represents an alternative route to the preparation of bulk materials with the desired geometry. At present, increased attention is being paid to the preparation of materials of complex shapes using additive manufacturing [17]. Selective laser melting (SLM) is a powder bed fusion process that produces materials (microstructures) which exhibit morphological, compositional, or structural metastability due to their relatively high cooling rates (10 3 –10 8 K/s). Since such high cooling rates are required to produce bulk metallic glasses, selective laser melting can be used for their preparation from an amorphous powder precursor [18,19].
This paper reports on the structural changes in Co 43 Fe 20 X 5.5 B 31.5 (X = Ta, W) alloys synthesized by wet mechanical alloying using hexane as a process control agent. The main investigation line is to follow-up the amorphization of both alloys during mechanical alloying. Special emphasis is placed on the comparison of amorphization dynamics when substituting Ta with W. X-ray diffraction, transmission electron microscopy and X-ray absorption spectroscopy are used to characterize structural changes in short-range order during the process of mechanical alloying. The obtained results may be very useful for the large-scale production of amorphous powder precursors by mechanical alloying, which could be used for the production of net-shaped bulk materials by hot powder compaction or by additive manufacturing with selective laser melting.

2. Materials and Methods

2.1. Sample Preparation

The powder mixtures of nominal compositions Co 43 Fe 20 Ta 5.5 B 31.5 (Ta-alloy) and Co 43 Fe 20 W 5.5 B 31.5 (W-alloy) were prepared from crystalline elemental powders with a purity over 99.95 %. From each composition, a powder mixture with total weight of 20 g was prepared. Milling jars and balls used in mechanical alloying were made of steel. In order to ensure better mixing, each milling jar was filled with steel balls with a diameter 20 mm (6 pcs) and 10 mm (9 pcs). The ball-to-powder mass ratio was 14:1. Furthermore, each jar was filled with hexane up to two thirds of the jar height, so that milling balls and powders were completely covered. The powder mixtures were wet-mechanically alloyed using a RETSCH PM400 planetary ball mill. The milling speed was set to 200 rpm and the direction of rotation was changed every 5 min. The milling process was interrupted for 30 min after every 5 h of milling. Small amounts of powders for structural investigations were removed after 25, 50 and 100 h of milling. The samples were labeled according to their processing: Ta-25, Ta-50, Ta-100, W-25, W-50 and W-100 refers to Ta and W-alloy mechanically alloyed for 25, 50 and 100 h, respectively.

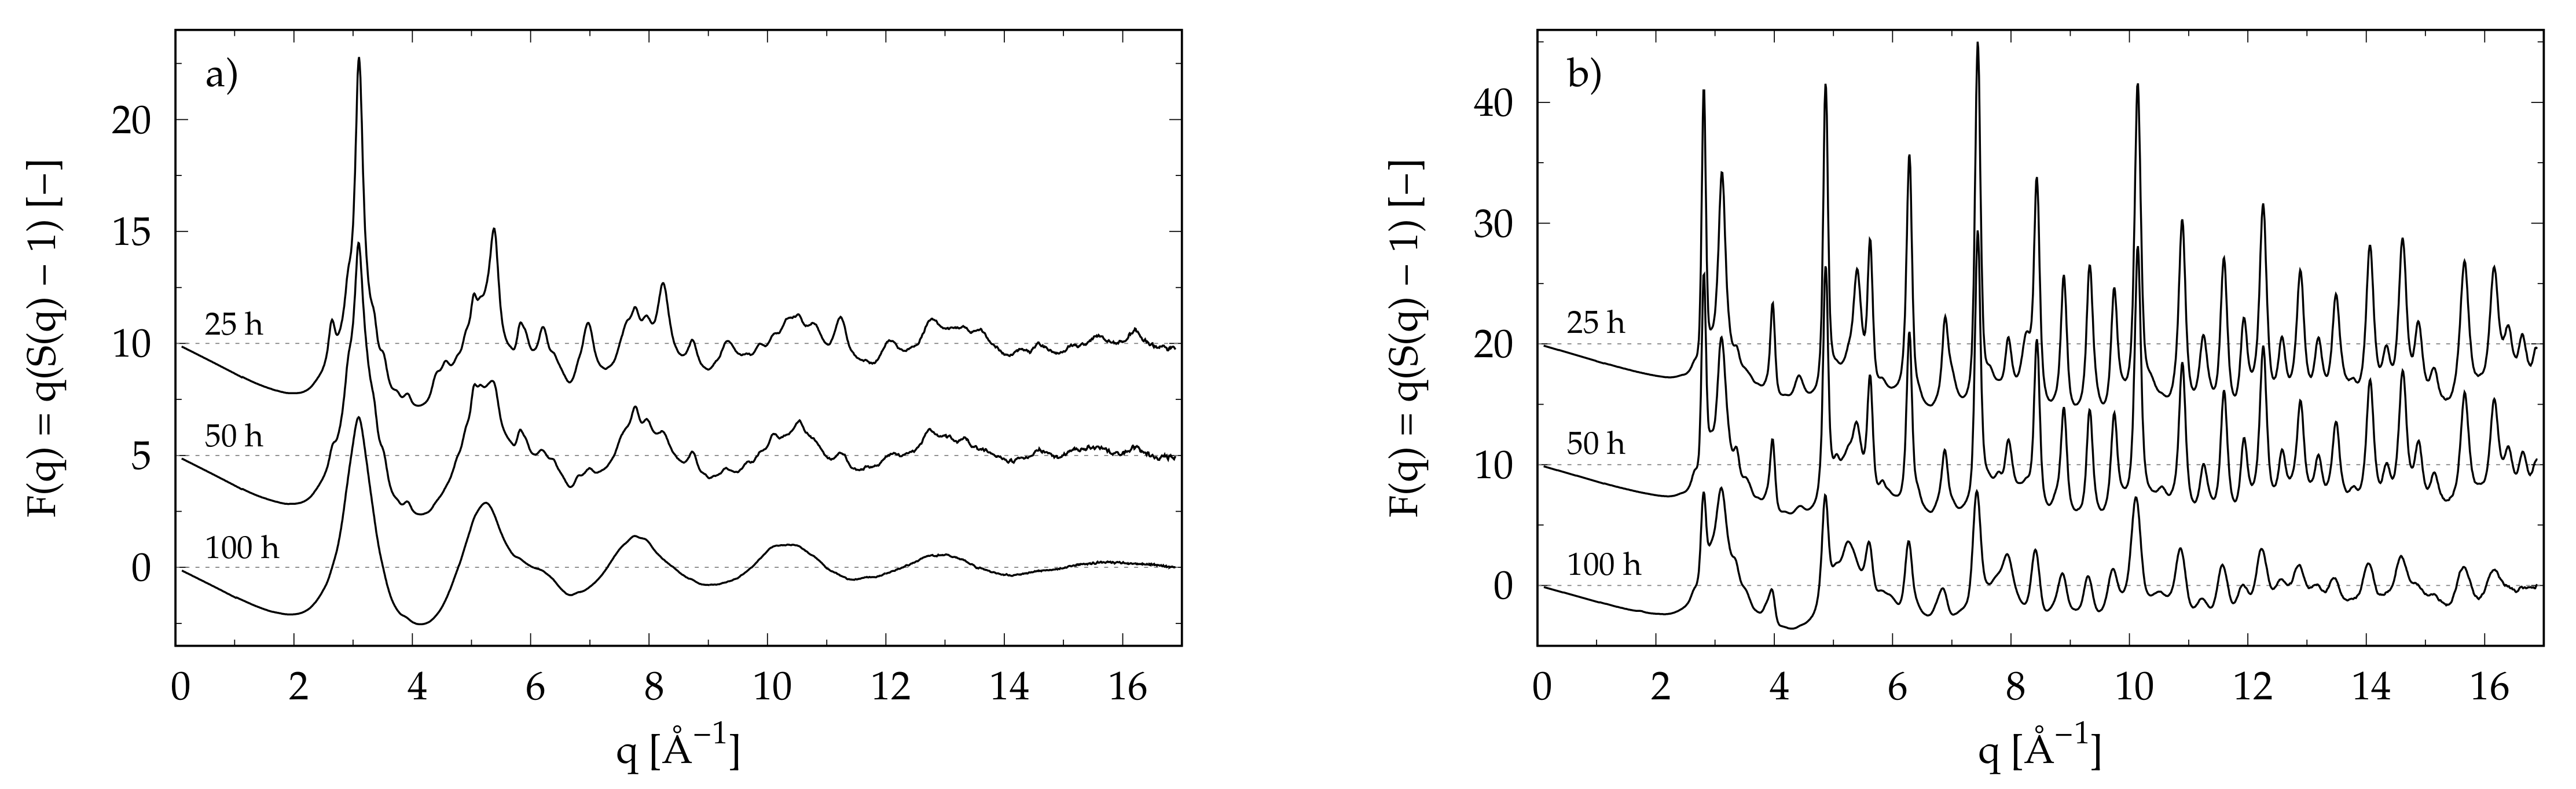
2.2. X-ray Scattering

High-energy X-ray diffraction (XRD) measurements were performed at the P02.1 undulator beamline of PETRA III electron storage ring (energy 6 GeV, current 100 mA) at DESY (Hamburg, Germany). The energy of the incident X-ray beam was fixed to 59.83 keV, which corresponds to a wavelength of λ = 0.2072 Å. Hard X-rays were used because a high resolution in real space, as desired for disordered materials, can be achieved and the required data corrections are small, particularly for absorption. The diffraction experiments were carried out in the Debye–Scherrer geometry. Powder samples were put inside Kapton tubes (diameter 0.5 mm) and measured at room temperature by a collimated incident beam with a cross-section of 0.5 mm × 0.5 mm. Scattered photons were collected using a two-dimensional (2D) detector Perkin Elmer 1621 (2048 × 2048 pixels, pixel size 200 µm×200 µm) carefully mounted orthogonal to the X-ray beam and 300 mm downstream from the sample. A CeO 2 standard powder sample was used to calibrate the sample-to-detector distance and tilt of the imaging plate relative to the beam path. The 2D XRD patterns were integrated with the q-space ( q = 4 π sin θ / λ , where θ is the half of a scattering angle) using the software package FIT2D [20]. The maximum value of magnitude of the wave momentum vector transfer q m a x in this study was 18 Å 1 . The instrumental resolution function (IRF), describing the behavior of the peak broadening (full-with at half maximum, FWHM) as a function of the diffraction angle 2 θ , was fitted to the Caglioti formula [21], F W H M 2 ( θ ) = U tan 2 θ + V tan θ + W , where U, V and W are fitting parameters characterizing the instrument. The IRF was determined by measuring standard materials such as LaB 6 under the same experimental and geometrical conditions as the studied materials. The peak profiles of the standard material and studied materials were fitted with a Gaussian function. Experimental peak widths β e x p were corrected for the instrumental broadening, β i n s , using the equation β = β e x p 2 β i n s 2 . About five independent measurements on each sample with an exposure time of 15 s were averaged to attain optimum counting statistics. Scattering intensity profiles I ( q ) were corrected for absorption and background scattering. The total structure factor S ( q ) was obtained from the normalized elastically scattered intensity, I c o h e u ( q ) , using standard procedures described in references [22,23] by applying the Faber–Ziman formalism [24], S ( q ) = 1 + I c o h e u ( q ) f 2 / f 2 , where f 2 = i = 1 n c i f i 2 ( q ) , f 2 = i = 1 n c i f i ( q ) 2 , in which c i and f i ( q ) are the atomic concentration and atomic scattering factor [25] of the atomic species of type i (i = Co, Fe, Ta/W, B). The total structure factors S ( q ) and corresponding pair distribution functions G ( r ) were derived from experimental data using the program PDFgetX2 [26]. Selected G ( r ) functions were analyzed by means of the real space fitting approach implemented in the software package PDFgui [27].

2.3. Transmission and Scanning Electron Microscopy

The structure of powder samples was investigated by Transmission Electron Microscopy (TEM). For TEM observations, the JEOL 2100F UHR microscope equipped with the Schottky FEG source and operated at 200 kV acceleration voltage was used. Powdered samples were dispersed in pure ethanol and ultrasonicated at varying frequencies for 480 s. Drops of solutions were placed on a copper support grid covered by lacey carbon film and dried out in a high vacuum (10 2 Pa) for several hours. Before TEM observations, the grids containing the sample were cleaned twice in a plasma cleaner Fischione M1020 for 17 s. Besides the image observations performed in a high-resolution bright field, the structure of samples was analyzed by Selected Area Diffraction (SAD). Scanning electron microscope (SEM) TESCAN Vega 3, equipped with the energy-dispersive X-ray (EDX) silicon drift detector Oxford Instruments X-Max 50, was used to check samples’ chemical compositions after mechanical alloying. The thermionic gun of the microscope was powered by 10 kV acceleration voltage.

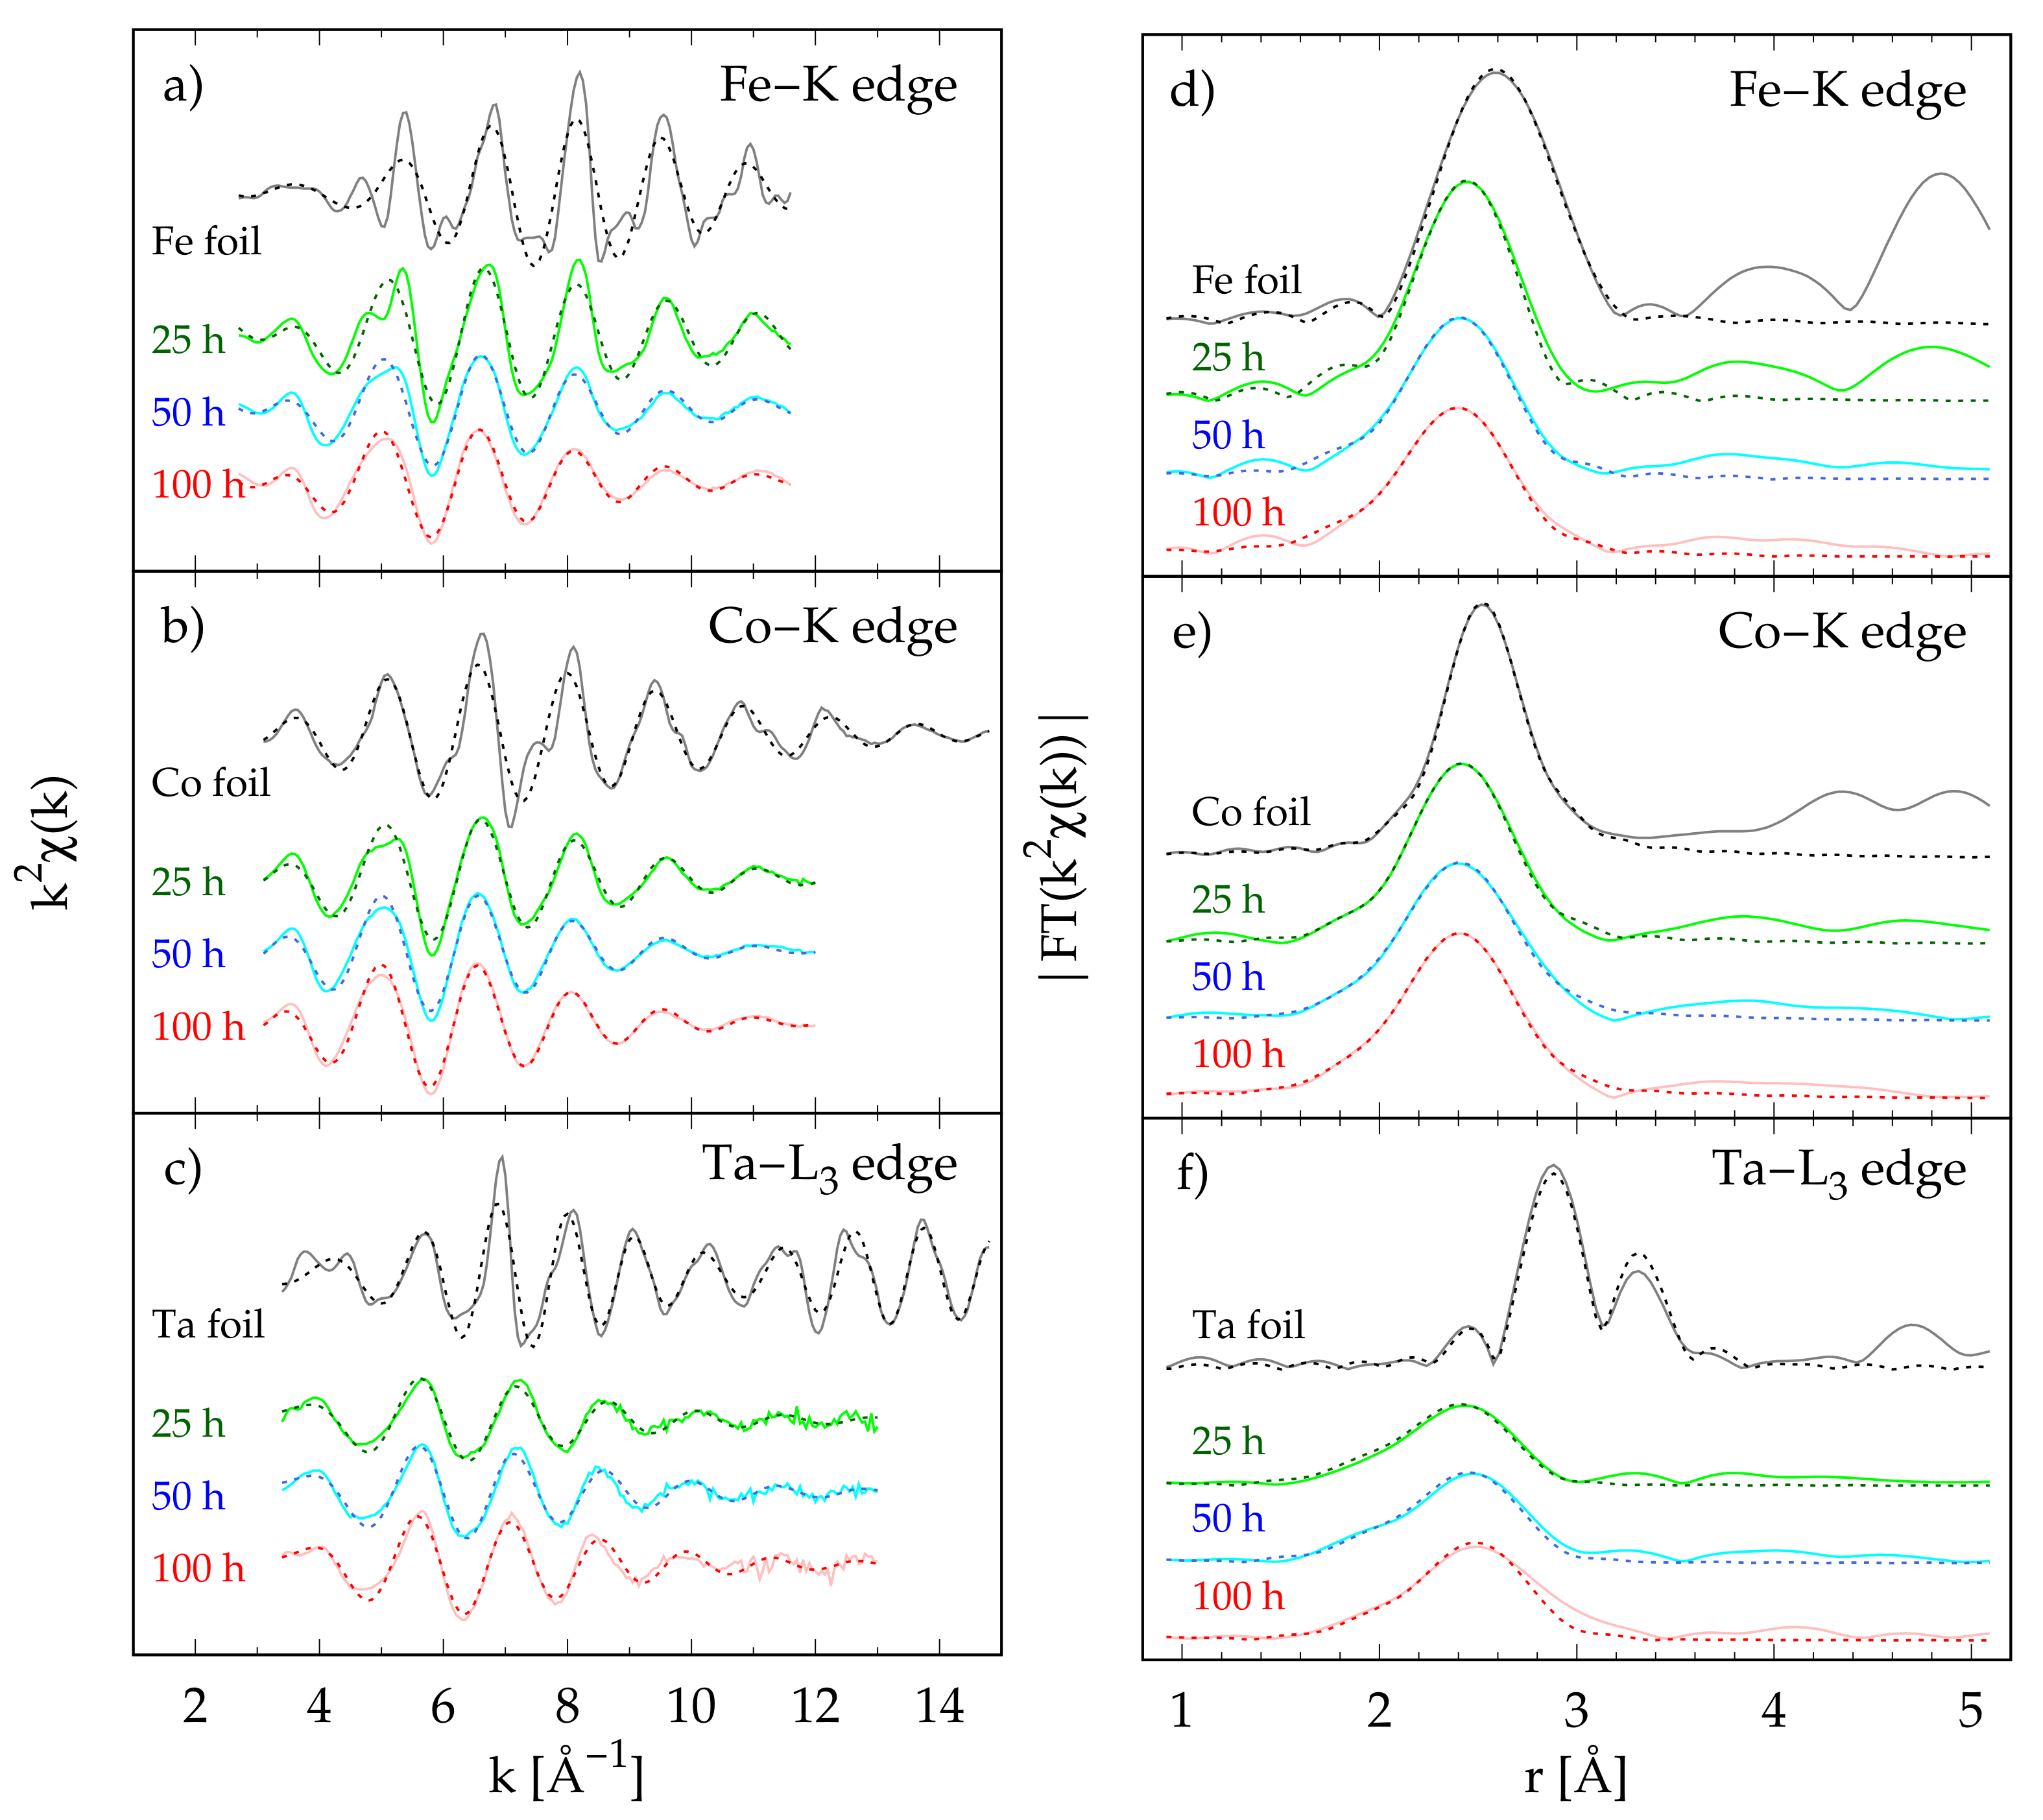
2.4. X-ray Absorption Spectroscopy

Extended X-ray absorption fine-structure (EXAFS) measurements were performed at the beamline P65 of PETRA III electron storage ring at DESY (Hamburg, Germany) [28]. EXAFS data were collected in transmission mode at the Fe-K (7112 eV), Co-K (7709 eV), Ta-L 3 (9881 eV) and W-L 3 (10,207 eV) edges using a fixed exit double crystal Si(111) monochromator. X-ray intensities were monitored using ionization chambers filled by gases, the type and pressure of which were adjusted to the corresponding energies. The energy calibration for Co, Fe, Ta and W was monitored using reference foils materials measured simultaneously with the sample. All spectra were energy-calibrated with respect to the first peak in the derivative spectrum of respective reference foil. Energy range of X-ray absorption scan μ ( E ) was 200 eV below the respective absorption edge energy E 0 with the upper boundary 530–1000 eV above. In case of Fe-K, Co-K, Ta-L 3 and W-L 3 edges the respective μ ( E ) scans were done 530 eV ( k m a x = 11.8 Å 1 ), 860 eV ( k m a x = 15 Å 1 ), 990 eV ( k m a x = 16.1 Å 1 ) and 1000 eV ( k m a x = 16.2 Å 1 ) above the absorption edge, respectively. The values in brackets indicate corresponding maximum k range (where k 2 = 2 m e ( E E 0 ) e / 2 in which m e is the electron mass, E is energy in eV, e is the elementary charge and reduced Planck’s constant). In order to achieve a good counting statistics, measurement of each sample was repeated at least 5 times. All data processing operations and fitting of EXAFS spectra were carried out using the software package DEMETER [29].

2.5. Magnetic Measurements

The saturation magnetization M S and coercivity H c of the mechanically alloyed powders were determined from magnetization loops traced in a magnetic field with maximum induction of μ 0 H = 1.8 T using a vibrating sample magnetometer VSM-LakeShore 735. All magnetic measurements were performed at room temperature. Temperature dependence of magnetization in constant magnetic field with induction of μ 0 H = 200 mT was measured using a Faraday magnetic balance.

3. Results and Discussion

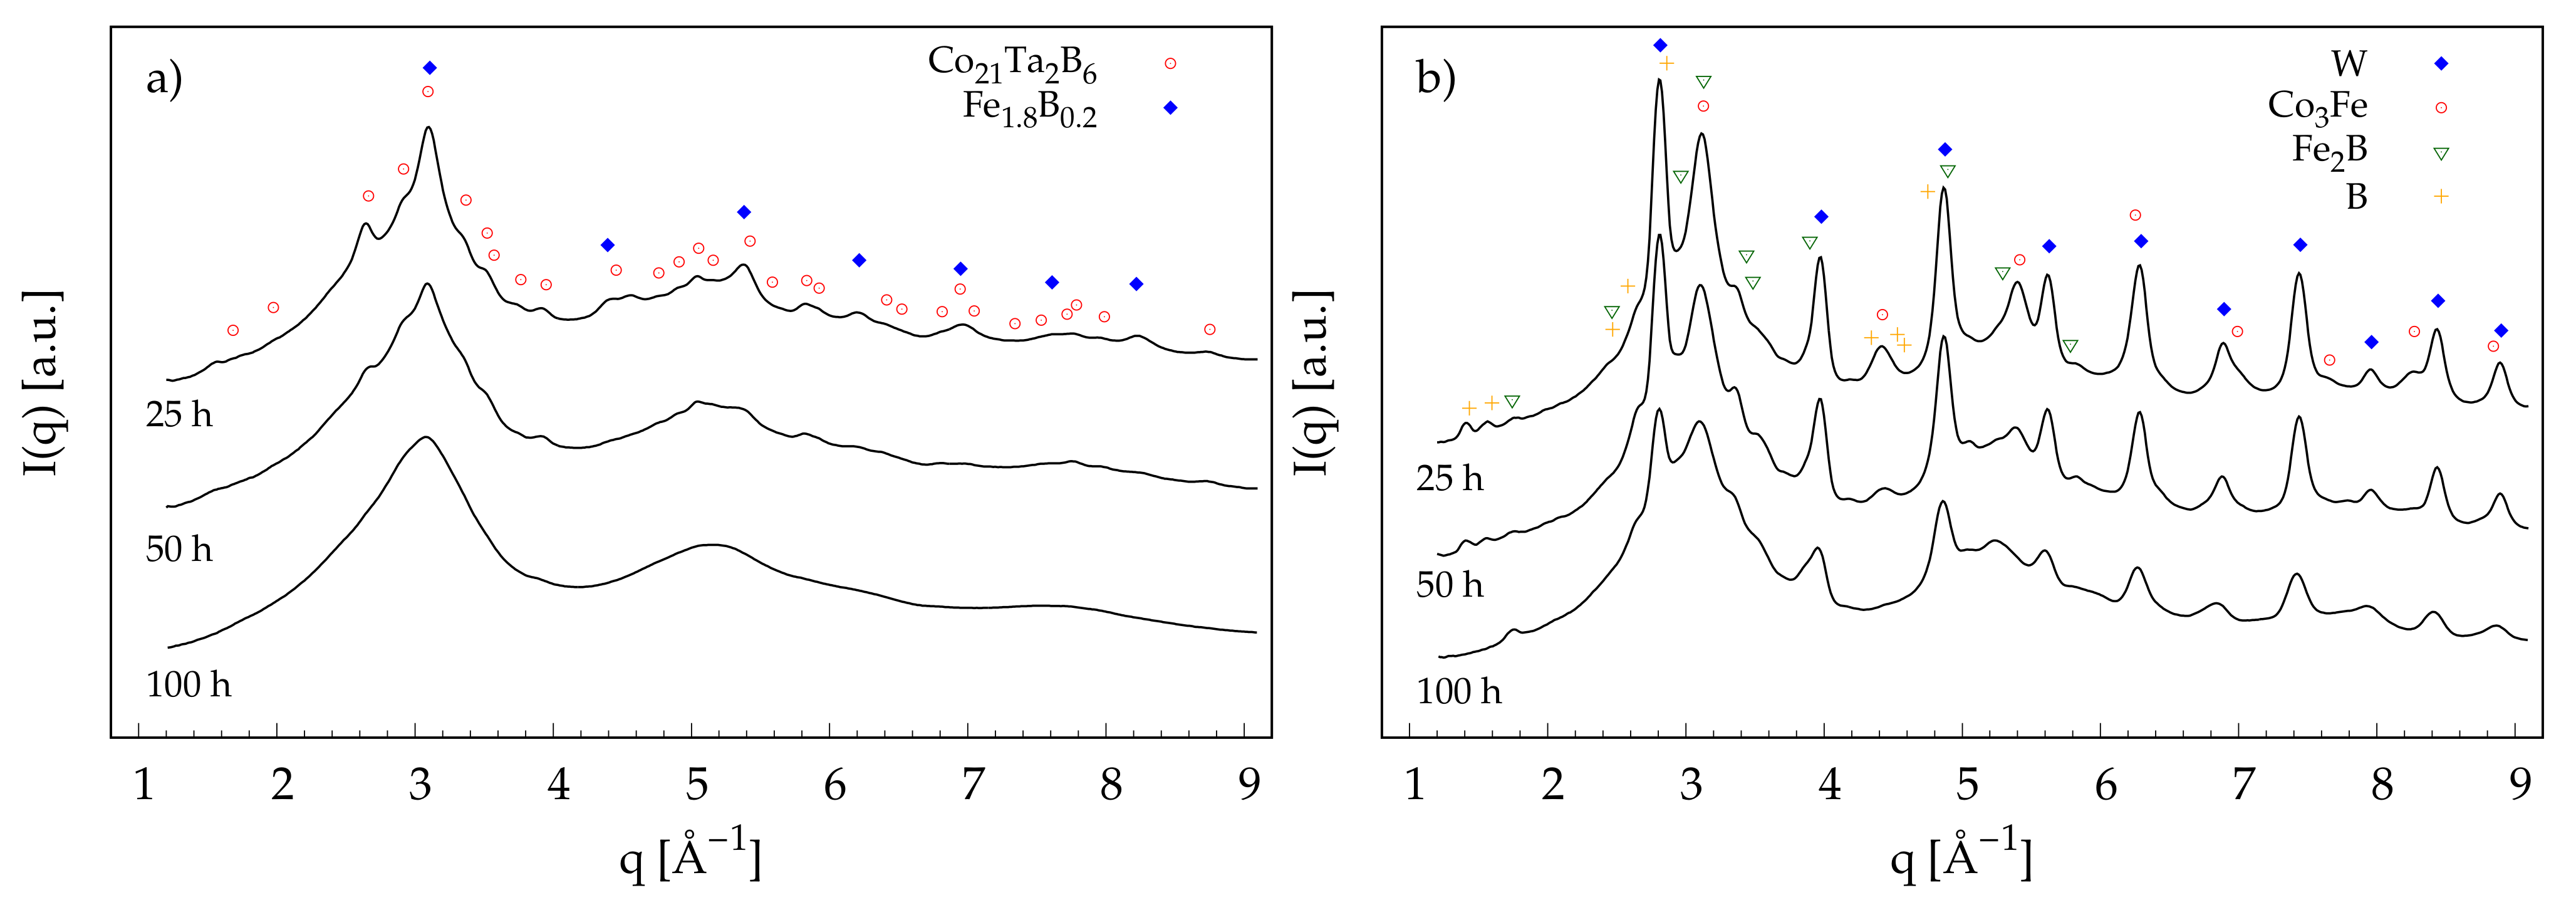
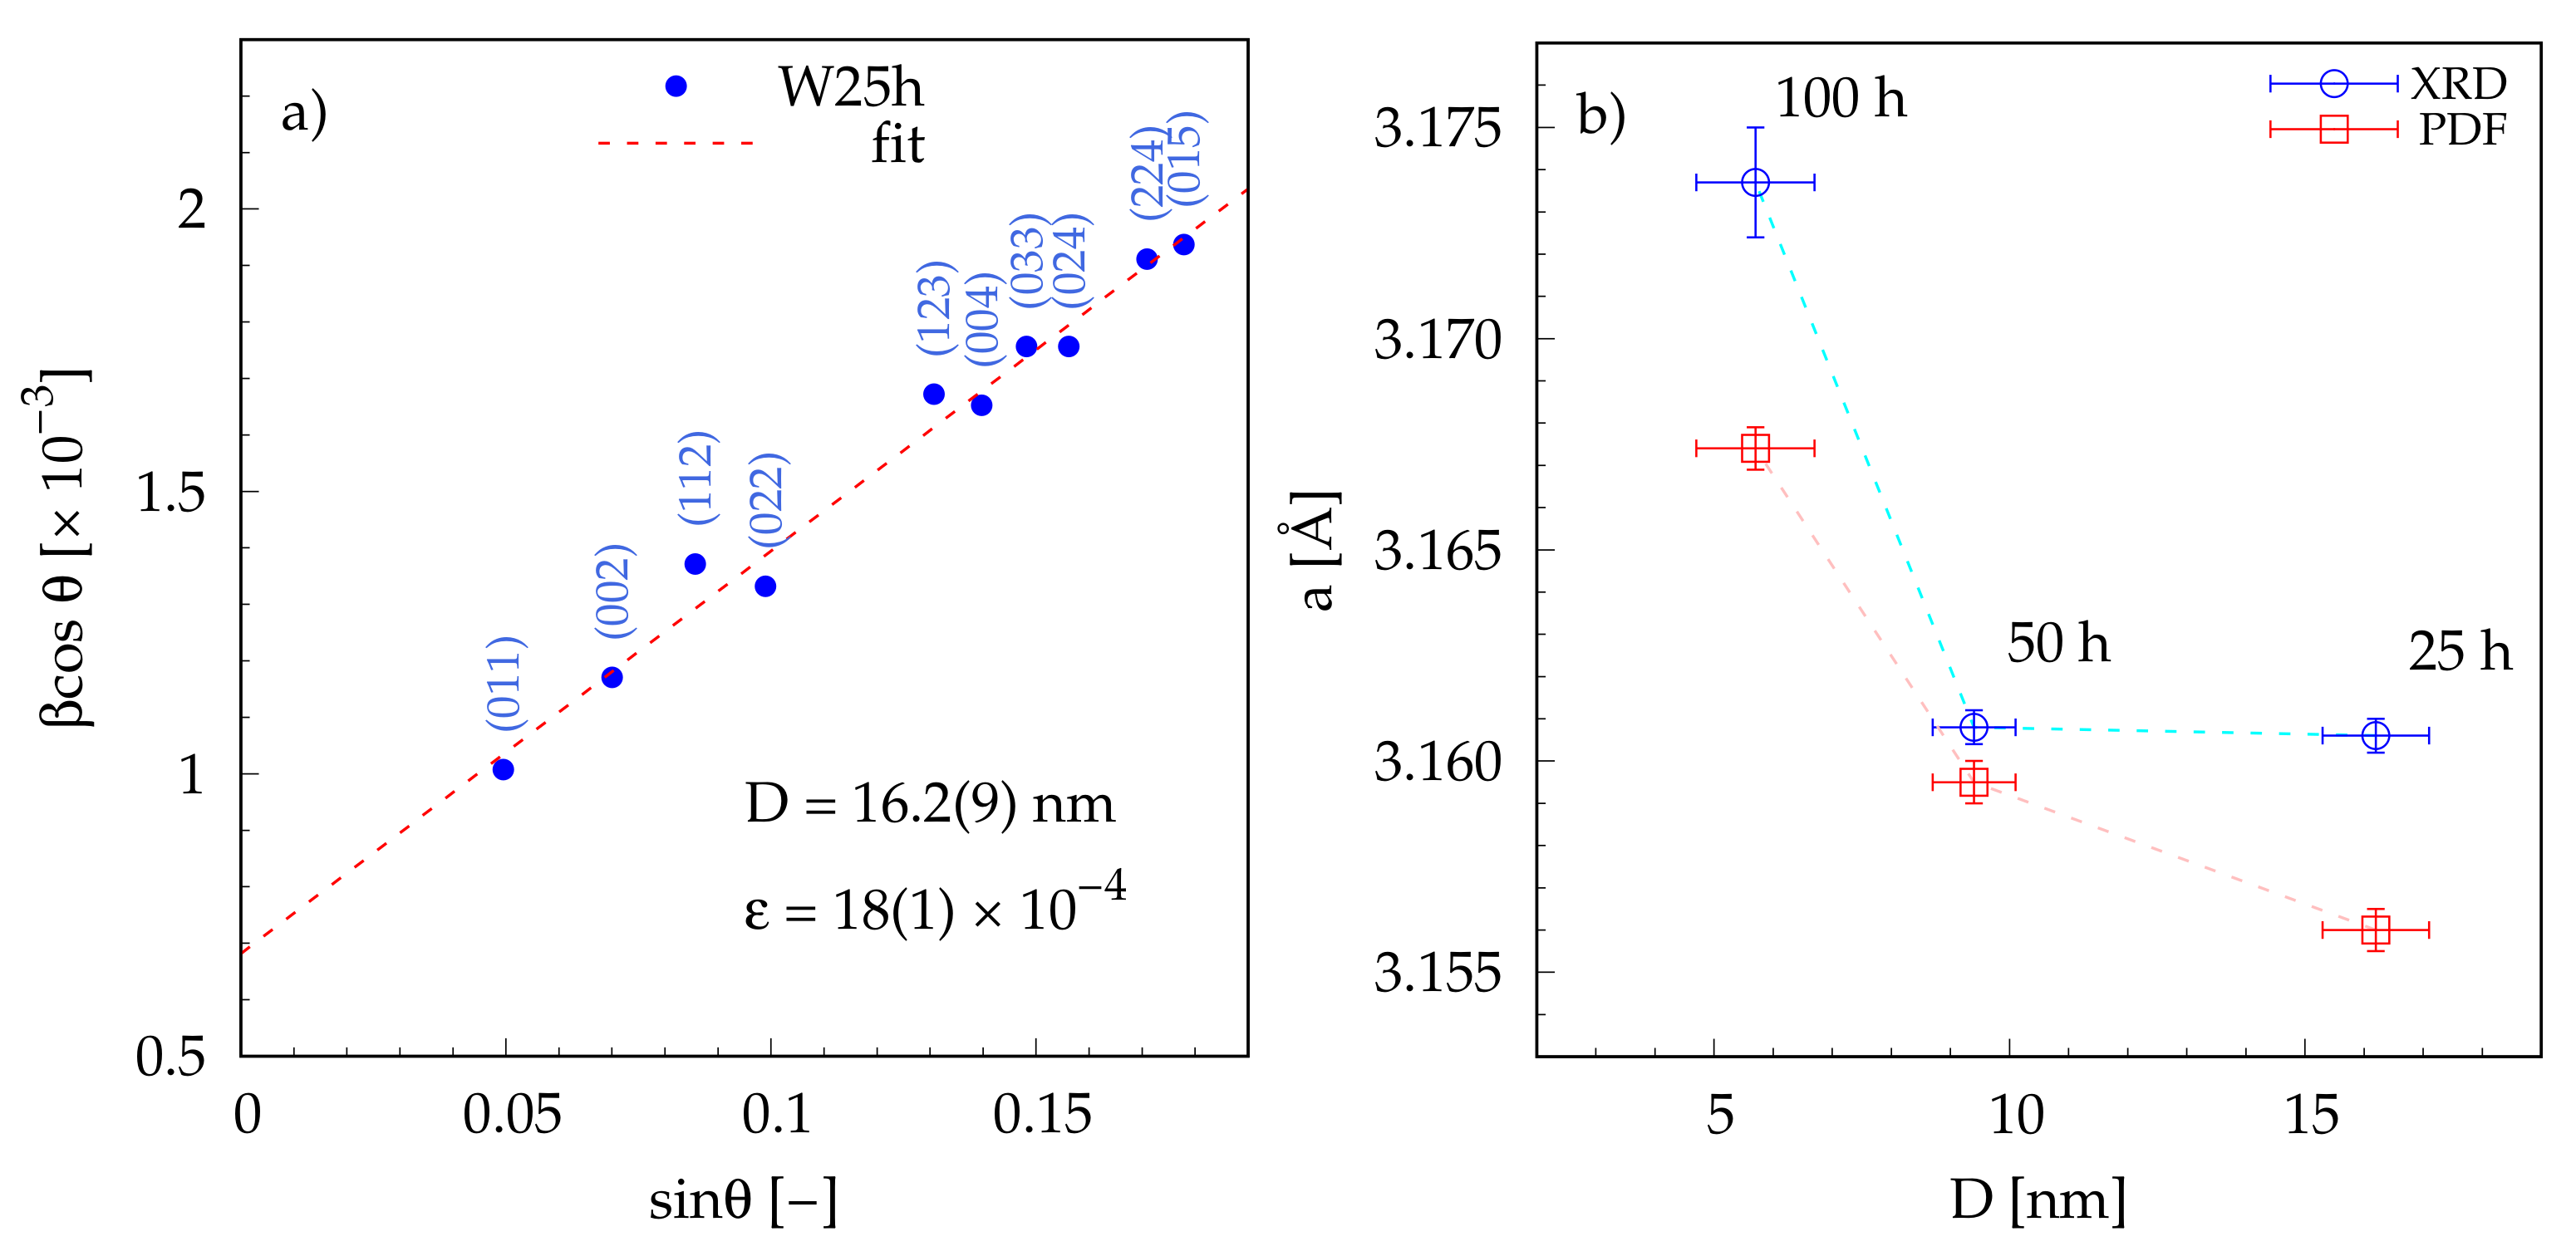
3.1. X-ray Diffraction

Figure 1 shows a comparison of XRD patterns for Ta- and W-containing alloys at different stages of mechanical alloying. In case of the Ta-alloy, it can be seen (Figure 1a) that, after 25 h of milling, its XRD pattern exhibits rather broad features due to the presence of amorphous phase. Additionally, it shows a set of distinct peaks which were assigned to Co 21 Ta 2 B 6 (fcc, Fm 3 ¯ m, ID-1511583) and Fe 1.8 B 0.2 (bcc, Im 3 ¯ m, ID-1511091). The phases were identified with the help of the Crystallographic Open Database (COD) [30]. It should be noted here that Bragg peaks belonging to these two phases are very broad, which indicates their nanocrystalline state. With further increases in milling time their presence diminishes, and after 100 h, a material with completely amorphous structure is achieved. Authors of previous work [31] have shown that the MA of a very similar alloy composition Co 40 Fe 22 Ta 8 B 30 could not reach a fully amorphous material, even after 200 h of dry milling under an argon protective atmosphere. Our results indicate that using hexane as a process control agent during wet MA results in the formation of fully amorphous Co-Fe-Ta-B powder material at a much shorter milling time (100 h) as compared to dry MA [31]. A very recent work of Msetra et al. [32] reported the synthesis of fully amorphous Co 60 Fe 18 Ta 8 B 14 alloy after 100 h of dry mechanical alloying.
XRD patterns of the W-alloy (Figure 1b) show a qualitatively different behavior compared to the Ta-alloy. First, more intense and sharper Bragg peaks are observed after 25 h of mechanical alloying. All peaks were identified and can be assigned to the following crystalline phases: W (bcc, Im 3 ¯ m, ID-9011610), Co 3 Fe (bcc, Im 3 ¯ m, ID-1524167), Fe 2 B (tetragonal, I 4 ¯ 2m, ID-1511152) and tiny traces of B (tetragonal, P4 2 /nnm, ID-9012310). With increasing milling time, all Bragg peaks become less intense and much broader. After 100 h of mechanical alloying, the final phase composition can be characterized as a mixture of the amorphous phase with nanocrystalline bcc-W and tiny traces of residual phases Co 3 B and Fe 2 B. It is evident from the results presented in Figure 1 that substituting Ta with W significantly reduces amorphization dynamics, and achieving a fully amorphous state would require a much longer milling time.
One of the reasons for the apparently higher resistance to amorphization observed in the case of the W-alloy is probably the higher hardness of W (HV = 3430 MPa) as compared to Ta (HV = 873 MPa). In order to quantitatively describe the progress of grain refinement of bcc-W, we analyzed its XRD profiles using the Williamson–Hall method [33], which relies on the principle that the approximate formulae for size broadening β D and strain broadening β ε show different dependencies on the Bragg angle θ , and thus the total line broadening β can be expressed in the form
β = β ε + β D = 4 ε tan θ + K λ D cos θ
where K is the Scherrer constant (in our calculations, we used K = 1 ), λ is the wavelength of X-ray radiation and D is the mean (volume average) crystallite size. In order to obtain correct information about the mean crystallite size determined from peak broadening, it is necessary to correct the measured line widths β e x p for the instrumental contribution, as described in the experimental section. Figure 2a shows a typical Williamson–Hall plot for the W-25 sample. Only those reflections of bcc-W were included in the analysis, which are not overlapped by reflections from other phases. As shown in Figure 2a, experimental points perfectly resemble linear dependence and fitting with the Equation (1) yields values of the mean crystallite size D and microstrain ε , 16.2(9) nm and 18(1) × 10 4 , respectively. A similar analysis was performed for samples W-50 and W-100. As can be see from Figure 1b, the mean crystallite size D of bcc-W phase tends to decrease with increased milling, whereas the lattice constant a shows the opposite behavior. The level of microstrain ε decreases with increasing milling time and values 11(1) × 10 4 and 2(2) × 10 4 are observed for the W-50 and W-100 samples, respectively. Decreasing values of ε may point to the relaxation of a microstructure induced by MA.

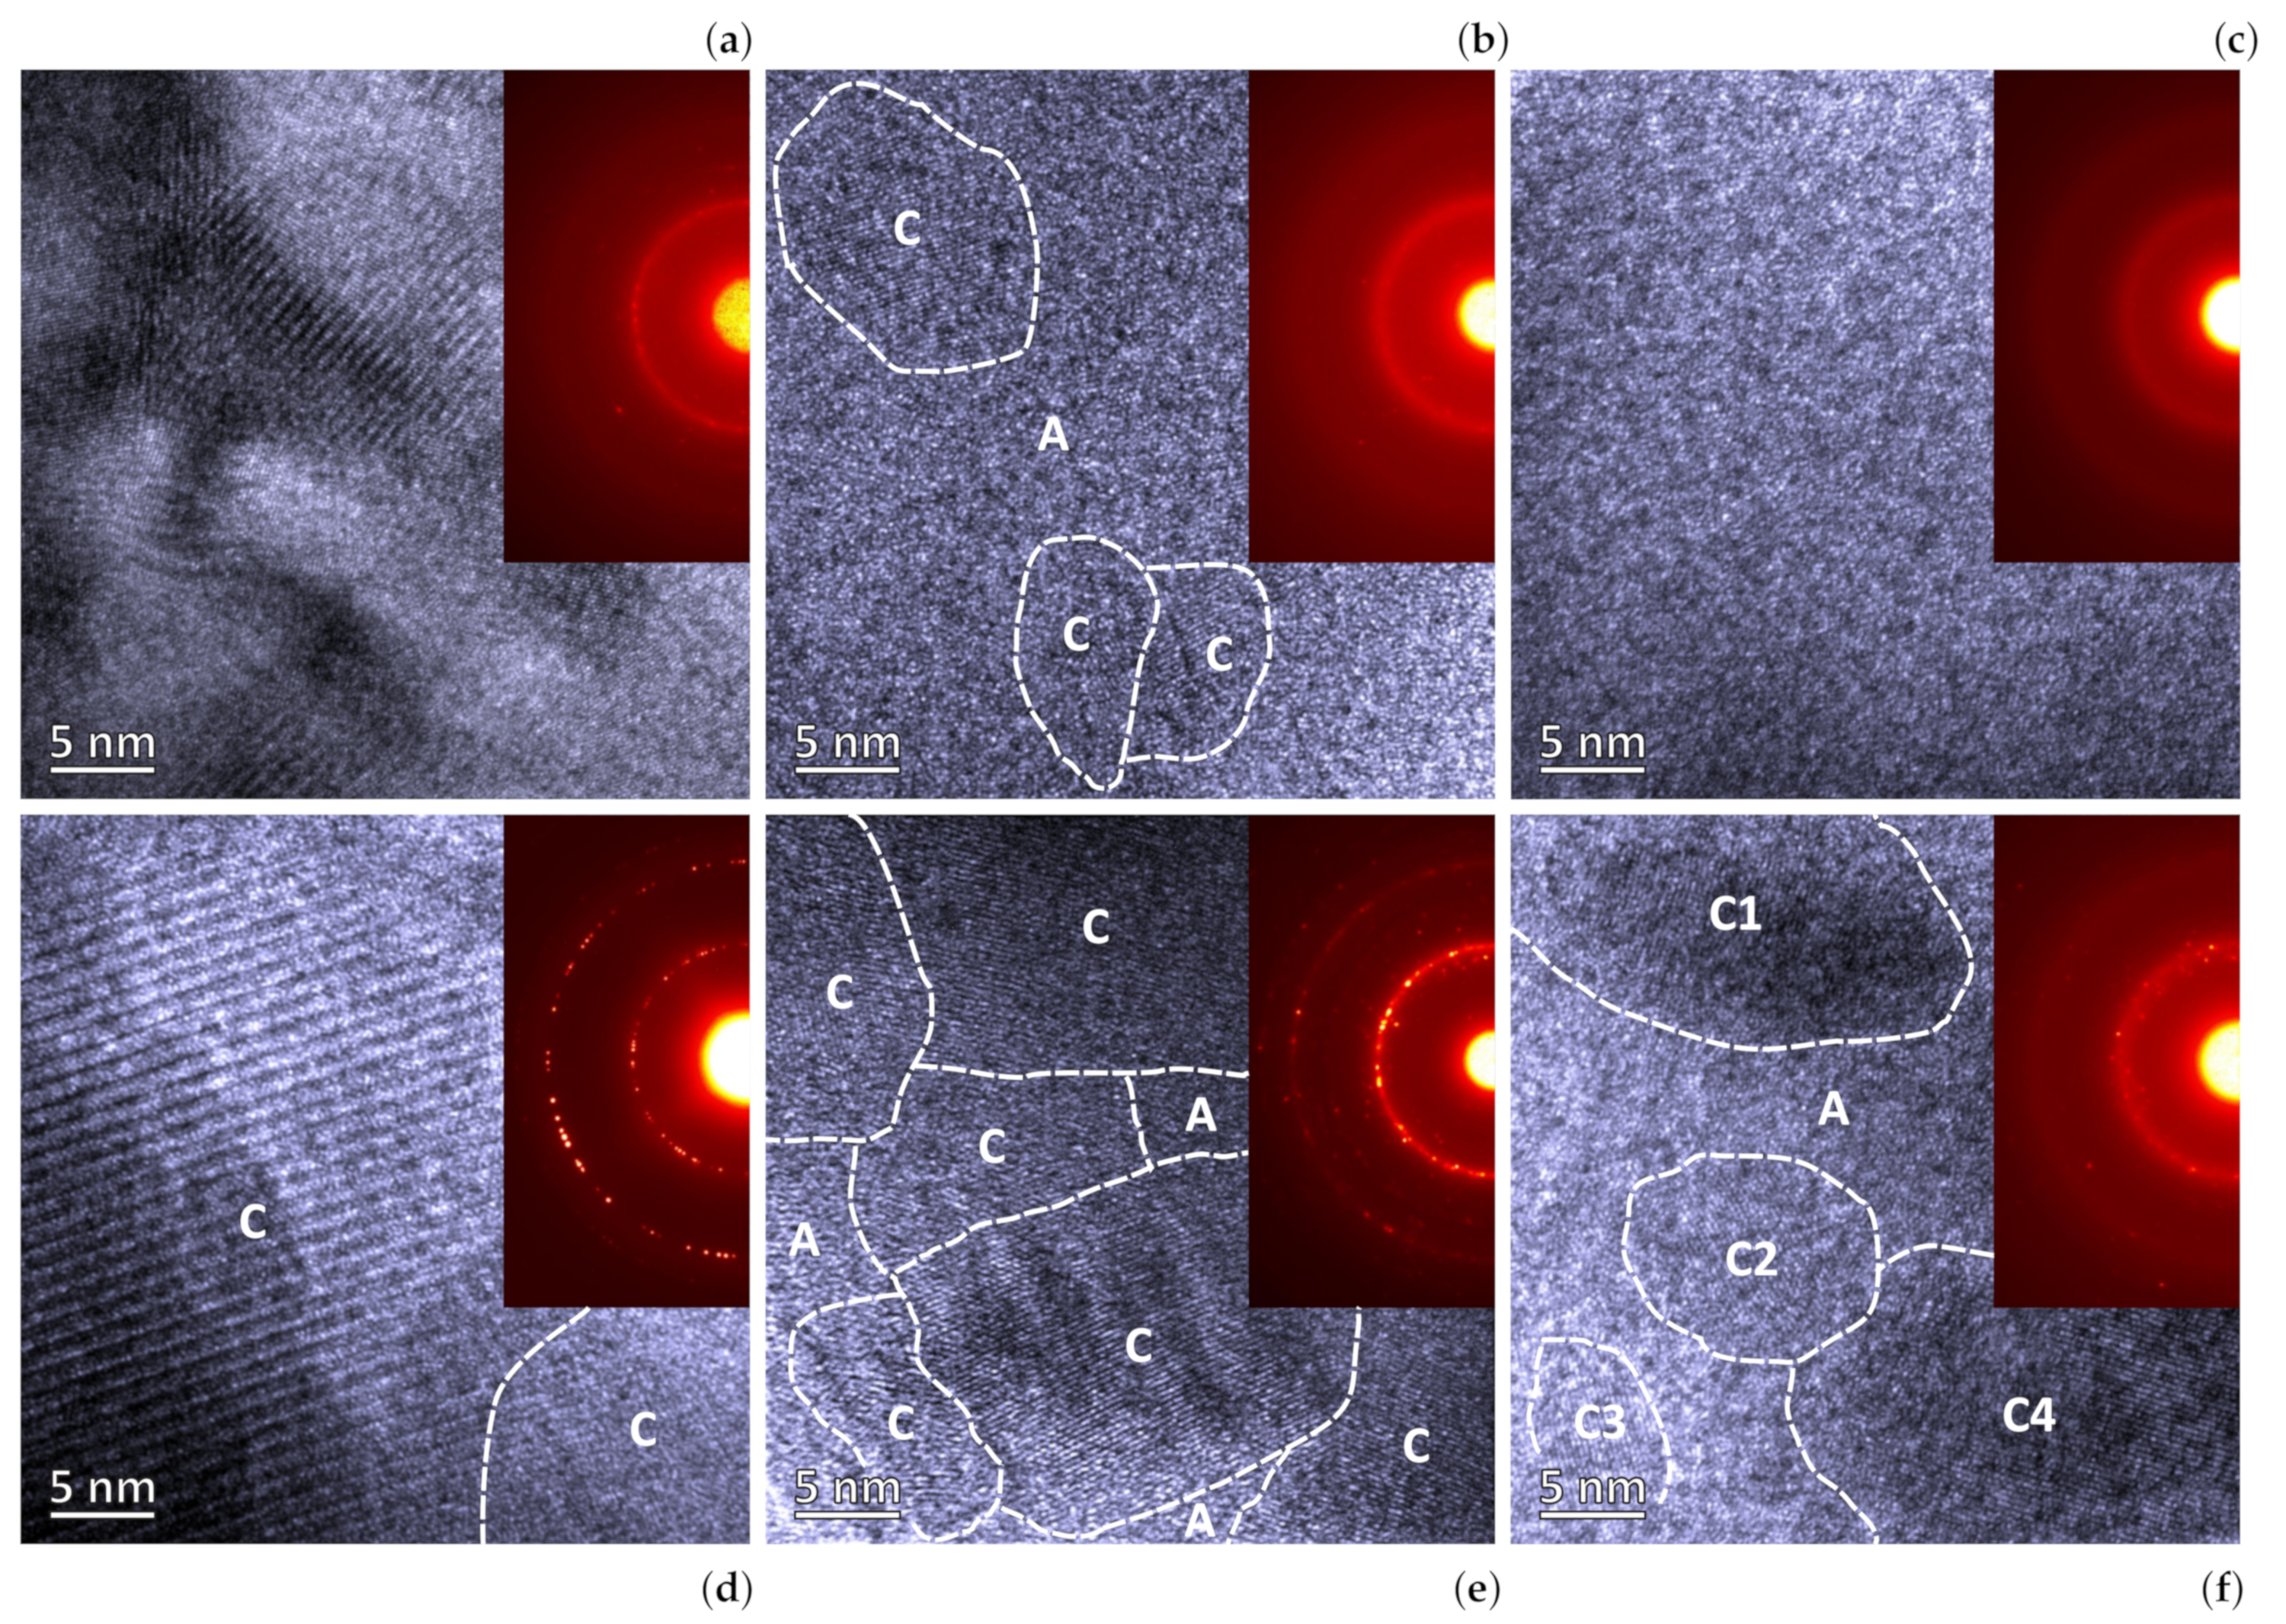
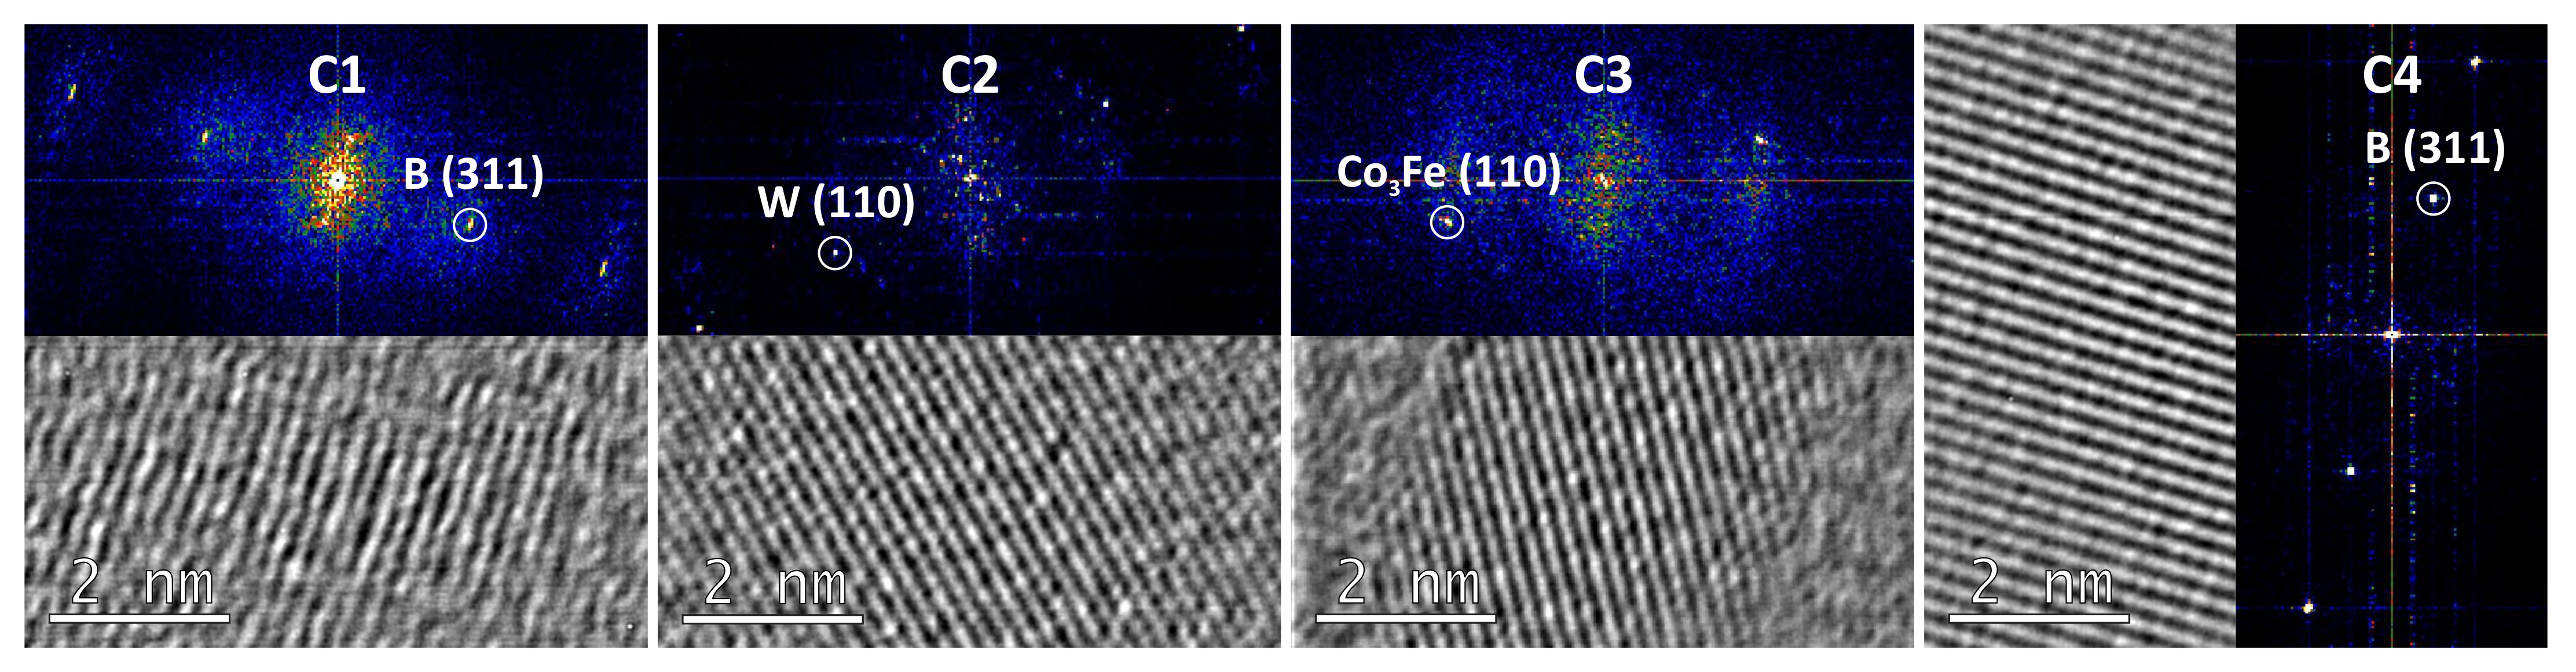
3.2. Transmission Electron Microscopy

Figure 3 shows the collection of HRTEM images of Ta- and W-containing alloys at various stages of mechanical alloying. Due to the larger diameter of powder particles, their transparency for electron beam was lowered and, consequently, an HRTEM phase contrast attenuated. Despite this, the HRTEM patterns were still resolved with enhancement of the contrast by applying the fast Fourier transformation filtering together with the inverse fast Fourier transformation. Both alloys revealed crystalline structures with nanocrystals with crystallite sizes well bellow 50 nm. TEM observation on samples Ta-25 and W-25 confirms that their structures are completely crystalline. This follows from a detailed comparison of different areas, showing that the W-25 sample shows, on average, larger crystallites as compared to the Ta-25. The HRTEM image of the W-25 sample (Figure 3d) shows only two nanocrystals fully covering the captured sample area. For better clarity, the grain boundaries between different crystalls are depicted by white dashed lines. The grain boundaries were estimated in accordance with visualized atomic planes exhibited only by crystalline volume. The superposition of signals from larger nanocrystals is revealed by SAD in which diffraction rings are formed by sharp but sparse reflections (see the inset in Figure 3d). An HRTEM image of the Ta-50 sample (Figure 3b) indicates its structure consists of nanocrystals embedded in an amorphous matrix. The SAD pattern contains only a few, very weak crystalline reflections. Amorphous rings become accentuated, indicating that the amorphous phase has a dominant volume fraction. The opposite situation is seen in the case of the W-50 sample (Figure 3e), which shows a much larger fraction of the crystalline phase, with minor content of the amorphous phase. After 100 h of milling, the Ta-alloy transforms into a fully amorphous single-phase material without any indication of crystalline artifacts (Figure 3c). The corresponding SAD pattern exhibits just two halo rings, which is evidence of a completely amorphous structure. In contrast, the W-100 sample still retains its crystalline character (Figure 3f). Its structure consists of fine nanocrystals and an amorphous phase. Despite the crystalline reflections, diffraction rings visible on SAD pattern are not as clear, intense and well-defined as the rings on SAD patterns corresponding to samples W-25 and W-50. The reflections are rather scattered and not evenly distributed along diffraction rings, which is a typical effect of very fine nanocrystals.
However, the HRTEM image enables analysis of interplanar distances via fast Fourier Transformation of selected parts. The crystalline parts designated in Figure 3f as C1 to C4 were processed by filtering to obtain a higher information content. Filtered images were converted to the 2D Fourier patterns (see Figure 4). Analysis of the obtained reflections confirmed that interplanar distances belong to the (311) plane system of tetragonal B phase and (110) plane systems of bcc-W and bcc-Co 3 Fe phases, which were also identified by XRD (see Figure 1). Although TEM analysis has a very local character, the obtained results prove a similar tendency in the microstructure evolution of both alloys, as seen by XRD, which averages the structural information over a much larger sample volume. In case of both alloys, it is seen that the crystallite size decreases with increasing milling time, which is usually observed for the MA technique [34]. Furthermore, an increase in the fraction of amorphous phase with milling time is observed.
The actual chemical compositions of powder materials after 100 h of MA were verified by EDX spectroscopy analysis using a scanning electron microscope. A very good agreement with the nominal composition was confirmed. No extra relevant elements or elements with excessive fraction were found. The determined compositions (in at.%) for the Ta-100 and W-100 are Co(45.0)Fe(20.6)T(3.5)B(30.9) and Co(49.2)Fe(22.7)W(3.1)B(25.0), respectively. An almost perfect match with the nominal composition in case of the Ta-100 sample can be explained by its fully amorphous nature, which is intrinsically homogeneous.

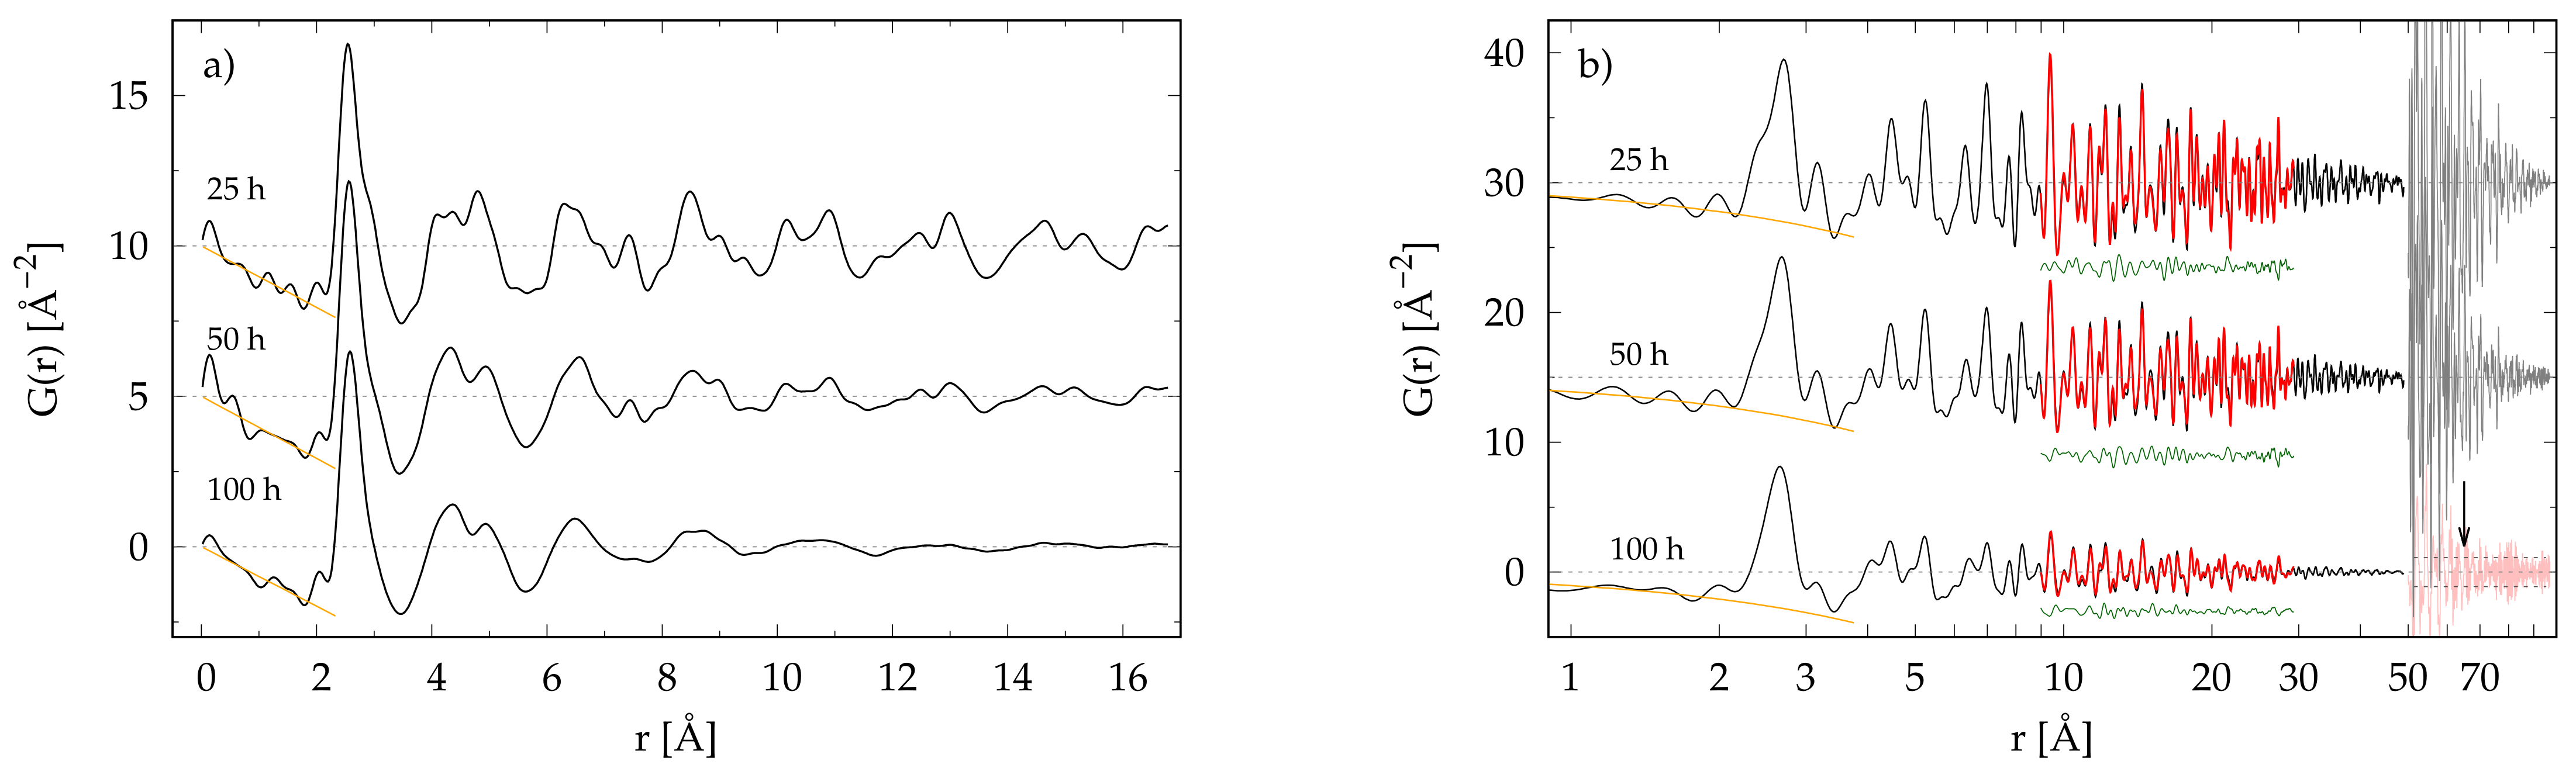
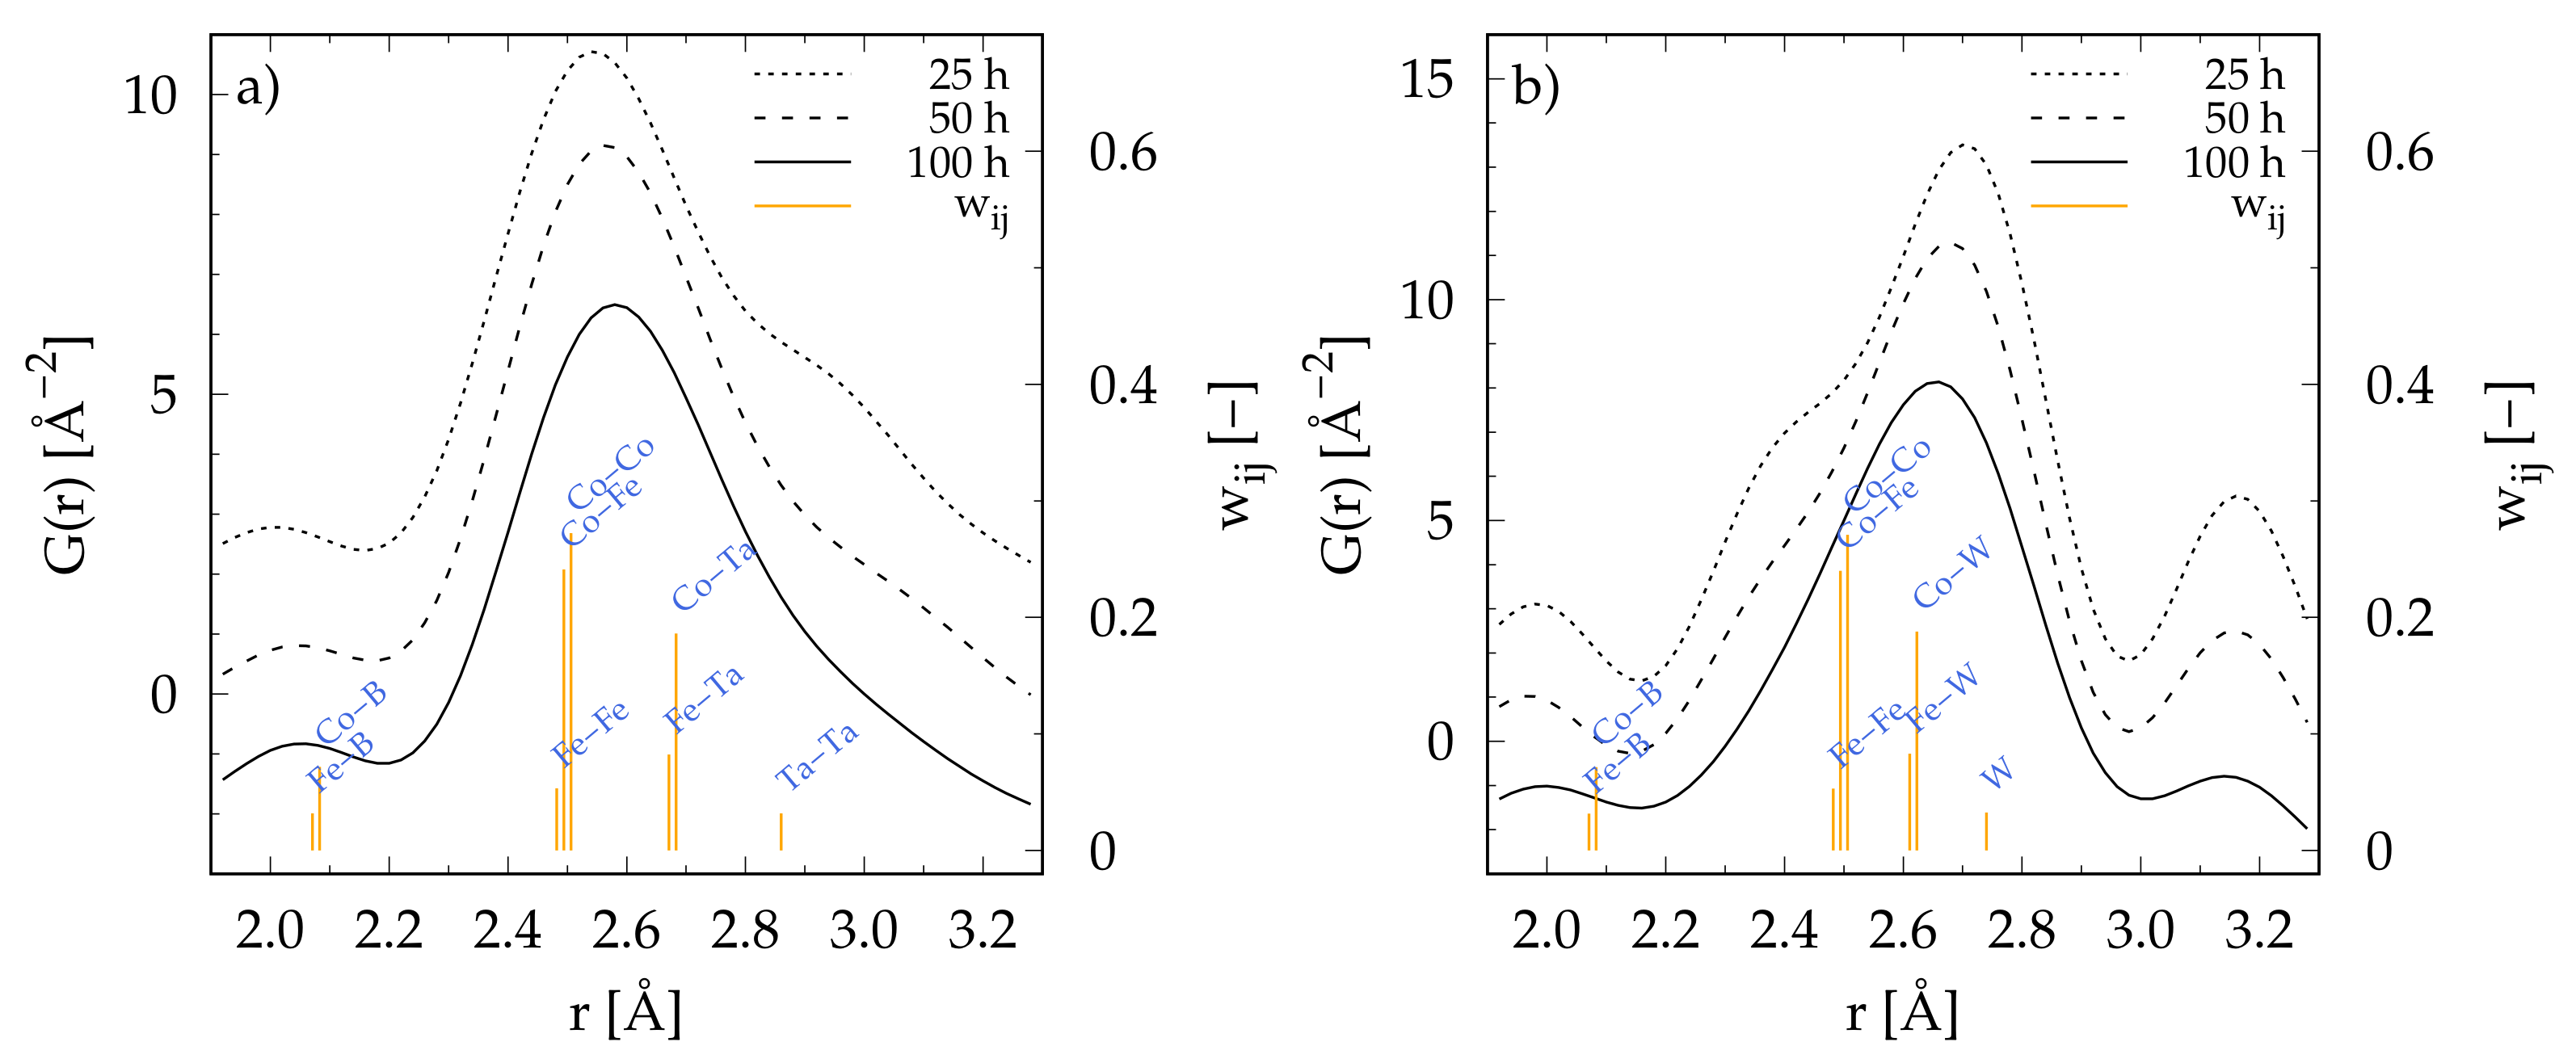
3.3. Local Atomic Structure from Pair Distribution Function

The scattering intensity profiles I ( q ) presented in Figure 1 were corrected for background scattering, sample absorption, incoherent and multiple scattering, and then normalized with respect to the chemical composition and atomic scattering factors of respective atoms by procedures described in [22,23]. In this way, each intensity profile I ( q ) was transformed into the structure factor S ( q ) , which represents an intrinsic property of a given material, directly related to its scattering amplitude. Figure 5 shows a comparison of q-weighted structure factors F ( q ) = q [ S ( q ) 1 ] for both alloys at different stages of mechanical alloying. One should bear in mind that structure factors F ( q ) qualitatively show the same structural information about the progress of mechanical alloying, as concluded from the raw scattering intensity profiles I ( q ) presented in Section 3.1.
Longer milling times imply the increasing extent of structural disorder present in the milled material due to various processes, such as grain refinement, the generation of structural defects and, finally, amorphization, which is taking place in both alloys, although at different rates. All of this gives rise to a diffuse scattering signal, which is spread in a wide range of reciprocal space. Such a signal carries essential information regarding the local atomic ordering and can be better analyzed when Fourier transforming structural information is represented in reciprocal space by structure factor F ( q ) to a reduced pair distribution function G ( r ) , which represents the same structural data, but in real space. The corresponding reduced pair distribution function, G ( r ) , can be obtained through a sine FT
G ( r ) = 4 π r [ ρ ( r ) ρ 0 ] = 4 π r ρ 0 [ g ( r ) 1 ] = 2 π 0 q S ( q ) 1 sin ( q r ) d q
where ρ ( r ) and ρ 0 are the atomic pair density and average atomic number density, respectively, g ( r ) = ρ ( r ) / ρ 0 is the pair distribution function, and r is the radial distance. As can be seen from Equation (2), a reliable G ( r ) can be obtained when S ( q ) is measured up to high magnitudes of wave momentum vector transfer q. In this study, we used q m a x = 18 Å 1 . It should be noted here that the q m a x is closely related to the real space resolution Δ r . Choosing a q m a x which is too low implies the presence of spurious oscillations, due to the so-called truncation error, which can be readily seen on a low r-range of G ( r ) [35]. On the other hand, pushing the q m a x to a higher values causes the worsening of Δ q resolution, which is manifested by a dampening of G ( r ) ’s oscillations at larger r-values, and thus sets the upper limit for the correlation length, which can reliably be observed [35].
Figure 6 shows a comparison of the total reduced-pair distribution functions G ( r ) obtained through a sine Fourier transform of structure factors F ( q ) presented in Figure 5. In case of the Ta-alloy (Figure 6a), it is readily seen from G ( r ) that, after 100 h of mechanical alloying, a fully amorphous material is formed. Its G ( r ) reveals the presence of broad oscillations which rapidly decay with increasing r-values and are not visible above 16 Å. This is a fingerprint of the missing long-range order, usually observed in materials with a high degree of structural disorder, such as metallic glasses [23]. As can be seen from Figure 6b, G ( r ) of the W-25 sample shows much sharper peaks as compared to the Ta-25. Apparently, the presence of W hinders the destabilization of its structure due to mechanical alloying and preserves long-range order, as manifested by well-resolved oscillations, visible up to large r-values. G ( r ) oscillations are getting broader and less intense with the increase in milling time. This is a direct consequence of gradual increase in structural disorder induced by mechanical alloying. Nevertheless, 100 h of milling is not sufficient to reach the fully amorphous state of the W-alloy, as evidenced by relatively strong oscillations in the final G ( r ) . Dampening of the G ( r ) ’s oscillations at large r values (seen in Figure 6b) is a consequence of the limited Δ q resolution in reciprocal space [35]. Evaluation of G ( r ) for standard material LaB 6 (not shown here) indicates that the Δ q resolution (influenced by our setting with q m a x = 18 Å 1 ) restricts the maximum correlation length to 105 Å. Inspecting the tails of G ( r ) s above 50 Å (Figure 6b) indicates that the oscillations in the sample W-100 enter the noise level at the maximum correlation length r = 65(5) Å. This distance basically represents the mean crystallite size associated with the bcc-W phase and is in perfect agreement with the value 57(10) Å obtained by XRD (see Figure 1). In case of samples W-25 and W-50, the mean crystallite sizes cannot be determined in such a way since their G ( r ) s suffer from limited Δ q resolution.
To quantitatively describe the impact of MA on a medium-range order (r-range 9 , 29 Å) of W-containing samples, its G ( r ) s were fitted using the program PDFgui [27]. The structural model consisted of the most prominent crystalline phases, bcc-W and bcc-Co 3 B. As can be seen from Figure 6b, the proposed model satisfactorily describes features of G ( r ) . It follows from fitting results that, in case of bcc-W phase, its lattice parameter increases from 3.1560(5) Å at 25 h up to 3.1674(5) Å at 100 h. Similarly, the lattice parameter of bcc-Co 3 B phase increases from 2.8498(3) Å at 25 h up to 2.8797(4) Å at 100 h. As can be seen from the comparison in Figure 1, there is a slight offset between the values obtained by the XRD and PDF methods, although both reveal similar trends for the lattice parameter change with milling time. The mean square displacement u 2 of the atomic positions gives a direct measure of the atomic disorder. Refined values of the u 2 parameter associated with bcc-W and bcc-Co 3 B phases after 25 h of MA are 0.0101(1) Å 2 and 0.0961(2) Å 2 , respectively, and after 100 h of milling change to 0.0046(1) Å 2 and 0.0962(6) Å 2 , respectively. One may conclude that the bcc-Co 3 B phase shows a value one order of magnitude higher than the u 2 parameter as compared to bcc-W phase and this remains constant for milling times above 25 h. The observed decrease in the u 2 in case of bcc-W may be correlated with decreasing values of microstrain ε , as revealed by Williamson–Hall analysis.
Figure 7 shows a detailed view of G ( r ) , depicting the first coordination shell (the nearest atomic neighborhood covering r-range 1.8–3.4 Å) for Ta- and W-containing alloys after different milling times. It is worth noting that the peak position in G ( r ) , its width and area are closely related to the bond length, distribution of bond lengths and coordination number, respectively. Table 1 lists all atomic pairs together with their bond lengths r i j (calculated as a sum of atomic covalent radii), X-ray weighting factors w i j and enthalpies of mixing [36]. Depending on the concentration c i and X-ray atomic scattering factors f i ( q ) of constituent elements, respective atomic pairs contribute with different weights w i j to the total S ( q ) and G ( r ) . As can be seen from Figure 7a, the first coordination shell of the fully amorphous Ta-100 shows a broad main peak located at 2.6 Å with a small pre-peak at 2.05 Å and right shoulder at 2.9 Å, which are mainly due to the bond lengths of atomic pairs (Co,Fe)–(Co,Fe), (Co,Fe)–B and Ta–Ta, respectively. In case of the W-100, there is also a good agreement between theoretically expected bond lengths and the shape of the first coordination shell. In addition to the amorphous phase, there are visible traces of bcc-W (with lattice parameter a = 3.174 Å), which still contributes to the first shell by two characteristic peaks, stemming from the inter-atomic distances between W atoms in bcc structure, located at a 3 / 2 (2.74 Å) and a (3.17 Å).
Since ρ ( r ) becomes zero below a certain r m i n , the average atomic number density ρ 0 can be easily obtained by a linear fit of G ( r ) ’s low r part (where r r m i n ) to 4 π r ρ 0 . From G ( r ) the radial distribution function, R D F ( r ) , can be calculated by
R D F ( r ) = 4 π r 2 ρ 0 g ( r ) = 4 π r 2 ρ 0 + r G ( r ) .
The average total coordination number, C N , around any given atom in a spherical shell between radii r 1 and r 2 , can be calculated as
C N = r 1 r 2 R D F ( r ) d r = 4 π ρ 0 3 r 2 3 r 1 3 + r 1 r 2 r G ( r ) d r .
Fitting 4 π ρ 0 r to the G ( r ) for r 1.8 Å the value of the mean atomic density ρ 0 was determined. The average total coordination number C N in the first coordination shell (between radii 1.8 and 3.4 Å) was calculated according to Equation (4). It follows from the numerical data presented in the Table 2 that the mean atomic density ρ 0 and total coordination number C N for both alloys decrease with increasing milling time. Furthermore, the data suggest that the relative change in ρ 0 and C N with milling time is larger in case of the W-alloy. However, one should bear in mind that the Ta-alloy is after 25 h of MA, much closer to its final amorphous state, and thus reveals slower dynamics with increasing milling. CoFeTaB amorphous alloy is known to exhibit rather dense atomic packing [37]. For example, the work of Kaban et al. [37] reports partial coordination numbers, which, after adjusting for the alloy composition, yield the total coordination number 13 ± 1, in perfect agreement with our study, i.e., 14.2 ± 0.3 for fully amorphous Ta-100.

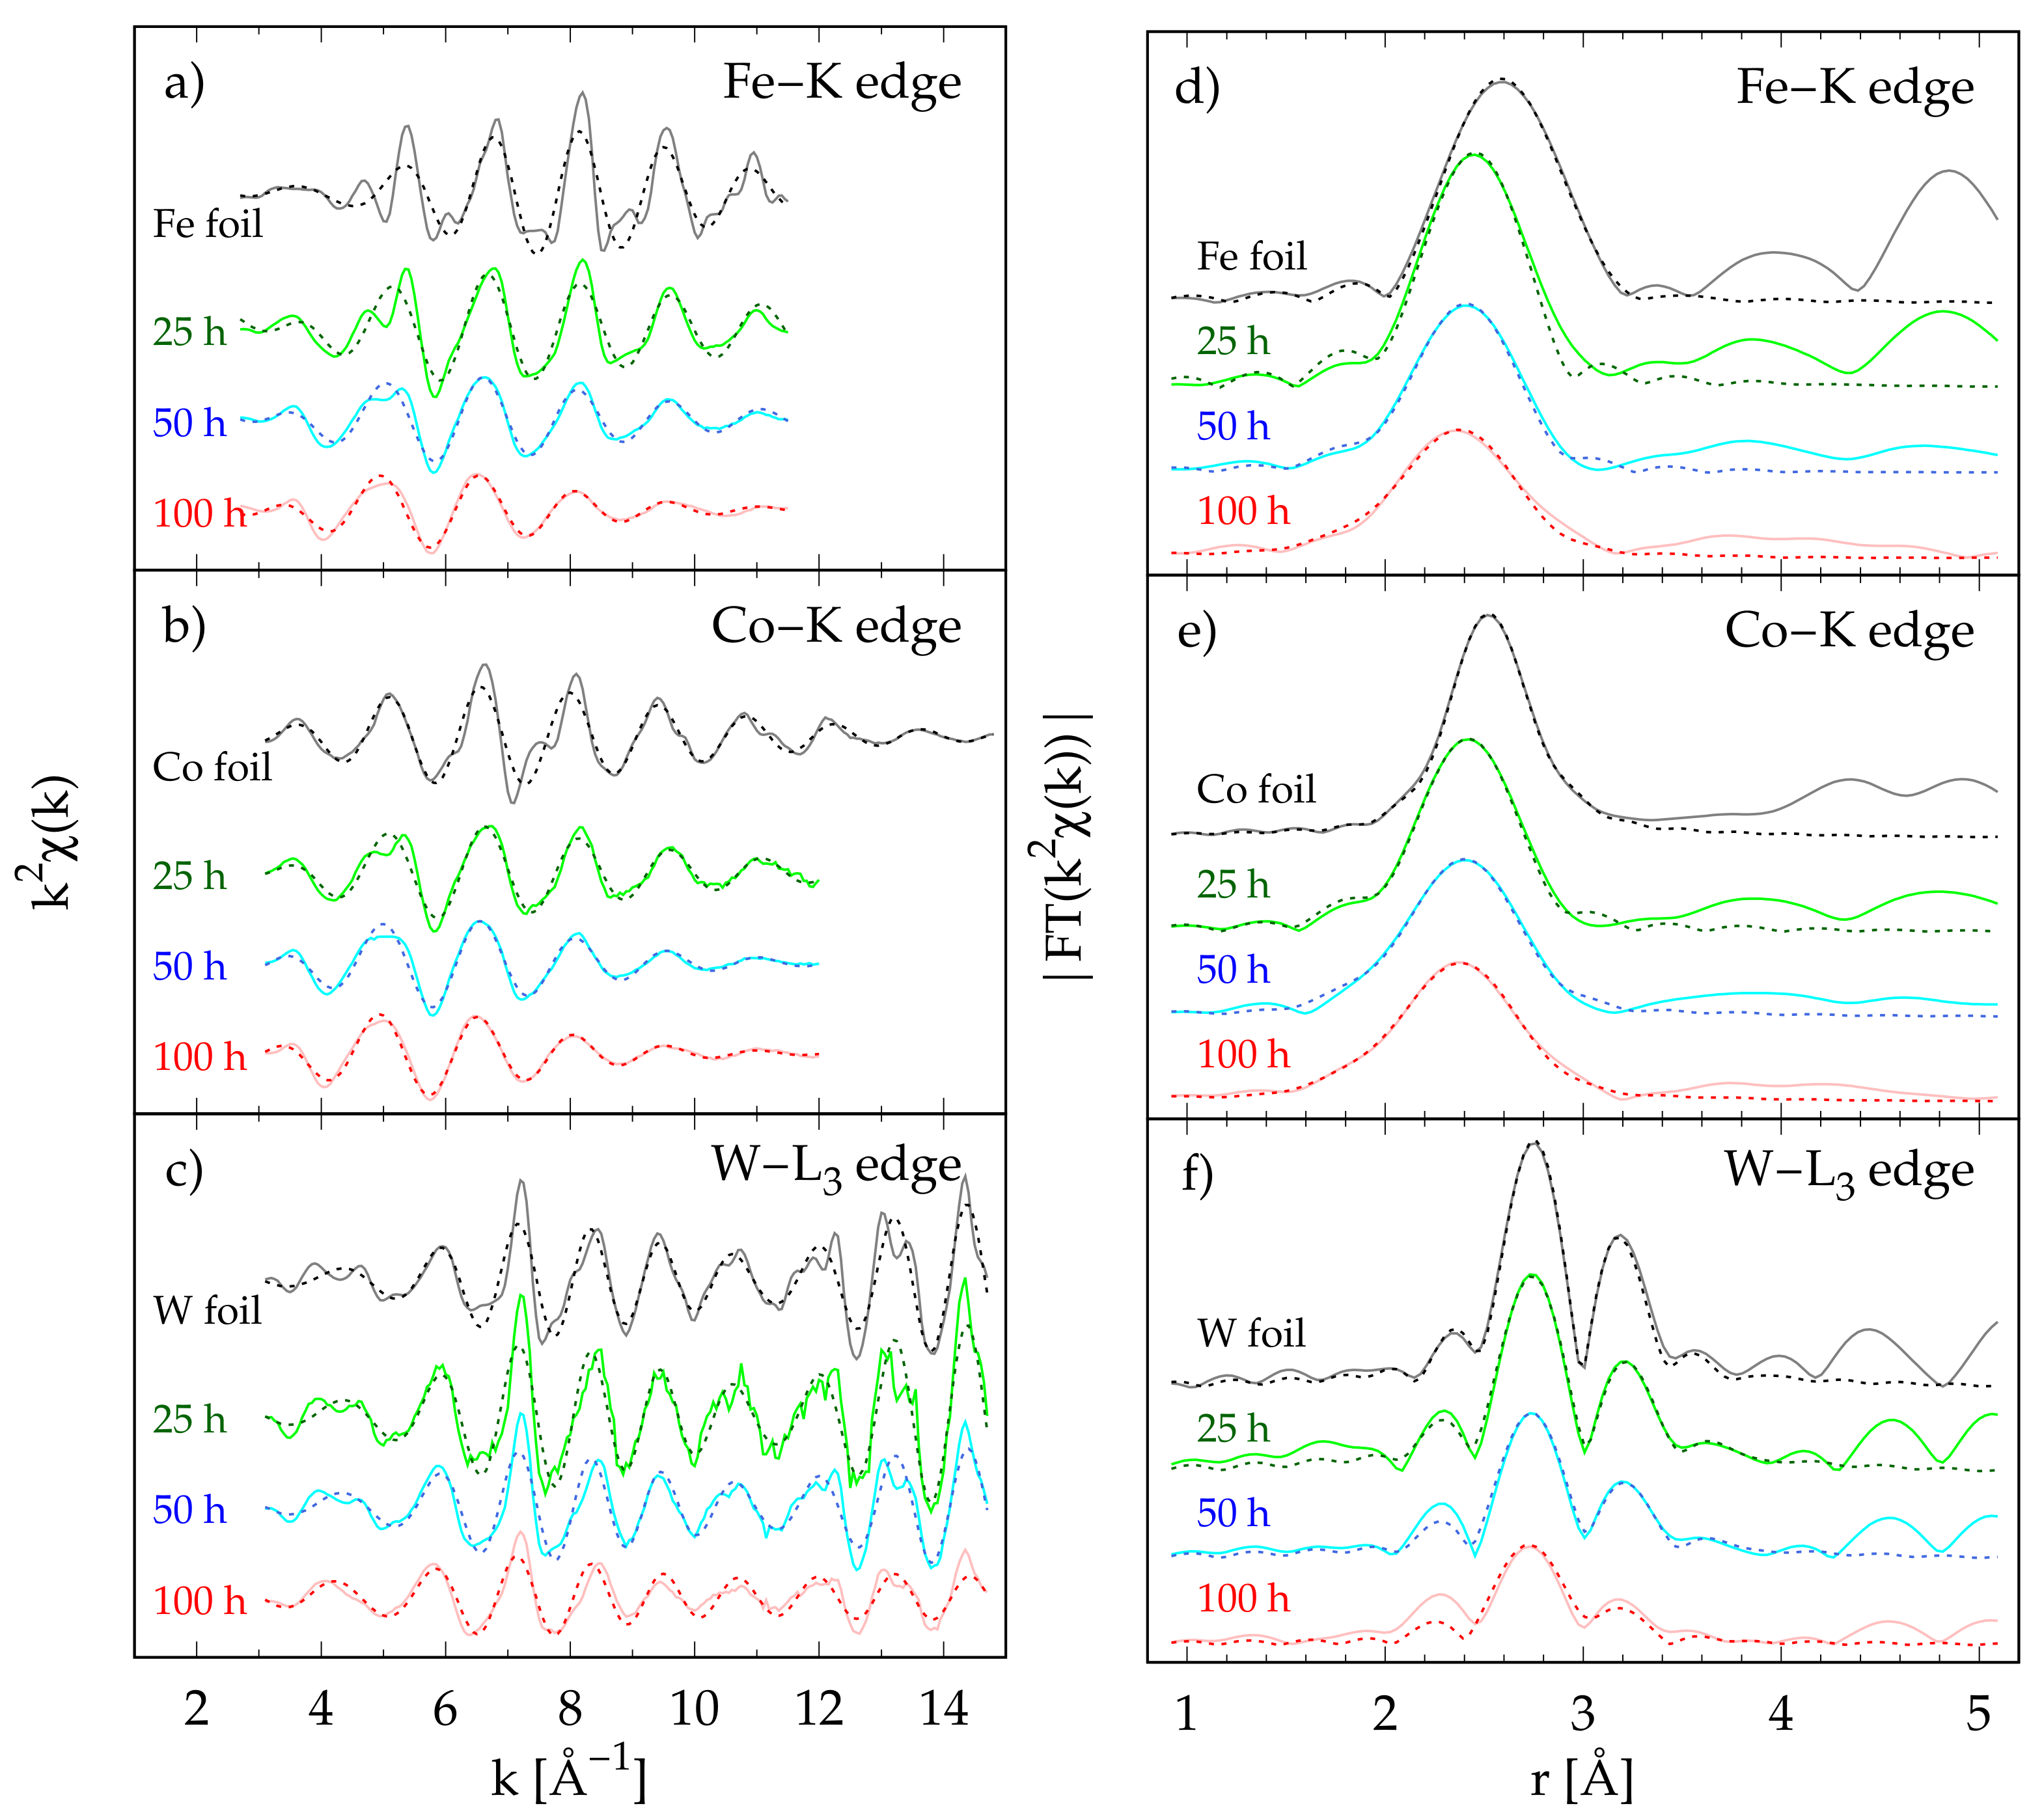
3.4. X-ray Absorption Spectroscopy

Experimentally recorded absorption scans μ ( E ) were converted to the χ ( k ) functions by χ ( k ) = [ μ ( E ) μ 0 ( E ) ] / Δ μ 0 in which μ 0 ( E ) is a smooth background function representing the absorption of an isolated atom, Δ μ 0 is the measured jump in the absorption μ ( E ) at the respective absorption edge energy E 0 . The χ ( k ) represents oscillations as a function of photo-electron wave number k and is further referred to as the EXAFS signal. Various frequencies apparent in the EXAFS signal are due to the different neighboring coordination shells, which can be described by the following equation
χ ( k ) = j N j k R j 2 S 0 2 F j ( k ) exp ( 2 k 2 u j 2 ) sin [ 2 k R j + δ j ( k ) ]
where the summation goes over different coordination shells j, F j ( k ) and δ j ( k ) are the scattering amplitude and phase shift in the atoms neighboring the central excited atom, respectively, N j is the number of neighboring atoms (partial coordination number) which are at a distance R i from the excited atom, u j 2 is the mean square displacement of the neighboring atoms and gives a direct measure of the atomic disorder, S 0 2 is the energy-independent, many-body amplitude reduction factor that accounts for losses only within the central absorbing atom and is independent of the chemical nature and type of back-scattering atoms. In EXAFS, since one selects the absorbing center, the measured signal signal is summed over the subset of all the atomic species around the absorbing atom. This means that EXAFS is highly sensitive to the nearest-neighbor atomic environment surrounding the absorbing atom, which is often a crucial point in the characterization of structural disorder [38].
EXAFS signals k 2 χ ( k ) of Ta- and W-containing alloys recorded above Fe-K, Co-K, Ta-L 3 and W-L 3 edges are shown in Figure 8a–c and Figure 9a–c, respectively. It is evident that all EXAFS signals extend to a maximum of k at around 12 Å 1 . This is closely related to the loss of structural order during the MA process. The only exception is EXAFS signals of W-containing samples, measured above the W-L 3 edge, which show strong and well-resolved oscillations visible up to 15 Å 1 . The corresponding phase-corrected magnitudes | F T ( k 2 χ ( k ) ) | for the Ta- and W-containing alloys are shown in Figure 8d–f and Figure 9d–f. After 25 h of MA, similarity with a bcc-Fe-like structure can be observed for both alloys. Further milling implies a loss of structural order, as manifested by washing out of the second coordination shell signal, and only the peak associated with the first coordination sphere is visible. The local atomic environments, as seen from the perspective of Fe and Co atoms, are quite similar for both alloys and exhibit a broad peak located between 1.5 and 3 Å. EXAFS signal above Ta-L 3 edge show a similar behavior. All of this gives a direct proof of the excellent intermixing of Co, Fe, Ta and B atoms in Ta-alloy, and is in agreement with the XRD and TEM observations, confirming its fully amorphous structure after 100 h of MA. On the other hand, sharp and strong EXFAS signals measured above the W-L 3 edge for the W-containing samples (Figure 9f) give direct evidence of the poor miscibility of W among Co, Fe, B atoms, and their similarity with a reference W foil signal confirms that W atoms rather prefer the configuration of a stable bcc-W phase. EXAFS measurements confirm that MA of the CoFeWB alloy results in the formation of a two-phase material consisting of amorphous Co-Fe-B and nanocrystalline bcc-W. The main reasons behind such a poor miscibility of W within Co-Fe-B system are larger values of hardness, elastic, shear and bulk modulus and, most importantly, a much lower extent of enthalpy mixing with Co, Fe and B (see Table 1) compared with Ta.
To quantitatively compare the experimentally obtained EXAFS signals presented in Figure 8 and Figure 9, they were fitted using the so-called quick first shell model. As for the model definition, we propose that the central absorbing atom is surrounded by Co and B atoms only, which are mostly abundant in both alloys. As the Co and Fe atoms have similar radii and scattering powers, it is reasonable to consider only Co atoms. This assumption makes the model simple, physically justified and, at the same time, robust for the fitting. According to Equation (5), for each atom, the j surrounding the central absorbing atom has four parameters which can be refined, i.e., coordination number, N j , distance from the central atom, R j , energy shift, Δ E 0 j , and mean square atomic displacement factor u j 2 . Altogether, eight parameters are needed to describe this model. Since experimental data have limited Δ k range, it is necessary to reduce the number of parameters so that a reliable fit is obtained. Therefore, the following constraints were imposed on our model: (i) Δ E 0 , C o = Δ E 0 , B , (ii) u C o 2 = u B 2 and (iii) N C o + N B = C N , as determined from X-ray-scattering experiments (see Table 2). In this way, the number of fitting parameters can be reduced to five, which is just below the limit set by the Δ k and Δ r ranges used in fitting.
EXAFS data were fitted to the proposed model using following settings for the k and r ranges: (a) Fe-K edge, k = 2.7 , 11.5 Å 1 , r = 1.3 , 2.6 Å, (b) Co-K edge, k = 3.1 , 12 Å 1 , r = 1.3 , 2.6 Å, (c) Ta-L 3 edge, k = 3.4 , 13 Å 1 , r = 1.2 , 3.0 Å and (c) W-L 3 edge, k = 3.1 , 14.7 Å 1 , r = 1.6 , 3.4 Å. The value of parameter S 0 2 at a given absorption edge was obtained by fitting the EXAFS signal of a corresponding reference foil based on its crystal structure (bcc-Fe, fcc-Co, bcc-W and bcc-W). It should be noted here that, for fitting the EXAFS data at W-L 3 edge, we used two single scattering paths with lengths 2.74 Å and 3.17 Å as suggested by the structural model of bcc-W. As can be seen from data presented in Figure 8 and Figure 9, the proposed models satisfactorily describe the observed features of EXAFS signals. Numerical results from fitting the first coordination shell are presented in Table 3 and Table 4. In case of the Ta-alloy, it is readily seen that the high degree of structural disorder among all its constituents is evidenced by the relatively large values of their mean atomic displacement factors u 2 . In case of the W-alloy, one can observe slower amorphization dynamics. Its local atomic structure, as seen from the perspective of Fe and Co atoms, resembles similar features to the Ta-alloy. The mean atomic displacement factors u 2 associated with Co, Fe and B atoms gradually increase during MA and, after 100 h, reach similar values to the Ta-alloy. This indicates the formation of an amorphous Co-Fe-B phase in the W-alloy. As can be seen from Figure 9f, W atoms do not intermix with other alloy constituents and prefer the bcc-W phase (see refined values in Table 4). An apparent discrepancy between the values of the u 2 parameter, obtained by a fitting medium range order of G ( r ) (see Section 3.3) and by fitting EXAFS data based on the first coordination shell (see Table 4), is seen in case of bcc-W phase. However, such a difference is due to the completely different length scales, to which both approaches are sensitive.

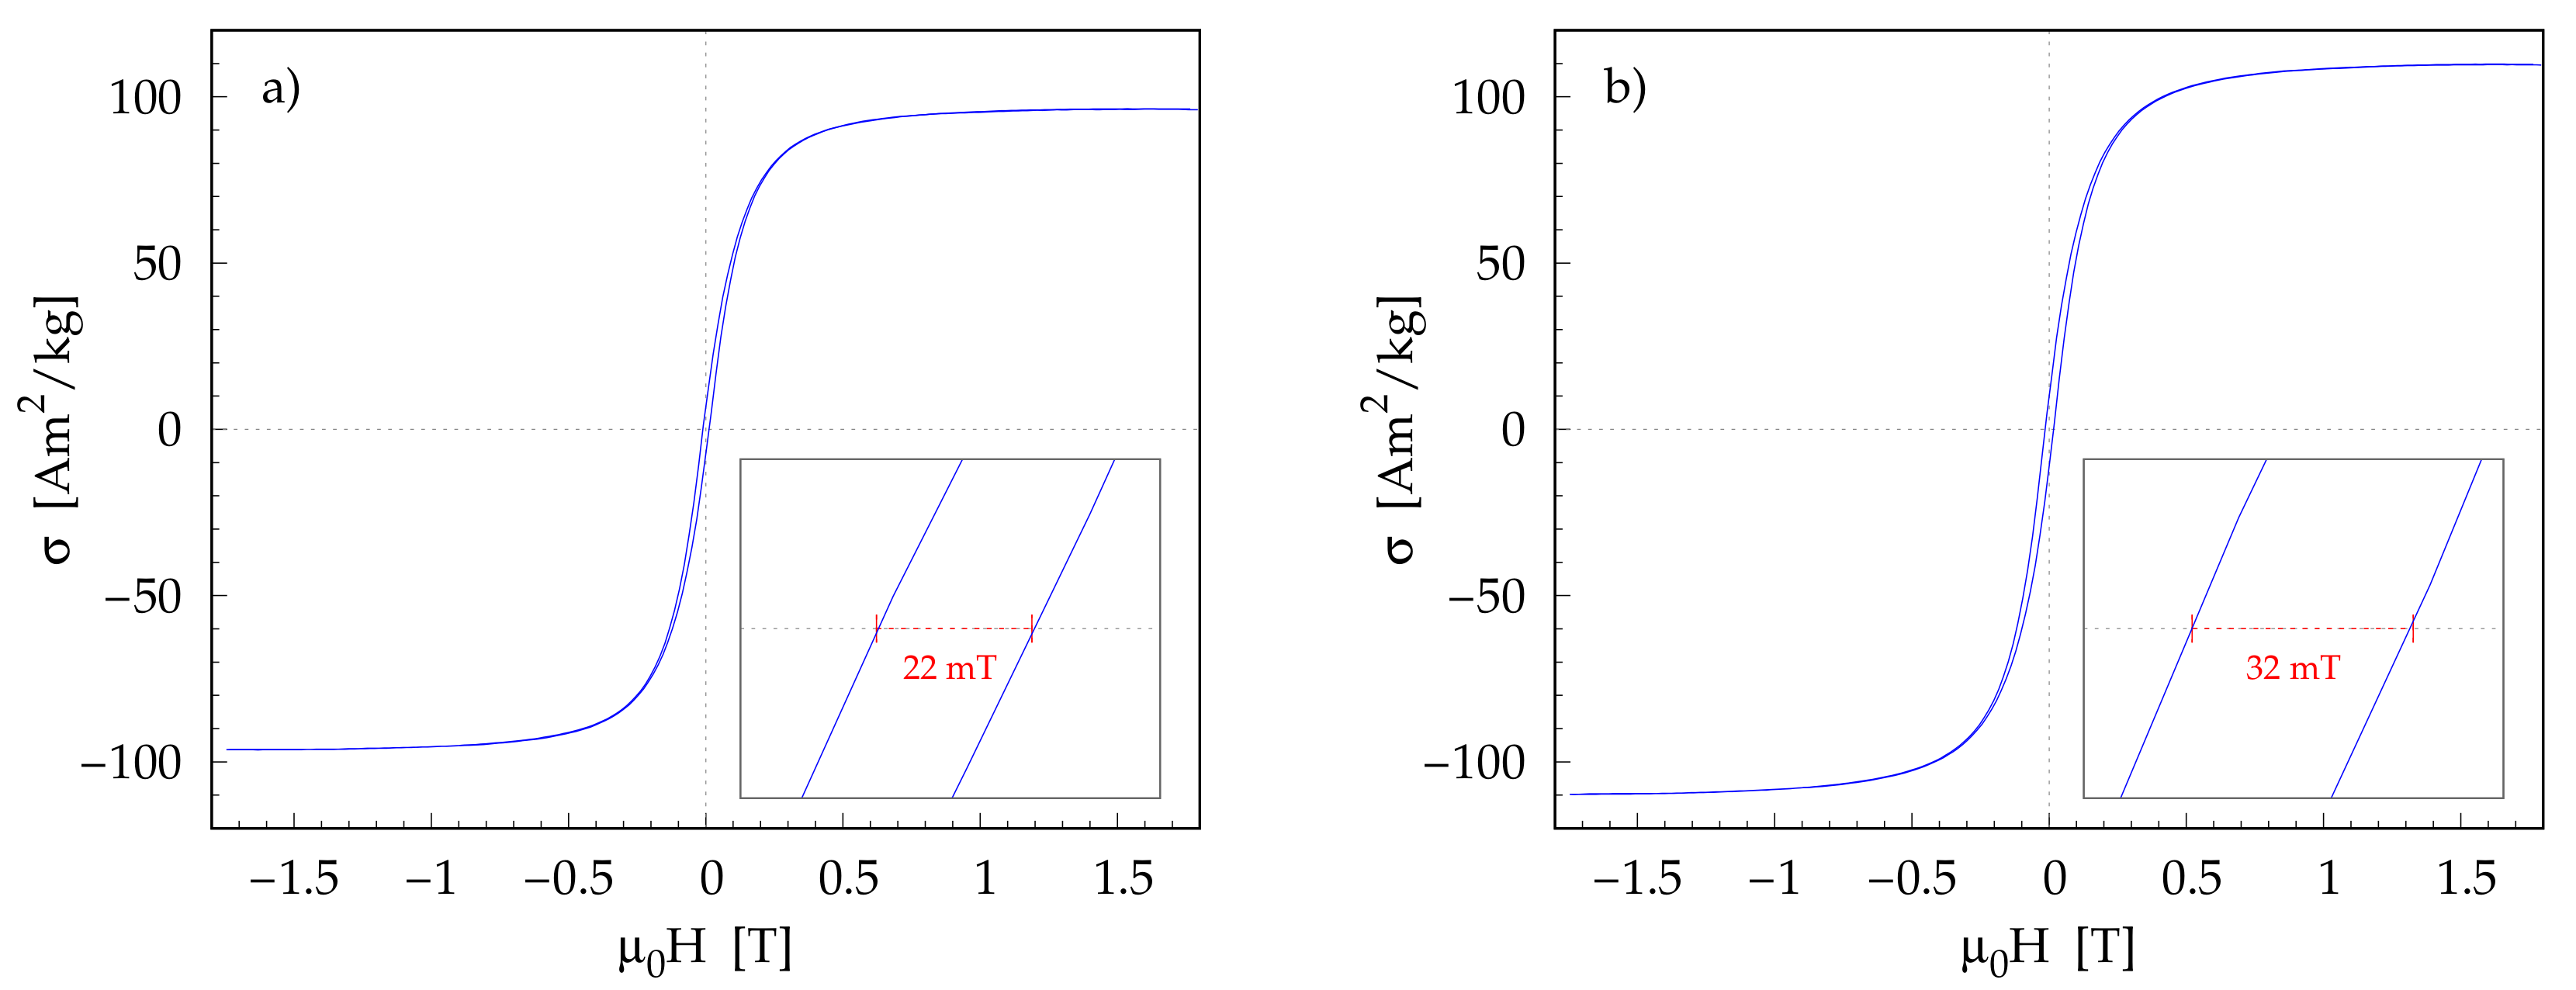
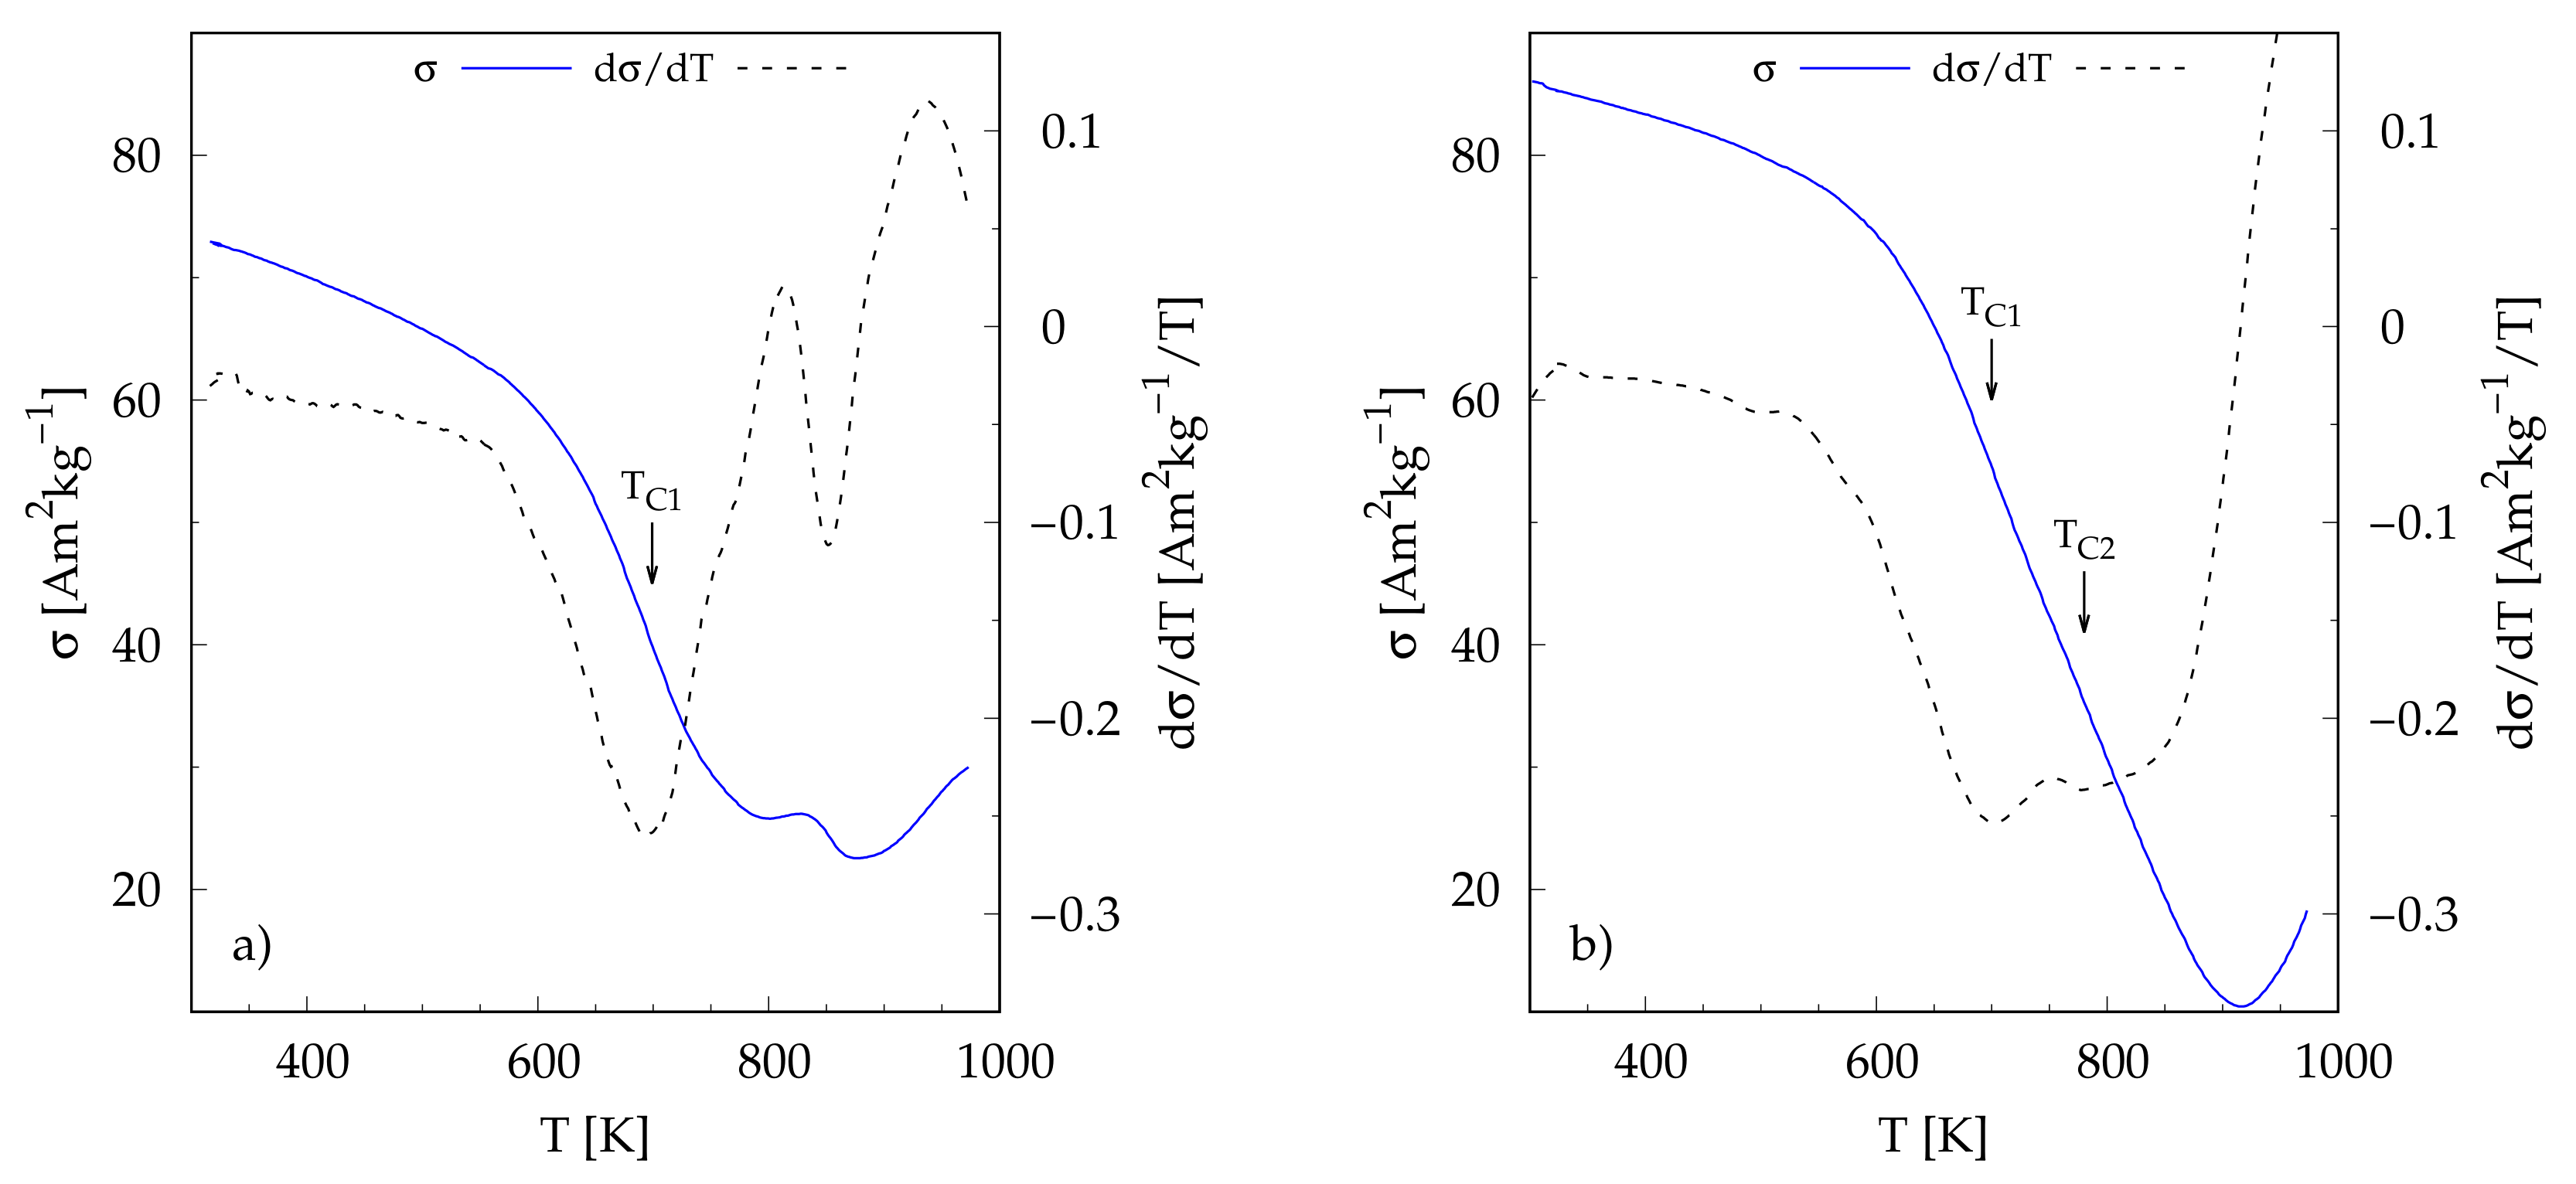
3.5. Magnetic Properties

Figure 10 shows the room-temperature hysteresis loop of CoFeTaB and CoFeWB alloys after 100 h of MA. Comparing both hysteresis loops, it follows that the W-100 shows larger values of saturation magnetization and coercivity as compared to the Ta-100.
The saturation values of specific magnetization σ s for the Ta-100 and W-100 are 96.4 and 109.8 Am 2 /kg, respectively. It could be presumed that the higher magnetization in case of the W-100 is primarily due to iron contamination from milling media. Therefore, let us calculate what the iron fraction x F e should be according to that assumption. Inserting the values of the saturation magnetization of iron ( σ F e = 222 Am 2 /kg) of the Ta-100 ( σ T a = 96.4 Am 2 /kg), and of the observed increase in the saturation magnetization ( Δ σ = σ W σ T a = 13.4 Am 2 /kg) into the equation Δ σ = x F e σ F e x F e σ T a , we obtain a relatively high value for the iron fraction x F e = 10.7 wt.%. However, such a high amount of iron could be better resolved by XRD. Taking the type of mill, speed, and duration of milling into account, such a high value of x F e could not be explained in terms of contamination by attrition. It was reported by many works that the magnitude of iron contamination of the powders milled with the steel grinding medium is in the range of 1–4 wt.% [16]. The most probable explanation for the higher magnetization in case of the W-100 is the fact that W stays in bcc-W phase and does not dilute the net magnetization of amorphous Co-Fe-B by dissolving in it, as Ta does.
Values of coercivity H c for the Ta-100 and W-100 are 8.75 kA/m ( μ 0 H c = 11 mT) and 12.73 kA/m ( μ 0 H c = 16 mT), respectively. The relatively large values of H c for both materials are mainly due to the pinning of the domain walls by stress sources, intrinsic fluctuations in material properties and particle surface irregularities [39]. A significantly larger value of H c for the W-100 is due to its microstructure consisting of amorphous-phase and nanocrystalline bcc-W, which acts as an effective pinning center for the domain wall motion [40].
Figure 11 shows the temperature dependence of magnetization σ ( T ) for the Ta-100 and W-100. In both samples, the initial decrease in magnetization with temperature is caused by the decrease in the magnetization of the amorphous phase as it approaches its Curie point T C , where the paramagnetic state is reached. The Curie temperature was determined from the inflection point using the derivative of magnetization with respect to temperature, i.e., d σ / d T . The Ta-100 shows the Curie temperature of the amorphous phase T C = 695(5) K. In case of the W-100, there are two transitions detected with Curie temperatures 700(5) K and 780(5) K. This may point to the inhomogeneities of an amorphous phase [41]. After reaching T C , the magnetization of the powder samples does not drop to zero and eventually increases due to the thermally activated structural changes (relaxation, crystallization) occurring at higher temperatures.

4. Conclusions

Our results have shown that wet mechanical alloying, using hexane as a process control agent, represents an effective way of preparing materials with a high degree of structural disorder. A wet MA of Co 43 Fe 20 Ta 5.5 B 31.5 powder mixture for 100 h of milling results in the formation of a fully amorphous material. Mechanically induced amorphization occurs through the formation of intermediate phases of Co 21 Ta 2 B 6 and Fe 1.8 B 0.2 . It has been shown that substituting Ta with W effectively suppresses GFA. After 100 h of MA of Co 43 Fe 20 W 5.5 B 31.5 powder mixture, a nanocomposite material consisting of an amorphous Co-Fe-B phase and nanocrystalline bcc-W was synthesized. The main reasons for the poor miscibility of W within the Co-Fe-B system are larger values of hardness, elastic, shear and bulk modulus and, most importantly, a much lower extent of enthalpy of mixing with Co, Fe and B as compared with Ta. The observation of the local atomic structure by means of pair distribution function and extended X-ray absorption fine-structure spectroscopy were used to characterize the local atomic structure at various stages of MA. Based on observed changes in the first coordination sphere, it can be concluded that MA significantly alters the short-range order of both alloys.

Author Contributions

Conceptualization, V.G. and J.B.; methodology, V.G. and J.B.; investigation, V.G., M.L., D.Y., M.M. and J.B.; data processing, V.G., M.L., D.Y. and J.B.; data curation, V.G., M.L., D.Y., M.M. and J.B.; writing—original draft preparation, V.G. and J.B.; writing—review and editing, M.L., M.M. and P.S.; visualization, J.B.; supervision, V.G. and J.B.; project administration, V.G.; funding acquisition, V.G., P.S. and J.B. All authors have read and agreed to the published version of the manuscript.

Funding

The authors are grateful for the financial support received from the project VEGA 1/0406/20. Part of presented work was financed by the project: Research Centre of Advanced Materials and Technologies for Recent and Future Applications PROMATECH, ITMS 26220220186, supported by the Operational Program Research and Development financed through European Regional Development Fund. This work was supported by the Development Operational Programme Research and Innovation for the project New unconventional magnetic materials for applications, ITMS: 313011T544, co-funded by the European Regional Development Fund (ERDF).

Data Availability Statement

All relevant data and source codes that support the findings of this study are available from corresponding author (V.G.), upon reasonable request.

Acknowledgments

We acknowledge DESY (Hamburg, Germany), a member of the Helmholtz Association HGF, for the provision of experimental facilities. Parts of this research were carried out at beamlines P02.1 and P65 of synchrotron storage ring PETRA III. Authors would like to express thanks to O. Shylenko from P.J. Šafárik University in Košice for help with performing EDX analysis.

Conflicts of Interest

The authors declare no conflict of interest.

Abbreviations

2Dtwo-dimensional
CNCoordination Number
CODCrystallographic Open Database
EDXEnergy Dispersive X-ray
EXAFSExtended X-ray Absorption Spectroscopy
FTFourier Transform
FWHMFull Width at Half Maximum
GFAGlass Forming Ability
HRTEMHigh-Resolution Transmission Electron Microscopy
HVVickers Hardness
IRFInstrumental Resolution Function
MAMechanical Alloying
PDFPair Distribution Function
SADSelected Area Diffraction
SEMScanning Electron Microscopy
TEMTransmission Electron Microscopy
VSMVibrating Sample Magnetometer
XRDX-Ray Diffraction

References

  1. Wu, S.; Liu, Z.; Qu, R.; Zhang, Z. Designing metallic glasses with optimal combinations of glass-forming ability and mechanical properties. J. Mater. Sci. Technol. 2021, 67, 254–264. [Google Scholar] [CrossRef]
  2. Qiang, J.; Estevez, D.; Chang, C.; Man, Q.; Li, R.W.; Wang, X.; Inoue, A. High strength CoFe-based glassy alloy with high thermal stability. Mater. Lett. 2014, 114, 126–128. [Google Scholar] [CrossRef]
  3. Narushima, T. New-generation metallic biomaterials. In Metals for Biomedical Devices; Elsevier: Amsterdam, The Netherlands, 2010; pp. 355–378. [Google Scholar] [CrossRef]
  4. Coimbrao, D.D.; Zepon, G.; Koga, G.Y.; Pérez, D.A.G.; de Almeida, F.H.P.; Roche, V.; Lepretre, J.C.; Jorge, A.M.; Kiminami, C.S.; Bolfarini, C.; et al. Corrosion properties of amorphous, partially, and fully crystallized Fe68Cr8Mo4Nb4B16 alloy. J. Alloy. Compd. 2020, 826, 154123. [Google Scholar] [CrossRef]
  5. Taghvaei, A.H.; Stoica, M.; Khoshkhoo, M.S.; Kaban, I.; Bednarčik, J.; Jóvári, P.; Janghorban, K.; Eckert, J. DSC, XRD and TEM characterization of glassy Co40Fe22Ta8B30 alloy with very high thermal stability. Mater. Lett. 2013, 93, 322–325. [Google Scholar] [CrossRef]
  6. Shen, B.; Inoue, A. Enhancement of the fracture strength and glass-forming ability of CoFeTaB bulk glassy alloy. J. Phys. Condens. Matter 2005, 17, 5647–5653. [Google Scholar] [CrossRef]
  7. Shen, B.; Pang, S.; Zhang, T.; Kimura, H.; Inoue, A. Corrosion properties of Co43Fe20Ta5.5B31.5 bulk glassy alloy. J. Alloy. Compd. 2008, 460, L11–L13. [Google Scholar] [CrossRef]
  8. Nicula, R.; Stir, M.; Ishizaki, K.; Catalá-Civera, J.M.; Vaucher, S. Nanocrystallization of amorphous alloys using microwaves:In situtime-resolved synchrotron radiation studies. J. Phys. Conf. Ser. 2009, 144, 012109. [Google Scholar] [CrossRef] [Green Version]
  9. Inoue, A.; Shen, B.; Koshiba, H.; Kato, H.; Yavari, A.R. Cobalt-based bulk glassy alloy with ultrahigh strength and soft magnetic properties. Nat. Mater. 2003, 2, 661–663. [Google Scholar] [CrossRef]
  10. Inoue, A.; Shen, B.; Koshiba, H.; Kato, H.; Yavari, A.R. Ultra-high strength above 5000 MPa and soft magnetic properties of Co–Fe–Ta–B bulk glassy alloys. Acta Mater. 2004, 52, 1631–1637. [Google Scholar] [CrossRef]
  11. Hitit, A.; Talasb, S.; Kara, R. Effects of silicon and chromium additions on glass forming ability and microhardness of Co-based bulk metallic glasses. Indian J. Eng. Mater. Sci. 2014, 21, 111–115. [Google Scholar]
  12. Raanaei, H.; Fakhraee, M. Synthesis and characterization of nanocrystalline Co-Fe-Nb-Ta-B alloy. J. Magn. Magn. Mater. 2017, 438, 144–151. [Google Scholar] [CrossRef]
  13. Yazici, Z.O.; Hitit, A.; Yalcin, Y.; Ozgul, M. Effects of minor Cu and Si additions on glass forming ability and mechanical properties of Co-Fe-Ta-B Bulk metallic glass. Met. Mater. Int. 2016, 22, 50–57. [Google Scholar] [CrossRef]
  14. Hitit, A.; Gecgin, M.; Ozturk, P. Effect of Annealing on Microstructure and Microhardness of Co–Fe–Ni–Ta–B–Si Bulk Metallic Glass. J. Mater. Sci. Technol. 2015, 31, 148–152. [Google Scholar] [CrossRef]
  15. Hitit, A.; Sahin, H. The Effect of Iron Content on Glass Forming Ability and Thermal Stability of Co–Fe–Ni–Ta–Nb–B–Si Bulk Metallic Glass. Metals 2016, 7, 7. [Google Scholar] [CrossRef] [Green Version]
  16. Suryanarayana, C. Mechanical alloying and milling. Prog. Mater. Sci. 2001, 46, 1–184. [Google Scholar] [CrossRef]
  17. Tan, J.H.; Wong, W.L.E.; Dalgarno, K.W. An overview of powder granulometry on feedstock and part performance in the selective laser melting process. Addit. Manuf. 2017, 18, 228–255. [Google Scholar] [CrossRef] [Green Version]
  18. Pauly, S.; Löber, L.; Petters, R.; Stoica, M.; Scudino, S.; Kühn, U.; Eckert, J. Processing metallic glasses by selective laser melting. Mater. Today 2013, 16, 37–41. [Google Scholar] [CrossRef]
  19. Deng, L.; Gebert, A.; Zhang, L.; Chen, H.Y.; Gu, D.D.; Kühn, U.; Zimmermann, M.; Kosiba, K.; Pauly, S. Mechanical performance and corrosion behaviour of Zr-based bulk metallic glass produced by selective laser melting. Mater. Des. 2020, 189, 108532. [Google Scholar] [CrossRef]
  20. Hammersley, A.P.; Svensson, S.O.; Hanfland, M.; Fitch, A.N.; Hausermann, D. Two-dimensional detector software: From real detector to idealised image or two-theta scan. High Press. Res. 1996, 14, 235–248. [Google Scholar] [CrossRef]
  21. Caglioti, G.; Paoletti, A.; Ricci, F.P. Choice of collimators for a crystal spectrometer for neutron diffraction. Nucl. Instrum. 1958, 3, 223–228. [Google Scholar] [CrossRef]
  22. Egami, T.; Billinge, S. Underneath the Bragg Peaks: Structural Analysis of Complex Materials; Pergamon Press: Oxford, UK; Elsevier: Amsterdam, The Netherlands, 2003; Volume 16. [Google Scholar]
  23. Waseda, Y. The Structure of Non-Crystalline Materials: Liquids and Amorphous Solids; McGraw-Hill Inc.: New York, NY, USA, 1980. [Google Scholar]
  24. Faber, T.E.; Ziman, J.M. A theory of the electrical properties of liquid metals. Philos. Mag. 1965, 11, 153–173. [Google Scholar] [CrossRef]
  25. Waasmaier, D.; Kirfel, A. New analytical scattering-factor functions for free atoms and ions. Acta Crystallogr. Sect. Found. Crystallogr. 1995, 51, 416–431. [Google Scholar] [CrossRef]
  26. Qiu, X.; Thompson, J.W.; Billinge, S.J.L. PDFgetX2: A GUI-driven program to obtain the pair distribution function from X-ray powder diffraction data. J. Appl. Crystallogr. 2004, 37, 678. [Google Scholar] [CrossRef] [Green Version]
  27. Farrow, C.L.; Juhas, P.; Liu, J.W.; Bryndin, D.; Božin, E.S.; Bloch, J.; Proffen, T.; Billinge, S.J.L. PDFfit2 and PDFgui: Computer programs for studying nanostructure in crystals. J. Phys. Condens. Matter 2007, 19, 335219. [Google Scholar] [CrossRef] [PubMed] [Green Version]
  28. Welter, E.; Chernikov, R.; Herrmann, M.; Nemausat, R. A beamline for bulk sample x-ray absorption spectroscopy at the high brilliance storage ring PETRA III. AIP Conf. Proc. 2019, 2054, 040002. [Google Scholar] [CrossRef]
  29. Ravel, B.; Newville, M. ATHENA, ARTEMIS, HEPHAESTUS: Data analysis for X-ray absorption spectroscopy using IFEFFIT. J. Synchrotron Radiat. 2005, 12, 537–541. [Google Scholar] [CrossRef] [Green Version]
  30. Gražulis, S.; Chateigner, D.; Downs, R.T.; Yokochi, A.F.T.; Quirós, M.; Lutterotti, L.; Manakova, E.; Butkus, J.; Moeck, P.; Bail, A.L. Crystallography Open Database—An open-access collection of crystal structures. J. Appl. Crystallogr. 2009, 42, 726–729. [Google Scholar] [CrossRef]
  31. Taghvaei, A.H.; Stoica, M.; Vaughan, G.; Ghaffari, M.; Maleksaeedi, S.; Janghorban, K. Microstructural characterization and amorphous phase formation in Co40Fe22Ta8B30 powders produced by mechanical alloying. J. Alloy. Compd. 2012, 512, 85–93. [Google Scholar] [CrossRef]
  32. Msetra, Z.; Khitouni, N.; Suñol, J.J.; Khitouni, M.; Chemingui, M. Characterization and thermal analysis of new amorphous Co60Fe18Ta8B14alloy produced by mechanical alloying. Mater. Lett. 2021, 292, 129532. [Google Scholar] [CrossRef]
  33. Williamson, G.K.; Hall, W.H. X-ray line broadening from filed aluminium and wolfram. Acta Metall. 1953, 1, 22–31. [Google Scholar] [CrossRef]
  34. Shan, L.; Wang, X.; Wang, Y. Extension of Solid Solubility and Structural Evolution in Nano-Structured Cu-Cr Solid Solution Induced by High-Energy Milling. Materials 2020, 13, 5532. [Google Scholar] [CrossRef]
  35. Toby, B.H.; Egami, T. Accuracy of pair distribution function analysis applied to crystalline and non-crystalline materials. Acta Crystallogr. Sect. Found. Crystallogr. 1992, 48, 336–346. [Google Scholar] [CrossRef]
  36. Takeuchi, A.; Inoue, A. Classification of Bulk Metallic Glasses by Atomic Size Difference, Heat of Mixing and Period of Constituent Elements and Its Application to Characterization of the Main Alloying Element. Mater. Trans. 2005, 46, 2817–2829. [Google Scholar] [CrossRef] [Green Version]
  37. Kaban, I.; Jóvári, P.; Stoica, M.; Eckert, J.; Hoyer, W.; Beuneu, B. Topological and chemical ordering in Co43Fe20Ta5.5B31.5metallic glass. Phys. Rev. B 2009, 79, 212201. [Google Scholar] [CrossRef] [Green Version]
  38. Koningsberger, D.C.; Prins, R. X-ray Absorption; Chemical Analysis: A Series of Monographs on Analytical Chemistry and Its Applications; John Wiley & Sons: Hoboken, NJ, USA, 1988. [Google Scholar]
  39. Kronmüller, H.; Gröger, B. Domains, domain walls and the coercive field of amorphous ferromagnets. J. Phys. 1981, 42, 1285–1292. [Google Scholar] [CrossRef] [Green Version]
  40. Leonowicz, M.; Manaf, A.; Davies, H.A. Pinning controlled coercivity in rapidly solidified, low boron Fe-Nd-B-Nb alloys. Mater. Lett. 1992, 14, 277–280. [Google Scholar] [CrossRef]
  41. Gerling, R. Evidence for Different Ferromagnetic Phases in Amorphous Fe40Ni40B20 Detected by EPR. Z. Naturforschung A 1983, 38, 20–26. [Google Scholar] [CrossRef]
Figure 1. X-ray diffraction patterns I ( q ) for (a) CoFeTaB alloy and (b) CoFeWB alloy after 25, 50 and 100 h of mechanical alloying. For a better clarity curves are plotted in logarithmic scale and are vertically offset. Various symbols denote positions of Bragg peaks stemming from respective crystallographic phases.
Metals 11 00800 g001
Figure 2. (a) Williamson–Hall plot for series of Bragg reflections belonging to the bcc-W phase in CoFeWB alloy after 25 h of mechanical alloying. The mean value of crystallite size D and microstrain ε were determined from the intercept of the regression line with y-axis and its slope, respectively. (b) Evolution of the mean crystallite size D and lattice parameter a of the bcc-W phase in CoFeWB alloy with milling time as determined by XRD and PDF (only lattice parameter) in reciprocal and real space, respectively. Dashed lines are guides for the eye.
Metals 11 00800 g002
Figure 3. High-resolution TEM images with insets showing corresponding SAD patterns of CoFeTaB (ac) and CoFeWB (df) alloys at various stages of mechanical alloying: (a) Ta-25 specimen with fully crystalline structure, (b) Ta-50 specimen shows traces of few nanocrystals, (c) Ta-100 appears completely amorphous, (d) W-25 specimen appears fully crystalline, (e) mostly crystalline structure of the sample W-50, and (f) mixture of nanocrystals and amorphous structure in the sample W-100. Amorphous and crystalline areas appearing in TEM images are labeled by letters A and C, respectively.
Metals 11 00800 g003
Figure 4. 2D Fourier transformation of the corresponding areas labeled as C1, C2, C3 and C4 in the HRTEM image of the sample W-100 presented in Figure 3f. The areas C1 and C4 were identified as tetragonal B phase. Cubic phases bcc-W and bcc-Co 3 Fe were identified in areas C2 and C3, respectively. Numbers in brackets represents Miller indices of visualized atomic plane system.
Metals 11 00800 g004
Figure 5. Room temperature q-weighted total structure factors F ( q ) for (a) CoFeTaB alloy and (b) CoFeWB alloy after 25, 50 and 100 h of mechanical alloying. For better clarity, curves are vertically offset.
Metals 11 00800 g005
Figure 6. Room-temperature total pair distribution functions G ( r ) for (a) CoFeTaB and (b) CoFeWB samples after 25, 50 and 100 h of mechanical alloying. The mean atomic number density ρ 0 was determined by a linear fit of G ( r ) ’s low r part (where r 1.8 Å) to 4 π r ρ 0 (depicted by solid orange lines). For better clarity, curves are vertically offset. In case of CoFeWB sample, corresponding G ( r ) s were fitted on r-range 9 , 29 Å. Fitting and difference curves are depicted by solid red and green lines, respectively. The tails above 50 Å are magnified by a factor 50 (for W-25 and W-50) and 100 (for W-100). Small arrow located at r = 65 Å indicates a distance at which signal enters a noise level, depicted by two parallel dashed lines.
Metals 11 00800 g006
Figure 7. Detailed view of the first coordination sphere, as seen from the total pair distribution function G ( r ) for (a) CoFeTaB alloy and (b) CoFeWB alloy after 25, 50 and 100 h of mechanical alloying. For a better clarity, curves are vertically offset. Positions and heights of the vertical lines denote bond lengths r i j of atomic pairs and X-ray weighting factors w i j , respectively.
Metals 11 00800 g007
Figure 8. EXAFS signals k 2 χ ( k ) in k-space (ac) and corresponding magnitudes of its Fourier transforms in r-space (df) as measured above Fe-K, Co-K and Ta-L 3 edges for the alloy CoFeTaB after 25, 50 and 100 h of mechanical alloying. The solid lines correspond to experimental data, whereas dashed lines correspond to fitting curves based on the quick first shell model. Additionally, signals from reference foils are presented. For better clarity, curves are vertically offset.
Metals 11 00800 g008
Figure 9. EXAFS signals k 2 χ ( k ) in k-space (ac) and corresponding magnitudes of its Fourier transforms in r-space (df) as measured above Fe-K, Co-K and W-L 3 edges for the alloy CoFeWB after 25, 50 and 100 h of mechanical alloying. Solid lines correspond to experimental data, whereas dashed lines correspond to fitting curves based on the quick first shell model. Additionally, signals from reference foils are presented. For better clarity, curves are vertically offset.
Metals 11 00800 g009
Figure 10. Room temperature hysteresis loop of (a) CoFeTaB and (b) CoFeWB alloys after 100 h of milling traced in a magnetic field with maximum induction of μ 0 H = 1.8 T. The insets show detailed view of hysteresis loop origin. The width of the loop is depicted with the red dashed line and corresponds to coercivity by relationship 2 μ 0 H c .
Metals 11 00800 g010
Figure 11. Temperature dependence of magnetization σ ( T ) for (a) CoFeTaB and (b) CoFeWB alloys after 100 h of milling. Dashed lines show the respective temperature derivative of magnetization, d σ / d T . Vertical arrows depict the possible magnetic transition with corresponding Curie temperatures.
Metals 11 00800 g011
Table 1. Bond lengths r i j , X-ray weighting factors w i j and enthalpy of mixing Δ H m i x [36] of atomic pairs in Ta- and W-containing alloys. Bond lengths r i j of atomic pairs were calculated as a sum of nominal atomic covalent radii. Weighting factors w i j were calculated for q = 0  Å 1 using Equation w i j ( q ) = [ ( 2 δ i j ) c i c j f i ( q ) f j ( q ) ] / i = 1 n c i f i ( q ) 2 , where δ i j is the Kronecker delta function ( δ i j = 1 for i = j and δ i j = 0 for i j ), c i and f i ( q ) are the atomic concentration and atomic scattering factor [25] of the atomic species of type i (i = Co, Fe, Ta/W, B), respectively.
Co 43 Fe 20 Ta 5.5 B 31.5 Co 43 Fe 20 W 5.5 B 31.5
Atomic
Pair
r ij
[Å]
w ij
[–]
Δ H mix
kJ/mol
Atomic
Pair
r ij
[Å]
w ij
[–]
Δ H mix
kJ/mol
Co–Co2.5060.269Co–Co2.5060.268
Co–Fe2.4940.240−1Co–Fe2.4940.239−1
Co–Ta2.6830.186−24Co–W2.6230.187−1
Co–B2.0830.073−24Co–B2.0830.073−24
Fe–Fe2.4820.054Fe–Fe2.4820.054
Fe–Ta2.6710.083−15Fe–W2.6110.0840
Fe–B2.0710.033−26Fe–B2.0710.032−26
Ta–Ta2.8600.032W–W2.7400.033
Ta–B2.2600.025−54W–B2.2000.025−31
B–B1.6600.005B–B1.6600.005
Table 2. Evolution of the mean atomic density ρ 0 and total coordination number C N for the Ta- and W-containing alloys during mechanical alloying. Mass density ρ m was calculated considering the nominal alloy composition and respective value of ρ 0 .
Sample ρ 0
3 ]
CN
[-]
ρ m
[g/cm 3 ]
Sample ρ 0
3 ]
CN
[-]
ρ m
[g/cm 3 ]
Ta-250.0813 (28)15.0(4)6.73 (23)W-250.0890 (24)17.3(3)7.39 (20)
Ta-500.0821 (41)14.9(6)6.80 (34)W-500.0884 (59)16.7(8)7.34 (49)
Ta-1000.0786 (19)14.2(3)6.51 (16)W-1000.0829 (26)15.1(4)6.88 (21)
Table 3. Numerical results of fitting EXAFS data based on the first coordination shell model from measurements performed at the Fe-K and Co-K edges. The scatterer–absorber pairs are indicated, the partial coordination number N j , the path length R j and the mean square atomic displacement u 2 for all relevant samples are listed.
Fe K-EdgeCo K-Edge
SamplePair
i j
N j
[-]
R j
[Å]
u 2
[ × 10 4  Å 2 ]
Pair
i j
N j
[-]
R j
[Å]
u 2
[ × 10 4  Å 2 ]
Ta-25Fe-B3.3(8)2.06(5)116(8)Co-B4.3(9)2.11(5)129(13)
Fe-Co11.9(8)2.43(1)Co-Co10.9(9)2.42(2)
Ta-50Fe-B2.4(8)2.02(6)132(7)Co-B3.4(4)2.05(3)148(5)
Fe-Co12.5(8)2.44(1)Co-Co11.5(4)2.44(1)
Ta-100Fe-B4.1(4)2.02(2)117(5)Co-B3.3(4)2.01(2)139(4)
Fe-Co10.1(4)2.44(1)Co-Co10.9(4)2.44(1)
W-25Fe-B5.3(2.8)2.06(9)76(24)Co-B6.3(2.2)2.13(8)108(27)
Fe-Co12.0(2.8)2.44(3)Co-Co11.0(2.2)2.41(3)
W-50Fe-B4.9(1.5)2.05(5)107(15)Co-B5.1(1.0)2.05(4)136(11)
Fe-Co11.8(1.5)2.44(2)Co-Co11.5(1.0)2.44(2)
W-100Fe-B3.9(1.0)2.02(5)128(11)Co-B3.5(4)2.00(2)149(4)
Fe-Co11.2(1.0)2.43(1)Co-Co11.6(4)2.43(1)
Table 4. Numerical results of fitting EXAFS data based on the first coordination shell model from measurements performed at the Ta L 3 and W L 3 edges. The scatterer–absorber pairs are indicated, the partial coordination number N j , the path length R j and the mean square atomic displacement u 2 for all relevant samples are listed.
Ta-Alloy, Ta L 3 -EdgeW-Alloy, W L 3 -Edge
TimePair
i j
N j
[-]
R j
[Å]
u 2
[ × 10 4  Å 2 ]
Pair
i j
N j
[-]
R j
[Å]
u 2
[ × 10 4  Å 2 ]
25 hTa-B7.2(1.6)2.15(4)128(19)W-W5.9(7)2.74(1)43(3)
Ta-Co8.0(1.6)2.52(1)W-W8.1(7)3.16(1)
50 hTa-B6.9(1.5)2.15(4)117(17)W-W5.6(1.1)2.74(1)60(6)
Ta-Co8.0(1.5)2.55(1)W-W8.4(1.1)3.16(1)
100 hTa-B5.5(1.4)2.19(4)112(15)W-W3.4(2.8)2.72(2)102(16)
Ta-Co8.7(1.4)2.57(1)W-W10.6(2.8)3.14(2)
Publisher’s Note: MDPI stays neutral with regard to jurisdictional claims in published maps and institutional affiliations.

