Article

Decrease in Pitting Corrosion Resistance of Extra-High-Purity Type 316 Stainless-Steel by Cu2+ in NaCl

Japan Atomic Energy Agency, 2-4 Shirakata, Tokai-mura, Naka-gun, Ibaraki 319-1195, Japan
*
Author to whom correspondence should be addressed.
Metals 2021, 11(3), 511; https://doi.org/10.3390/met11030511
Submission received: 18 February 2021 / Revised: 12 March 2021 / Accepted: 16 March 2021 / Published: 19 March 2021
(This article belongs to the Special Issue Soil and Pitting Corrosion of Steel)

Abstract

:
The effect of Cu2+ in bulk solution on pitting corrosion resistance of extra-high-purity type 316 stainless-steel was investigated. Pitting occurred in 0.1 M NaCl-1 mM CuCl2, whereas pitting was not initiated in 0.1 M NaCl. Although deposition of Cu2+ on the surface occurred regardless of a potential region in 0.1 M NaCl-1 mM CuCl2, Cu2+ in bulk solution had no influence on the passive film formation. The decrease in pitting corrosion resistance in 0.1 M NaCl-1 mM CuCl2 resulted from the deposited Cu or Cu compound and continuous supply of Cu2+ on the surface.

1. Introduction

The effects of alloyed Cu on the corrosion resistance of stainless-steels are complex and depend on both the corrosion environment and Cu content. In H2SO4 environments, alloyed Cu has been found to enrich in the near surface [1,2,3] and to suppress the active dissolution of stainless-steels [4,5,6,7]. In chloride environments, alloyed Cu is both beneficial and harmful to the pitting corrosion resistance of stainless-steels. If stainless-steel contains sufficient amount of alloyed Cu, pitting initiation caused by the dissolution of MnS inclusions is inhibited by a protective Cu compound layer. This layer is produced by Cu and S species resulting from the dissolution of MnS [8,9]. Garfas–Mesias found that alloyed Cu increased the pitting potential of 25% Cr duplex stainless-steel in 1 M HCl and in 3.5% NaCl solutions [10]. However, alloyed Cu reduced the pitting corrosion resistance in chloride solutions. It has been reported that the interface between the inclusion and matrix are preferred to initiate the pitting on the Cu-containing duplex stainless-steel [11]. The passivation process of austenitic stainless-steel was influenced by alloyed Cu in acidic chloride solution, which decreased the pitting potential of stainless-steel [12]. After pitting initiation, alloyed Cu inhibits the growth of pitting corrosion. Pitting initiation on the surface of Cu-containing stainless-steels is followed by Cu2+ dissolution from the stainless-steel matrix. The dissolved Cu2+ acts as an inhibitor in acidic chloride environments formed in pits. Sourisseau et al. reported that the active dissolution rate inside the pits was suppressed by dissolved Cu2+, and that Cu-deposited insoluble copper sulfides were formed with dissolved S species [13]. The active dissolution of Cu-containing stainless-steels is known to be suppressed by Cu enrichment at the surface [12,14,15] or by the formation of a deposited Cu-containing layer [16,17,18] in acidic environments.
However, on the other hand, only a few reported studies have considered the effects of Cu2+ in the bulk solution on the corrosion resistance of stainless-steels [13,19,20]. A continuous supply of Cu2+ on the surface is likely when Cu2+ is present in the bulk solution. In contrast, the supply of Cu2+ from the stainless-steel matrix may cease after a protective Cu-containing layer is formed on the surface. Therefore, the effect of Cu2+ supply from the bulk solution on the corrosion morphology of stainless-steel may differ from that of the supply from the matrix. To understand the effects of Cu2+ in the bulk solution on the corrosion resistance of stainless-steel, specimens of Cu-free stainless-steel were investigated.
In the present study, the effects of Cu2+ in bulk solution on the pitting corrosion resistance of stainless-steel and on the formation of a passive film were analyzed. To avoid the effects of alloyed Cu on the corrosion resistance of the stainless-steel or Cu dissolution from the stainless-steel matrix, an extra-high-purity (EHP) type 316 stainless-steel (316EHP stainless-steel) was used as the sample. EHP stainless-steels have been developed to exhibit enhanced corrosion resistance by preventing the segregation of impurities [21]. The total concentration of impurities was limited to be less than 100 ppm (0.01 mass %). The amount of alloyed Cu in the 316EHP stainless-steel was expected to be sufficiently low to prevent the formation of a Cu-enriched layer on the surface and Cu dissolution into the solution.

2. Materials and Methods

2.1. Specimens and Electrolytes

An extra-high-purity type 316 stainless-steel (316EHP stainless-steel) was used as the sample material. EHP stainless-steels were manufactured by controlling the alloying elements so that there are very few impurities. The stainless-steel was produced by a vacuum induction melting furnace (KOBELCO, Kobe, Japan). A 50 kg-ingot of steel was hot-forged and hot-rolled into a 12 mm-thick plate, which was then cut into specimens of approximately 15 × 25 mm, parallel to the rolling direction. The specimens were heat-treated at 1373 K for 3.6 ks and quenched in water. The electrode surface of each specimen was mechanically ground with SiC papers and then polished to 1 µm with a diamond paste. Afterward, the specimens were ultrasonically cleaned with ethanol. The chemical composition of the stainless-steel was analyzed by Glow Discharge Mass Spectrometry (CAMECA) (GD-MS), and is listed in Table 1. The total concentration of alloying elements other than Ni, Cr, and Mo were less than 100 ppm (0.01 mass %) and are substantially lower than the concentrations in commercial type 316 stainless-steels. The Cu content of the 316EHP stainless-steel was only 6.8 × 10⁻⁴ mass %. This content was expected to be sufficiently low to ensure that the detected Cu on the surface originated from the solution, rather than from the metal.
Electrochemical measurements were performed in 0.1 M NaCl and 0.1 M NaCl-1 mM CuCl2. The pH value of 0.1 M NaCl and 0.1 M NaCl-1 mM CuCl2 was almost 5.5. All solutions were prepared from deionized water and analytical grade chemicals.

2.2. Electrochemical Measurements

Potentiodynamic anodic polarization measurements were performed using a pocketSTAT potentiostat (Ivium, Eindhoven, The Netherlands) in deaerated 0.1 M NaCl and 0.1 M NaCl-1 mM CuCl2 at 298 K. The specimen surfaces were insulated by an epoxy resin, except for the electrode area (approximately 10 mm × 10 mm) with epoxy resin (AR-R30, Nichiban, Tokyo, Japan) and subsequently with paraffin. The measurements were performed in a conventional three-electrode cell, the counter electrode was a platinum plate, and the reference electrode was an Ag/AgCl (saturated (sat.) KCl) electrode (0.197 V vs. standard hydrogen electrode at 298 K). All the potentials reported in this work refer to the Ag/AgCl (sat. KCl) electrode. The potential scan rate was 3.33 × 10⁻⁴ V s−1 (20 mV min−1). The polarization measurements were started immediately after immersion of the working electrode in the electrochemical cell to avoid the Cu deposition on the surface before the start of polarization. Each potentiodynamic polarization measurement was performed at least three times to confirm the reproducibility.

2.3. Observation and Analysis

Before and after electrochemical measurements, the electrode surfaces were observed via JSM-7000 field emission scanning electron microscopy (FE-SEM) (JEOL, Tokyo, Japan) coupled with energy-dispersive X-ray spectroscopy (EDS) (JEOL, Tokyo, Japan). Secondary electron images and EDS maps were obtained at an accelerating voltage of 15 kV. Elemental analyses on the surfaces were performed by means of Theta-probe X-ray photoelectron spectroscopy (XPS) (Thermo Fisher Scientific, Waltham, MA, USA). The XPS system consisted of an X-ray source with a monochromator, and the instrument used an aluminum anode generating Al Kα radiation (E = 1486.6 eV), a hemispherical electron energy analyzer for photoelectrons, and an Ar ion gun for depth profiling. The depth of the etching crater was measured by a VK-X3000 Laser microscope (KEYENCE, Osaka, Japan) after performing the depth profiling. In this study, an X-ray spot of 400 µm was employed. The Fe 2p, Cr 2p, Ni 2p, Mo 3d, and Cu 2p XPS spectra of the surfaces were collected. The spectra were collected at an energy step and pass energy of 0.1 and 200 eV, respectively.

3. Results and Discussion

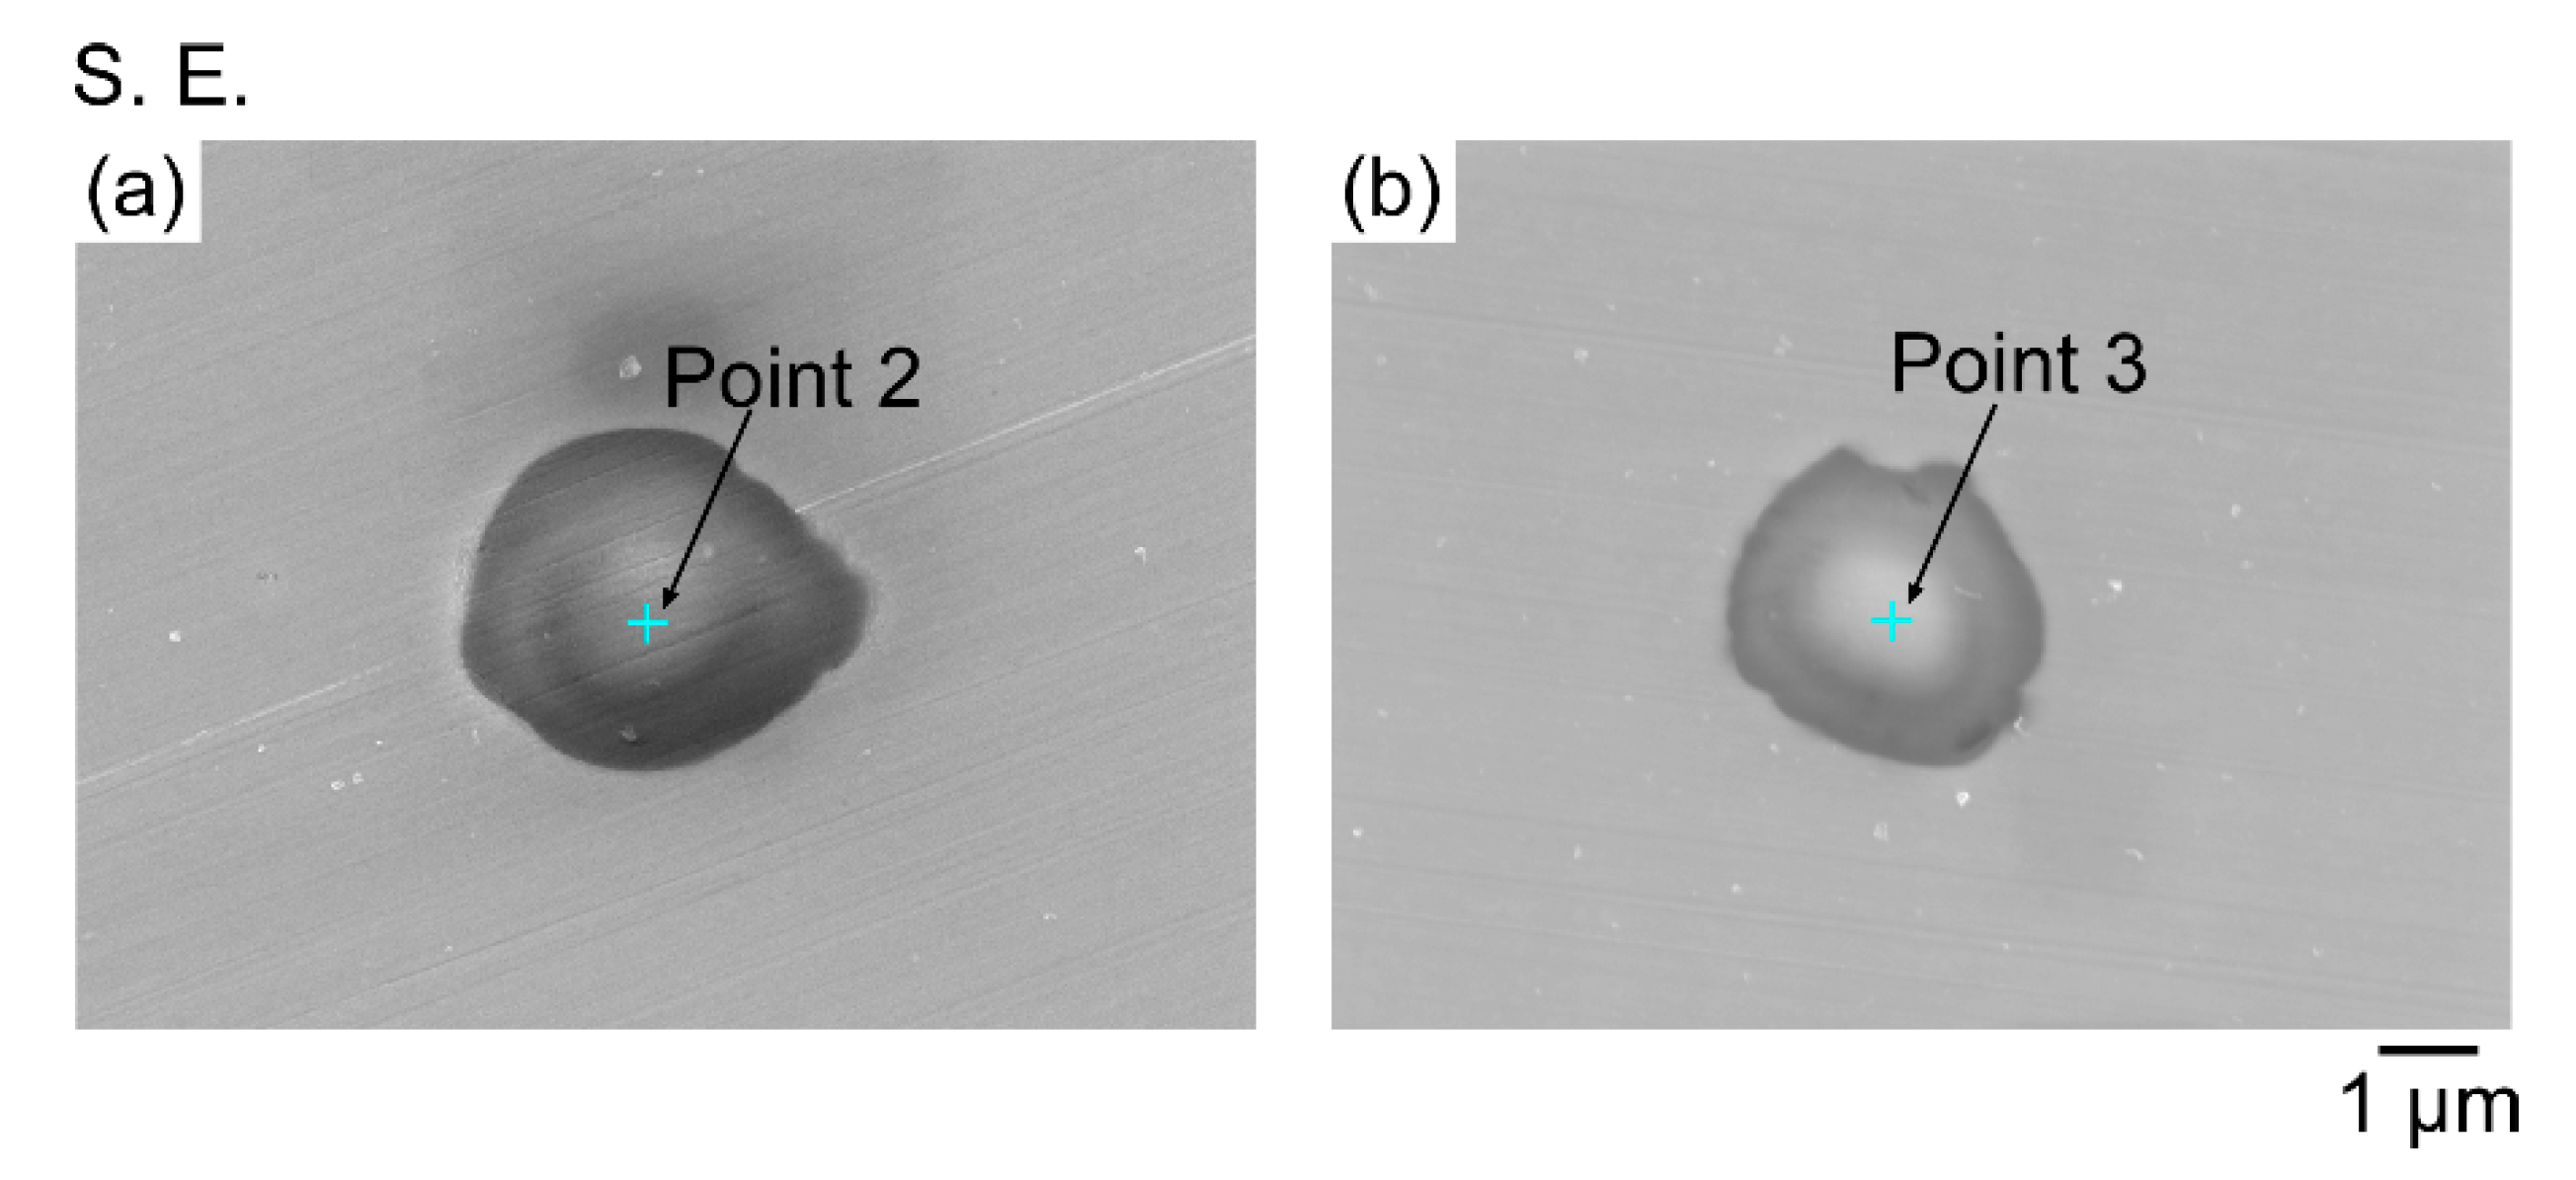
3.1. Inclusion Characterization

Inclusions are known to have a vital role on the pitting corrosion resistance of the stainless-steels [22,23]. The surface of the specimen was observed immediately after the polishing. Inclusions on the specimen were characterized by means of FE-SEM/EDS. There were at least 40 inclusions in the electrode area of 1 mm2. Figure 1 shows an SEM image and corresponding EDS maps of a typical inclusion. The inclusions were approximately round, with diameters smaller than 5 µm. The EDS maps in Figure 1 show that these inclusions were Cr- and O-enriched inclusions. The results of the quantitative analysis corresponding to point 1 in Figure 1 are shown in Table 2. The Cr/O atomic ratio was approximately 3:2. This result suggested that the inclusions of the specimen were Cr oxide. These inclusions were thought to be introduced during the dissolution process because electrolytic ferrochromium is used as a raw material.

3.2. Pitting Corrosion Resistance of the Specimen

Potentiodynamic anodic polarization measurements were conducted in 0.1 M NaCl and 0.1 M NaCl-1 mM CuCl2 to investigate the effects of Cu2+ in the bulk solution on the pitting corrosion resistance of the specimen. The results are shown in Figure 2. As indicated by curves (a) and (b) in Figure 2, the potential was scanned from the cathodic polarization region in 0.1 M NaCl (Figure 2a) and 0.1 M NaCl-1 mM CuCl2 (Figure 2b). In both cases, cathodic currents were observed at first, and then anodic currents appeared. In 0.1 M NaCl, anodic currents were measured from −0.14 V. In this case, current spikes which would indicate the initiation of metastable and stable pits were not recorded until ca. 1.4 V, and no pits were observed on the surface. The large increase in current from ca. 1.1 V was considered to be oxygen generation [24,25]. However, for the specimen in 0.1 M NaCl-1 mM CuCl2, cathodic currents were measured from 0.18 to 0.23 V, and the anodic currents arose from ca. 0.23 V. These results indicate that the corrosion potential in 0.1 M NaCl-1 mM CuCl2 was higher than that measured in 0.1 M NaCl. This shift of the corrosion potential may have resulted from the reduction reaction of Cu2+ at the cathode in 0.1 M NaCl-1 mM CuCl2. Previous studies have proposed the following reaction as the reduction reaction of Cu2+ [16,17]:
Cu2+ + 2e → Cu
This reaction is known to occur in two steps as the following reaction:
Cu2+ + e → Cu+
Cu+ + e → Cu
In addition, Cu+ can chemically combine with Cl, as bellow [26]:
Cu+ + Cl → CuCl
Therefore, cathodic Cu plating and formation of CuCl was expected to occur in the cathodic polarization region in 0.1 M NaCl-1 mM CuCl2 (Figure 2b). The deposited Cu on the surface is known to act as a “weak point” to the pitting. Xi et al. reported that deposited Cu caused the discontinuity of the passive film and reduced the resistance to pitting corrosion of the passive film [27]. In this case, pitting occurred at 0.67 V. To confirm the pitting on 316EHP was caused by the deposited Cu, which was deposited in the cathodic polarization region, the anodic polarization measurement from the anodic polarization region was conducted in 0.1 M NaCl-1 mM CuCl2. As shown in Figure 2c, the anodic polarization measurement was conducted from 0.25 V in 0.1 NaCl-1 mM CuCl2 to avoid Cu plating onto the cathodic polarization region (below 0.23 V). An anodic current was observed through the measurement under this condition, but no cathodic current was observed. This result suggests that Cu deposition attributable to the cathodic current did not occur on the surface. Despite the lack of Cu deposition in the cathodic polarization region, pitting occurred at ca. 0.82 V. Therefore, the decrease in pitting corrosion resistance was not caused by the Cu deposition in the cathodic region.
After the anodic polarization measurements, the electrode surfaces were observed via SEM/EDS. Figure 3 shows the SEM images of the Cr oxide inclusion after the anodic polarization measurement in 0.1 M NaCl (Figure 2a) and 0.1 M NaCl-1 mM CuCl2 (Figure 2b). In both solutions, the inclusion remained undissolved. Table 3 shows the composition of the inclusions after the anodic polarization measurements. Composition of the inclusions at points 2 and 3 were similar to that before the polarization (shown in Figure 2). Szummer et al. reported that the dissolution of Cr2O3 inclusions led to structural defects, which acted as initiation sites for pitting of 16Cr-Fe single crystals [22]. In this study, structural defects, which act as pitting initiation sites, were absent from the surface of the specimen in 0.1 M NaCl and 0.1 M NaCl-1 mM CuCl2. Therefore, the pitting that occurred in 0.1 M NaCl-1 mM CuCl2 was not caused by the structural defects made by dissolution of inclusions. The SEM image and corresponding EDS maps of Cu around the pit on the electrode surface after the anodic polarization measurement in 0.1 M NaCl-1 mM CuCl2 (Figure 2b) are shown in Figure 4. A pit with a lace-like cover, which commonly occurred on type 316 stainless-steels in chloride environments [28,29,30], was observed. In general, deposited Cu has been detected via EDS when the corrosion morphology was changed by Cu deposition [16,31,32]. In this case, no EDS confirmation of Cu deposition inside the pit or on the surface around the pit was obtained. This probably resulted from the fact that the Cu deposited on the surface was too thin to be detected by EDS.

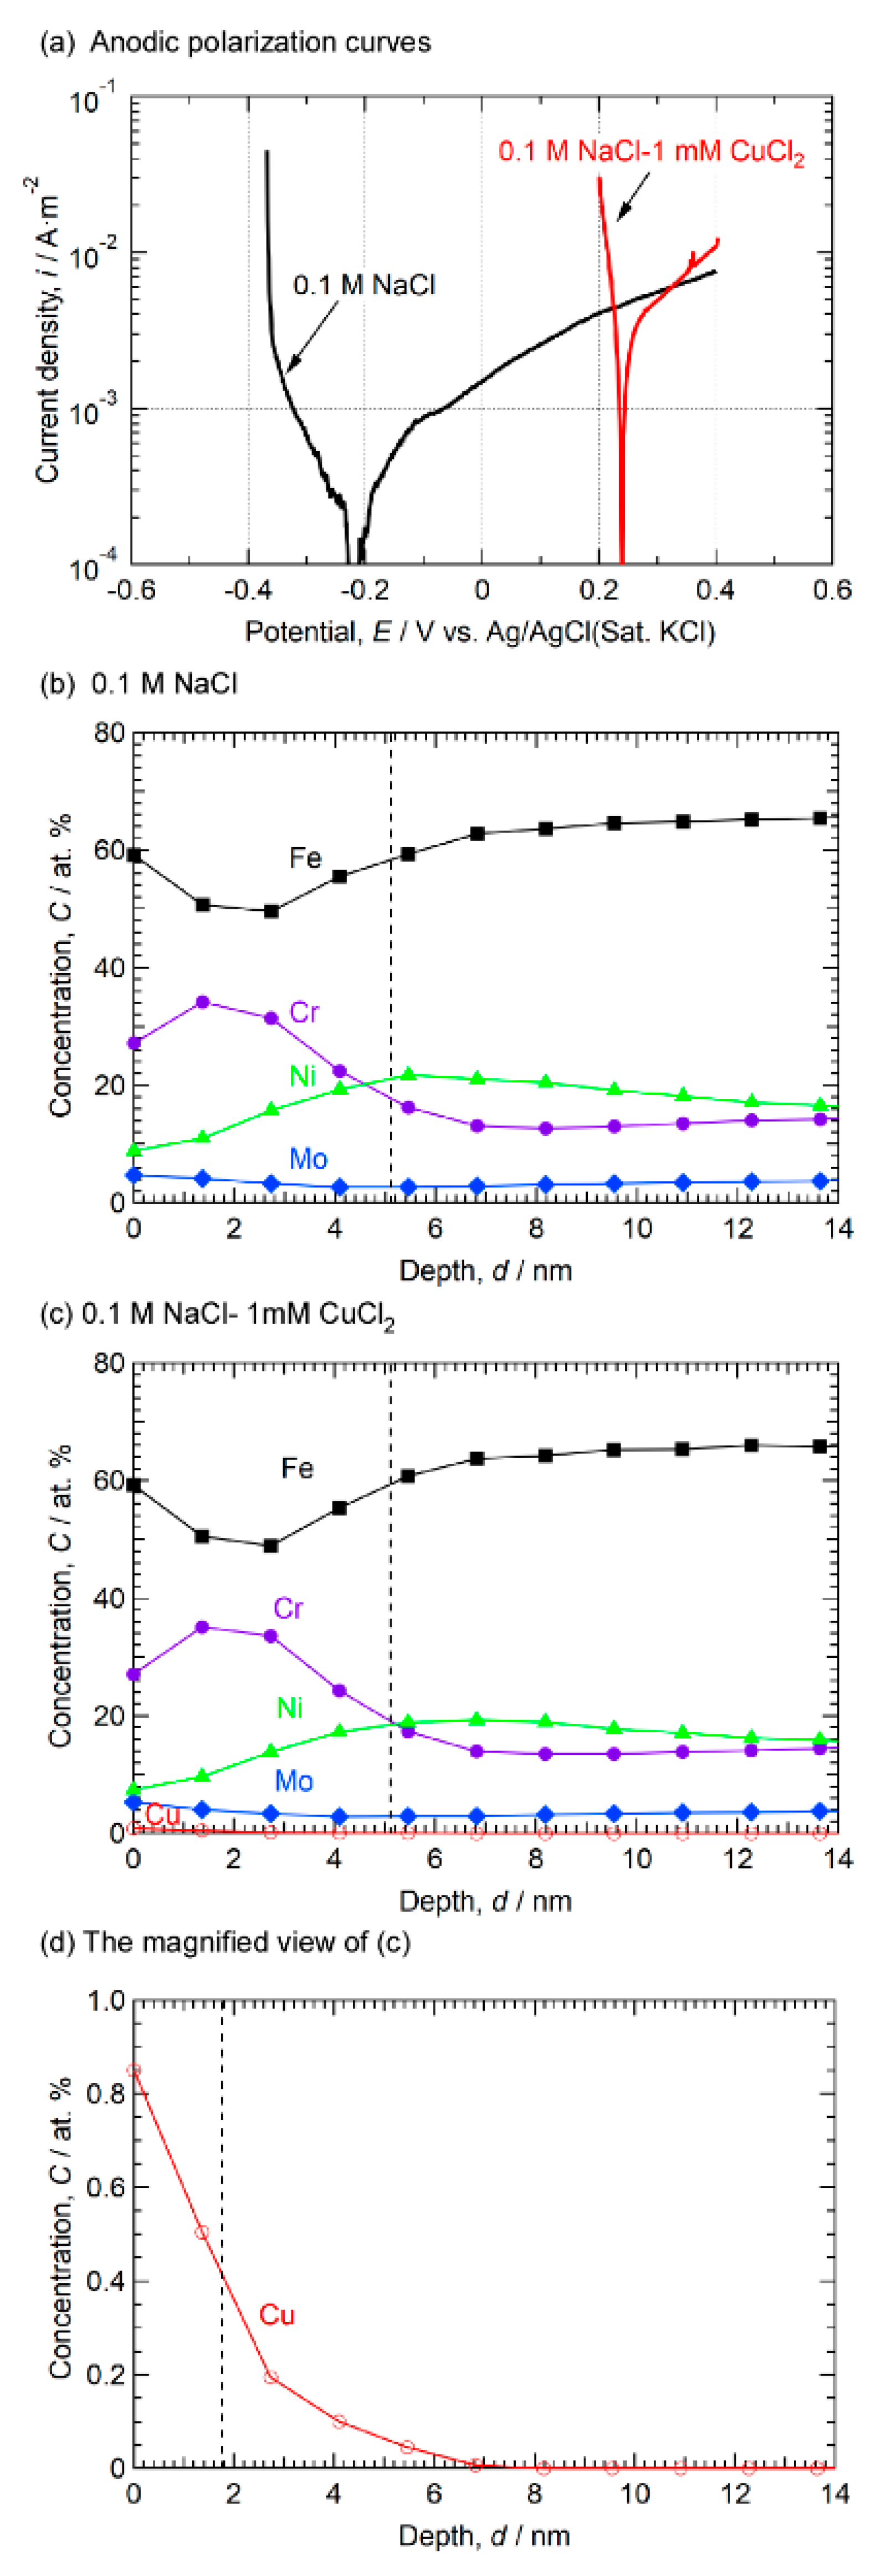
3.3. Effect of Cu2+ in the Bulk Solution on the Surface of 316EHP

Cu deposition was not detected via EDS around the pits that occurred in 0.1 M NaCl-1 mM CuCl2. To elucidate whether Cu was deposited or not in the pitting initiation process in anodic polarization, XPS depth profiling was performed on the specimen surfaces after the anodic polarization. At first, the effect of Cu2+ in the bulk solution on passive film formation was investigated. To compare the elemental composition of the passive film formed in the two solutions, the specimens were polarized to 0.4 V from the cathodic polarization region in 0.1 M NaCl and 0.1 M NaCl-1 mM CuCl2. The anodic polarization curves are shown in Figure 5a. These conditions simulated the formation of a passive film before the initiation of the pitting shown in Figure 2a,b. The composition depth profiles of Fe, Cr, Ni, Mo, and Cu on the specimen surface are shown in Figure 5b,c. Figure 5b shows the depth profiles of the surface polarized from −0.37 to 0.40 V in 0.1 M NaCl. As shown in Figure 5b, an Fe-rich layer was observed at the outermost surface, and a Cr enrichment layer formed slightly inside the outermost surface. This multilayer structure was considered as a passive film. The interface between the passive film and the matrix was defined as a position at the half-maximum of the Cr profile. The interface is indicated by the vertical dashed line in Figure 5b. The thickness of the passive film was ca. 5.0 nm. The concentration of Ni near the film-metal surface and the concentration of Mo at the outermost surface were also confirmed. The elemental profile trends of Cr, Ni, and Mo are the same as those of stainless-steels reported in previous studies [33,34]. The Cu XPS spectra were not detected on the specimen polarized in 0.1 M NaCl. The elemental profiles of the surface of the specimen polarized from 0.20 to 0.40 V in 0.1 M NaCl-1 mM CuCl2 are shown in Figure 5c. In this case, the film thickness was ca. 5.0 nm, which was defined by the half-maximum of the Cr profile. The thicknesses of the passive films were approximately the same in the two solutions. As shown in Figure 5b,c, the elemental profiles of Cr, Fe, Ni, and Mo in the passive film formed in the 0.1 M NaCl-1 mM CuCl2 are quite similar to the profiles of passive film formed in 0.1 M NaCl. Therefore, both the thickness and composition of the passive film formed by the anodic polarization to 0.4 V in the two solutions were approximately the same. This indicates that the Cu2+ in the bulk solution had no effect on the thickness or composition of the passive film.
Jiangnan et al. reported that Cu2+ dissolved from the stainless-steel had no effect on the formation of the passive film [12]. Therefore, Cu2+ in the bulk solution had a similar effect to Cu2+ dissolved from the stainless-steel matrix on the formation of the passive film. A magnified view of the Cu profile shown in Figure 5c (see Figure 5d) reveals that the Cu signal was detected on the outermost surface. The thickness of deposited metal Cu or Cu compound (which was expected to be CuCl, see Equation (4)) was defined as ca. 1.9 nm on the basis of the Cu profile. The metal Cu or Cu compound seem mainly attributed to the reduction reaction of Cu2+ in the cathodic polarization region. In the polarization from 0.20 to 0.40 V, no pitting occurred on the surface with 1.9 nm-thickness metal Cu or Cu compound in 0.1 M NaCl-1 mM CuCl2. This indicates that this amount of metal Cu or Cu compound on the passive film did not cause the pitting in 0.1 M NaCl-1 mM CuCl2 in the polarization from 0.20 to 0.40 V.
It has been reported that the corrosion behavior of the stainless-steel was affected by the amount of Cu on the surface [16,17]. If the amount of the deposited metal Cu or Cu compound is the key factor for decrease in pitting corrosion resistance of 316EHP, metal Cu or Cu compound thicker than 1.9 nm will be detected on the surface without cathodic Cu plating on the surface in 0.1 M NaCl-1 mM CuCl2. Thereby, the surface after pit initiation in 0.1 M NaCl-1 mM CuCl2 without cathodic Cu deposition was investigated. For the comparison of the surface, the specimen polarized in same potential region in 0.1 M NaCl was also surveyed. The results are shown in Figure 6. Figure 6a shows the anodic polarization curves in 0.1 M NaCl and 0.1 M NaCl-1 mM CuCl2. Both specimens were polarized from 0.25 V to avoid the Cu deposition in the cathodic polarization region in 0.1 M NaCl-1 mM CuCl2. In 0.1 M NaCl-1 mM CuCl2, pitting occurred at about 0.86 V. Figure 6b,c shows the composition depth profiles of Fe, Cr, Ni, Mo, and Cu on the specimen surface. The depth profiles of the surface polarized in 0.1 M NaCl is shown in Figure 6b. The depth profiles of Fe, Cr, Ni, and Mo had the same trend as the film formed by anodic polarization from −0.37 to 0.25 V (see Figure 5b). The thickness of the passive film was defined as a position at the half-maximum of the Cr profile. The interface is indicated by the vertical dashed line in Figure 6b. The thickness of the passive film was ca. 7.8 nm. A thicker passive film was formed on 316EHP with the anodic polarization from 0.25 to 0.86 V than that from −0.37 to 0.4 V in 0.1 M NaCl. Figure 6c shows the elemental profiles of the surface after pit initiation in 0.1 M NaCl-1 mM CuCl2. As with the case of Figure 5b,c, the thickness and the composition of the passive film were almost the same as the profiles of the film formed in 0.1 M NaCl, not affected by the Cu2+ in the bulk solution. A magnified view of the Cu profile shown in Figure 6c is shown in Figure 6d. Similar to the case of Figure 5d, the Cu signal was detected on the outermost surface in Figure 6d. Thereby, it was found that metal Cu or Cu compound deposited on the surface, even in the anodic polarization region. Zhou et al. have reported that Fe on the surface of stainless-steel was substituted by Cu2+ in the solution, as follows [20]:
Cu2+ + Fe → Cu + Fe2
In addition, Hermas et al. reported that metal Cu deposited onto a stainless-steel surface was replaced by CuCl in a Cl solution [17]. Therefore, deposition of metal Cu or Cu compound (expected to be CuCl) occurred on the surface regardless of the polarization potential region in 0.1 M NaCl-1 mM CuCl2. In this case, the thickness of metal Cu or Cu compound was ca. 1.0 nm. This is thinner than that formed on the surface polarized from 0.20 to 0.40 V, including the cathodic polarization region (1.8 nm, see Figure 5d). This indicates that the amount of deposited Cu or Cu compound formed in the cathodic polarization region was larger than that formed only in the anodic polarization region (not including the cathodic polarization region). In the case of the polarization from 0.20 to 0.40 V (including the cathodic polarization region), the cathodic reduction of Cu2+ occurred in conjunction with Cu substitution in the anodic polarization region. This created a thicker deposition of metal Cu or Cu compound on the surface. However, pitting occurred on the surface even though the surface contained lower amounts of the deposited metal Cu or Cu compound on the surface when polarized from 0.25 to 0.86 V than when polarized from 0.20 to 0.40 V (including the cathodic polarization region). This suggests that the amount of deposited metal Cu or Cu compound was not the critical factor for the pitting initiation in 0.1 M NaCl-1 mM CuCl2. Pitting was not caused by the increase in amount on deposited Cu or Cu compound on the surface.
Chemical states of Cu on the surface were also important for the corrosion resistance for stainless-steels [14,15,16,17,18]. The chemical state of Cu was analyzed in detail by comparing the Cu 2p3/2 XPS spectrum of the specimen polarized from 0.20 to 0.40 V with that of the specimen polarized from 0.25 to 0.86 V. Figure 7 shows the Cu 2p3/2 XPS spectrum corresponding to the outermost surface of the specimen polarized in 0.1 M NaCl-1 mM CuCl2 under the two aforementioned polarization conditions. Dotted lines indicate the fitted curves of both spectra. As shown in Figure 7, the peaks of the spectra were quite similar. This indicates that the chemical states of deposited Cu or Cu compound were not changed by these two polarization conditions and seem not to influence the pitting corrosion resistance. Both peaks of binding energy were at 932.3 eV. Therefore, pitting initiation in the polarization from 0.25 to 0.86 V was not caused by the change in chemical state of deposited metal Cu or Cu compound. The peaks of metal Cu and Cu+ attributable to CuCl were expected to appear at binding energies ranging from 932.2 to 933.1 eV [35,36,37,38] and from 932.1 to 932.6 eV [39,40,41]. The peak of metal Cu tended to occur at a slightly higher binding energy than that of Cu+ attributed to CuCl. However, the binding energies of metal Cu and Cu+ are very similar, and distinguishing the chemical state of Cu from the spectra in Figure 7 is difficult. The assumption is that the surfaces of both specimens contained metal Cu, which had been plated during the reduction reaction of Cu2+ in the cathodic polarization region or substituted in the anodic polarization region. As mentioned above, CuCl was also formed on the surface in both cathodic and anodic polarization regions. Therefore, the spectra corresponding to the surface polarized from 0.20 to 0.40 V and from 0.25 to 0.86 V were considered as a mixture of metal Cu and CuCl. These results indicate that the decrease in pitting corrosion resistance was not caused by the change in chemical state of deposited metal Cu or Cu compound on the surface.

3.4. Effect of Cu2+ in the Bulk Solution on the Pitting Corrosion Resistance of the Specimen

The aforementioned results revealed that metal Cu or Cu compound were deposited onto the surface in 0.1 M NaCl-1 mM CuCl2. However, whether the decrease in pitting corrosion resistance of the specimen resulted from this deposition or the Cu2+ in the bulk solution is unclear. The effect of deposited metal Cu and CuCl on the pitting corrosion resistance of the specimen was investigated by conducting anodic polarizations under two conditions, (a) and (b). Under condition (a), the specimen was polarized to 0.4 V in 0.1 M NaCl-1 mM CuCl2 to deposit metal Cu and CuCl onto the surface. Afterward, the electrode surface was rinsed with deionized water and the solution was replaced with 0.1 M NaCl. Anodic polarization was subsequently performed from 0.4 V in 0.1 M NaCl. The polarization curves are denoted as a1 and a2 in Figure 8. Under condition (b), the specimen was first polarized to 0.4 V in 0.1 M NaCl-1 mM CuCl2. The electrode surface was cleaned with deionized water when the potential reached 0.4 V. Subsequently, anodic polarization was conducted from 0.4 V in 0.1 M NaCl-1 mM CuCl2 (the corresponding curves are denoted as b1 and b2 in Figure 8). Based on Figure 5, deposition of metal Cu and CuCl onto the surface after polarization to 0.40 V in 0.1 M NaCl-1 mM CuCl2 was expected under both a1 and b1 conditions (see Figure 8). Pitting occurred in 0.1 M NaCl-1 mM CuCl2, but no pitting occurred in 0.1 M NaCl, as indicated by a2 and b2 in Figure 8. These results suggest that both deposited Cu or Cu compound and Cu2+ in the bulk solution was necessary for the pitting to occur in 0.1 M NaCl-1 mM CuCl2. That is, the deposited metal Cu and CuCl on the surface did not function as the “weak point” in 0.1 M NaCl.
The present study indicated that the continuous presence of Cu2+ in the bulk solution was essential for pitting after the deposition of metal Cu or Cu compound. Therefore, the decrease in pitting corrosion resistance of the 316EHP stainless-steel in 0.1 M NaCl-1 mM CuCl2 mainly resulted from the deposited Cu or Cu compound and continuous supply of Cu2+ on the surface. Further research is needed to clarify the precise mechanism governing the effects of Cu2+ in the bulk solution on the pitting initiation of the stainless-steel.

4. Conclusions

  • No pitting occurred on 316EHP stainless-steel in 0.1 M NaCl. The Cr oxide inclusions remained undissolved after the anodic polarization to ca. 1.4 V. Therefore, the structural defects that lead to the pitting initiation were not introduced by the dissolution of the Cr oxide inclusions on 316EHP stainless-steel in 0.1 M NaCl.
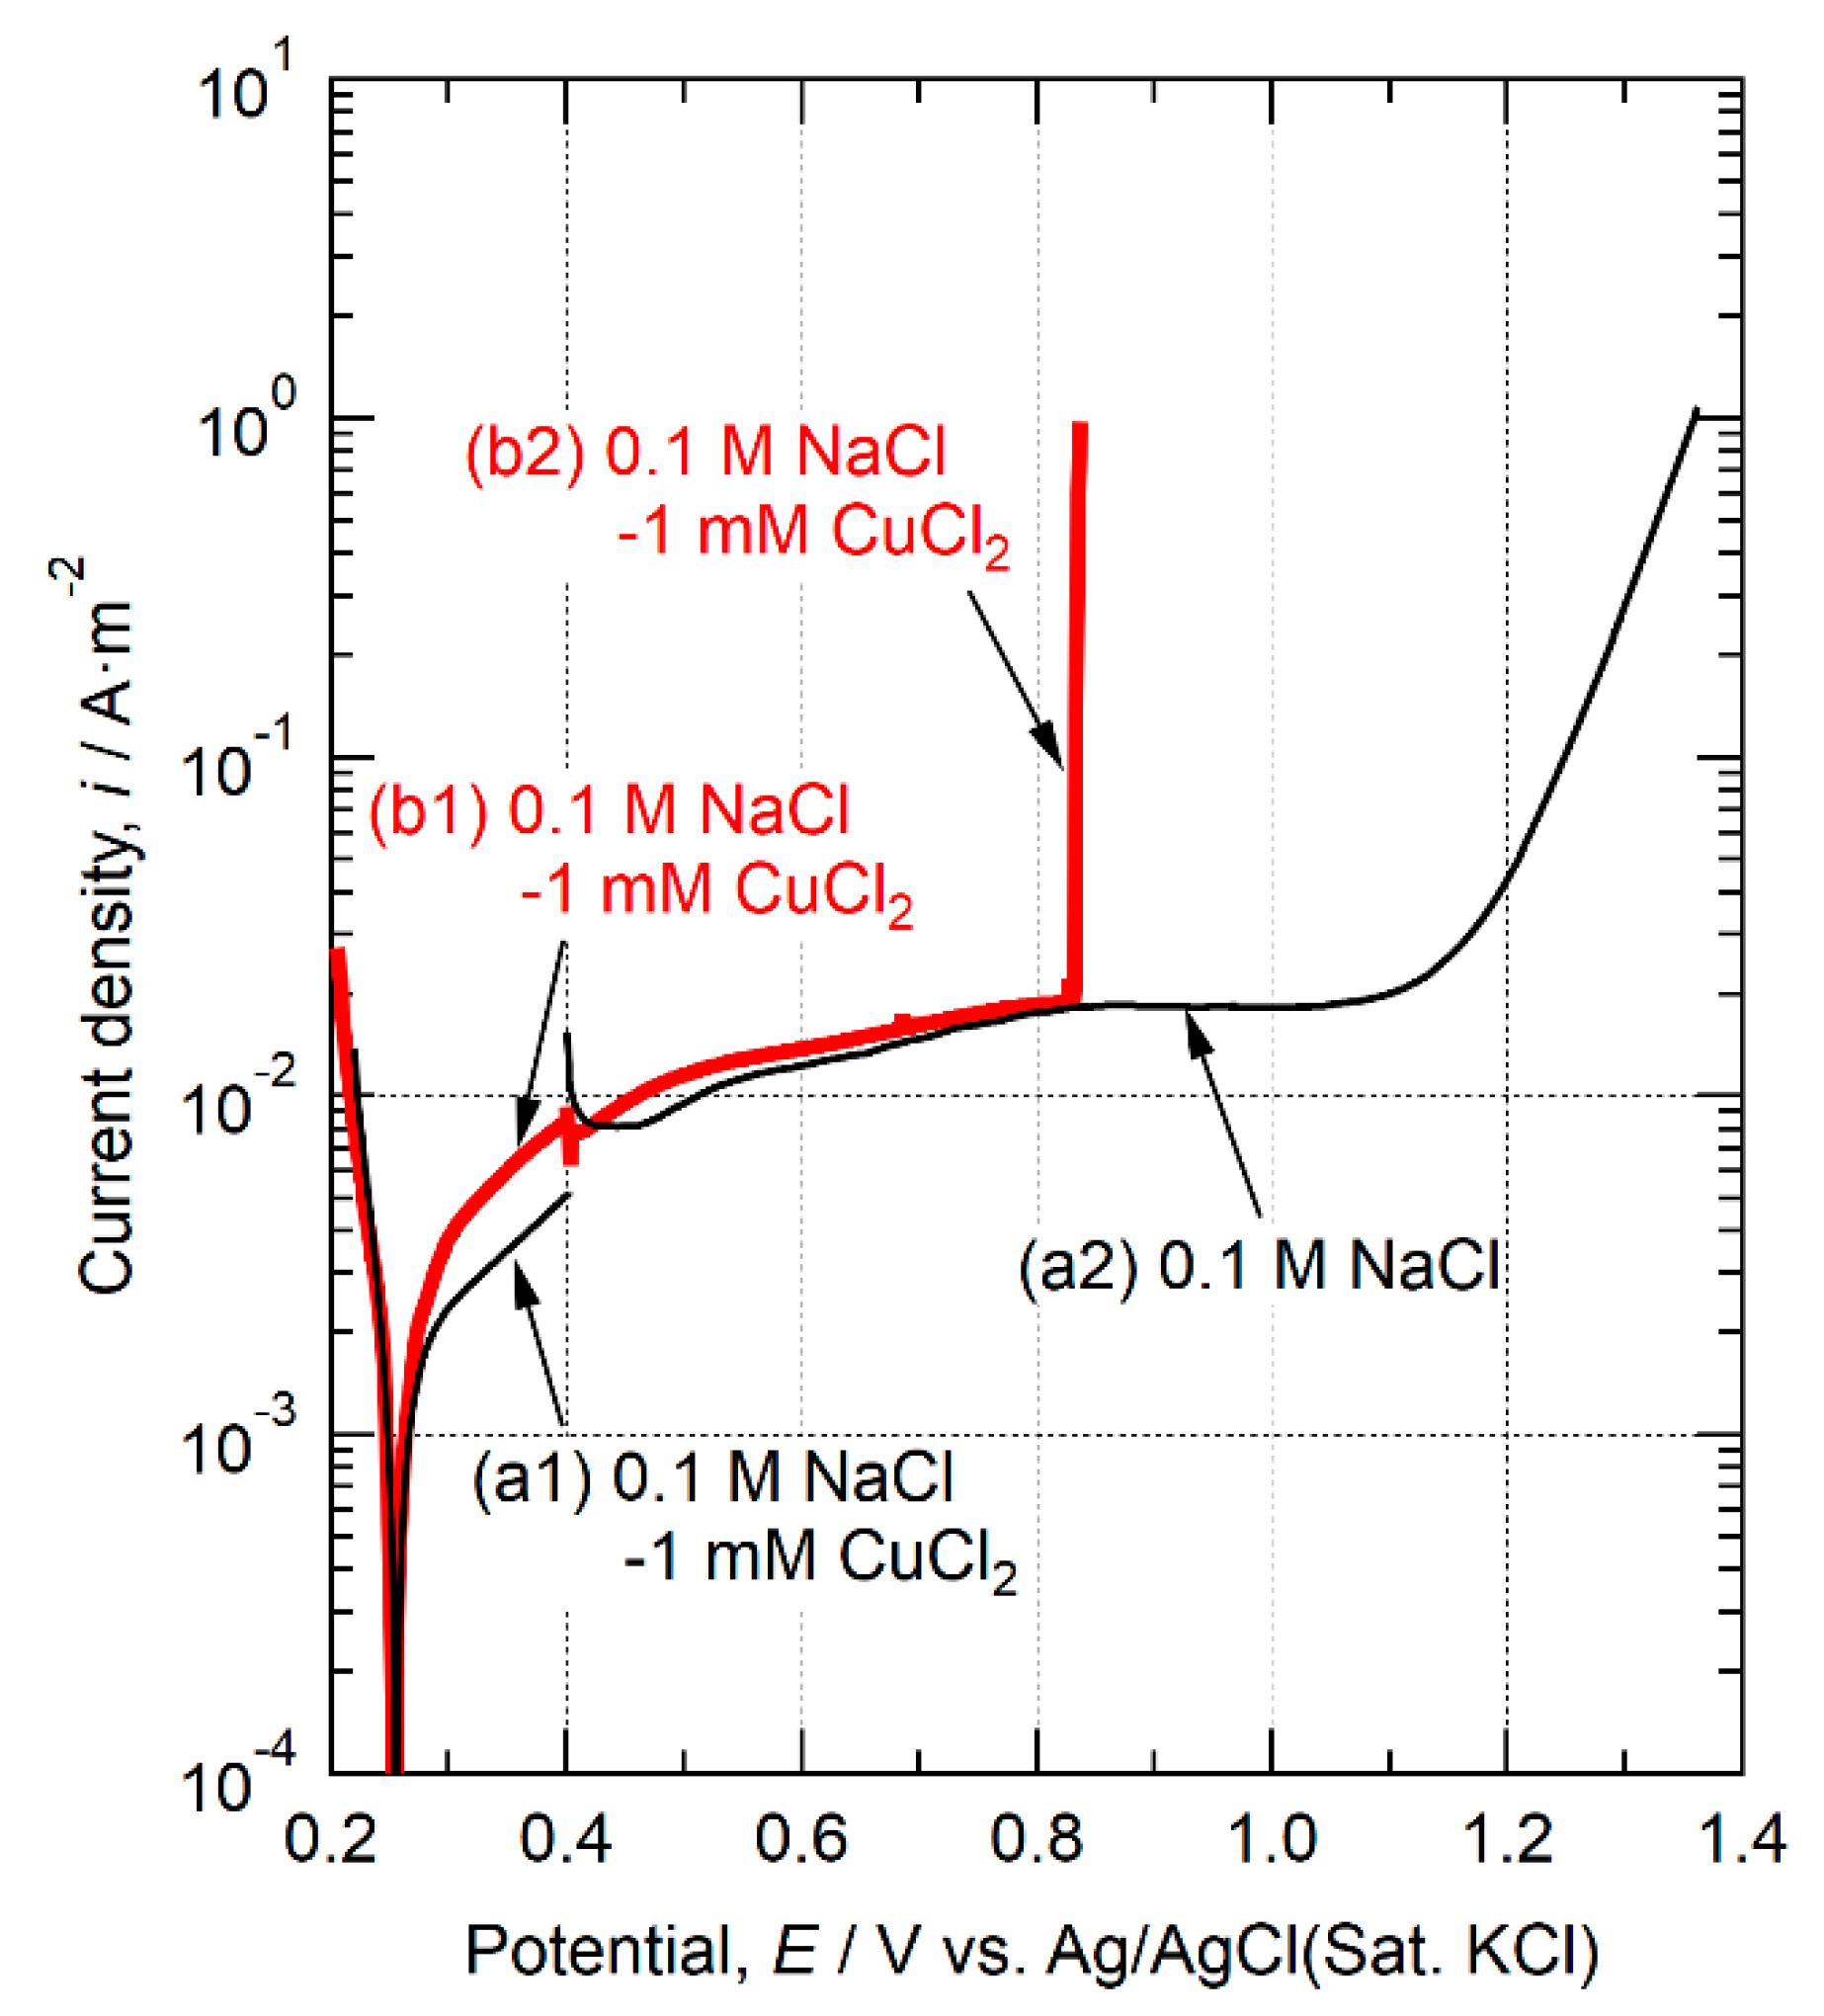
  • Pitting occurred on 316EHP stainless-steel in 0.1 M NaCl-1 mM CuCl2. The potential was scanned from the cathodic polarization region, where Cu plating by the reduction reaction of Cu2+ and the formation of CuCl occurred. The deposited Cu was considered to function as a “weak point” where pitting was initiated. However, pitting also occurred during the anodic polarization from the anodic polarization region (not including the cathodic polarization region). Thus, pitting occurred regardless of whether the potential was scanned from the cathodic polarization region or from the anodic polarization region in 0.1 M NaCl-1 mM CuCl2. This indicates that the pitting of 316EHP stainless-steel in 0.1 M NaCl-1 mM CuCl2 was not caused by the Cu deposition in the cathodic polarization region.
  • The thickness and composition of the passive film on the surface of 316EHP were unaffected by the Cu2+ in the bulk solution during the polarization from 0.20 to 0.40 V (including the cathodic polarization region) and from 0.25 to 0.86 V (not including the cathodic polarization region).
  • The thicker deposition of metal Cu and Cu compound was formed on the surface of 316EHP polarized from 0.20 to 0.40 V (including the cathodic polarization region, no pitting) than that from 0.25 to 0.86 V (not including the cathodic polarization region, pitting occurred). Therefore, the amount of deposited metal Cu or Cu compound was not the critical factor for pitting initiation in 0.1 M NaCl-1 mM CuCl2.
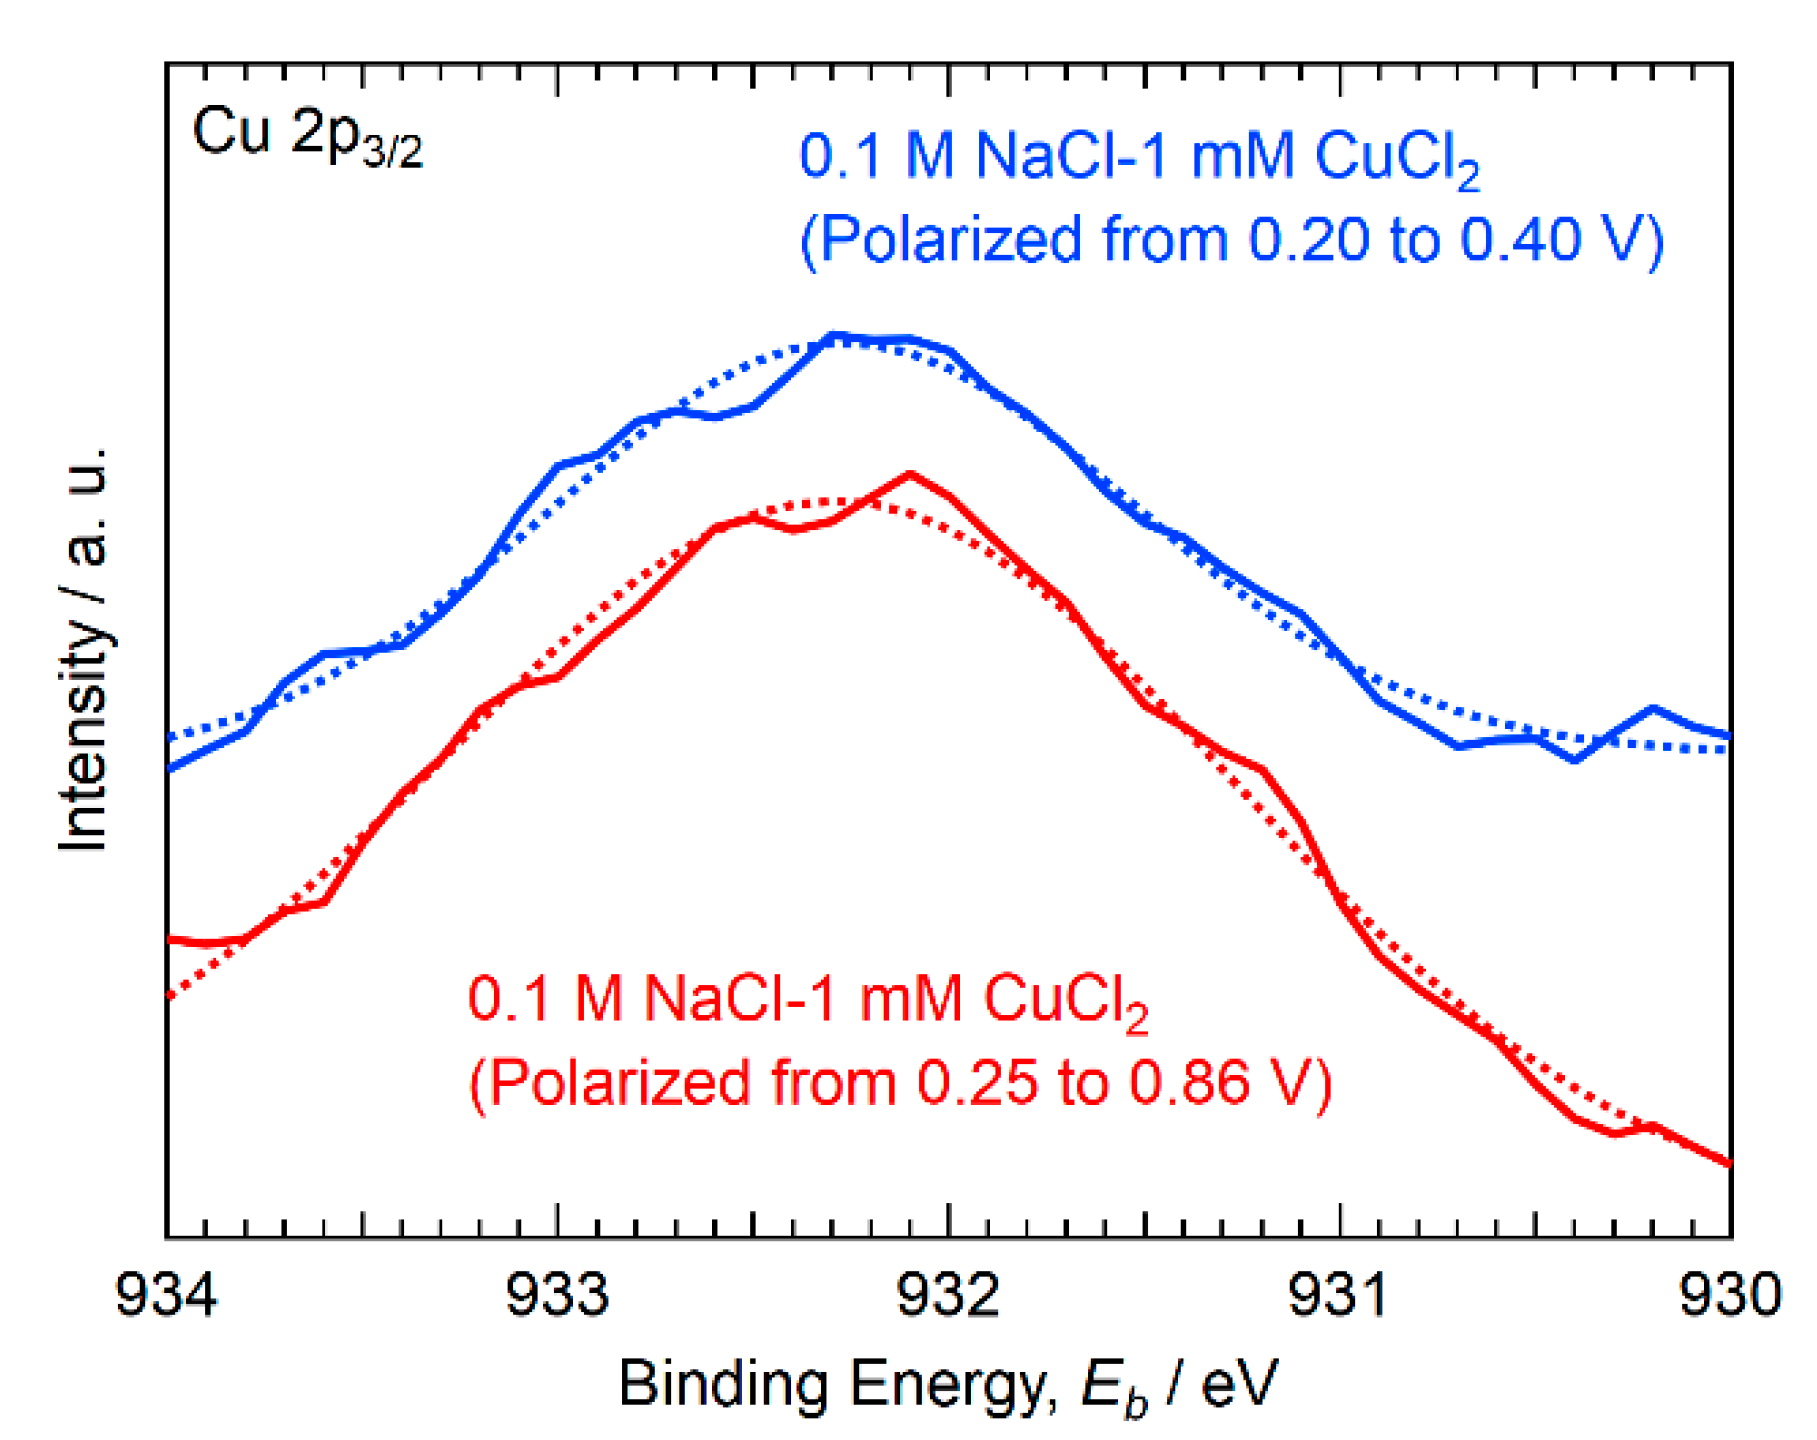
  • Similar peaks were detected by XPS analysis on the outermost surface of 316EHP after the anodic polarization from 0.20 to 0.40 V and from 0.25 to 0.86 V in 0.1 M NaCl-1 mM CuCl2. This indicates that the initiation of the pitting was not caused by the change in chemical state of deposited Cu or Cu compound during the polarization process in 0.1 M NaCl-1 mM CuCl2.
  • No pitting occurred in 0.1 M NaCl on the specimen with metal Cu or Cu compound deposited in 0.1 M NaCl-1 mM CuCl2. However, pitting occurred after the metal Cu or Cu compound were deposited on the steel in 0.1 M NaCl-1 mM CuCl2. Therefore, the decrease in pitting corrosion resistance of 316EHP stainless-steel in 0.1 M NaCl-1 mM CuCl2 resulted mainly from the deposited Cu or Cu compound and continuous supply of Cu2+ on the surface.

Author Contributions

Conceptualization, investigation, writing—original draft, funding acquisition: T.A.; formal analysis: H.O., resources: C.K., writing—review and editing: H.O., C.K. and F.U.; supervision: C.K. and F.U. All authors have read and agreed to the published version of the manuscript.

Funding

This research was supported by Japan Society for the Promotion of Science (JSPS) KAKENHI, grant Number 19K23581.

Data Availability Statement

The raw/processed data required to reproduce these findings cannot be shared at this time as the data also forms part of an ongoing study.

Conflicts of Interest

The authors declare that they have no known competing financial or personal interests.

References

  1. Seo, M.; Hultquist, G.; Leygraf, C.; Sato, N. The influence of minor alloying elements (Nb, Ti and Cu) on the corrosion resistivity of ferritic stainless steel in sulfuric acid solution. Corros. Sci. 1986, 26, 949–960. [Google Scholar] [CrossRef]
  2. Peled, P.; Itzhak, D. The surface composition of sintered stainless steel containing noble alloying elements exposed to a H2SO4 environment. Corros. Sci. 1991, 32, 83–90. [Google Scholar] [CrossRef]
  3. Kim, S.-T.; Park, Y.-S. Effect of Copper Addition on Corrosion Behavior of High-Performance Austenitic Stainless Steel in Highly Concentrated Sulfuric Acid Solution—Part 1. Corrosion 2007, 63, 114–126. [Google Scholar] [CrossRef]
  4. Itzhak, D.; Peled, P. The effect of Cu addition on the corrosion behaviour of sintered stainless steel in H2SO4 environment. Corros. Sci. 1986, 26, 49–54. [Google Scholar] [CrossRef]
  5. Hultquist, G.; Seo, M.; Leitner, T.; Leygraf, C.; Sato, N. The dissolution behaviour of iron, chromium, molybdenum and copper from pure metals and from ferritic stainless steels. Corros. Sci. 1987, 27, 937–946. [Google Scholar] [CrossRef]
  6. Pardo, A.; Merino, M.; Carboneras, M.; Viejo, F.; Arrabal, R.; Muñoz, J.A. Influence of Cu and Sn content in the corrosion of AISI 304 and 316 stainless steels in H2SO4. Corros. Sci. 2006, 48, 1075–1092. [Google Scholar] [CrossRef]
  7. Oguzie, E.E.; Li, J.; Liu, Y.; Chen, D.; Li, Y.; Yang, K.; Wang, F. The effect of Cu addition on the electrochemical corrosion and passivation behavior of stainless steels. Electrochim. Acta 2010, 55, 5028–5035. [Google Scholar] [CrossRef]
  8. Lillard, R.S.; Kashfipour, M.A.; Niu, W. Pit Propagation at the Boundary between Manganese Sulfide Inclusions and Austenitic Stainless Steel 303 and the Role of Copper. J. Electrochem. Soc. 2016, 163, C440–C451. [Google Scholar] [CrossRef]
  9. Mehrazi, S.; Moran, A.J.; Arnold, J.L.; Buchheit, R.G.; Lillard, R.S. The Electrochemistry of Copper Release from Stainless Steels and Its Role in Localized Corrosion. J. Electrochem. Soc. 2018, 165, C860–C868. [Google Scholar] [CrossRef]
  10. Garfias-Mesias, L.F.; Sykes, J.M. Effect of Copper on Active Dissolution and Pitting Corrosion of 25% Cr Duplex Stainless Steels. Corrosion 1998, 54, 40–47. [Google Scholar] [CrossRef]
  11. Jeon, S.-H.; Kim, S.-T.; Lee, I.-S.; Park, J.-H.; Kim, K.-T.; Kim, J.-S.; Park, Y.-S. Effects of copper addition on the formation of inclusions and the resistance to pitting corrosion of high performance duplex stainless steels. Corros. Sci. 2011, 53, 1408–1416. [Google Scholar] [CrossRef]
  12. Jiangnan, Y.; Lichang, W.; Wenhao, S. The effect of copper on the anodic dissolution behaviour of austenitic stainless steel in acidic chloride solution. Corros. Sci. 1992, 33, 851–859. [Google Scholar] [CrossRef]
  13. Sourisseau, T.; Chauveau, E.; Baroux, B. Mechanism of copper action on pitting phenomena observed on stainless steels in chloride media. Corros. Sci. 2005, 47, 1097–1117. [Google Scholar] [CrossRef]
  14. Lin, H.-T.; Tsai, W.-T.; Lee, J.-T.; Huang, C.-S. The electrochemical and corrosion behavior of austenitic stainless steel containing Cu. Corros. Sci. 1992, 33, 691–697. [Google Scholar] [CrossRef]
  15. Lee, J.-S.; Kim, S.-T.; Lee, I.-S.; Kim, G.-T.; Kim, J.-S.; Park, Y.-S. Effect of Copper Addition on the Active Corrosion Behavior of Hyper Duplex Stainless Steels in Sulfuric Acid. Mater. Trans. 2012, 53, 1048–1055. [Google Scholar] [CrossRef]
  16. Hermas, A.; Ogura, K.; Adachi, T. Accumulation of copper layer on a surface in the anodic polarization of stainless steel containing Cu at different temperatures. Electrochim. Acta 1995, 40, 837–844. [Google Scholar] [CrossRef]
  17. Hermas, A.A.; Ogura, K.; Takagi, S.; Adachi, T. Effects of Alloying Additions on Corrosion and Passivation Behaviors of Type 304 Stainless Steel. Corrosion 1995, 51, 3–10. [Google Scholar] [CrossRef]
  18. Ujiro, T.; Satoh, S.; Staehle, R.; Smyrl, W. Effect of alloying Cu on the corrosion resistance of stainless steels in chloride media. Corros. Sci. 2001, 43, 2185–2200. [Google Scholar] [CrossRef]
  19. Lin, C.C.; Smith, F.R.; Ichikawa, N.; Itow, M. Electrochemical Potential Measurements under Simulated BWR Water Chemistry Conditions. Corrosion 1992, 48, 16–28. [Google Scholar] [CrossRef]
  20. Zhou, Y.T.; Zhang, B.; Zheng, S.J.; Wang, J.; San, X.Y.; Ma, X.L. Atomic-scale decoration for improving the pitting corrosion resistance of austenitic stainless steels. Sci. Rep. 2014, 4, 3604. [Google Scholar] [CrossRef] [Green Version]
  21. Nakayama, J.; Kiuchi, K. Developments of Extra-High Purity Stainless Steels for Nuclear Corrosive Environments. MRS Proc. 2011, 1298, 27–33. [Google Scholar] [CrossRef]
  22. Szummer, A.; Szklarska-Smialowska, Z.; Janik-Czachor, M. Electron microprobe study of the corrosion pits nucleation on Fe-16cr single crystals. Corros. Sci. 1968, 8, 827–831. [Google Scholar] [CrossRef]
  23. Szklarska-Smialowska, Z. Influence of Sulfide Inclusions on the Pitting Corrosion of Steels. Corrosion 1972, 28, 388–396. [Google Scholar] [CrossRef]
  24. Chiba, A.; Nagataki, A.; Nishimura, T. Electrochemical Aspects of Interstitial Nitrogen in Carbon Steel: Passivation in Neutral Environments. J. Electrochem. Soc. 2016, 164, C17–C26. [Google Scholar] [CrossRef] [Green Version]
  25. Kadowaki, M.; Muto, I.; Sugawara, Y.; Doi, T.; Kawano, K.; Hara, N. Pitting Corrosion Resistance of Martensite of AISI 1045 Steel and the Beneficial Role of Interstitial Carbon. J. Electrochem. Soc. 2017, 164, C962–C972. [Google Scholar] [CrossRef] [Green Version]
  26. Bonou, L.; Eyraud, M.; Denoyel, R.; Massiani, Y. Influence of additives on Cu electrodeposition mechanisms in acid solution: Direct current study supported by non-electrochemical measurements. Electrochim. Acta 2002, 47, 4139–4148. [Google Scholar] [CrossRef]
  27. Xi, T.; Shahzad, M.B.; Xu, D.; Sun, Z.; Zhao, J.; Yang, C.; Qi, M.; Yang, K. Effect of copper addition on mechanical properties, corrosion resistance and antibacterial property of 316L stainless steel. Mater. Sci. Eng. C 2017, 71, 1079–1085. [Google Scholar] [CrossRef]
  28. Mudali, U.K.; Dayal, R.K.; Gnanamoorthy, J.B.; Rodríguez, P. Pitting Corrosion Studies on Nitrogen-Bearing Austenitic Stainless Steels. Mater. Trans. JIM 1996, 37, 1568–1573. [Google Scholar] [CrossRef] [Green Version]
  29. Ashour, E.A.; El Meguid, E.A.A.; Ateya, B.G. Effects of Thiosulfate on Susceptibility of Type 316 Stainless Steel to Stress Corrosion Cracking in 3.5% Aqueous Sodium Chloride. Corrosion 1997, 53, 612–616. [Google Scholar] [CrossRef]
  30. Nishimoto, M.; Muto, I.; Sugawara, Y.; Hara, N. Morphological Characteristics of Trenching around MnS Inclusions in Type 316 Stainless Steel: The Role of Molybdenum in Pitting Corrosion Resistance. J. Electrochem. Soc. 2019, 166, C3081–C3089. [Google Scholar] [CrossRef]
  31. Park, J.R.; Szklarska-Smialowska, Z. Pitting Corrosion of Inconel 600 in High-Temperature Water Containing CuCl2. Corrosion 1985, 41, 665–675. [Google Scholar] [CrossRef]
  32. Pardo, A.; Merino, M.; Carboneras, M.; Coy, A.; Arrabal, R. Pitting corrosion behaviour of austenitic stainless steels with Cu and Sn additions. Corros. Sci. 2007, 49, 510–525. [Google Scholar] [CrossRef]
  33. Ogawa, H.; Omata, H.; Itoh, I.; Okada, H. Auger Electron Spectroscopic and Electrochemical Analysis of the Effect of Alloying Elements on the Passivation Behavior of Stainless Steels. Corrosion 1978, 34, 52–60. [Google Scholar] [CrossRef]
  34. Hamada, E.; Yamada, K.; Nagoshi, M.; Makiishi, N.; Sato, K.; Ishii, T.; Fukuda, K.; Ishikawa, S.; Ujiro, T. Direct imaging of native passive film on stainless steel by aberration corrected STEM. Corros. Sci. 2010, 52, 3851–3854. [Google Scholar] [CrossRef]
  35. Kaushik, V.K. Identification of oxidation states of copper in mixed oxides and chlorides using ESCA. Spectrochim. Acta Part B 1989, 44, 581–587. [Google Scholar] [CrossRef]
  36. Schön, G. ESCA studies of Cu, Cu2O and CuO. Surf. Sci. 1973, 35, 96–108. [Google Scholar] [CrossRef]
  37. Haber, J.; Machej, T.; Ungier, L.; Ziółkowski, J. ESCA studies of copper oxides and copper molybdates. J. Solid State Chem. 1978, 25, 207–218. [Google Scholar] [CrossRef]
  38. Capece, F.; Castro, V.; Furlani, C.; Mattogno, G.; Fragale, C.; Gargano, M.; Rossi, M. “Copper chromite” Catalysts: XPS structure elucidation and correlation with catalytic activity. J. Electron Spectrosc. Relat. Phenom. 1982, 27, 119–128. [Google Scholar] [CrossRef]
  39. Robert, T.; Offergeld, G. Spectres de photoélectrons X de composés solides de cuivre Relation entre la présence de raies satellites et l’état d’oxydation du cuivre. Phys. Status Solidi A 1972, 14, 277–282. [Google Scholar] [CrossRef]
  40. Wagner, C.D. Chemical shifts of Auger lines, and the Auger parameter. Faraday Discuss. Chem. Soc. 1975, 60, 291–300. [Google Scholar] [CrossRef]
  41. Battistoni, C.; Mattogno, G.; Paparazzo, E.; Naldini, L. An XPS and Auger study of some polynuclear copper compounds. Inorg. Chim. Acta 1985, 102, 1–3. [Google Scholar] [CrossRef]
Figure 1. Scanning electron microscopy (SEM) image and corresponding energy-dispersive X-ray spectroscopy (EDS) maps of an inclusion.
Metals 11 00511 g001
Figure 2. Anodic polarization curves measured in (a) 0.1 M NaCl and (b,c) 0.1 M NaCl-1 mM CuCl2. The potential was scanned from (a,b) the cathodic polarization region, and from (c) 0.25 V.
Metals 11 00511 g002
Figure 3. SEM image of inclusions after the polarization (a) in 0.1 M NaCl (see Figure 2a) and (b) in 0.1 M NaCl-1 mM CuCl2 (see Figure 2b).
Metals 11 00511 g003
Figure 4. SEM image and corresponding EDS map of Cu around a pit after the polarization shown in Figure 3b.
Metals 11 00511 g004
Figure 5. (a) Anodic polarization curves polarized to 0.40 V in 0.1 M NaCl and 0.1 M NaCl-1 mM CuCl2. Composition depth profiles of the surfaces for the specimens polarized (b) in 0.1 M NaCl and (c) in 0.1 M NaCl-1 mM CuCl2. (d) Magnified view of (c).
Metals 11 00511 g005
Figure 6. (a) Anodic polarization curves polarized from 0.25 to 0.86 V in 0.1 M NaCl and 0.1 M NaCl-1 mM CuCl2. Composition depth profiles of the surfaces for the specimens polarized (b) in 0.1 M NaCl and (c) in 0.1 M NaCl-1 mM CuCl2. (d) Magnified view of (c).
Metals 11 00511 g006
Figure 7. Cu 2p3/2 X-ray photoelectron spectroscopy (XPS) spectra of 316EHP stainless-steel in 0.1 M NaCl-1 mM CuCl2 polarized from 0.20 to 0.40 V and polarized from 0.25 to 0.86 V.
Metals 11 00511 g007
Figure 8. Anodic polarization curves polarized to 0.4 V in (a1, b1) 0.1 M NaCl, and polarized from 0.4 V in (a2) 0.1 M NaCl and (b2) 0.1 M NaCl-1 mM CuCl2.
Metals 11 00511 g008
Table 1. Chemical composition of extra-high-purity type 316 (316EHP) stainless-steel (mass %).
CSiMnPSNi
0.0018.6 × 10−41.3 × 10−34.2 × 10−46.3 × 10−413.5
CrMoCuAlNO
17.22.456.8 × 10−41.5 × 10⁻³<9.0 × 10−40.01
Table 2. Relative compositions (at.%) at point 1 in Figure 1.
ElementsOCrFeNiCuMo
Point 139591.50.49-0.09
Table 3. Relative compositions (at.%) at points 3 and 4 in Figure 3.
ElementsOCrFeNiCuMo
Point 241581.30.43-0.07
Point 340581.30.47-0.06
Publisher’s Note: MDPI stays neutral with regard to jurisdictional claims in published maps and institutional affiliations.

