Article

Effect of Al Content on Texture Evolution and Recrystallization Behavior of Non-Flammable Magnesium Sheet Alloys

Magnesium Innovation Centre, Institute of Material and Process Design, Helmholtz-Zentrum Geesthacht, Max-Planck-Str. 1, D-21502 Geesthacht, Germany
*
Authors to whom correspondence should be addressed.
Metals 2021, 11(3), 468; https://doi.org/10.3390/met11030468
Submission received: 26 February 2021 / Revised: 8 March 2021 / Accepted: 9 March 2021 / Published: 12 March 2021

Abstract

:
The effect of Al content on the texture evolution and recrystallization behavior of the non-flammable Mg sheet alloys containing Ca and Y was investigated in this study. With a decrease in the Al content from 3 wt.% to 1 wt.%, the amounts of the other alloying elements dissolved in the matrix, especially Ca, are increased. The increase of the alloying elements in a solid solution brought out the retarded recrystallization and weakened texture with the basal poles tilted toward the sheet transverse direction. Extension twinning activity increased when Al content with decreasing, resulting in the texture broadening towards the sheet transverse direction in the as-rolled sheets. The textures of the AZXW1000 and AZXW2000 sheets weaken uniformly in all sample directions during annealing, while the AZXW3000 sheet shows less weakening of the rolling direction split component. The texture weakening of the alloys with lower Al contents is attributed to the retarded recrystallization caused by the larger amount of the dissolved Ca solutes. Based on the non-basal texture and relatively stable grain structure, the Mg alloy sheet containing a relatively small amount of Al is advantageous to improve the formability.

1. Introduction

As the lightest structural metallic material, Mg alloys are attractive for application in the transportation sectors to increase energy efficiency. However, a wide application of Mg alloys has been hindered by some drawbacks, such as poor room temperature formability, poor corrosion resistance, and high flammability. While the early studies regarding the formability improvement were conducted using the commercial AZ31 alloy sheet [1,2,3,4,5], it has been well acknowledged that the alloying of rare earth elements (RE), Ca or Sr [6,7,8,9] significantly improve the room temperature formability to be comparable to that of 6000 series aluminum alloy sheets [10]. The addition of Ca into Mg alloys has been known to improve high temperature mechanical properties and ignition-proof behavior. Moreover, the simultaneous addition of Ca with Y results in an excellent ignition-proof behavior and improved corrosion resistance [11,12,13].
A large amount of alloying elements cause difficulties in controlling the microstructure during the sheet processes, including continuous casting. Strong microstructure inhomogeneity caused by high alloying amount, e.g., centerline segregation formed in a strip produced via continuous casting and high quantity of secondary phases due to the high affinity Al with other alloying elements, like RE and Ca, deteriorates the mechanical and corrosion properties. Furthermore, the formation of secondary phases consumes the alloying elements dissolved in the matrix, such that the role of such elements in the texture weakening is diminished by high Al content [10,14,15,16,17]. In view of the effects of Al on microstructure and texture evolution, recent studies of highly formable Mg sheet alloys put focus on the development of low-Al containing alloys. It was reported that the Mg alloy sheets containing Al close to 1 wt.%, Mg-1.2Al-0.5Ca-0.4Mn-1.6Zn [18], Mg-1.3Al-0.5Ca-0.7Mn-0.8Zn [19], and Mg-1Zn-1Al-0.5Ca-0.4Mn-0.2Ca [20], exhibit a weak texture, high formability, and improved mechanical properties. In this study, the texture evolution and recrystallization behavior of the Mg sheet alloys having excellent non-flammability containing Al, Ca, and Y, which are essential elements to achieve the non-flammability, as well as texture weakening, were investigated by varying the Al content from 1 wt.% to 3 wt.%. The focus of the present study is laid to clarify the relationship between the Al content and microstructural evolution of the non-flammable alloys in consideration of the amount of the dissolved alloying elements in the matrix.

2. Materials and Methods

The ingots of AZXW1000, 2000, and 3000 alloys, with the nominal compositions of Mg-xAl-1Zn-0.5Ca-0.5Y-0.1Mn, x = 1, 2, 3 (in wt.%), were prepared by gravity casting. The molten metal with the target composition was cast in a steel crucible under a protective atmosphere of Ar and SF6 mixture. The furnace temperature was set to 780 °C until the melts were poured into steel crucibles preheated at 700 °C. After pouring the melt, the crucible was quenched in water. It is to mention that the protection gas was used to ensure a high safety during the casting experiments, while the examined alloys exhibited an excellent ignition-proof behavior, e.g., no ignition during the pouring of the molten metal. The billets with a thickness of 10 mm were machined from the cast materials, and then hot rolled at 450 °C to a final thickness of 1.2 mm. The step reduction degree was increasing from 10 to 30% with the rolling passes, and the intermediate annealing of the rolled sheet was conducted at 450 °C for 10 min prior to each rolling step. The recrystallization annealing of the rolled sheet was conducted at 400 °C for 10 min. The textures of the as-rolled and annealed sheets were measured using a Panalytical X-ray diffractometer (Malvern Panalytical, Malvern, UK) and Cu K α radiation. The (0002) pole figures were recalculated using a MATLAB-based toolbox MTEX [21] from six measured pole figures. Stretch formability (Index Erichsen, I.E) of the annealed sheets was tested at room temperature. The tests were carried out with a blank holding force of 10 kN, a punch diameter of 20 mm, and a deformation rate (punch displacement) of 0.5 mm/min. Microstructural analyses were performed using a scanning electron microscope (SEM, Vega 3 SB, TESCAN, Brno, Czech Republic), equipped with an energy-dispersive X-ray spectroscope (EDS, eumeX, Heidenrod, Germany). Electron backscatter diffraction (EBSD) analysis was performed by using an FEG-SEM (Ultra 55, Zeiss, Jena, Germany) equipped with an EBSD detector (Hikari camera (EDAX, Mahwah, NJ, USA)) with TSL OIM software (version 7, EDAX, Mahwah, NJ, USA). Specimens for electron microscopy were prepared by electro-polishing in a Struers AC2 solution at −20 °C and 30 V. The thermodynamic calculation for the corresponding alloy compositions was carried out using Pandat software (version 2017, Compu Therm LLC, Wisconsin, USA) [22] to calculate the amount of the dissolved Ca solutes in the matrix.

3. Results and Discussion

The recalculated (0002) pole figures of the as-rolled and annealed sheets are presented in Figure 1. The maximum pole densities of the (0002) pole figures of the as-rolled AZXW1000, 2000, and 3000 sheets are 5.5, 4.9, and 6.2, respectively. The as-rolled AZXW1000 and AZXW2000 sheets show the basal poles tilted towards the rolling direction (RD) and, simultaneously, the basal pole spread in the transverse direction (TD), whereas the texture of the as-rolled AZXW3000 sheet is presented by the basal pole spread from the normal direction (ND) towards the RD. The annealed AZXW1000 and AZXW2000 sheets show the weak texture with the basal pole split toward the TD contrary to the texture of the annealed AZXW3000 sheet. These textures obtained in the AZXW1000 and AZXW2000 sheets normally develop in the highly formable Mg alloy sheets containing RE, Ca and Zn [14,16,23,24,25,26,27,28]. The appearances of the Erichsen samples of the examined sheets are shown in Figure 2. The annealed AZXW2000 sheet (IE = 6.2) indeed has higher formability than the AZXW3000 sheet (IE = 4.8), while both sheets have higher IE values than the commercial AZ31 sheet (IE = 2~3). The improved formability can be understood as a result of the texture weakening and the accompanying development of the non-basal type texture.
The optical micrographs, which are taken at the longitudinal section, of the as-rolled and annealed sheets are shown in Figure 3a–f, respectively. The microstructure of the as-rolled sheets commonly consists of the deformed grains, deformation twins and secondary phases. The fully recrystallized microstructures were obtained in all examined alloys after annealing treatment at 400 °C for 10 min. The average grain sizes of the recrystallized AZXW1000, 2000, and 3000 sheets are comparable, 5.2, 6.9, and 6.1 µm, respectively.
Figure 4 shows the variation of the phase fractions as a function of Al content, calculated by using the Pandat software. The total fraction of the secondary phases of the alloys containing 1, 2, and 3 wt.% of Al increases with the Al content, 1.85, 2.42, and 3.97 wt.%, respectively. The amounts of Al4MgY and Al8Mn5 phases increase when Al content is higher than 1 and 2 wt.%. The formation of Mg2Ca and Al2Y phases is found only in the alloy containing 1 wt.% Al, while Al2Ca phase is formed in the alloys with Al amount higher than 2 wt.%. Considering the calculated fractions of the equilibrium phases, it is plausible that the fine particles with the average size of 0.2 µm observed in the as-rolled and annealed AZXW1000 and AZXW2000 sheets, Figure 3a,b,d,e, are inferred to be Mg2Ca and Al2Y phases.
The SEM images of the annealed AZXW1000, 2000, and 3000 sheets are demonstrated in Figure 5. The chemical compositions analyzed by SEM-EDS are listed in Table 1 for the secondary phases marked with yellow arrows. The stoichiometry of the particles B, E, and C corresponds to Al2Ca and (Mg,Al)2Ca phases, respectively, and the particle D to Al2Y phase. The particles observed in the AZXW1000, 2000, and 3000 sheets, from the SEM-EDS, does not follow the thermodynamic calculation, and the formation of the Al2Ca, Mg2Ca, as well as (Mg,Al)2Ca, are not clearly distinguished depending on the Al content. The formation of Ca-containing phases, Al2Ca, Mg2Ca, and (Mg,Al)2Ca mainly depends on the Ca/Al ratio. That is, the increase of Ca/Al ratio induces the formation of Mg2Ca and (Mg,Al)2Ca phases rather than Al2Ca phase [29], as shown in Figure 4. The chemical composition of the points A and F consisted of Al, Mn, and Y, do not match the equilibrium phases, i.e., Al8Mn5, Al2Y, or Al4MgY. Structural similarity among these phases [30,31] and solidification in non-equilibrium result in the formation of non-equilibrium phases. Additionally, the high affinity [32] of Al to Mn and Y is considered to agglomerate Al, Mn, and Y, and form the non-equilibrium phase.
As the Al content increases from 1 wt.% to 3 wt.%, the volume fraction and size of the secondary phases also increase, as shown in Figure 4, as well as the point A and F in Figure 5. It indicates that the high amount of Al is likely to consume the Ca, Y, and Mn solutes by the formation of the secondary phases during the thermo-mechanical treatments. On the contrary, in the alloys with low Al content the other alloying elements can be dissolved in the matrix without forming secondary phases. The amounts of the Ca solutes dissolved in the matrix are plotted as a function of the Al content in Figure 6. The experimental values and the calculated values using by Pandat software confirm that the amount of the dissolved Ca solutes increases with decreasing the Al content. Especially, the dissolved Ca solutes sharply increases by reducing the Al content to 1 wt.%. The differences between the amount of the calculated and the measured Ca solutes arise from the restricted resolution of the SEM-EDS and the formation of the non-equilibrium phases, like Al-Mn-Y, that are not expected from the thermodynamic calculation. It is important to mention that the amount of the Mn and Y solutes dissolved in the matrix also increase as Al content decreases, but the increment is much smaller in comparison to that of the Ca solutes.
To investigate the recrystallization behavior and texture evolution during the annealing treatment, EBSD analysis was performed on the sheets annealed to various times. Inverse pole figure maps (IPF) of the examined sheets annealed at 400 °C for 0 s (as-rolled), 10 s, and 30 s are presented in Figure 7 with the corresponding (0001) pole figures. The EBSD measuring points with the confidence index (CI) higher than 0.08, without an additional data clean-up, are shown in the IPF maps, and the non-indexed areas with black color correspond to either highly deformed region or secondary phases. The as-rolled AZXW1000, 2000, and 3000 sheets have a strong texture with the basal poles mostly tilted to the RD. The as-rolled AZXW1000 sheet shows a distinct broadening of the basal poles towards the TD, in comparison to that of the as-rolled AZXW2000 and AZXW3000 sheets. Accordingly, a large number of grains having the tilted basal pole to the TD (green grains) are found in the as-rolled AZXW1000 sheet. Misorientation angle distribution plots of the as-rolled AZXW1000, 2000 and 3000 sheets are shown in Figure 8. All of the examined sheets show three peaks at around 38°, 56°, and 86°, and the peaks correspond to secondary, contraction and extension twins, respectively [33]. Interestingly, the fraction of the extension twin in the as-rolled AZXW1000 sheet is higher than that in the as-rolled AZXW2000 and AZXW3000. It can be mentioned that the AZXW1000 sheet have higher extension twinning activities than that of the AZXW2000 and AZXW3000 sheets, which matches to the distinct broadening of the basal poles towards the TD. Meanwhile, a higher fraction of the secondary twin is found in the AZXW3000, in comparison to that of the AZXW1000 and AZXW2000 sheets.
A few papers reported that the secondary twin is an origin of strain localization and shear band formed in the as-rolled sheet [33,34]. The secondary twins were commonly observed in the shear bands with a high density of dislocations. The basal planes reoriented by secondary twins are favorable for the basal slip, and dislocation slip abundantly occurs and piles up around the twin boundaries, resultantly then, bring out stress concentration and distortion of the twin regions [34]. The as-rolled microstructure of the AZXW3000 sheet, Figure 3c, shows the distinct strain localization region developed across more grains in comparison to that of the as-rolled AZXW1000 and AZXW2000 sheets, Figure 3a,b. It arises from the highest fraction of secondary twins due to the stress concentration in the AZXW3000 sheet.
As the recrystallization proceeds during the annealing treatment for 10 s, the basal pole distribution of the investigated sheets broaden to the RD and TD. Even though the maximum pole densities of the sheets annealed for 10 s are barely changed, the basal pole densities weaken uniformly along all sample directions without a preferred weakening at a certain sample direction. After 30 s of annealing, the AZXW1000 and AZXW2000 sheets show further a uniform texture weakening accompanying the basal pole broadening towards the RD and TD. On the contrary, the weakening of the tilted basal pole to the RD is relatively less in the annealed AZXW3000 sheet for 30 s, resulting in a higher texture intensity.
The fraction of the recrystallized grains for the investigated sheets along the annealing time are shown in Figure 9, indicating distinct recrystallization kinetics of each alloy sheet. The recrystallized grains are defined by the grain orientation spread (GOS) less than 1°. The fraction of the recrystallized grains in the as-rolled AZXW1000, 2000, and 3000 sheets are close to 0, and the recrystallization of the three alloy sheets is almost complete after the annealing treatment for 30 s as shown in Figure 7. Comparing the fractions of the recrystallized grains in the annealed sheets for 10 s, i.e., at the beginning stage of the recrystallization, it is clear that the examined alloy sheets exhibit different recrystallization kinetics. The fraction of the recrystallized grains in the AZXW1000, 2000, and 3000 sheets are 0.17, 0.21, and 0.26, respectively, indicating that the AZXW3000 sheet has faster recrystallization kinetics than the AZXW1000 and AZXW2000 sheets. It is reported that the recrystallization of the Mg alloy sheets containing RE, Ca, and Zn [14,16,23,24,25] is retarded by solutes segregation at the grain boundaries, stacking faults and twin boundaries, and resultantly, the recrystallization kinetics of the sheets become slow. For example, the ZW01 [16] and Mg-0.8Zn-0.2Ca [14] alloy sheets show slower recrystallization kinetics than the investigated alloy sheets in this study. The amount of the dissolved solutes in the above alloys are calculated by Pandat software at the same temperature, 400 °C, for comparison. The amounts are 0.79 wt.% of Y, 0.05 wt.% of Zn, and 0.2 wt.% of Ca and 0.8 wt.% of Zn, respectively, which are higher than those in the examined sheets of the present study, Figure 6. Again, it is plausible that the recrystallization kinetics is influenced by the amount of the dissolved solutes. Accordingly, the recrystallization kinetics of the AZXW1000 and AZXW2000 alloy sheets are slower than that of the AZXW3000, which corresponds to the larger amount of the dissolved Ca solutes in the alloys with lower Al contents.
The EBSD IPF maps and (0001) pole figures of the annealed sheets for 600 s, which correspond to Figure 1 and Figure 3, are shown in Figure 10. While the AZXW1000 and AZXW2000 sheets maintain the basal poles tilted toward the TD and RD, the AZXW3000 sheet shows a higher concentration of the basal poles at the ND. The tendency of the basal-type texture development, i.e., alignment of the basal poles in the ND, with increasing the annealing time is commonly observed during the recrystallization of the commercial Mg alloy sheets, resulting in basal-type texture. The development of the basal-type texture is effectively hindered by the higher amount of the dissolved solutes, and brings out a more randomized texture with the basal pole tilted towards TD [14].
In addition to the retarded boundary motion by the dissolved solutes, the pinning effect by precipitates is also to be considered. As reported in [35], the thermally stable Y-containing precipitates in the Mg-0.7Ca-0.7Y alloy sheet hinder the grain boundary movement during the homogenization treatment, and contribute to obtaining the fine microstructure. Likewise, the fine particles that are observed in the microstructure of the as-rolled and annealed AZXW1000 and AZXW2000 sheets, Figure 3a,b,d,e, can contribute to retarding the recrystallization. A more detailed analysis regarding the interaction between the precipitates and grain boundary motion will clarify the role of the fine precipitates on the recrystallization kinetics of the examined alloys.

4. Conclusions

The effect of the Al content on the texture evolution and recrystallization behavior of the Mg alloy sheets containing Ca and Y were investigated in this study. The decrease of the Al content in the alloy leads to the increase in the amount of the dissolved alloying elements in matrix, i.e., increase of the Ca solute. The retarded recrystallization and the texture weakening observed in the AZXW1000 and AZXW2000 sheets, in comparison to that of the AZXW3000 sheet, are attributed to the relatively high amount of the solutes. These results clearly show that the formability of the Mg sheet, which contains the alloying elements contribute to the texture weakening like Ca and Y, can be improved in 2~3 times by reducing Al content from 3 wt.% to 1 wt.%.

Author Contributions

Conceptualization, S.J. and S.Y.; Experiments and analyzed the experimental results, S.J.; Writing—original draft preparation, S.J.; Writing—review and editing, S.Y. and S.J.; Project administration, D.L. All authors have read and agreed to the published version of the manuscript.

Funding

This work was partly funded by NST-National Research Council of Science & Technology (No. CRC-15-06-KIGAM), Ministry of Science and ICP (MSIP).

Institutional Review Board Statement

Not applicable.

Informed Consent Statement

Not applicable.

Data Availability Statement

The data presented in this study are available on reasonable request to the corresponding author.

Acknowledgments

The authors gratefully acknowledge Y.M. Kim at Korea Institute of Material Science (KIMS) for a fruitful discussion on the experimental results and non-flammable alloys. The authors are grateful to Y.K. Shin, at Helmholtz-Zentrum Geesthacht (HZG), for supporting the sample preparation and EBSD analysis.

Conflicts of Interest

The authors declare no conflict of interest.

References

  1. Lee, S.; Chen, Y.-H.; Wang, J.-Y. Isothermal sheet formability of magnesium alloy AZ31 and AZ61. J. Mater. Process. Tech. 2002, 124, 19–24. [Google Scholar] [CrossRef]
  2. Kaiser, F.; Bohlen, J.; Letzig, D.; Kainer, K.U.; Styczynski, A.; Hartig, C. Influence of Rolling Conditions on the Microstructure and Mechanical Properties of Magnesium Sheet AZ31. Adv. Eng. Mater. 2003, 5, 891–896. [Google Scholar] [CrossRef]
  3. Jäger, A.; Lukáč, P.; Gärtnerová, V.; Bohlen, J.; Kainer, K.U. Tensile properties of hot rolled AZ31 Mg alloy sheets at elevated temperatures. J. Alloys Compd. 2004, 378, 184–187. [Google Scholar] [CrossRef]
  4. Takuda, H.; Yoshii, T.; Hatta, N. Finite-element analysis of the formability of a magnesium-based alloy AZ31 sheet. J. Mater. Process. Tech. 1999, 89–90, 135–140. [Google Scholar] [CrossRef]
  5. Fuh-Kuo, C.; Tyng-Bin, H. Formability of stamping magnesium-alloy AZ31 sheets. J. Mater. Process. Tech. 2003, 142, 643–647. [Google Scholar] [CrossRef]
  6. Masoudpanah, S.M.; Mahmudi, R. Effects of rare-earth elements and Ca additions on the microstructure and mechanical properties of AZ31 magnesium alloy processed by ECAP. Mater. Sci. Eng. A 2009, 526, 22–30. [Google Scholar] [CrossRef]
  7. Shang, L.; Yue, S.; RVerma; Krajewski, P.; Galvani, C.; Essadiqi, E. Effect of microalloying (Ca, Sr, and Ce) on elevated temperature tensile behavior of AZ31 magnesium sheet alloy. Mater. Sci. Eng. A 2011, 528, 3761–3770. [Google Scholar] [CrossRef]
  8. Bae, G.T.; Bae, J.H.; Kang, D.H.; Lee, H.; Kim, N.J. Effect of Ca addition on microstructure of twin-roll cast AZ31 Mg alloy. Met. Mater. Int. 2009, 15, 1–5. [Google Scholar] [CrossRef]
  9. Yi, S.; Park, J.H.; Letzig, D.; Kwon, O.D.; Kainer, K.U.; Kim, J.J. Microstructure and mechanical properteis of Ca containing AZX310 alloy sheets produced via twin roll casting technology. In Magnesium Technology 2016; Singh, A., Solanki, K., Manuel, M.V., Neelameggham, N.R., Eds.; Spinger: Cham, Switzerland, 2016; pp. 383–387. [Google Scholar] [CrossRef]
  10. Trang, T.T.T.; Zhang, J.H.; Kim, J.H.; Zargaran, A.; Hwang, J.H.; Suh, B.C.; Kim, N.J. Designing a magnesium alloy with high strength and high formability. Nat. Commun. 2018, 9. [Google Scholar] [CrossRef]
  11. You, B.S.; Kim, Y.M.; Yim, C.D.; Kim, H.S. Oxidation and Corrosion Behavior of Non-Flammable Magnesium Alloys Containing Ca and Y. In Magnesium Technology 2014; Alderman, M., Manuel, M.V., Hort, N., Neelameggham, N.R., Eds.; Springer: Cham, Switzerland, 2016; pp. 325–329. [Google Scholar] [CrossRef]
  12. Kim, Y.M.; Yim, C.D.; Kim, H.S.; You, B.S. Key factor influencing the ignition resistance of magnesium alloys at elevated temperatures. Scripta Mater. 2011, 65, 958–961. [Google Scholar] [CrossRef]
  13. Lee, D.B. High temperature oxidation of AZ31+0.3wt.%Ca and AZ31+0.3wt.%CaO magnesium alloys. Corros. Sci. 2013, 70, 243–251. [Google Scholar] [CrossRef]
  14. Zeng, Z.R.; Zhu, Y.M.; Xu, S.W.; Bian, M.Z.; Davies, C.H.J.; Birbilis, N.; Nie, J.F. Texture evolution during static recrystallization of cold-rolled magnesium alloys. Acta Mater. 2016, 105, 479–494. [Google Scholar] [CrossRef]
  15. Bohlen, J.; Wendt, J.; Nienaber, M.; Kainer, K.U.; Stutz, L.; Letzig, D. Calcium and zirconium as texture modifiers during rolling and annealing of magnesium–zinc alloys. Mater. Charact. 2015, 101, 144–152. [Google Scholar] [CrossRef] [Green Version]
  16. Kim, Y.M.; Mendis, C.; Sasaki, T.; Letzig, D.; Pyczak, F.; Hono, K.; Yi, S. Static recrystallization behaviour of cold rolled Mg-Zn-Y alloy and role of solute segregation in microstructure evolution. Scripta Mater. 2017, 136, 41–45. [Google Scholar] [CrossRef] [Green Version]
  17. Kurukuri, S.; Worswick, M.J.; Bardelcik, A.; Mishra, R.K.; Carter, J.T. Constitutive Behavior of Commercial Grade ZEK100 Magnesium Alloy Sheet over a Wide Range of Strain Rates. Metall. Mater. Trans. A 2014, 45, 3321–3337. [Google Scholar] [CrossRef]
  18. Li, Z.H.; Sasaki, T.T.; Bian, M.Z.; Nakata, T.; Yoshida, Y.; Kawabe, N.; Kamado, S.; Hono, K. Role of Zn on the room temperature formability and strength in Mg-Al-Ca-Mn sheet alloys. J. Alloys Compd. 2020, 847, 156347. [Google Scholar] [CrossRef]
  19. Bian, M.Z.; Sasaki, T.T.; Nakata, T.; Yoshida, Y.; Kawabe, N.; Kamado, S.; Hono, K. Bake-hardenable Mg–Al–Zn–Mn–Ca sheet alloy processed by twin-roll casting. Acta Mater. 2018, 158, 278–288. [Google Scholar] [CrossRef]
  20. Shi, R.; Miao, J.; Avey, T.; Luo, A.A. A new magnesium sheet alloy with high tensile properties and room-temperature formability. Sci. Rep. 2020, 10, 10044. [Google Scholar] [CrossRef]
  21. Bachmann, F.; Hielscher, R.; Schaeben, H. Texture Analysis with MTEX–Free and Open Source Software Toolbox. Solid State Phenom. 2010, 160, 63–68. [Google Scholar] [CrossRef] [Green Version]
  22. Chen, S.-L.; Daniel, S.; Zhang, F.; Chang, Y.A.; Yan, X.-Y.; Xie, F.-Y.; Schmid-Fetzer, R.; Oates, W.A. The PANDAT software package and its applications. Calphad 2002, 26, 175–188. [Google Scholar] [CrossRef]
  23. Stanford, N.; Barnett, M. Effect of composition on the texture and deformation behaviour of wrought Mg alloys. Scripta Mater. 2008, 58, 179–182. [Google Scholar] [CrossRef]
  24. Bohlen, J.; Nürnberg, M.R.; Senn, J.W.; Letzig, D.; Agnew, S.R. The texture and anisotropy of magnesium–zinc–rare earth alloy sheets. Acta Mater. 2007, 55, 2101–2112. [Google Scholar] [CrossRef] [Green Version]
  25. Chino, Y.; Ueda, T.; Otomatsu, Y.; Sassa, K.; Huang, X.; Suzuki, K.; Mabuchi, M. Effects of Ca on Tensile Properties and Stretch Formability at Room Temperature in Mg-Zn and Mg-Al Alloys. Mater. Trans. 2011, 52, 1477–1482. [Google Scholar] [CrossRef] [Green Version]
  26. Bian, M.Z.; Sasaki, T.T.; Suh, B.C.; Nakata, T.; Kamado, S.; Hono, K. Development of Heat-Treatable High-Strength Mg–Zn–Ca–Zr Sheet Alloy with Excellent Room Temperature Formability. In Magnesium Technology 2018; Orlov, D., Joshi, V., Solanki, K.N.N., Eds.; Springer: Cham, Switzerland, 2018; pp. 361–364. [Google Scholar]
  27. Chino, Y.; Huang, X.; Suzuki, K.; Mabuchi, M. Enhancement of Stretch Formability at Room Temperature by Addition of Ca in Mg-Zn Alloy. Mater. Trans. 2010, 51, 818–821. [Google Scholar] [CrossRef] [Green Version]
  28. Nakata, T.; Li, Z.H.; Sasaki, T.T.; Hono, K.; Kamado, S. Room-temperature stretch formability, tensile properties, and microstructures of precipitation hardenable Mg–6Zn-0.2Ca (mass%) alloy sheets micro-alloyed with Ce or Y. Mat. Sci. Eng. A 2020. [Google Scholar] [CrossRef]
  29. Liang, S.M.; Chen, R.S.; Blandin, J.J.; Suery, M.; Han, E.H. Thermal analysis and solidification pathways of Mg–Al–Ca system alloys. Mat. Sci. Eng. A 2008, 480, 365–372. [Google Scholar] [CrossRef]
  30. Suzuki, A.; Saddock, N.; Jones, J.; Pollock, T. Structure and transition of eutectic (Mg,Al)2Ca Laves phase in a die-cast Mg-Al-Ca base alloy. Scripta Mater. 2004, 51, 1005–1010. [Google Scholar] [CrossRef]
  31. Raghavan, V. Al-Ca-Mg (Aluminum-Calcium-Magnesium). J. Phase Equilib. Diff. 2010, 32, 52–53. [Google Scholar] [CrossRef]
  32. Takeuchi, A.; Inoue, A. Classification of bulk metallic glasses by atomic size difference, heat of mixing and period of constituent elements and its application to characterization of the main alloying element. Mater. Trans. 2005, 46, 2817–2829. [Google Scholar] [CrossRef] [Green Version]
  33. Guan, D.; Rainforth, W.M.; Gao, J.; Sharp, J.; Wynne, B.; Ma, L. Individual effect of recrystallisation nucleation sites on texture weakening in a magnesium alloy: Part 1- double twins. Acta Mater. 2017, 135, 14–24. [Google Scholar] [CrossRef]
  34. Zhang, K.; Zheng, J.-H.; Huang, Y.; Pruncu, C.; Jiang, J. Evolution of twinning and shear bands in magnesium alloys during rolling at room and cryogenic temperature. Mater. Design 2020, 193. [Google Scholar] [CrossRef]
  35. Jo, S.; Whitmore, L.; Woo, S.; Aramburu, A.U.; Letzig, D.; Yi, S. Excellent age hardenability with the controllable microstructure of AXW100 magnesium sheet alloy. Sci. Rep. 2020, 10, 22413. [Google Scholar] [CrossRef] [PubMed]
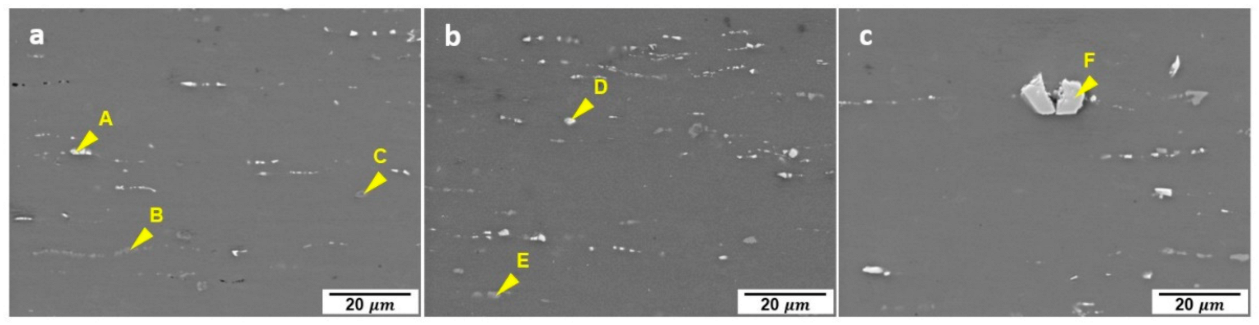
Figure 1. Recalculated (0002) pole figures of the (ac) as-rolled and (df) annealed AZXW1000, 2000, and 3000 alloy sheets, respectively.
Metals 11 00468 g001
Figure 2. Appearances of the Erichsen samples of the AZXW2000 and AZXW3000 sheets, respectively.
Metals 11 00468 g002
Figure 3. Optical micrographs of the (ac) as-rolled and (df) annealed AZXW1000, 2000 and 3000 sheets, respectively.
Metals 11 00468 g003
Figure 4. Calculated phase fraction of the investigated alloys at 400 °C as a function of Al content.
Metals 11 00468 g004
Figure 5. Secondary electron micrographs of the annealed (a) AZXW1000, (b) AZXW2000, and (c) AZXW3000 alloy sheets, respectively. The energy-dispersive X-ray spectroscopy results on the second phases marked by arrows A to G are given in Table 1.
Metals 11 00468 g005
Figure 6. Amount of the dissolved Ca solutes in matrix according to the Al content at 400 °C, comparing the experimentally measured values by SEM-EDS and the calculated amounts by Pandat software.
Metals 11 00468 g006
Figure 7. Inverse pole figure maps of the AZXW1000, 2000, and 3000 alloy sheets annealed for 0 s (as-rolled), 10 s, and 30 s.
Metals 11 00468 g007
Figure 8. Misorientation angle distribution of the as-rolled AZXW1000, 2000 and 3000 sheets calculated from the IPF maps in Figure 7.
Metals 11 00468 g008
Figure 9. Fraction of the recrystallized grains of the AZXW1000, 2000, and 3000 alloys according to the annealing time calculated from the IPF maps in Figure 7.
Metals 11 00468 g009
Figure 10. IPF maps and corresponding (0001) pole figures of the AZXW1000, 2000, and 3000 annealed for 600 s.
Metals 11 00468 g010
Table 1. Chemical composition (in at.%) of the second phases in the annealed AZXW1000, 2000, and 3000 sheets indicated by yellow arrows in Figure 5, analyzed by SEM-EDS.
PointAlZnMnCaYMg
A35.40.716.10.15.742.3
B7.31.10.074.70.0386.9
C11.01.50.110.90.176.4
D49.11.20.40.523.525.3
E44.50.90.0921.60.132.8
F57.70.529.80.110.51.4
Publisher’s Note: MDPI stays neutral with regard to jurisdictional claims in published maps and institutional affiliations.

