Figure 1.
Longest Solidification Time (LST) versus melt rate for ingots with different diameters [
33].
Figure 2.
Schematic illustration of horizontal slices and position of the micro sample on (a) the consumable electrode, CE-300, (b) ESR remelted ingots, and (c) PESR remelted ingots. Schematic illustration of the positions of the macro samples for (d) the electrode 300 × 300 mm2, for the electro-slag remelted (ESR) ingot 400 × 400 mm2, and (e) the pressure electro-slag remelted (PESR) ingots 500‒1050 mm in diameter. Position T/2 is located in the center of the electrode/ingot, T/4 in between the center and the surface/corner, and T/6 in between position T4 and the surface/corner.
Figure 3.
Schematic illustration of the longitudinal sections used for measuring the angle between the dendrites and the axial plane. Four samples were studied from the pressure electro-slag remelted ingots of 500 and 1050 mm diameter (PESR-500 and PESR-1050, respectively) and seven for the pressure electro-slag remelted ingot of 800 mm diameter (PESR-800).
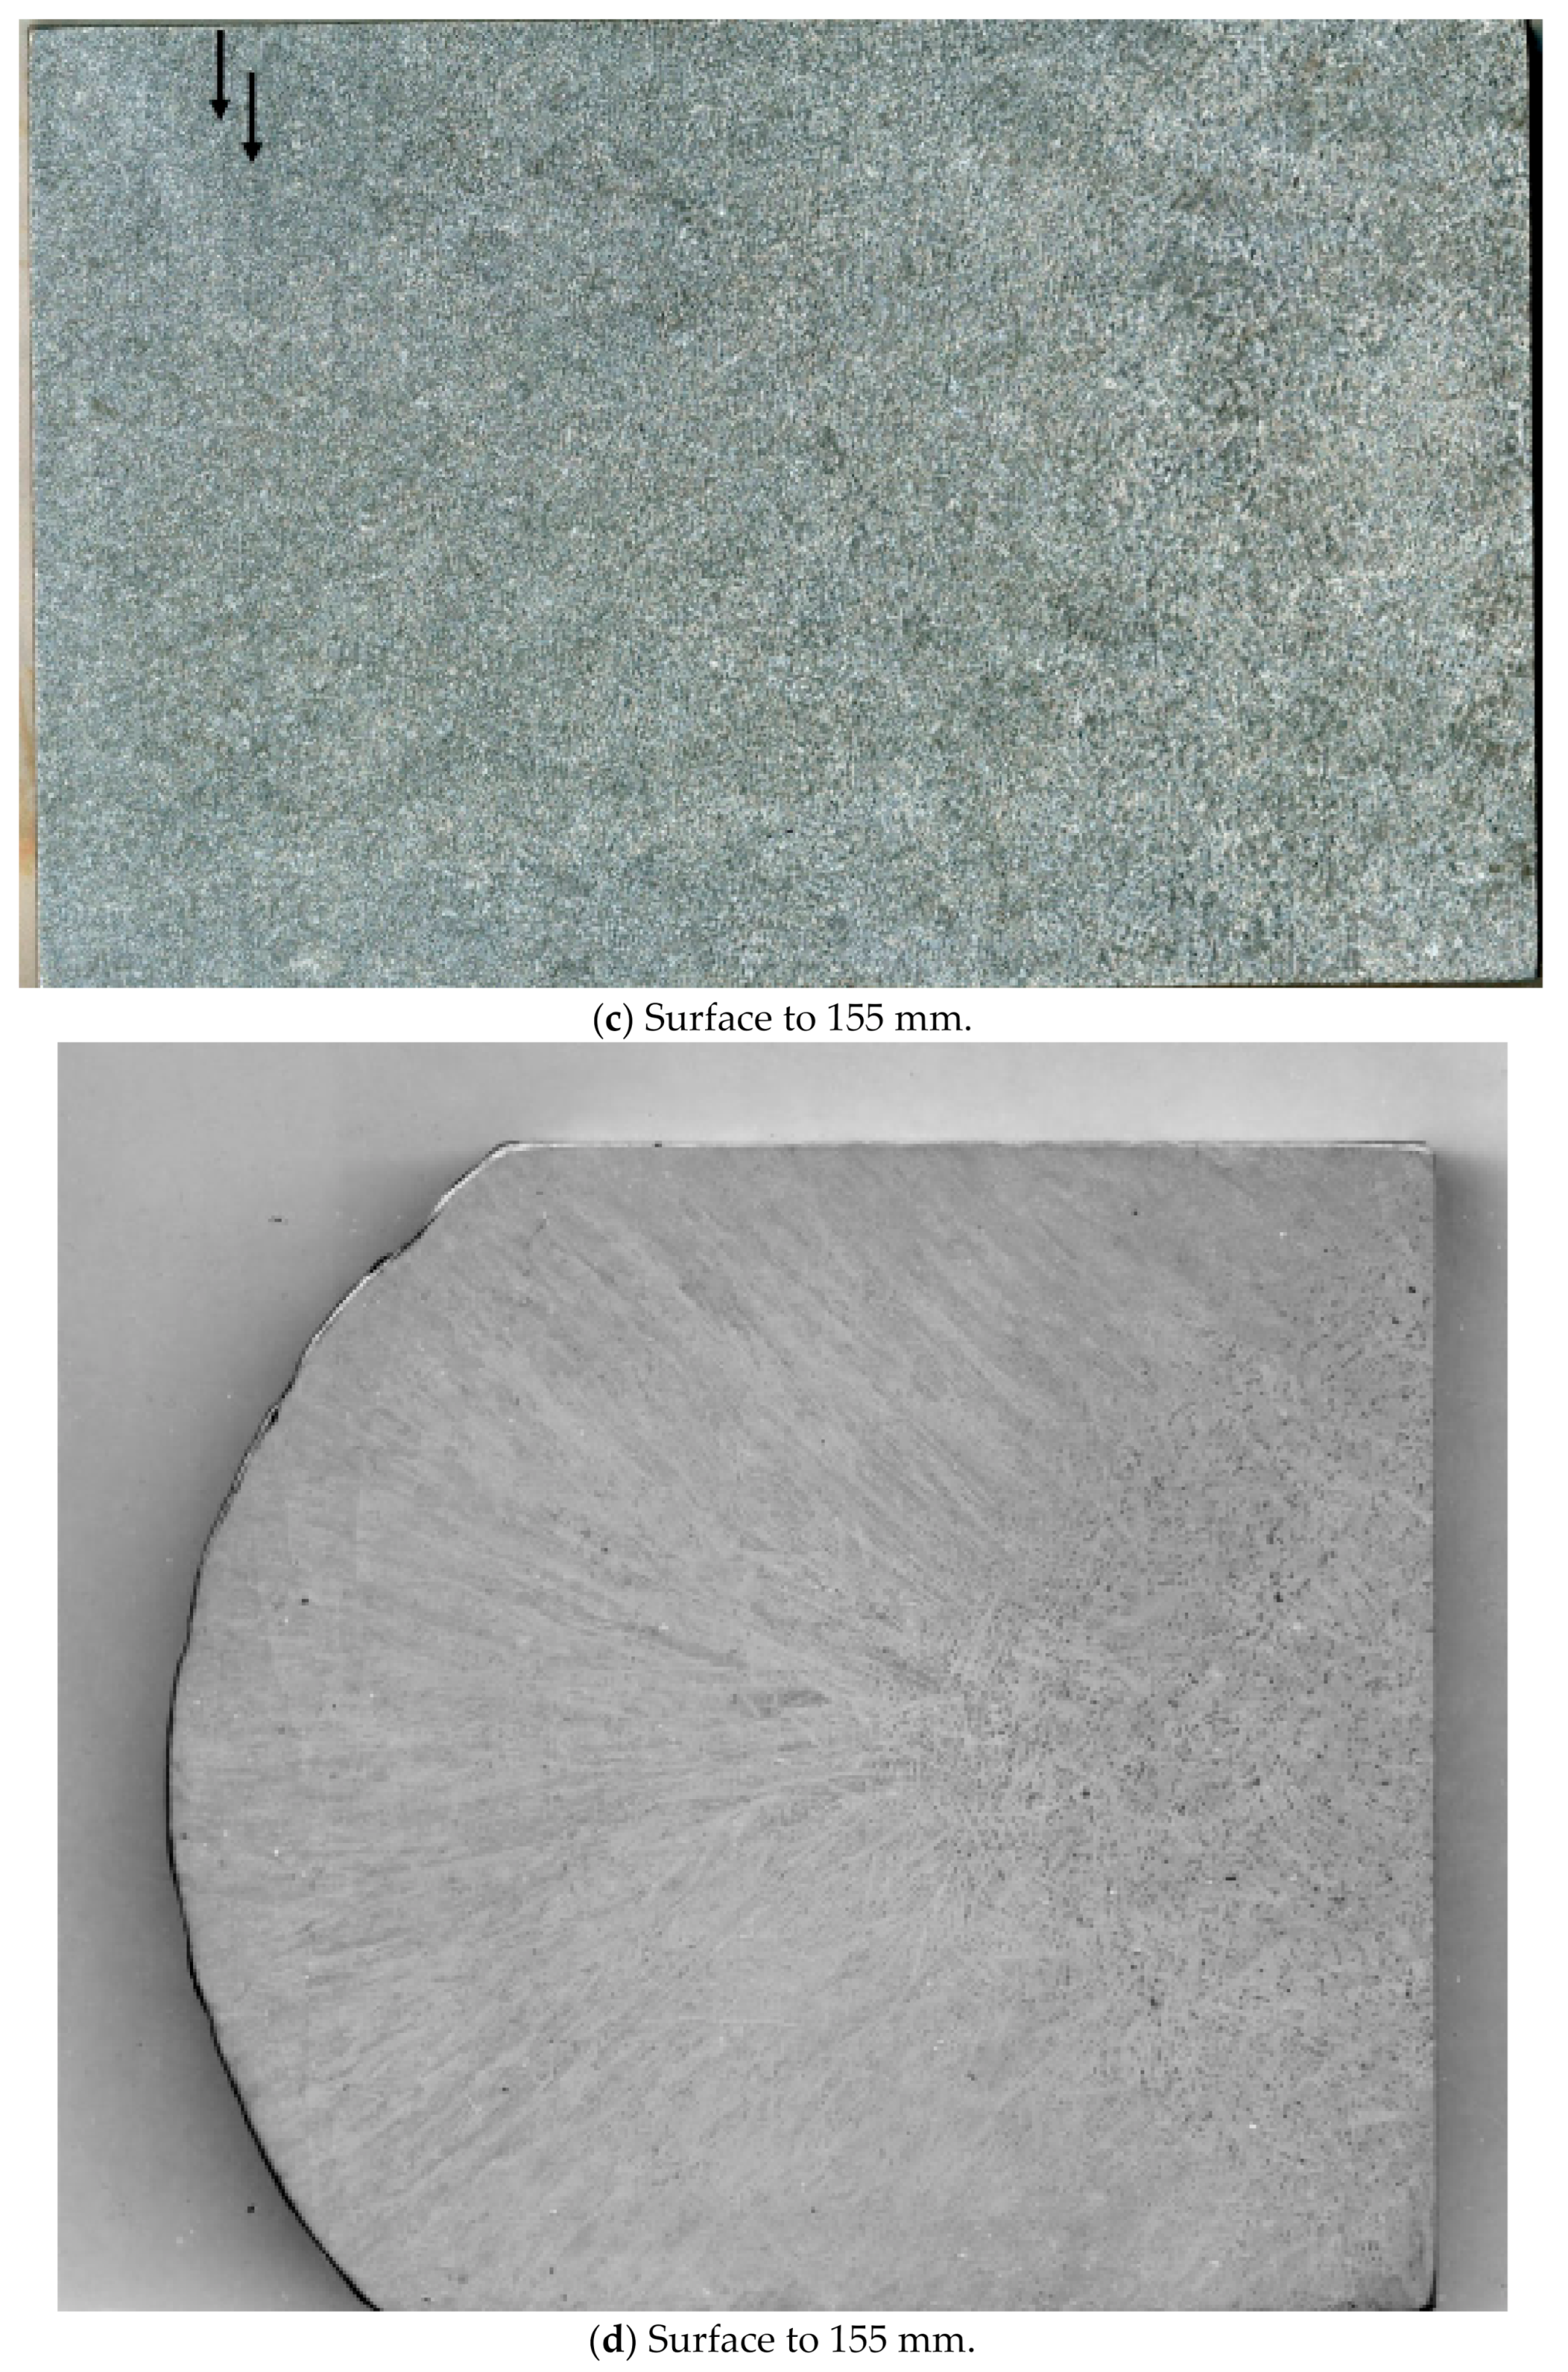
Figure 4.
Examples of the macrostructures in the electrode and the ingots. (a) Electro-slag remelted 400 × 400 mm2 ingot (ESR-400), from surface to position T/4 (in between corner and center). (b) Pressure electro-slag remelted 500 mm diameter ingot (PESR-500) with position T/6 (in between corner and position T/4) and position T/4 marked. The arrows point at the etching concentric bands. (c) Pressure electro-slag remelted 1050 mm diameter ingot (PESR-1050) from surface to 155 mm. The arrows point at the etching concentric bands. (d) Electrode 300 × 300 mm2 (CE-300) from surface to 155 mm.
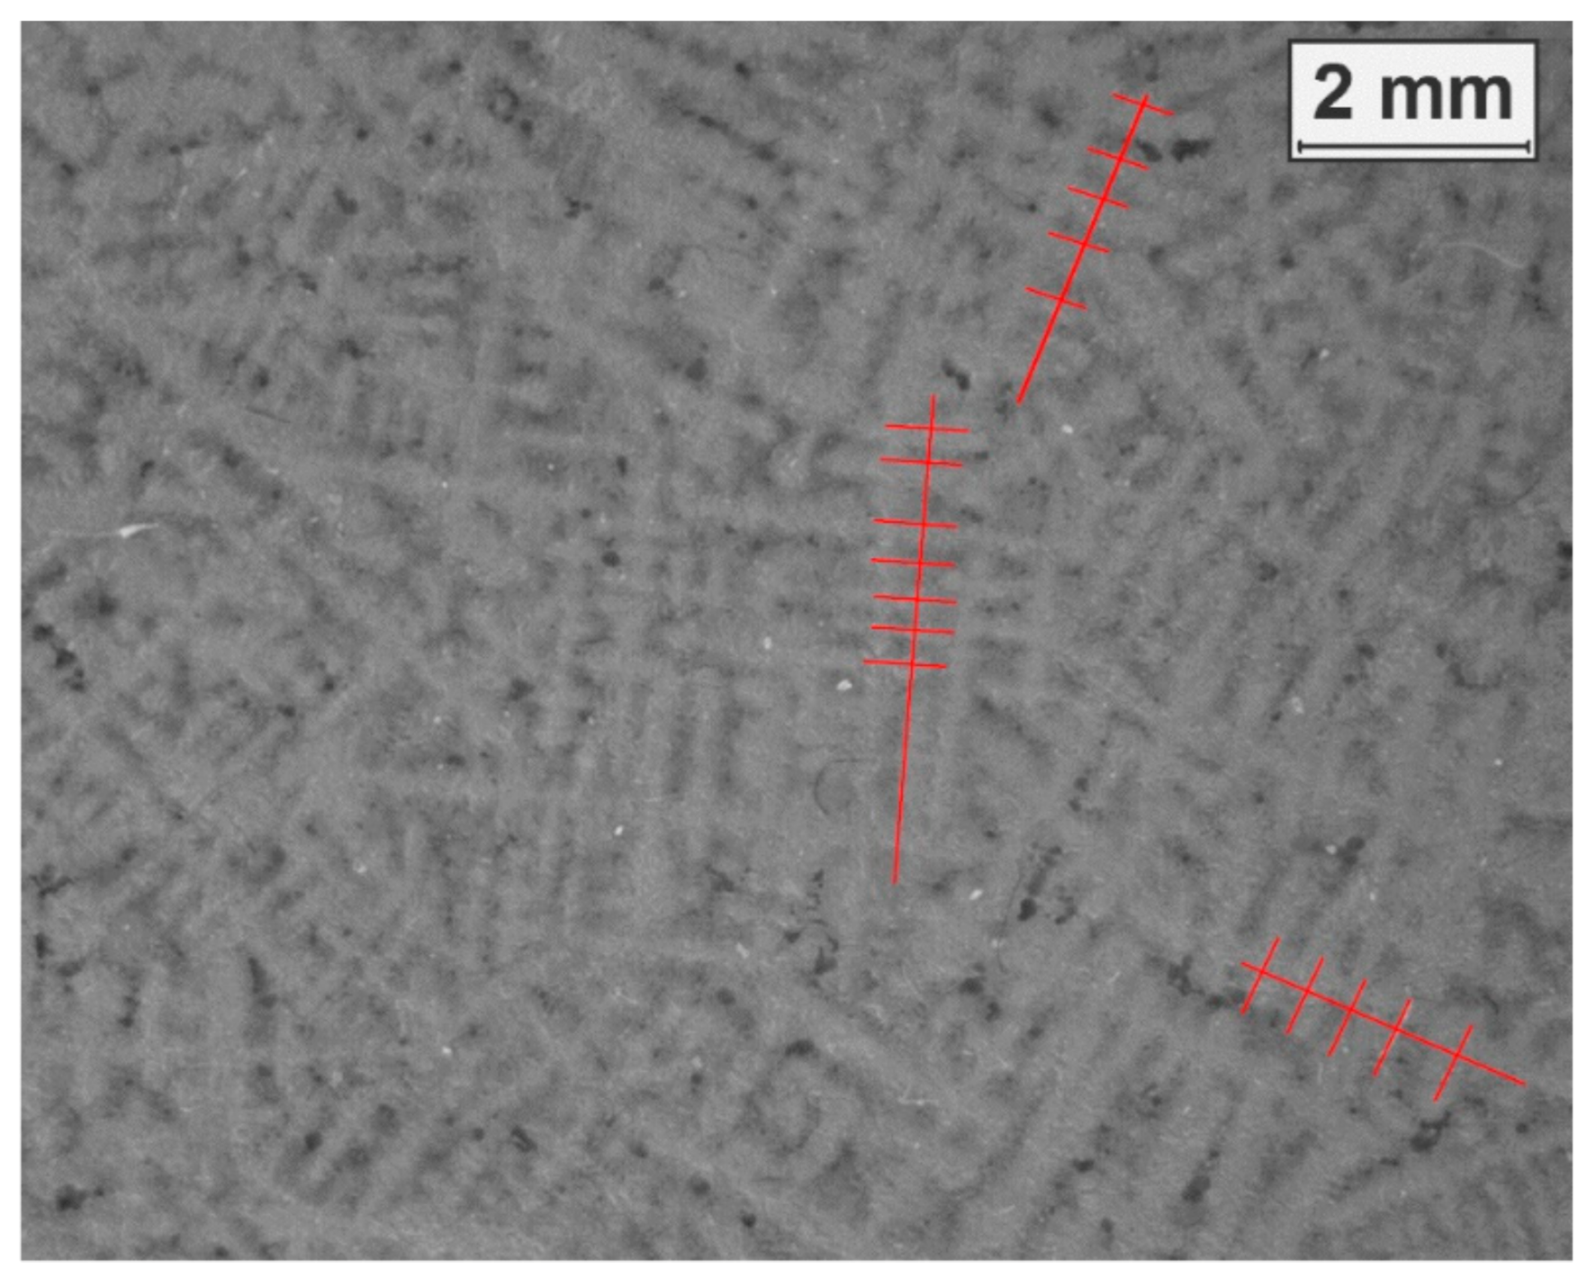
Figure 5.
Measure principle, example from position T/2 (center) of the 500 mm in diameter ingot (PESR-500). The primary arms and their connecting secondary arms are marked in red. The measurement was made in-between the red secondary arms.
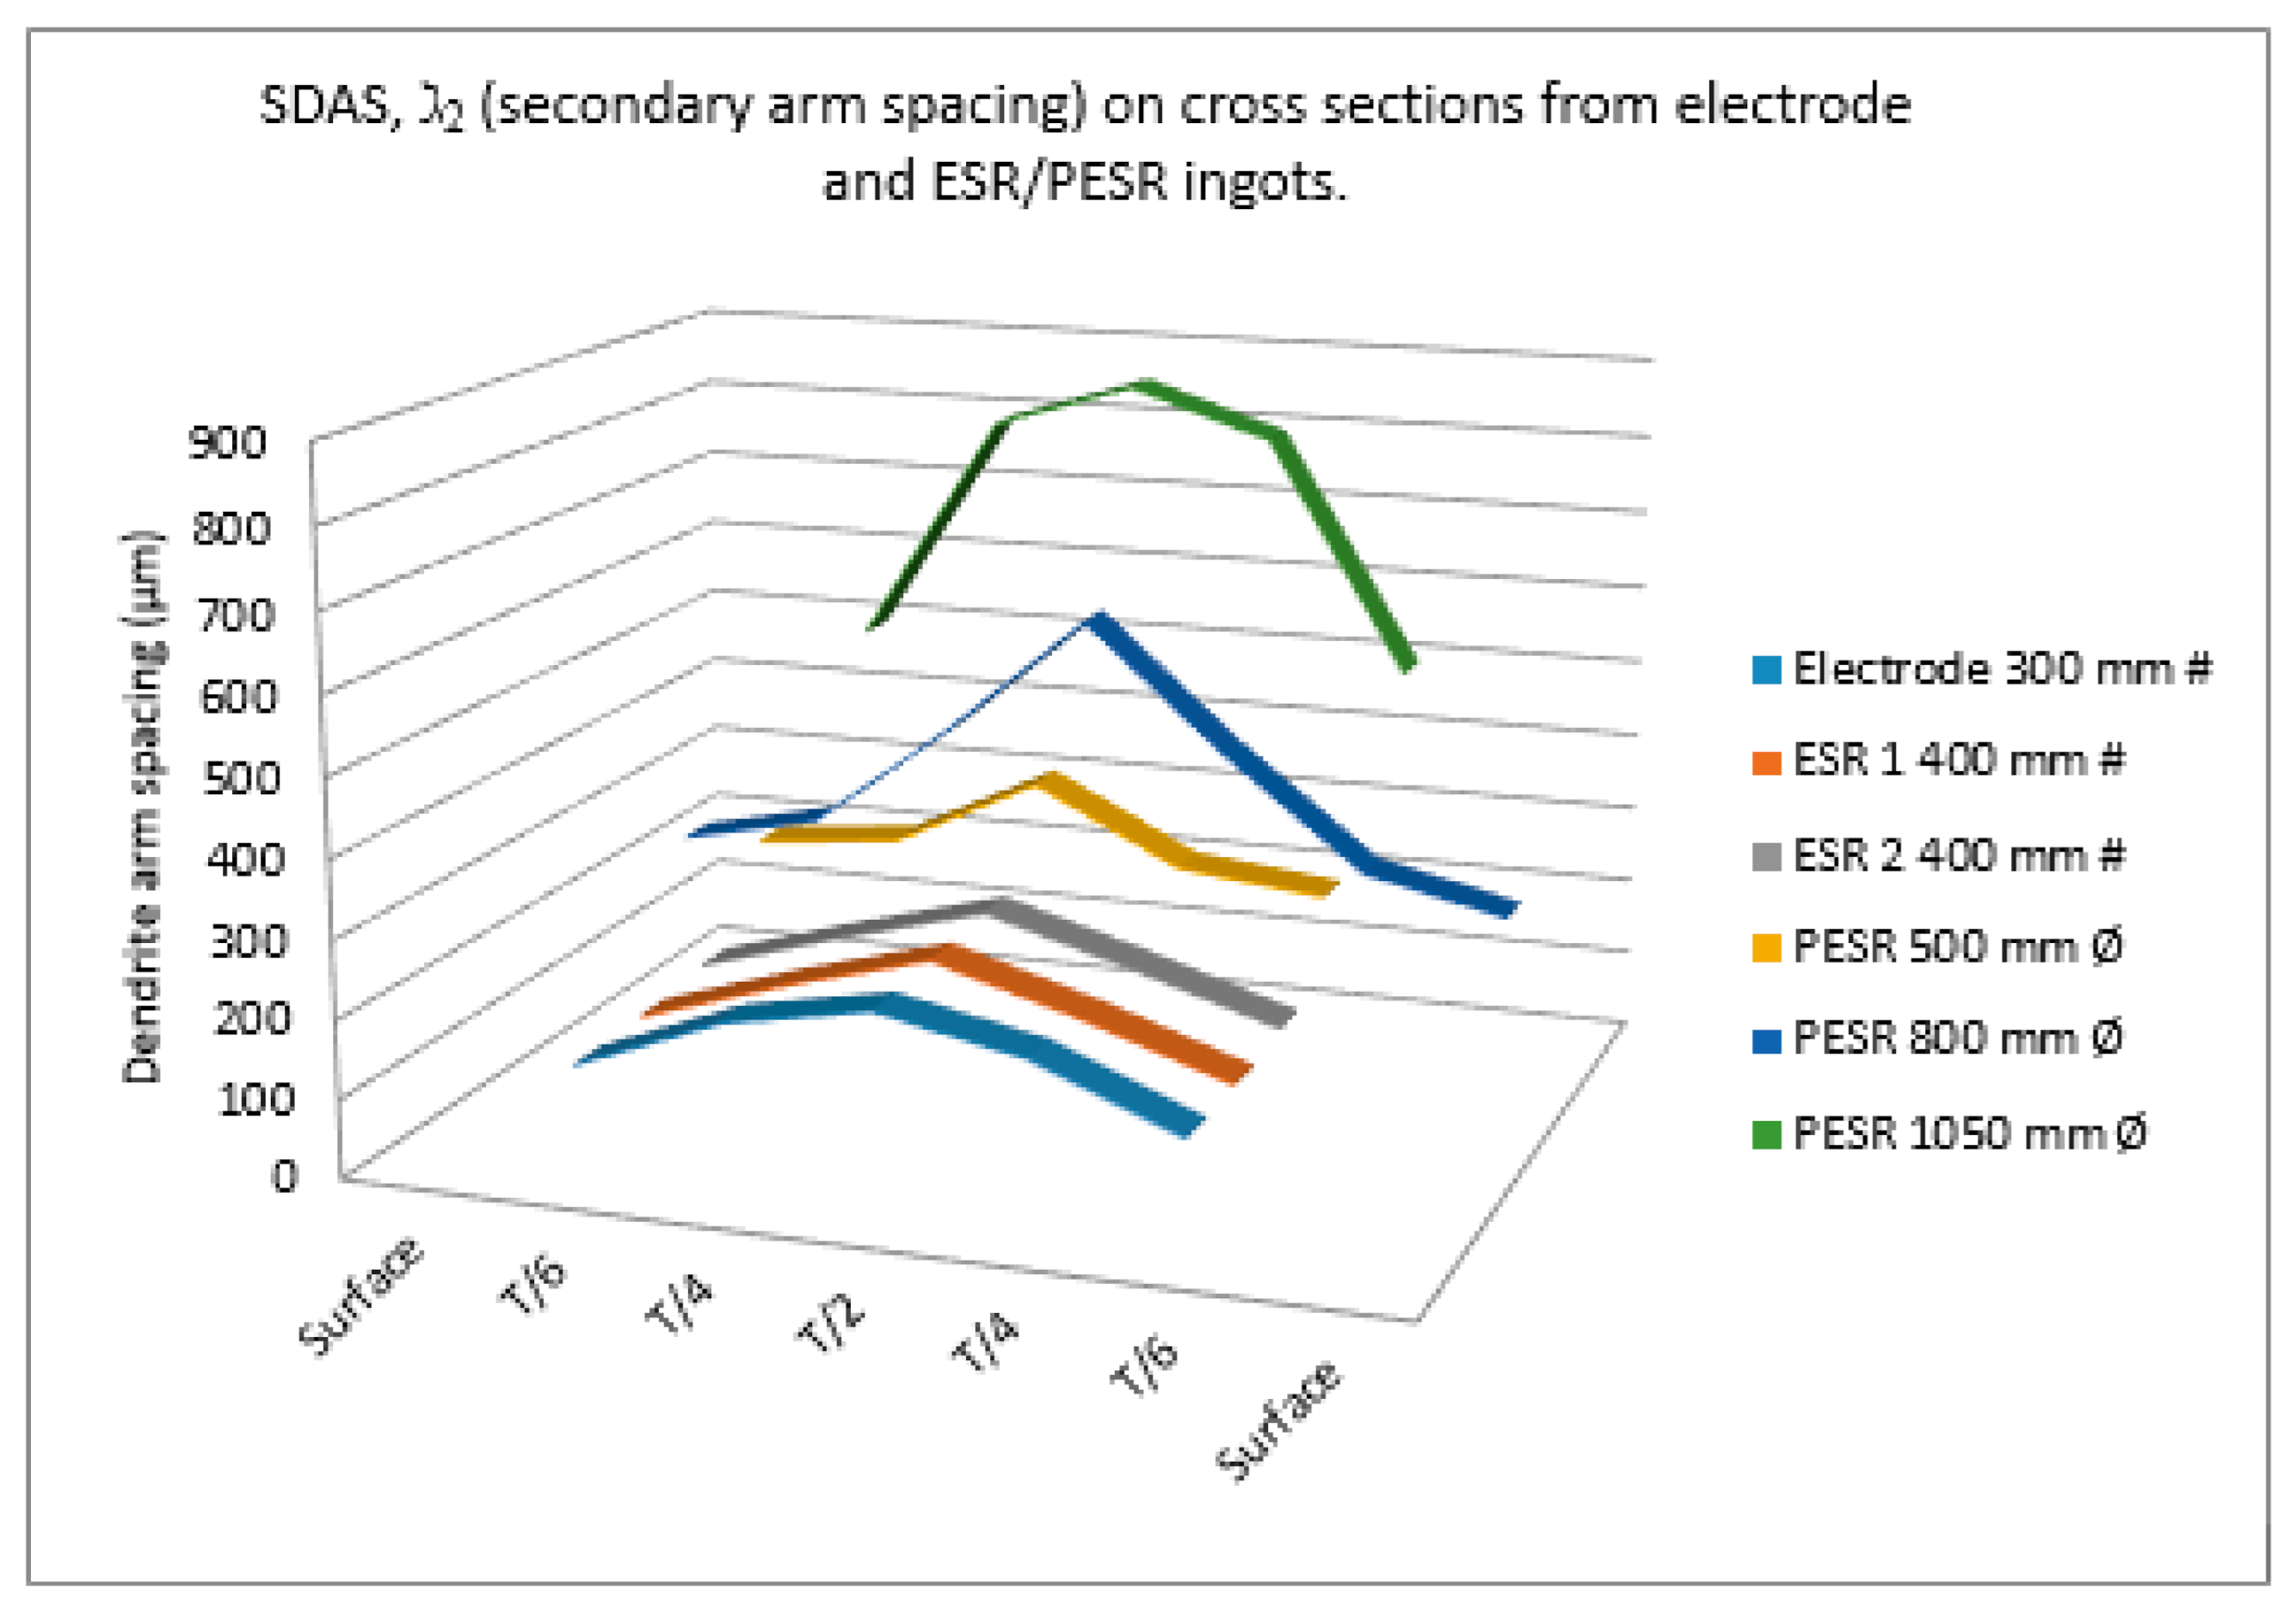
Figure 6.
Secondary dendrite arm spacing, (SDAS, ℷ2), (µm), for electrode 300 × 300 mm2 (C-300), electro-slag remelted 400 × 400 mm2 (ESR-400), and electro-slag remelted under pressure-controlled atmosphere pressure electro-slag remelted ingots 500–1050 mm in diameter (PESR-500, -800, and-1050). Cross-section positions: T/6—quarter radius, T/4—half radius, and T/2—center.
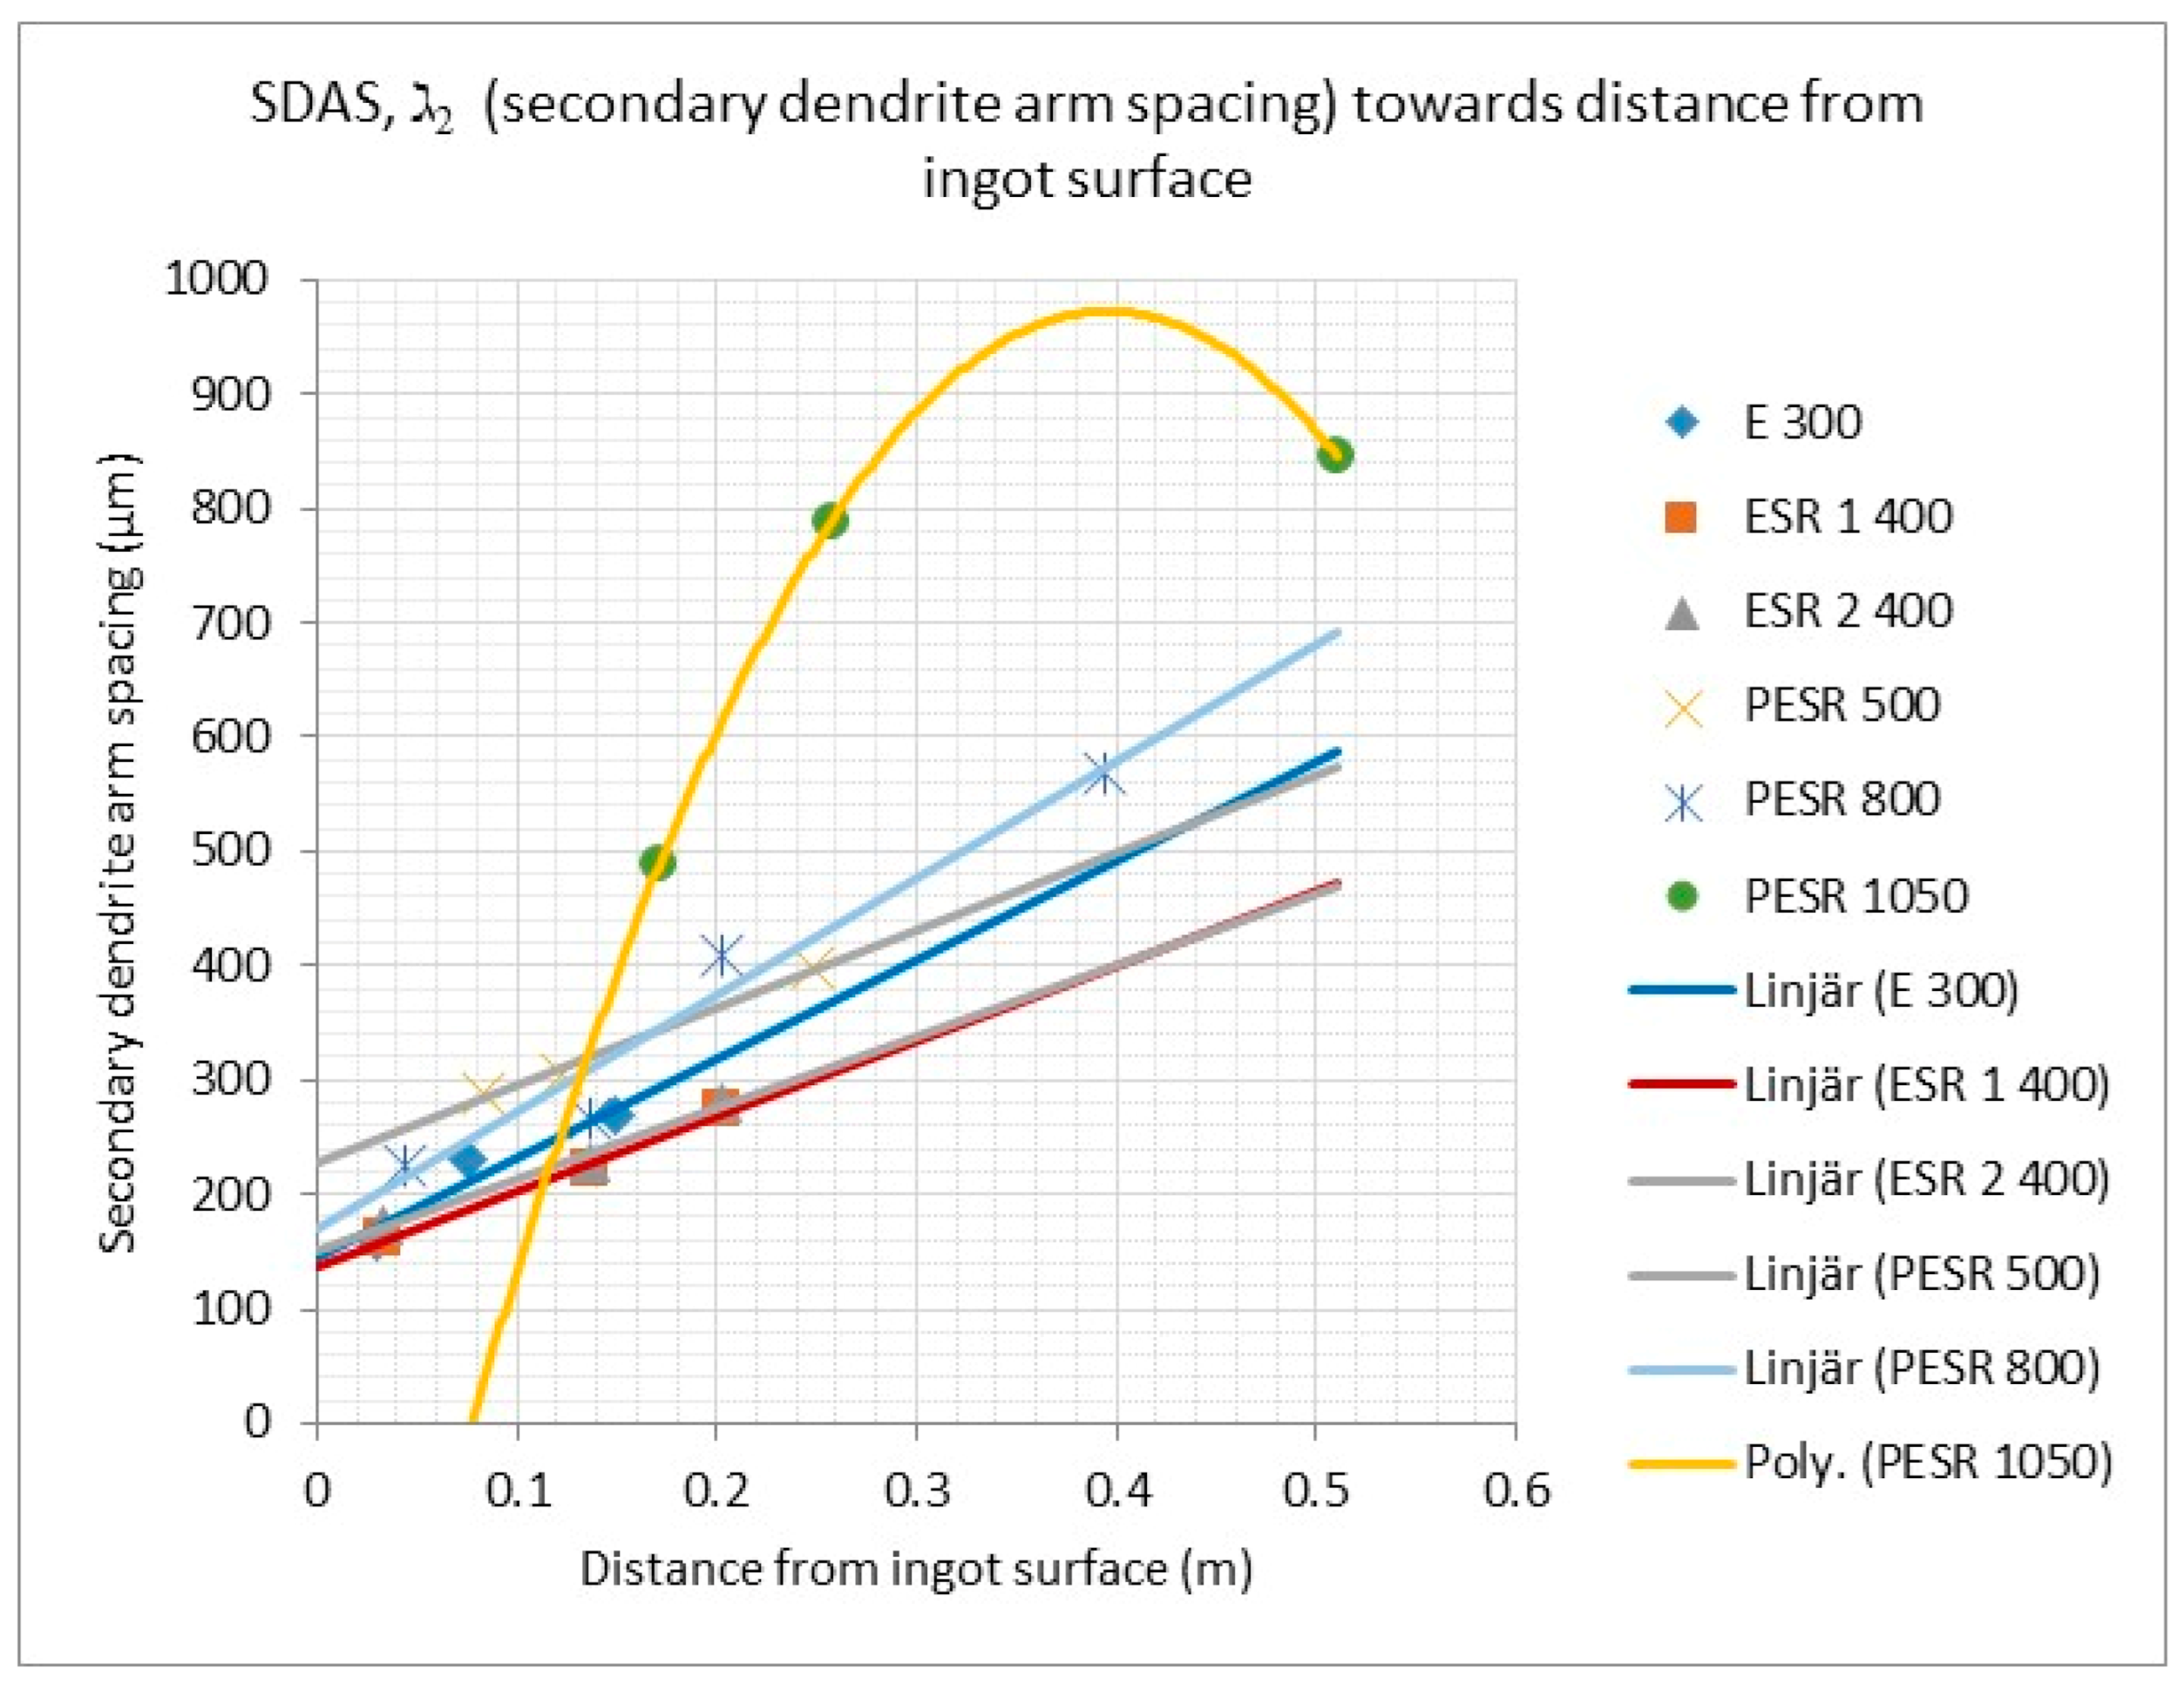
Figure 7.
Secondary dendrite arm spacing, (SDAS, ℷ2), per distance from surface for different ingot 300 × 300 mm2 (CE-300), the electro-slag remelted ingots 400 × 400 mm2 (ESR-400 1,2), and the pressure electro-slag remelted ingots 500–1050 mm in diameter (PESR-500, PESR-800, and PESR-1050).
Figure 8.
(a) Angle between the dendrite arms and the axial plane at position T/2 on the pressure electro-slag remelted 800 mm in diameter ingot (PESR-800). (b) The angle between the dendrite arms and the axial plane was not determined at position T/2 on the pressure electro-slag remelted (PESR) 1050 mm in diameter ingot.
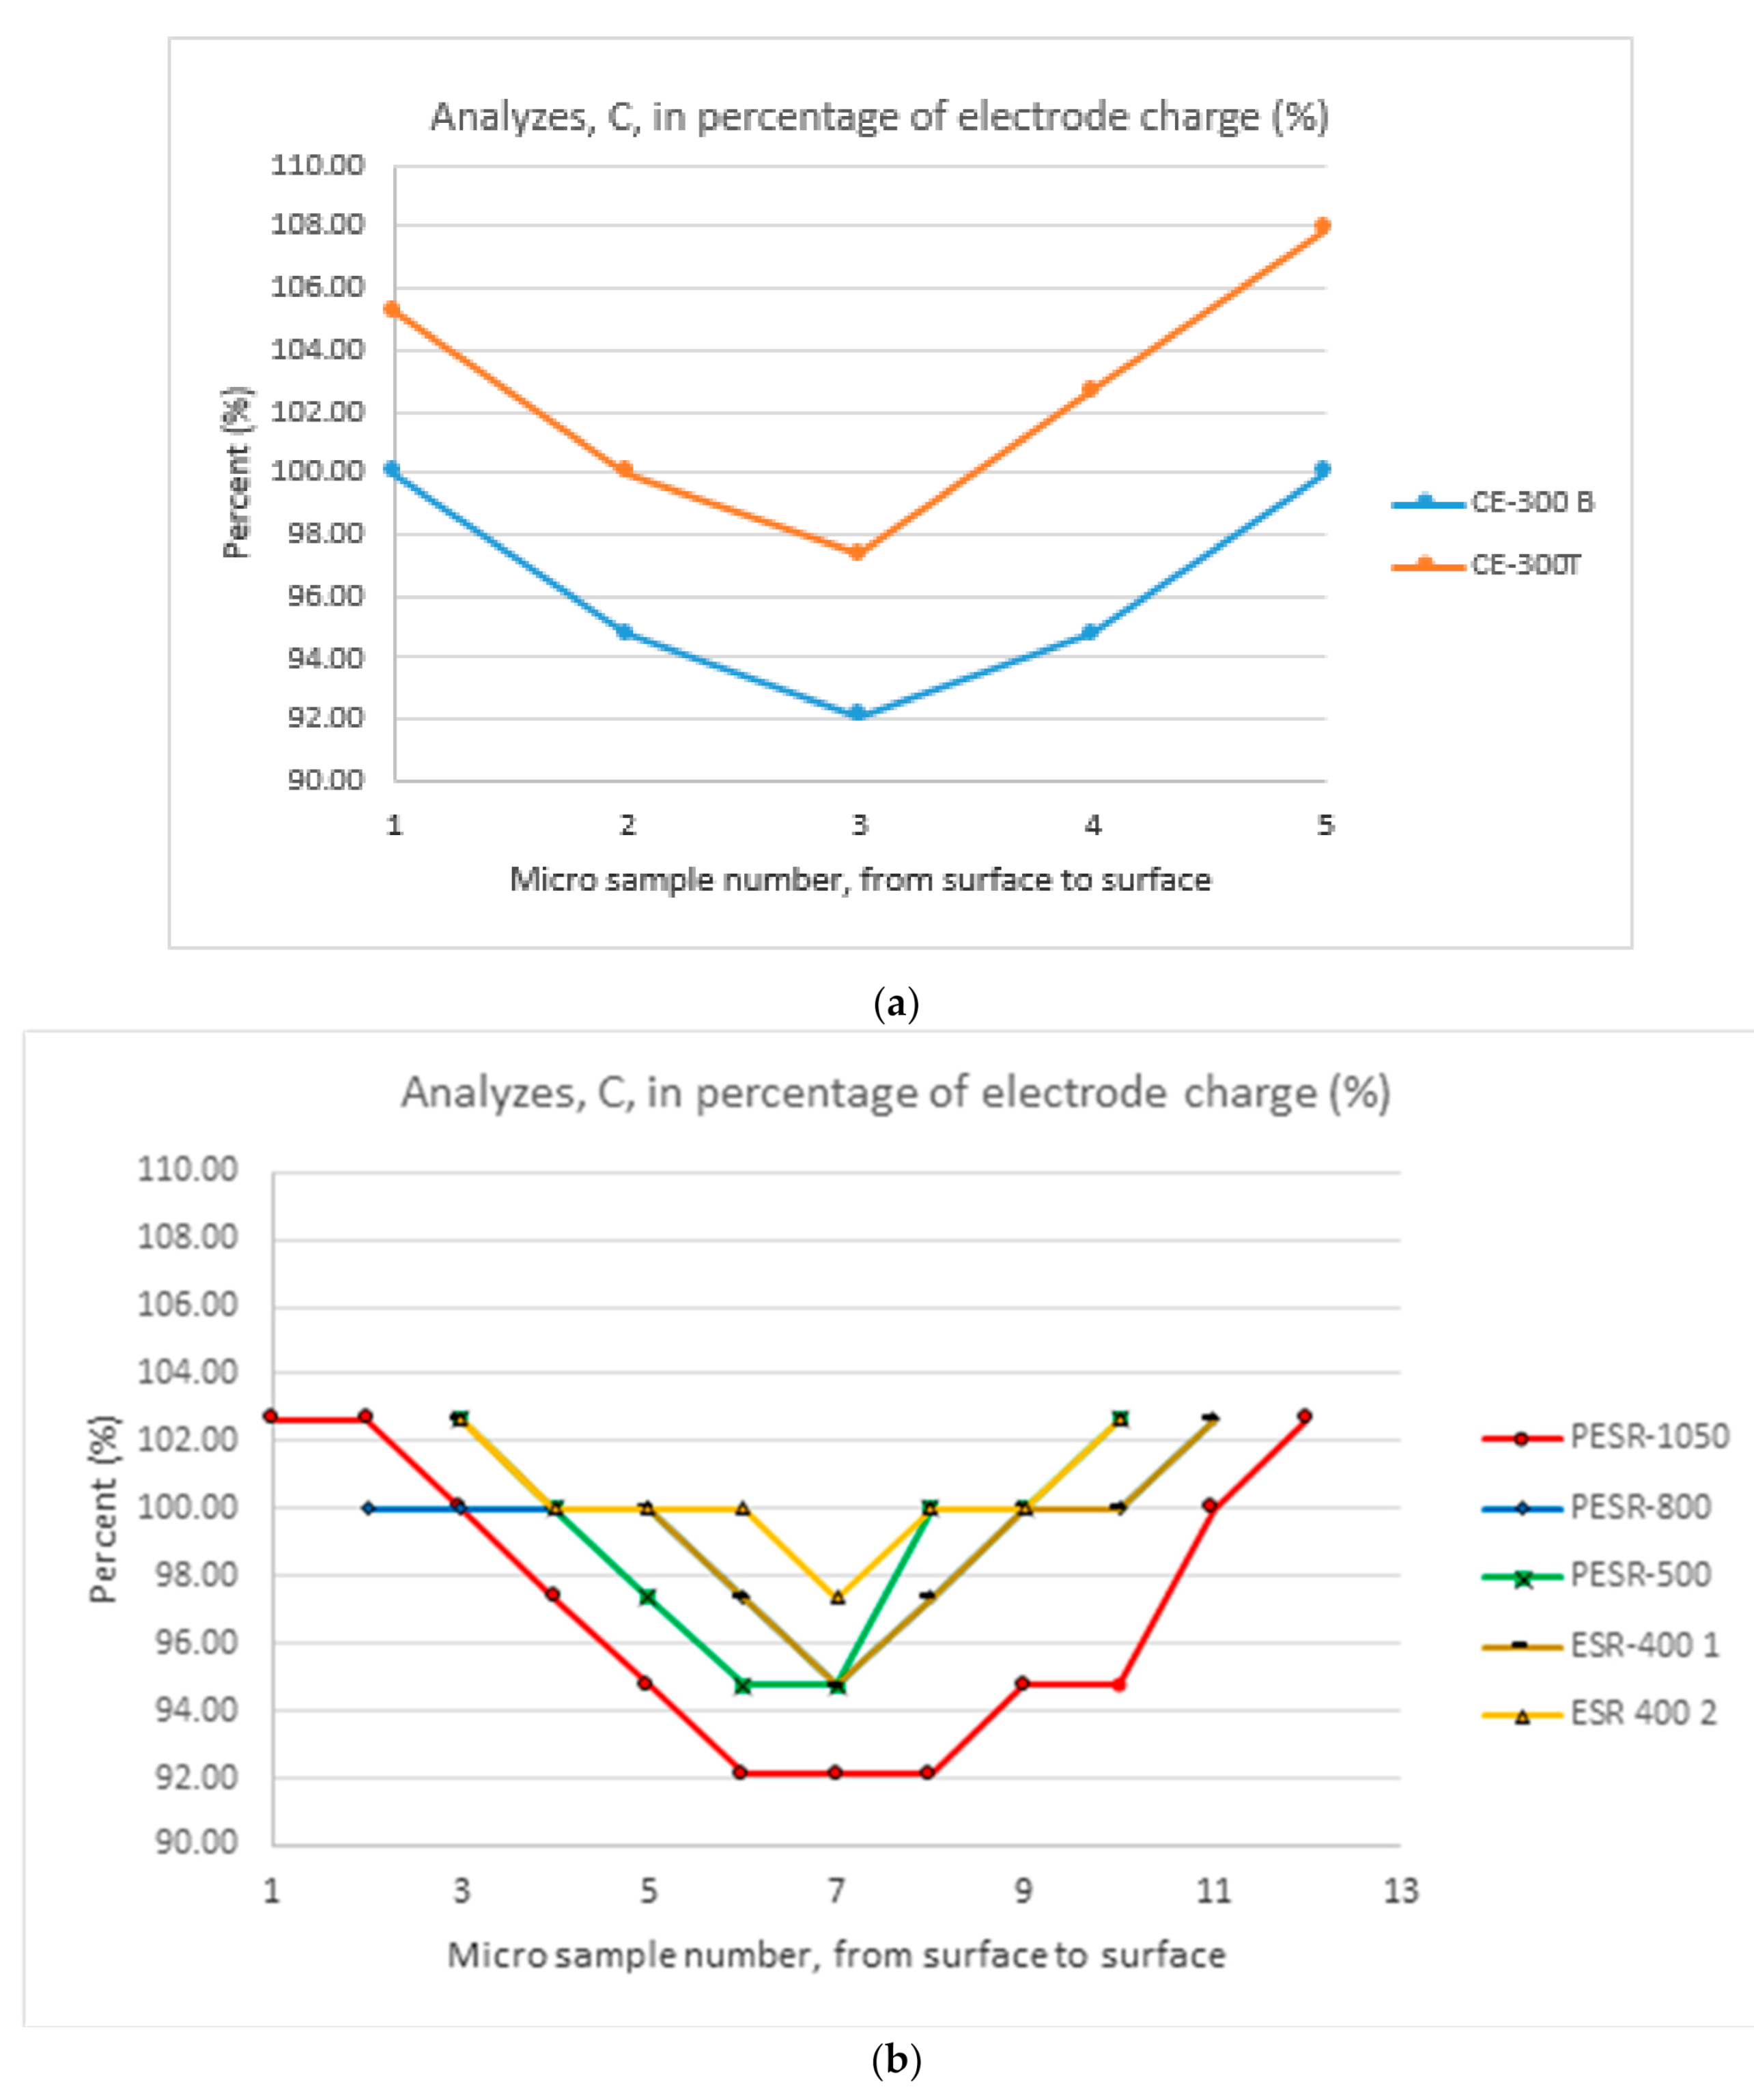
Figure 9.
(a) The deviations between the amount of carbon (C) at bottom (B) and top (T) of the electrode 300 × 300 mm2 (C-300) and the corresponding electrode charge. (b) The deviations between the amount of carbon (C) in the ingots and their corresponding electrode charges. Electro-slag remelted ingot 400 × 400 mm2 and pressure electro-slag remelted ingots 500–1050 mm in diameter (PESR-500, PESR-800, and PESR-1050).
Figure 10.
Number of oxide inclusions per mm2 and ingot size and from the electrode and the processed material from the ingots (after approximately a 75% reduction) at different axial positions. Electro-slag remelted ingot 400 × 400 mm2 (ESR-400) and pressure electro-slag remelted ingots 500–1050 mm in diameter (PESR-500, PESR-650, PESR-800, and PESR-1050) at bottom (B), middle (M), and top (T) positions. No inclusions > 44.8 µm were detected in the processed material.
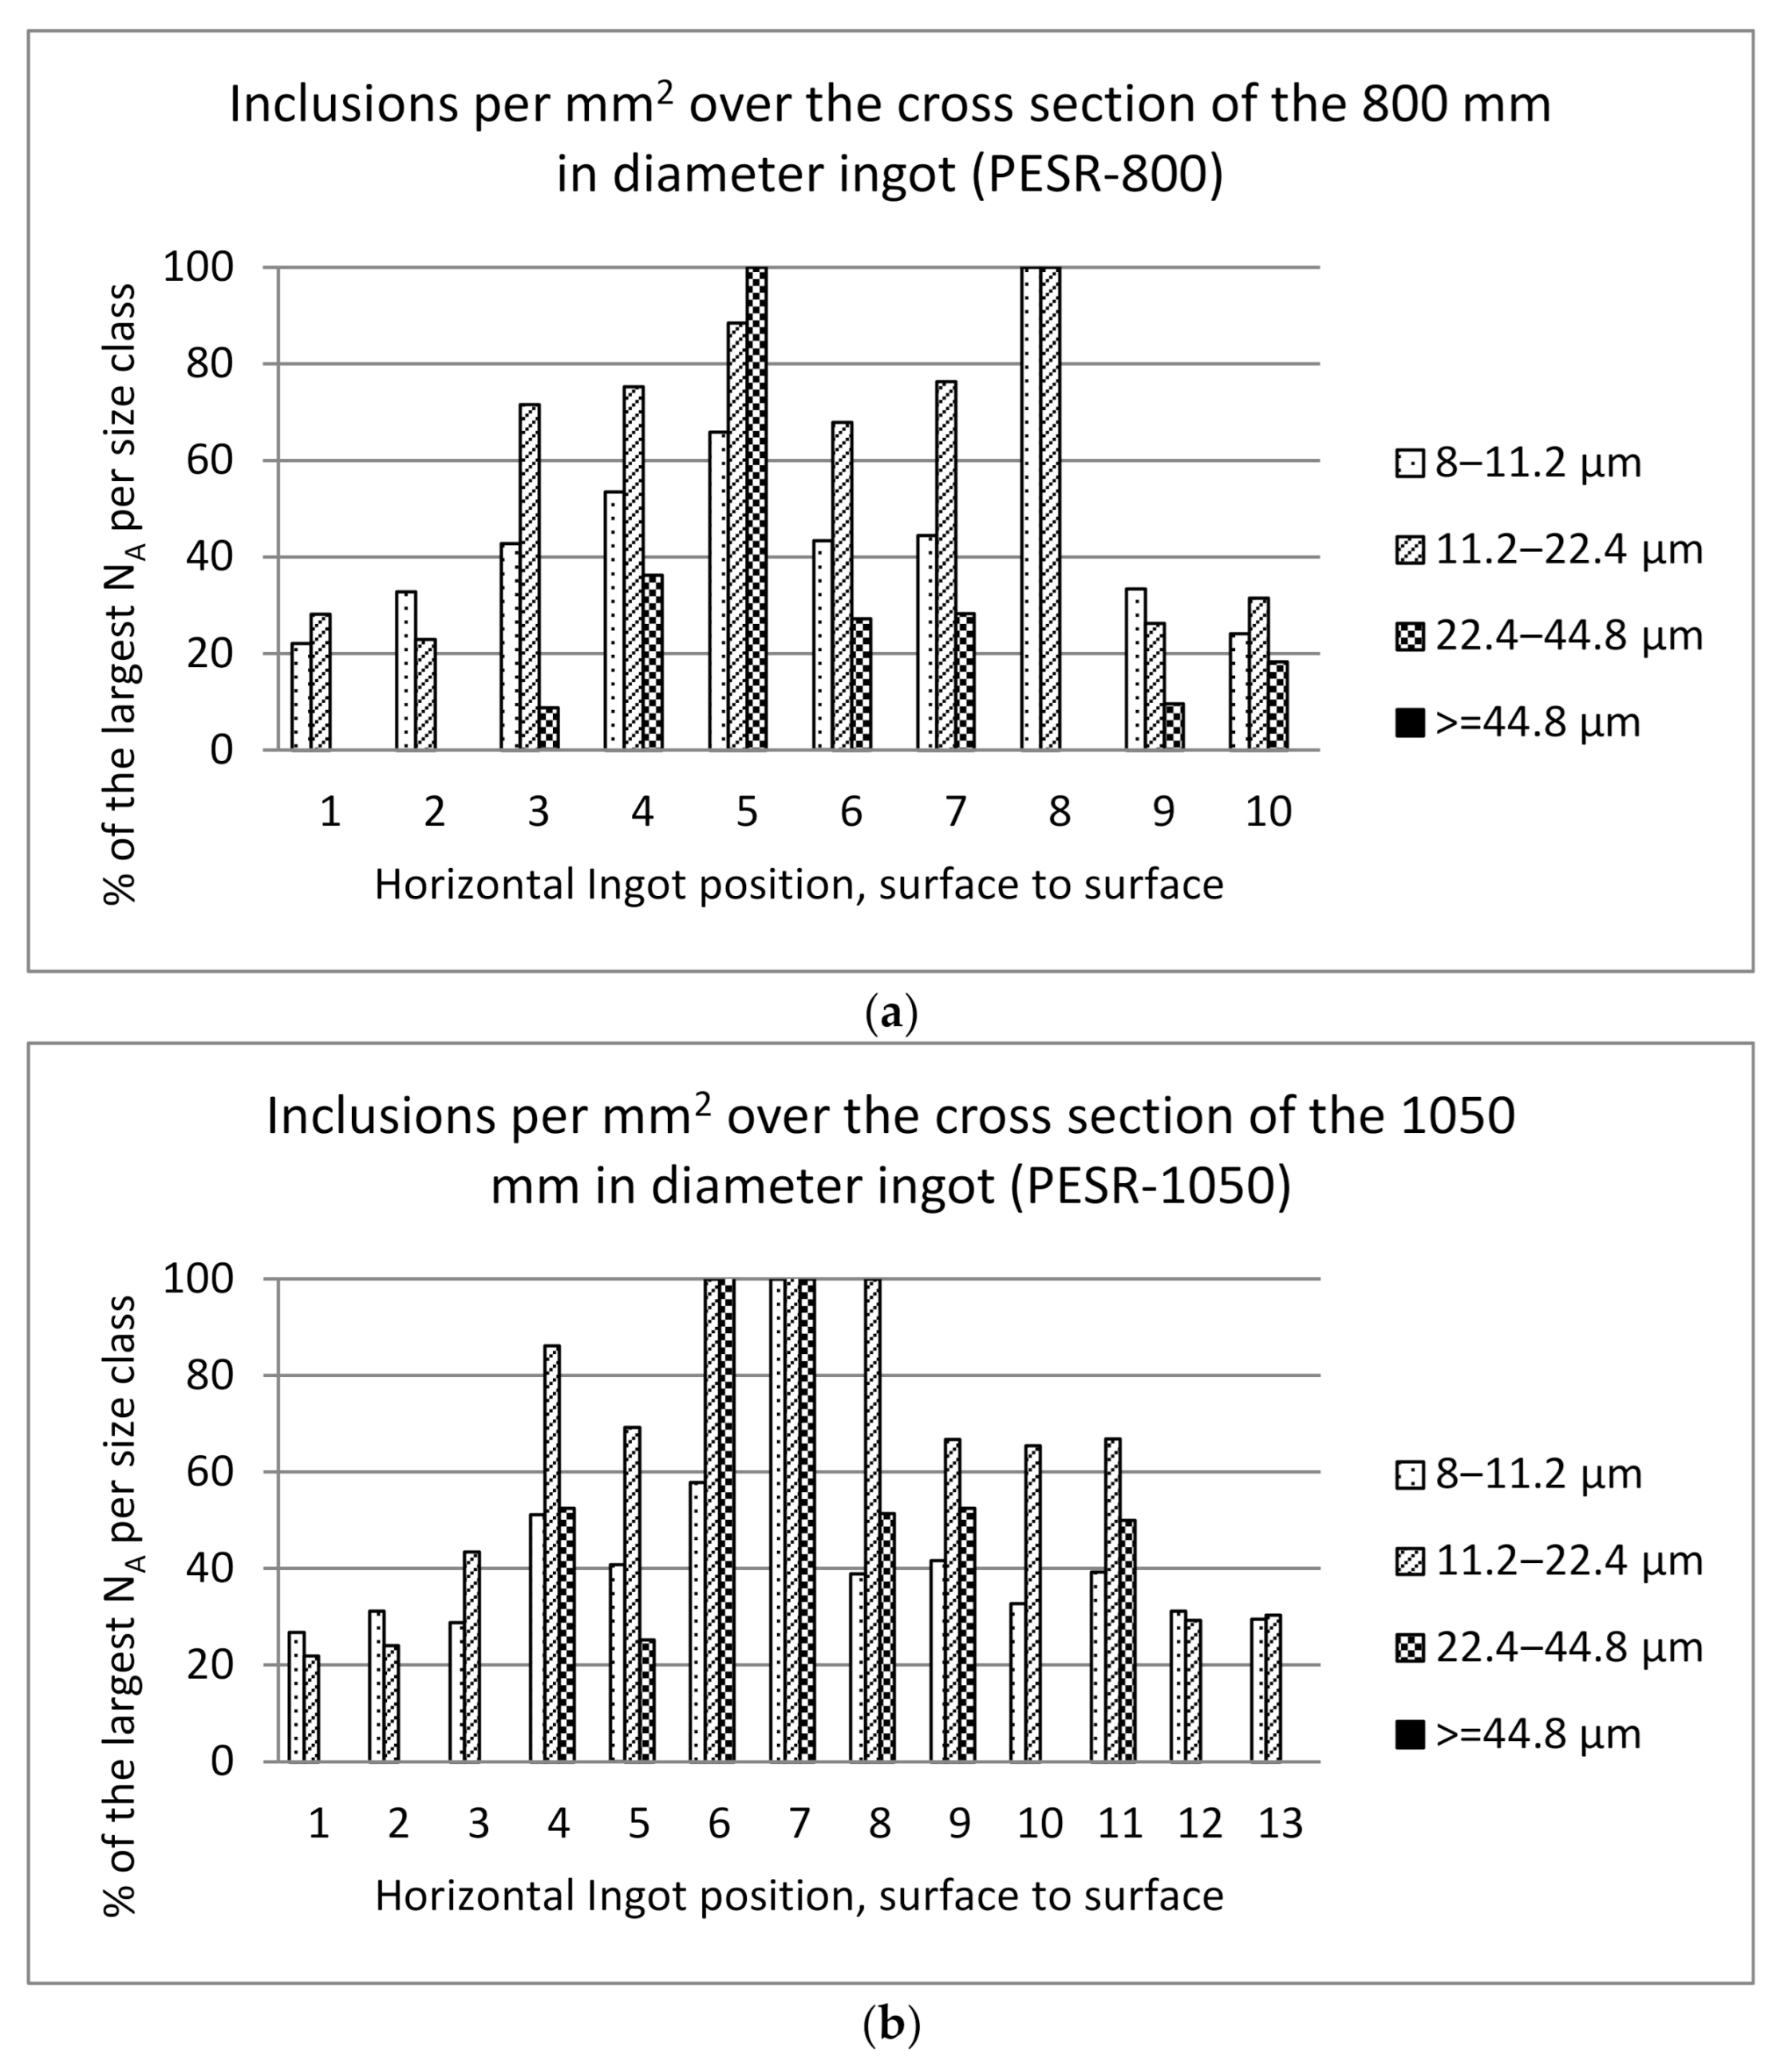
Figure 11.
Inclusion measurement over the cross-sections for the pressure electro-slag remelted (a) 800 mm diameter (PESR-800) and (b) 1050 mm diameter (PESR-1050) unprocessed ingots. No inclusions > 44.8 µm were detected.
Figure 12.
Growth rate towards distance from ingot surface. Equation (1) is just valid for columnar dendritic growth, the nonlinear connection for the pressure electro-slag remelted 1050 mm in diameter ingot (PESR-1050) indicates that it solidifies equiaxial in the center.
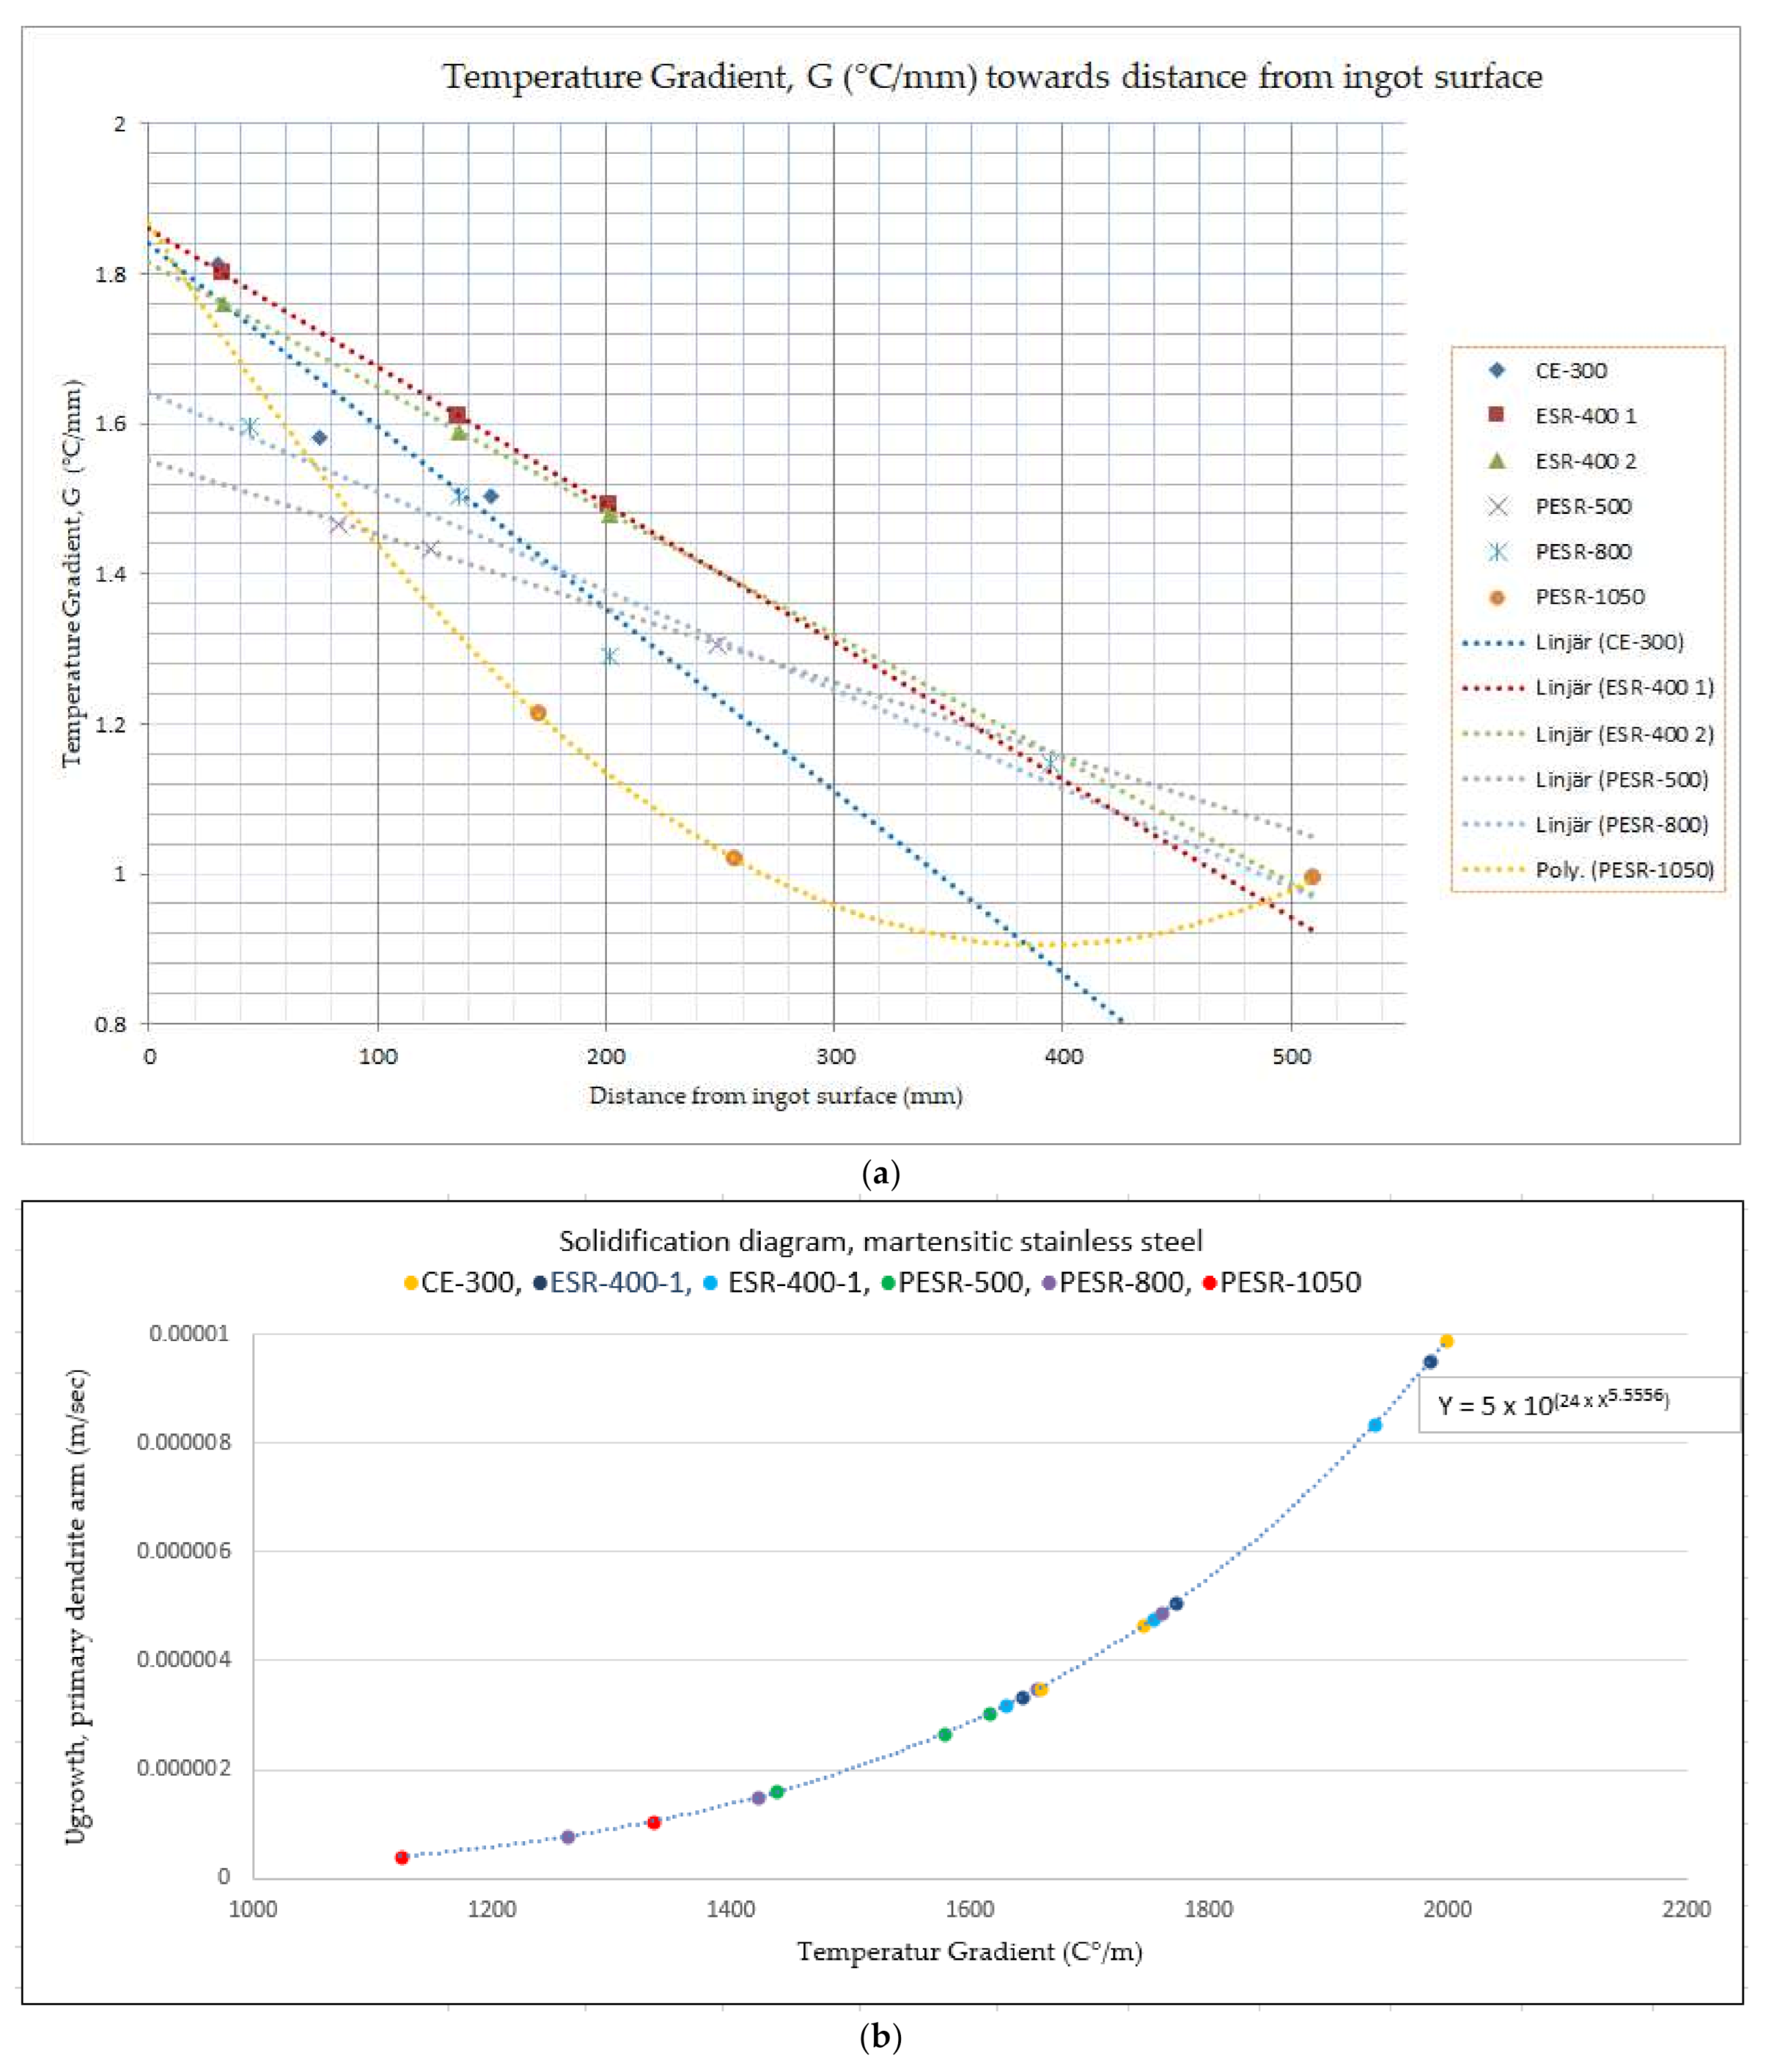
Figure 13.
(a) Temperature gradient, G (°C/mm), towards distance from ingot surface. Equation (1) (which also is used to calculate the temperature gradient) is just valid for columnar dendritic growth, the nonlinear connection for the pressure electro-slag remelted 1050 mm in diameter ingot (PESR-1050) indicates that it solidifies equiaxial in the center. (b) Growth rate, Ʋgrowth (m/s), towards temperature gradient, G (°C/m).
Figure 14.
Growth rate Ʋ
growth (m/s) (calculated on primary dendrite arm spacings) versus the temperature gradient G (°C/m) around the solid/liquid tip. The black line is plotted data from Kurz solidification diagram [
40]. The area above the line solidifies in an equiaxial manner and the area below solidifies in a columnar-dendritic manner [
40]. Data from Uddeholms martensitic stainless steel are included, the electrode 300 × 300 mm
2, (CE-300), the electro-slag remelted ingots 400 × 400 mm
2, (ESR-400), and the pressure electro-slag remelted ingots 500–1050 mm in diameter, (PESR-500, PESR-800, and PESR-1050). All data are from the center position of the ingots. The electrode and the PESR-1050, which solidify equiaxial dendritic in the center, are marked (●), because the equations used are not valid for the equiaxial solidification structure.
Figure 15.
Number of oxide inclusions per mm2, for different ingot sizes from rolled/forged and heat-treated material. No inclusions > 44.8 µm were detected.
Table 1.
Previous studies on inclusions in electro-slag remelting (ESR) or electro-slag remelting under protective pressure-controlled atmosphere (PESR) remelted.
| Year | Author | Steel | Scale | Diameter/Width | Inclusions Size | Ref. |
|---|
| 1971 | D.A.R. Kay et al. | N.A. | N.A. | N.A. | N.A. | [1] |
| 1980 | Z.B. Li et al. | N.A. | N.A. | N.A. | N.A. | [2] |
| 2012 | C.-B. SHI et al. | NAK80 die steel | N.A. | N.A. | N.A. | [3] |
| 2012 | C.-B. SHI et al. | Die steel | Laboratory | N.A. | N.A. | [4] |
| 2012 | C.-B. SHI et al. | High-al steel | N.A. | N.A. | <5 µm | [5] |
| 2012 | X.C. Chen et al. | Inconel 718 | N.A. | N.A. | CN 5–15 µm | [6]] |
| 1969 | B.C. Burel | steel, iron | Laboratory | Mould 77 mm | <15 µm | [7] |
| 1974 | A. Mitchell et al. | oxygen containing iron, iron-OFHC copper | Laboratory | Mould 76.2 mm | 1–5 µm | [8] |
| 1976 | J.C.F. Chan et al. | Stainless steel | Laboratory | Electrode 35 mm | N.A. | [9] |
| 2013 | C.-B. SHI et al. | Die steel, superallloys | Laboratory | N.A. | N.A. | [10] |
| 2013 | Y. Dong et al. | Cold rolls steel MC5 | Laboratory 800 g | N.A. | N.A. | [11] |
| 2014 | Y.-W. Dong et al. | Die steel CR-5A | Laboratory 800 g | N.A. | N.A. | [12] |
| 2013 | C.-B. SHI et al. | H13 die steel | Laboratory, 50 kg | Electrcode 90 mm | abt 2 µm | [13] |
| 2015 | R. Scheinder et al. | Hot work steel abt H11 | Pilot | Electrode 101.5 mm | N.A. | [14] |
| 2016 | C.-B. SHI et al. | High-Carbon 17% Cr Tool Steel | Pilot | PESR mould 170 mm | abt 5 µm | [15] |
| 2017 | G. Du et al. | H13 die steel | Pilot | ESR mould 300 mm | 0–15 µm, >15 µm | [16] |
| 2014 | L.Z. Cang et al. | N.A. | Pilot 15 kg | Mould abt 105 mm | [17] |
| 2019 | C.-B SHI et al. | Si-Mn killed steel ≈ H13 | Pilot | PESR 95 mm | 1–3 µm, few > 3 µm | [18] |
| 2013 | G. Reiter et al. | abt H11, H13 die steel, martensitic Cr-Ni steel | Industrial | N.A. | ASTM E45 Heavy | [19] |
| 2014 | E.S. Persson et al. | Martensitic stainless steel | Industrial | Moulds 400–1050 mm | 8–30 µm | [20] |
| 2016 | E.S. Persson et al. | Martensitic stainless steel | Industrial | Moulds 400–1050 mm | N.A. | [21] |
| 2017 | H. Wang et al. | H13 die steel | Laboratory | Electrode 25 mm | abt 1–2 µm | [22] |
| 2017 | E.S. Persson et al. | Martensitic stainless steel | Industrial | Moulds 400–500 mm | 8–45 µm | [23] |
| 2017 | E.S. Persson et al. | Martensitic stainless steel | Industrial | ESR mould 300 mm | 8–20 µm | [24] |
| 2018 | E.S. Persson et al. | Martensitic stainless steel | Industrial | ESR mould 300 mm | 8–20 µm | [25] |
| 2020 | E.S. Persson et al. | Martensitic stainless steel | Industrial | ESR mould ca 500 mm | 8–22.4 µm | [26] |
Table 2.
Secondary dendrite arm spacing (SDAS, ℷ2) per distance from the surface for the electrode 300 × 300 mm2 (CE-300), the electro-slag remelted ingots 400 × 400 mm2 (ESR-400 1,2), and the pressure electro-slag remelted ingots with 500–1050 mm diameter (PESR-500, PESR-800, and PESR-1050).
| Distance from Surface (mm) | SDAS, ℷ2 (µm) per Electrode and Ingot Type (mm) | |
|---|
| | CE-300 | ESR-400 1 | ESR-400 2 | PESR-500 | PESR-800 | PESR-1050 |
|---|
| 0 | | | | | | |
| 30 | 159 | | | | | |
| 33 | | 162 | 173 | | | |
| 44 | | | | | 226 | |
| 83 | | | | 287 | | |
| 75 | 232 | | | | | |
| 136 | | 222 | 229 | | 267 | |
| 123 | | | | 306 | | |
| 150 | 268 | | | | | |
| 171 | | | | | | 488 |
| 202 | | 274 | 280 | | 409 | |
| 249 | | | | 397 | | |
| 257 | | | | | | 788 |
| 395 | | | | | 569 | |
| 510 | | | | | | 847 |
| R2 linjär | 0.8907 | 0.9929 | 0.9903 | 0.995 | 0.9591 | 0.6368 |
| R2 polynom | | | | | | 1 |
Table 3.
Data and statistics for the secondary arm spacing, (SDAS, ℷ2), measurements for electrode 300 × 300 mm2 (CE-300), the electro-slag remelted ingots 400 × 400 mm2 (ESR-400 1,2), and the pressure electro-slag remelted ingots 500–1050 mm in diameter (PESR-500, PESR-800, and PESR-1050).
| Electrode/Ingot | Position | SDAS, ℷ2 (µm) | Stdev (µm) | 95% CI (µm) | % RA (%) | Measurements (no) |
|---|
| CE-300 | Near corner | 159 | 38 | 8 | 5 | 88 |
| | T/4 | 232 | 61 | 13 | 5 | 90 |
| | T/2 | 268 | 65 | 13 | 5 | 89 |
| ESR-400 1 | Near corner | 162 | 55 | 11 | 7 | 88 |
| | T/4 | 222 | 66 | 14 | 6 | 91 |
| | T/2 | 276 | 70 | 15 | 5 | 88 |
| ESR-400 2 | Near corner | 173 | 47 | 10 | 6 | 82 |
| | T/4 | 229 | 68 | 14 | 6 | 88 |
| | T/2 | 280 | 70 | 15 | 5 | 81 |
| PESR-500 | T/6 | 287 | 74 | 17 | 6 | 70 |
| | T/4 | 306 | 104 | 24 | 7.8 | 73 |
| | T/2 | 397 | 124 | 27 | 6.8 | 82 |
| PESR-800 | Surface | 226 | 62 | 14 | 6 | 76 |
| | T/6 | 267 | 75 | 17 | 6 | 76 |
| | T/4 | 409 | 148 | 30 | 7 | 91 |
| | T/2 | 569 | 199 | 42 | 7 | 85 |
| PESR-1050 | T/6 | 488 | 142 | 28 | 5.7 | 101 |
| | T/4 | 788 | 218 | 44 | 5.6 | 94 |
| | T/2 | 847 | 213 | 41 | 4.9 | 101 |
Table 4.
Data and statistics for the angle between the dendrite arms and the axial plane. Electrode 300 × 300 mm2 (CE-300), the electro-slag remelted ingots 400 × 400 mm2 (ESR-400 1,2), and the pressure electro-slag remelted ingots 500–1050 mm in diameter (PESR-500, PESR-800, and PESR-1050).
| Electrode | Position | Angle 1 (°) | Angle 2 (°) | Angle 3 (°) | Angle 4 (°) | Average (°) |
|---|
| PESR-500 | Surface | 52.4 | | 57 | | 54.7 |
| | T/6 | 65.5 | | 66.1 | | 66 |
| | T/4 | 72.2 | | 71.8 | | 72 |
| | T/2 | 90 | | 90 | | 90 |
| PESR-800 | Surface | 45 | 51.7 | 58.5 | 52.2 | 51.9 |
| | T/6 | 69.8 | 72 | 65.5 | 73.3 | 70.2 |
| | T/4 | 60 | 58.4 | 54.3 | 65.1 | 59.5 |
| | T/2 | 90 | | | | 90 |
| | T/4 | 66.1 | 62.6 | 62.2 | 62.5 | 63.3 |
| | T/6 | 72.5 | 77.9 | 72.2 | 72.5 | 73.8 |
| | Surface | 44 | 39.5 | 40.6 | 40.2 | 41.1 |
| PESR-1050 | Surface | 38.2 | 45.6 | 51.8 | 58.8 | 48.6 |
| | T/6 | 73.7 | 73.9 | 65.4 | 67 | 70 |
| | T/4 | 65.8 | 72.6 | 72.5 | 68 | 69.7 |
| | T/2 | could not be determined | | |
Table 5.
Distance from ingot surface (mm) and growth rate, Ʋgrowth (m/s), per electrode 300 × 300 mm2 (CE-300), electro-slag remelted ingot (ESR-400), and pressure electro-slag remelted ingots 500–1050 mm in diameter (PESR-500, PESR-800, and PESR-1050.
| Ingot/Growth Rate Ʋgrowth (m/s) per Position | Surface | T/6 | T/4 | T/2 |
|---|
| CE-300 | | 3.96 × 10⁻⁵ | 1.86 × 10⁻⁵ | 1.39 × 10⁻⁵ |
| ESR-400 1 | | 3.81 × 10⁻⁵ | 2.03 × 10⁻⁵ | 1.33 × 10⁻⁵ |
| ESR-400 2 | | 3.34 × 10⁻⁵ | 1.91 × 10⁻⁵ | 1.28 × 10⁻⁵ |
| PESR-500 | | 1.21 × 10⁻⁵ | 1.07 × 10⁻⁵ | 6.34 × 10⁻⁶ |
| PESR-800 | 1.96 × 10⁻⁵ | 1.40 × 10⁻⁵ | 5.98 × 10⁻⁶ | 3.09 × 10⁻⁶ |
| PESR-1050 | | 4.20 × 10⁻⁶ | 1.61 × 10⁻⁶ | 1.39 × 10⁻⁶ |
Table 6.
Temperature gradient (°C/mm) and distance from surface (mm) for electrode 300 × 300 mm2 (CE-300), electro-slag remelted ingot 400 × 400 mm2 (ESR-400), and pressure electro-slag remelted ingots 500–1050 mm in diameter (PESR-500, PESR-800, and PESR-1050).
| Ingot/Temperature Gradient, G (°C/m) | Surface | T/6 | T/4 | T/2 |
|---|
| Electrode 300 mm # | | 1998.229 | 1744.105 | 1655.845 |
| ESR 1 400 mm # | | 1984.828 | 1771.99 | 1642.699 |
| ESR 2 400 mm # | | 1938.437 | 1752.296 | 1629.939 |
| PESR 500 mm Ø | | 1615.514 | 1578.66 | 1437.42 |
| PESR 800 mm Ø | 1760.6344 | 1658.075 | 1422.092 | 1262.722 |
| PESR 1050 mm Ø | | 1334.495 | 1123.049 | 1094.234 |


