
Adjustment of the Mechanical Properties of Mg2Nd and Mg2Yb by Optimizing Their Microstructures


Abstract
:1. Introduction
2. Materials and Methods
2.1. Material, Microstructure
2.2. In Situ Energy Dispersive Synchrotron X-Ray Diffraction
2.3. EPSC Modeling
3. Results
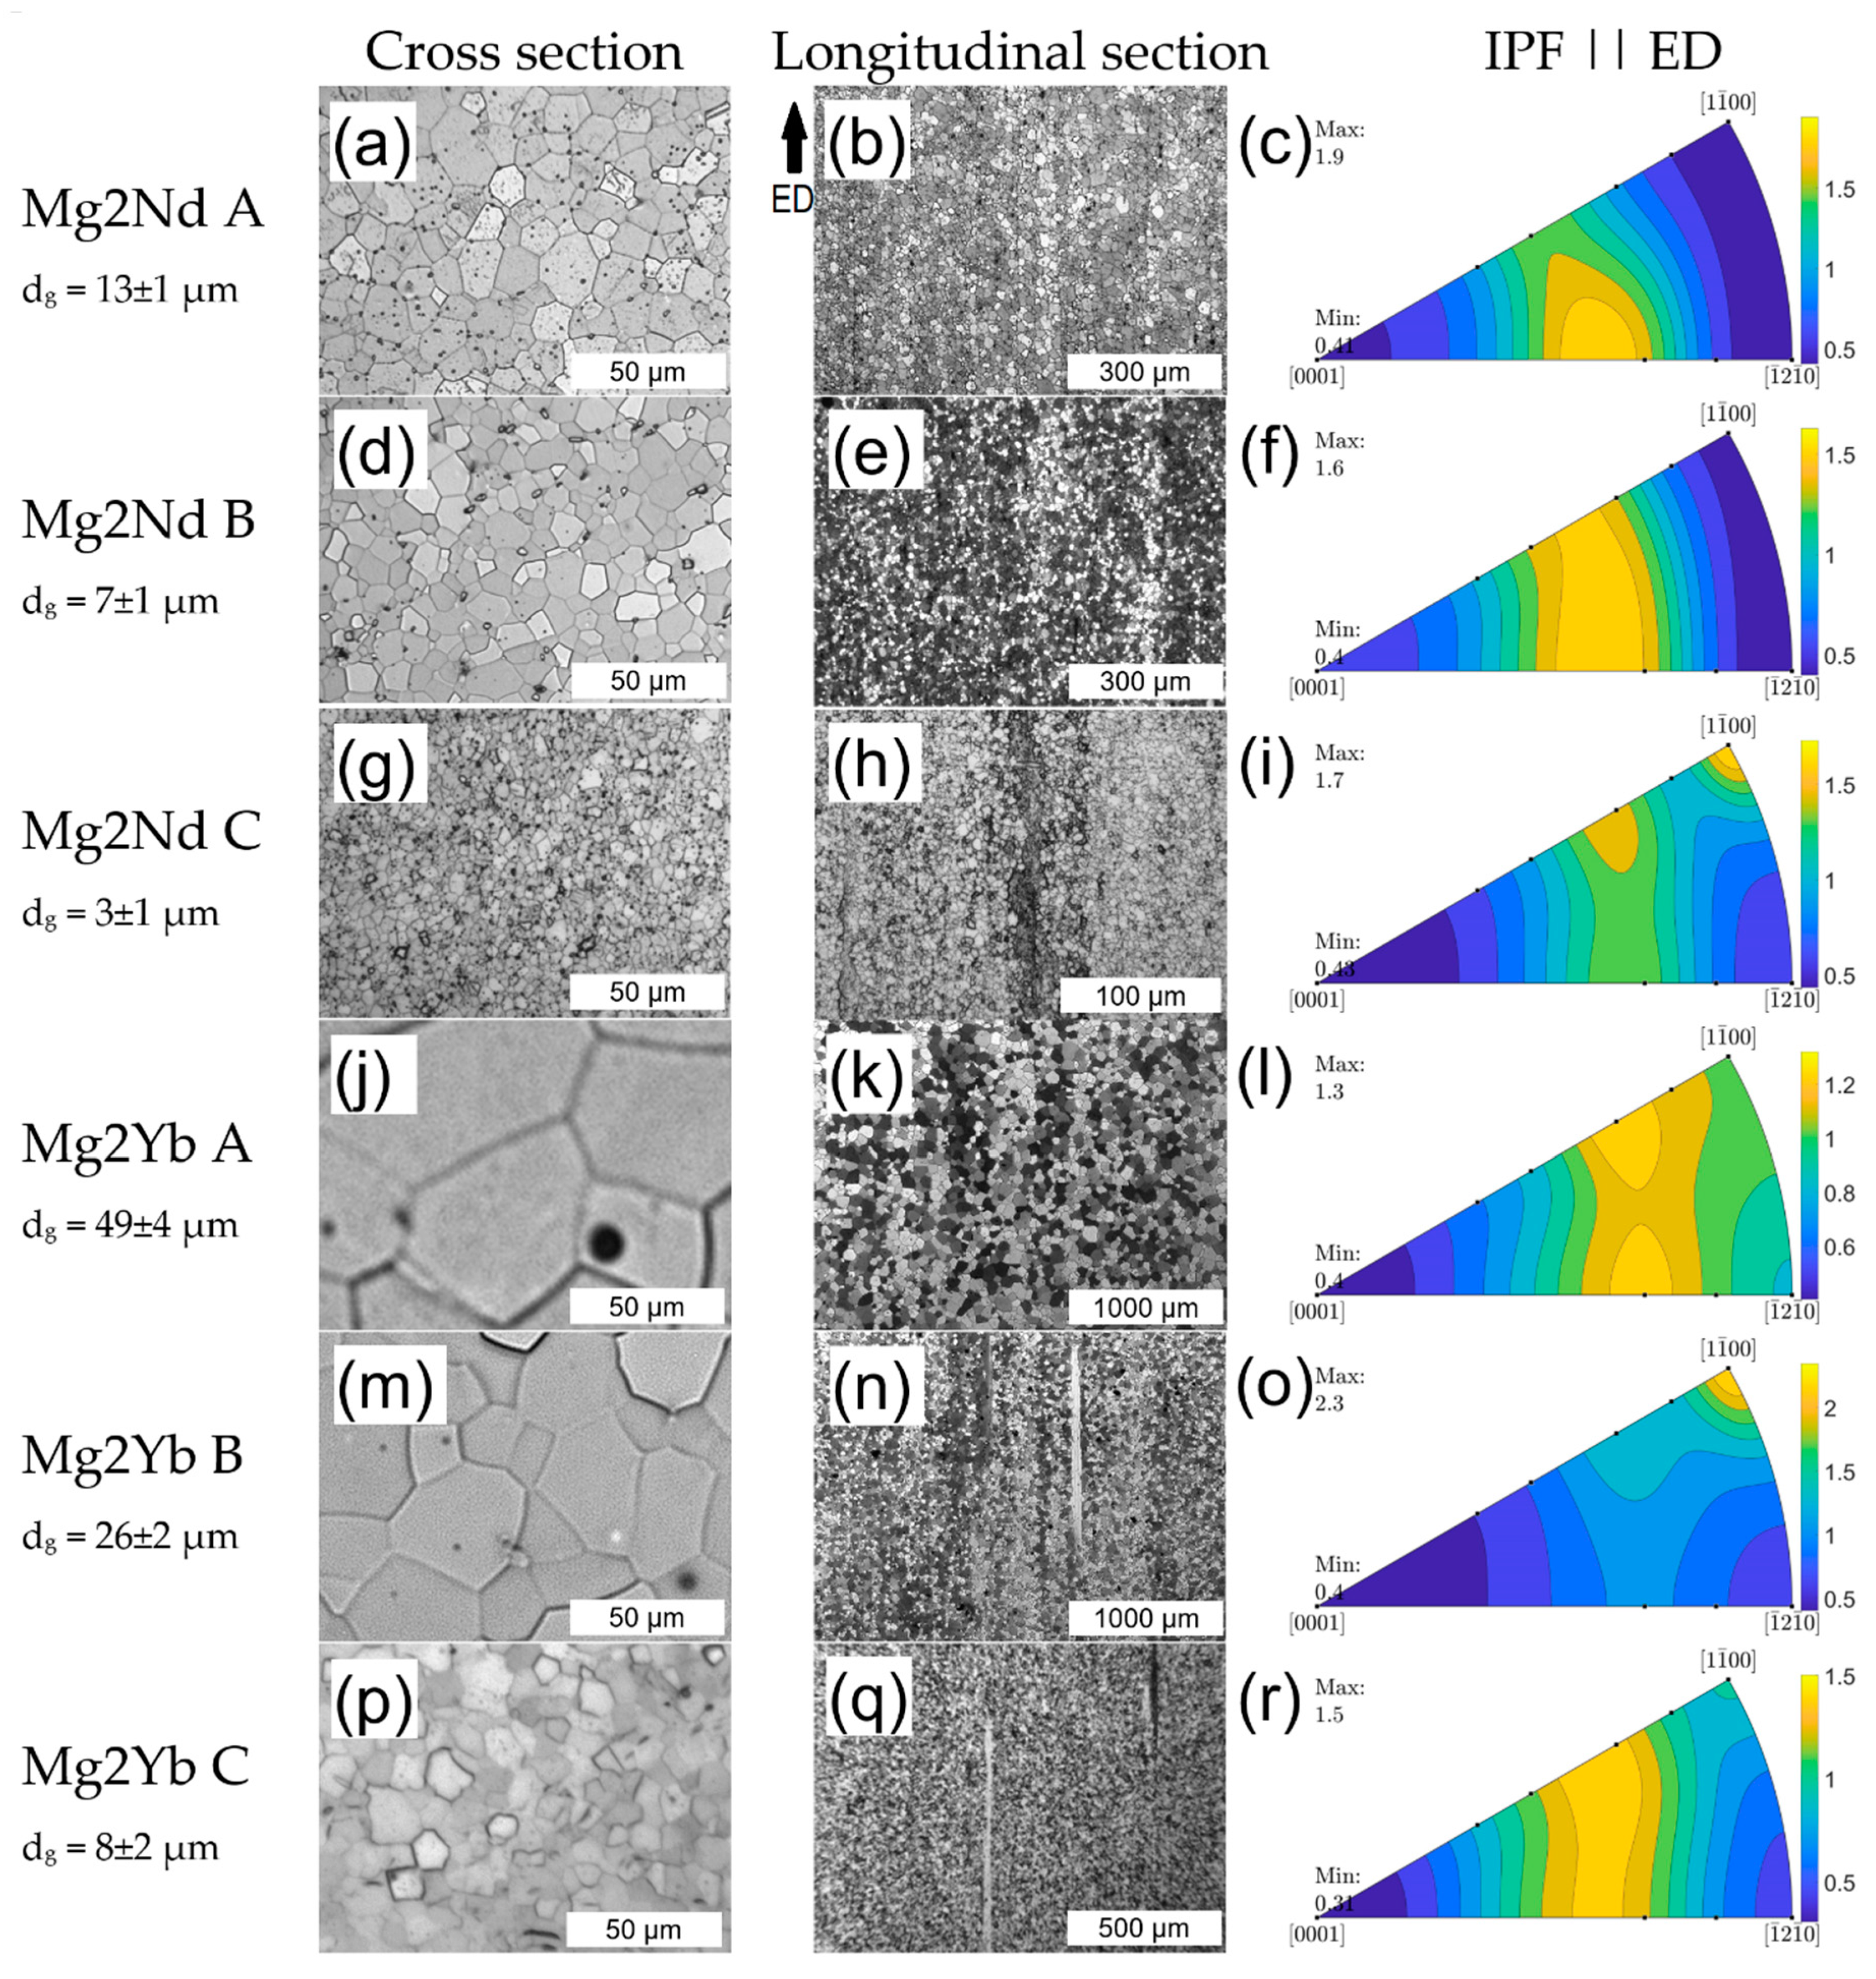
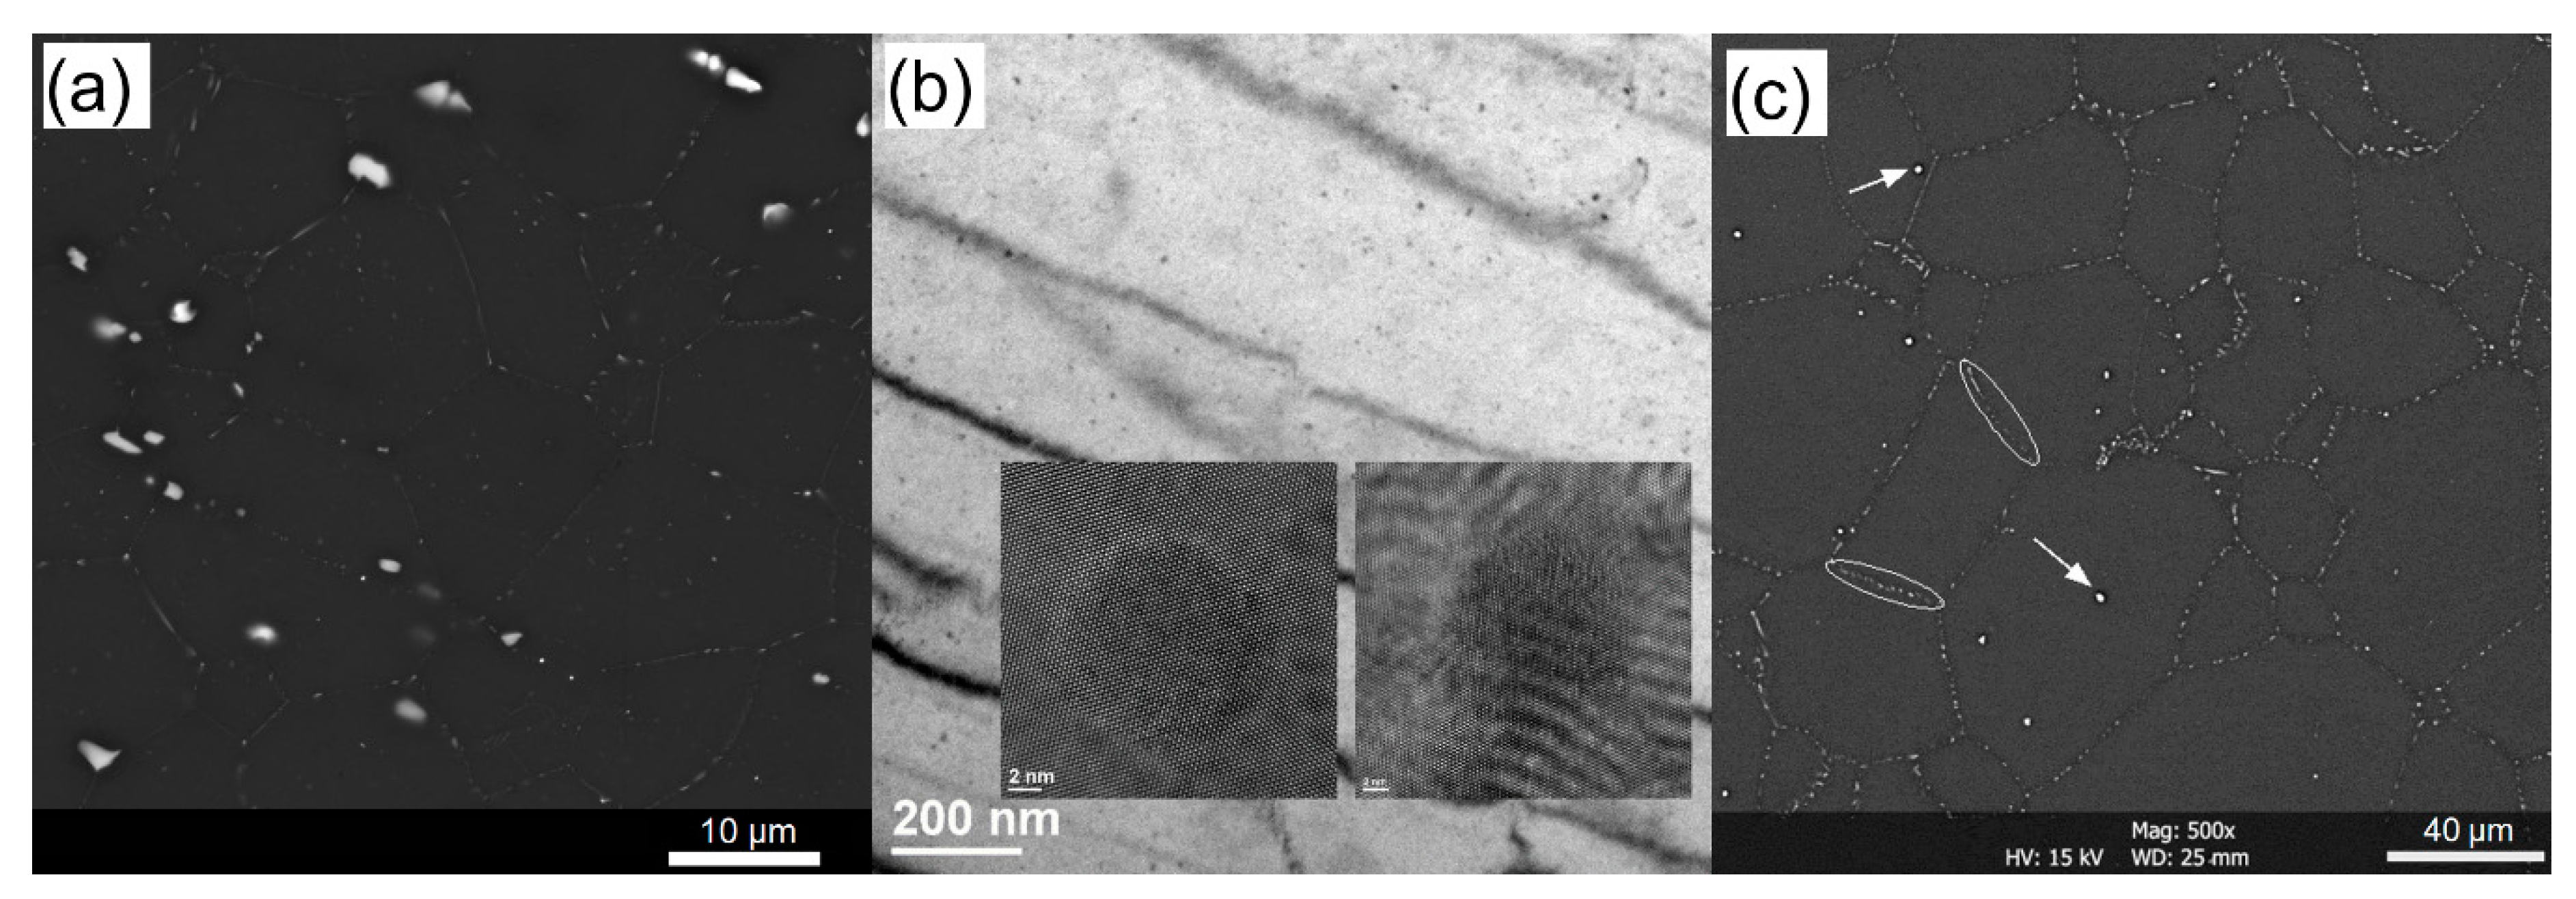
3.1. Microstructure
3.1.1. Mg2Nd
3.1.2. Mg2Yb
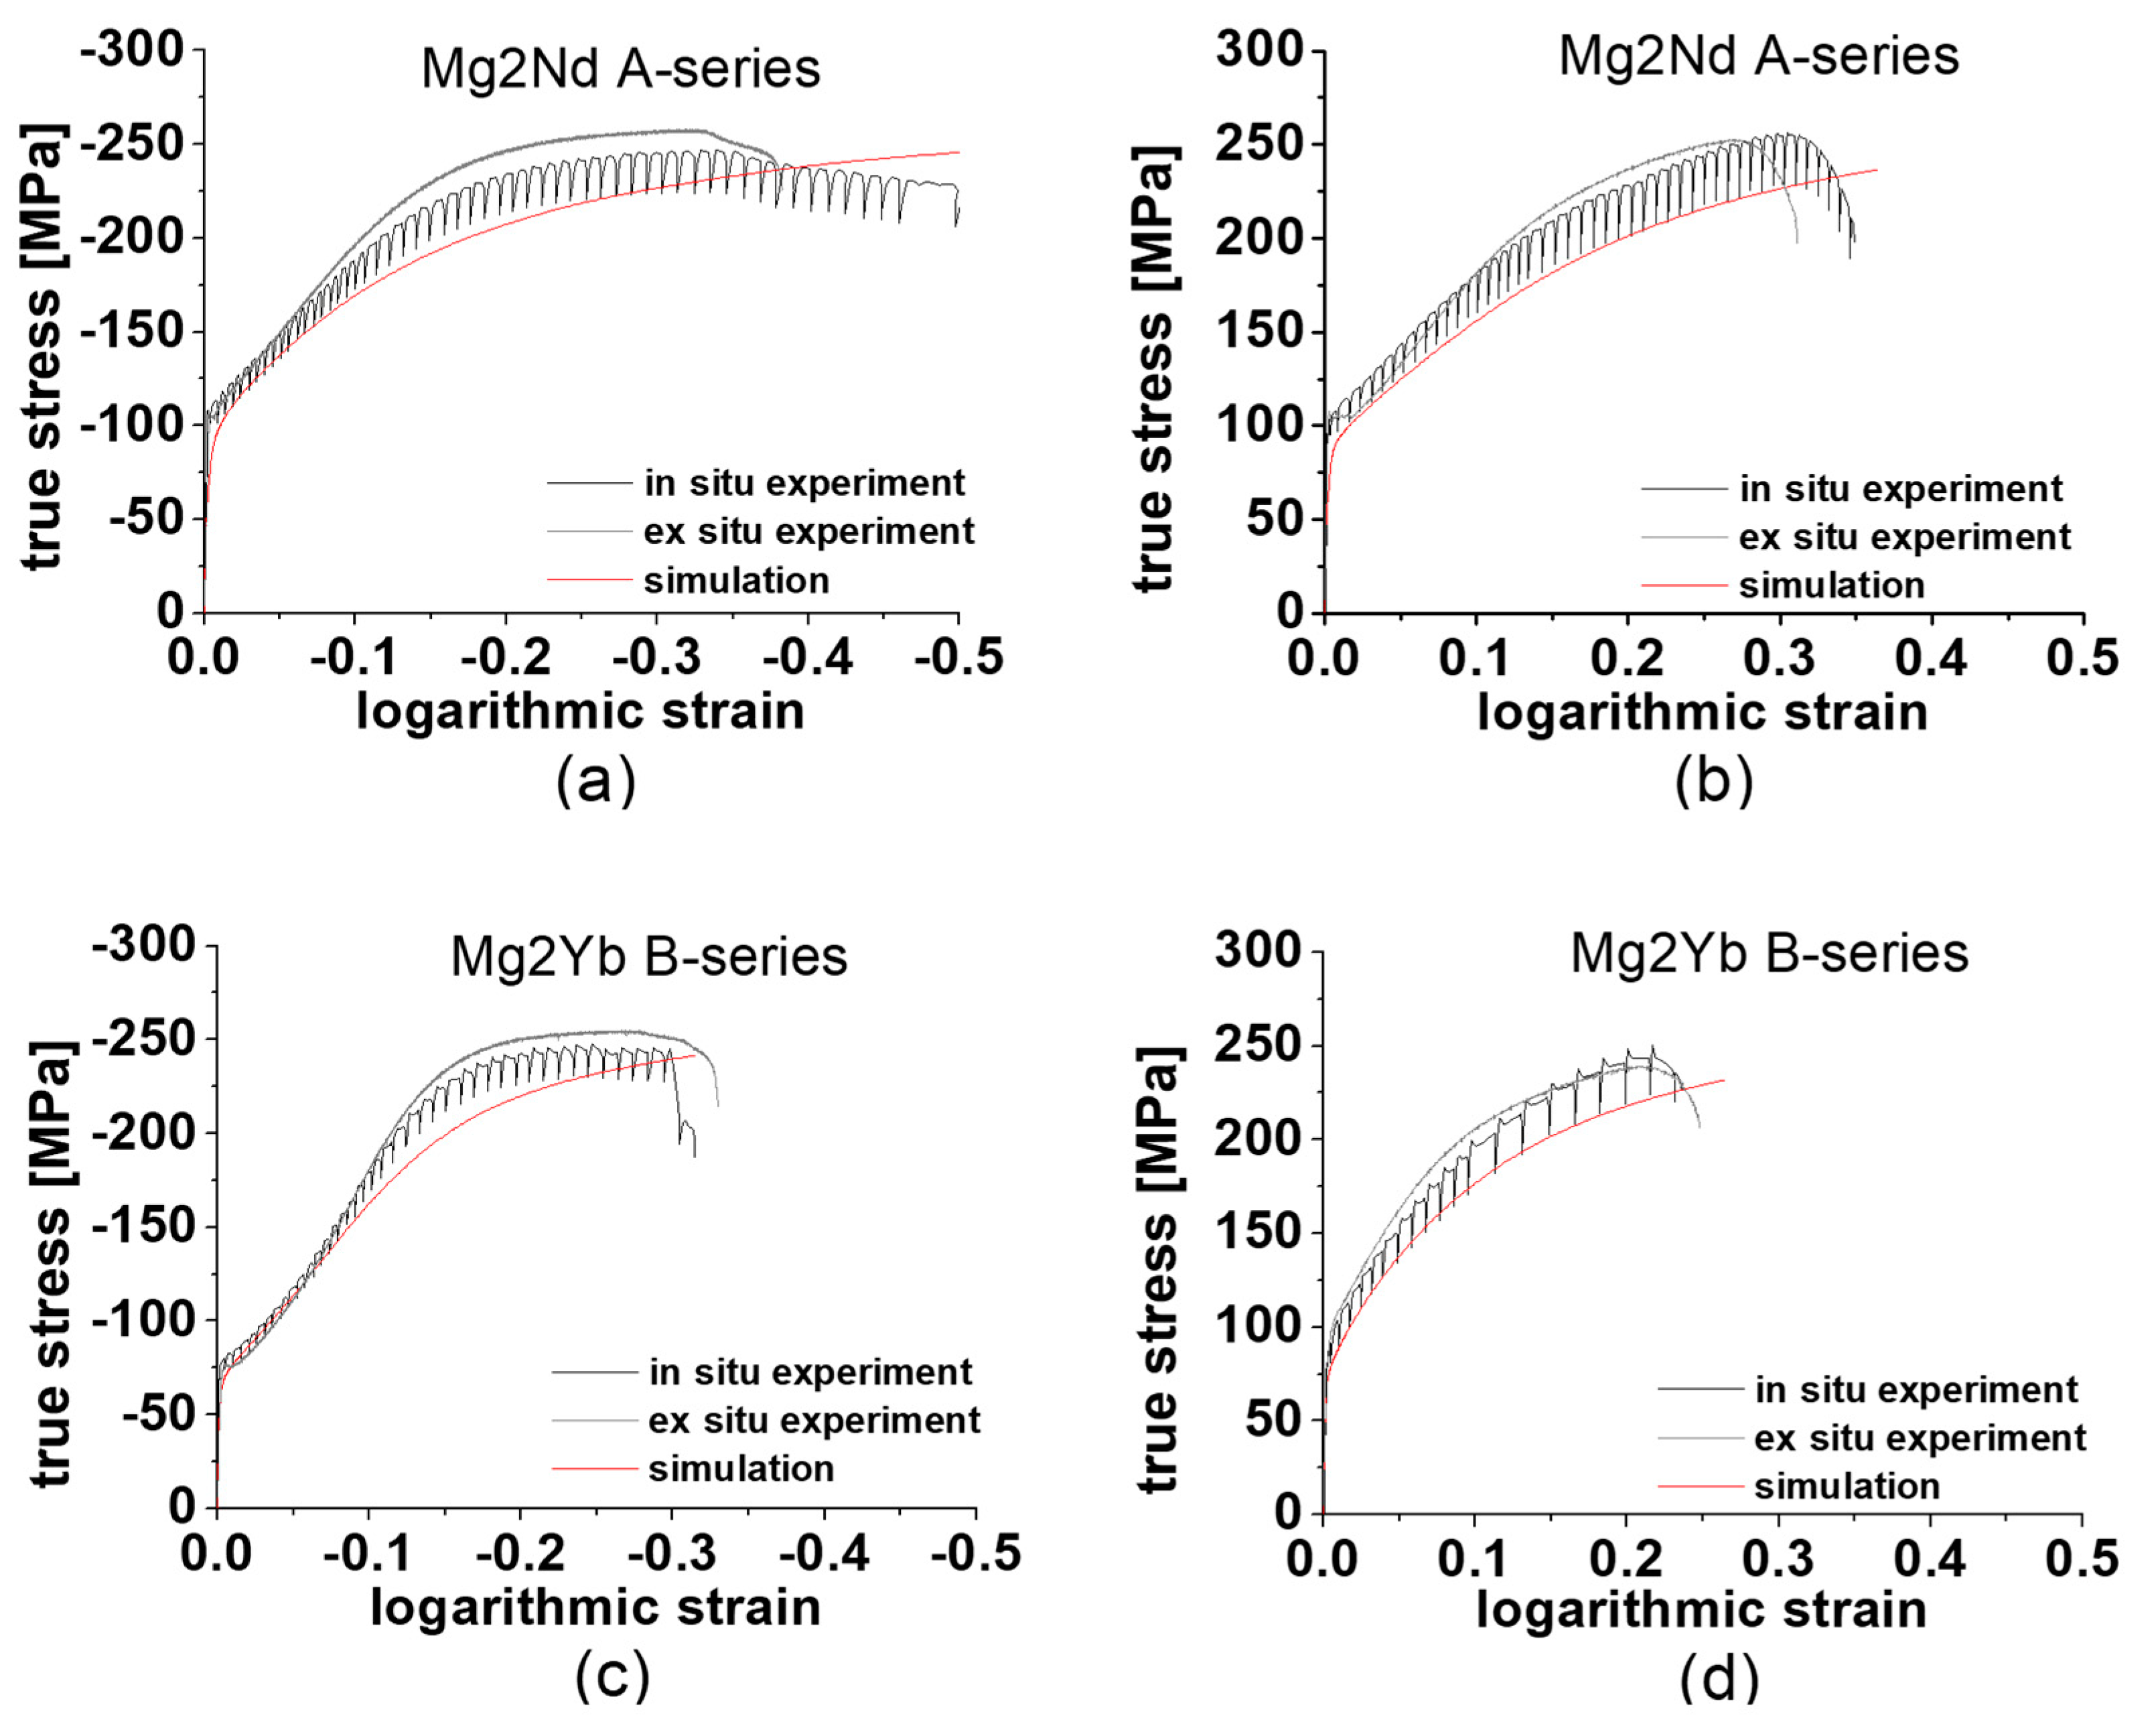
3.2. Mechanical Properties
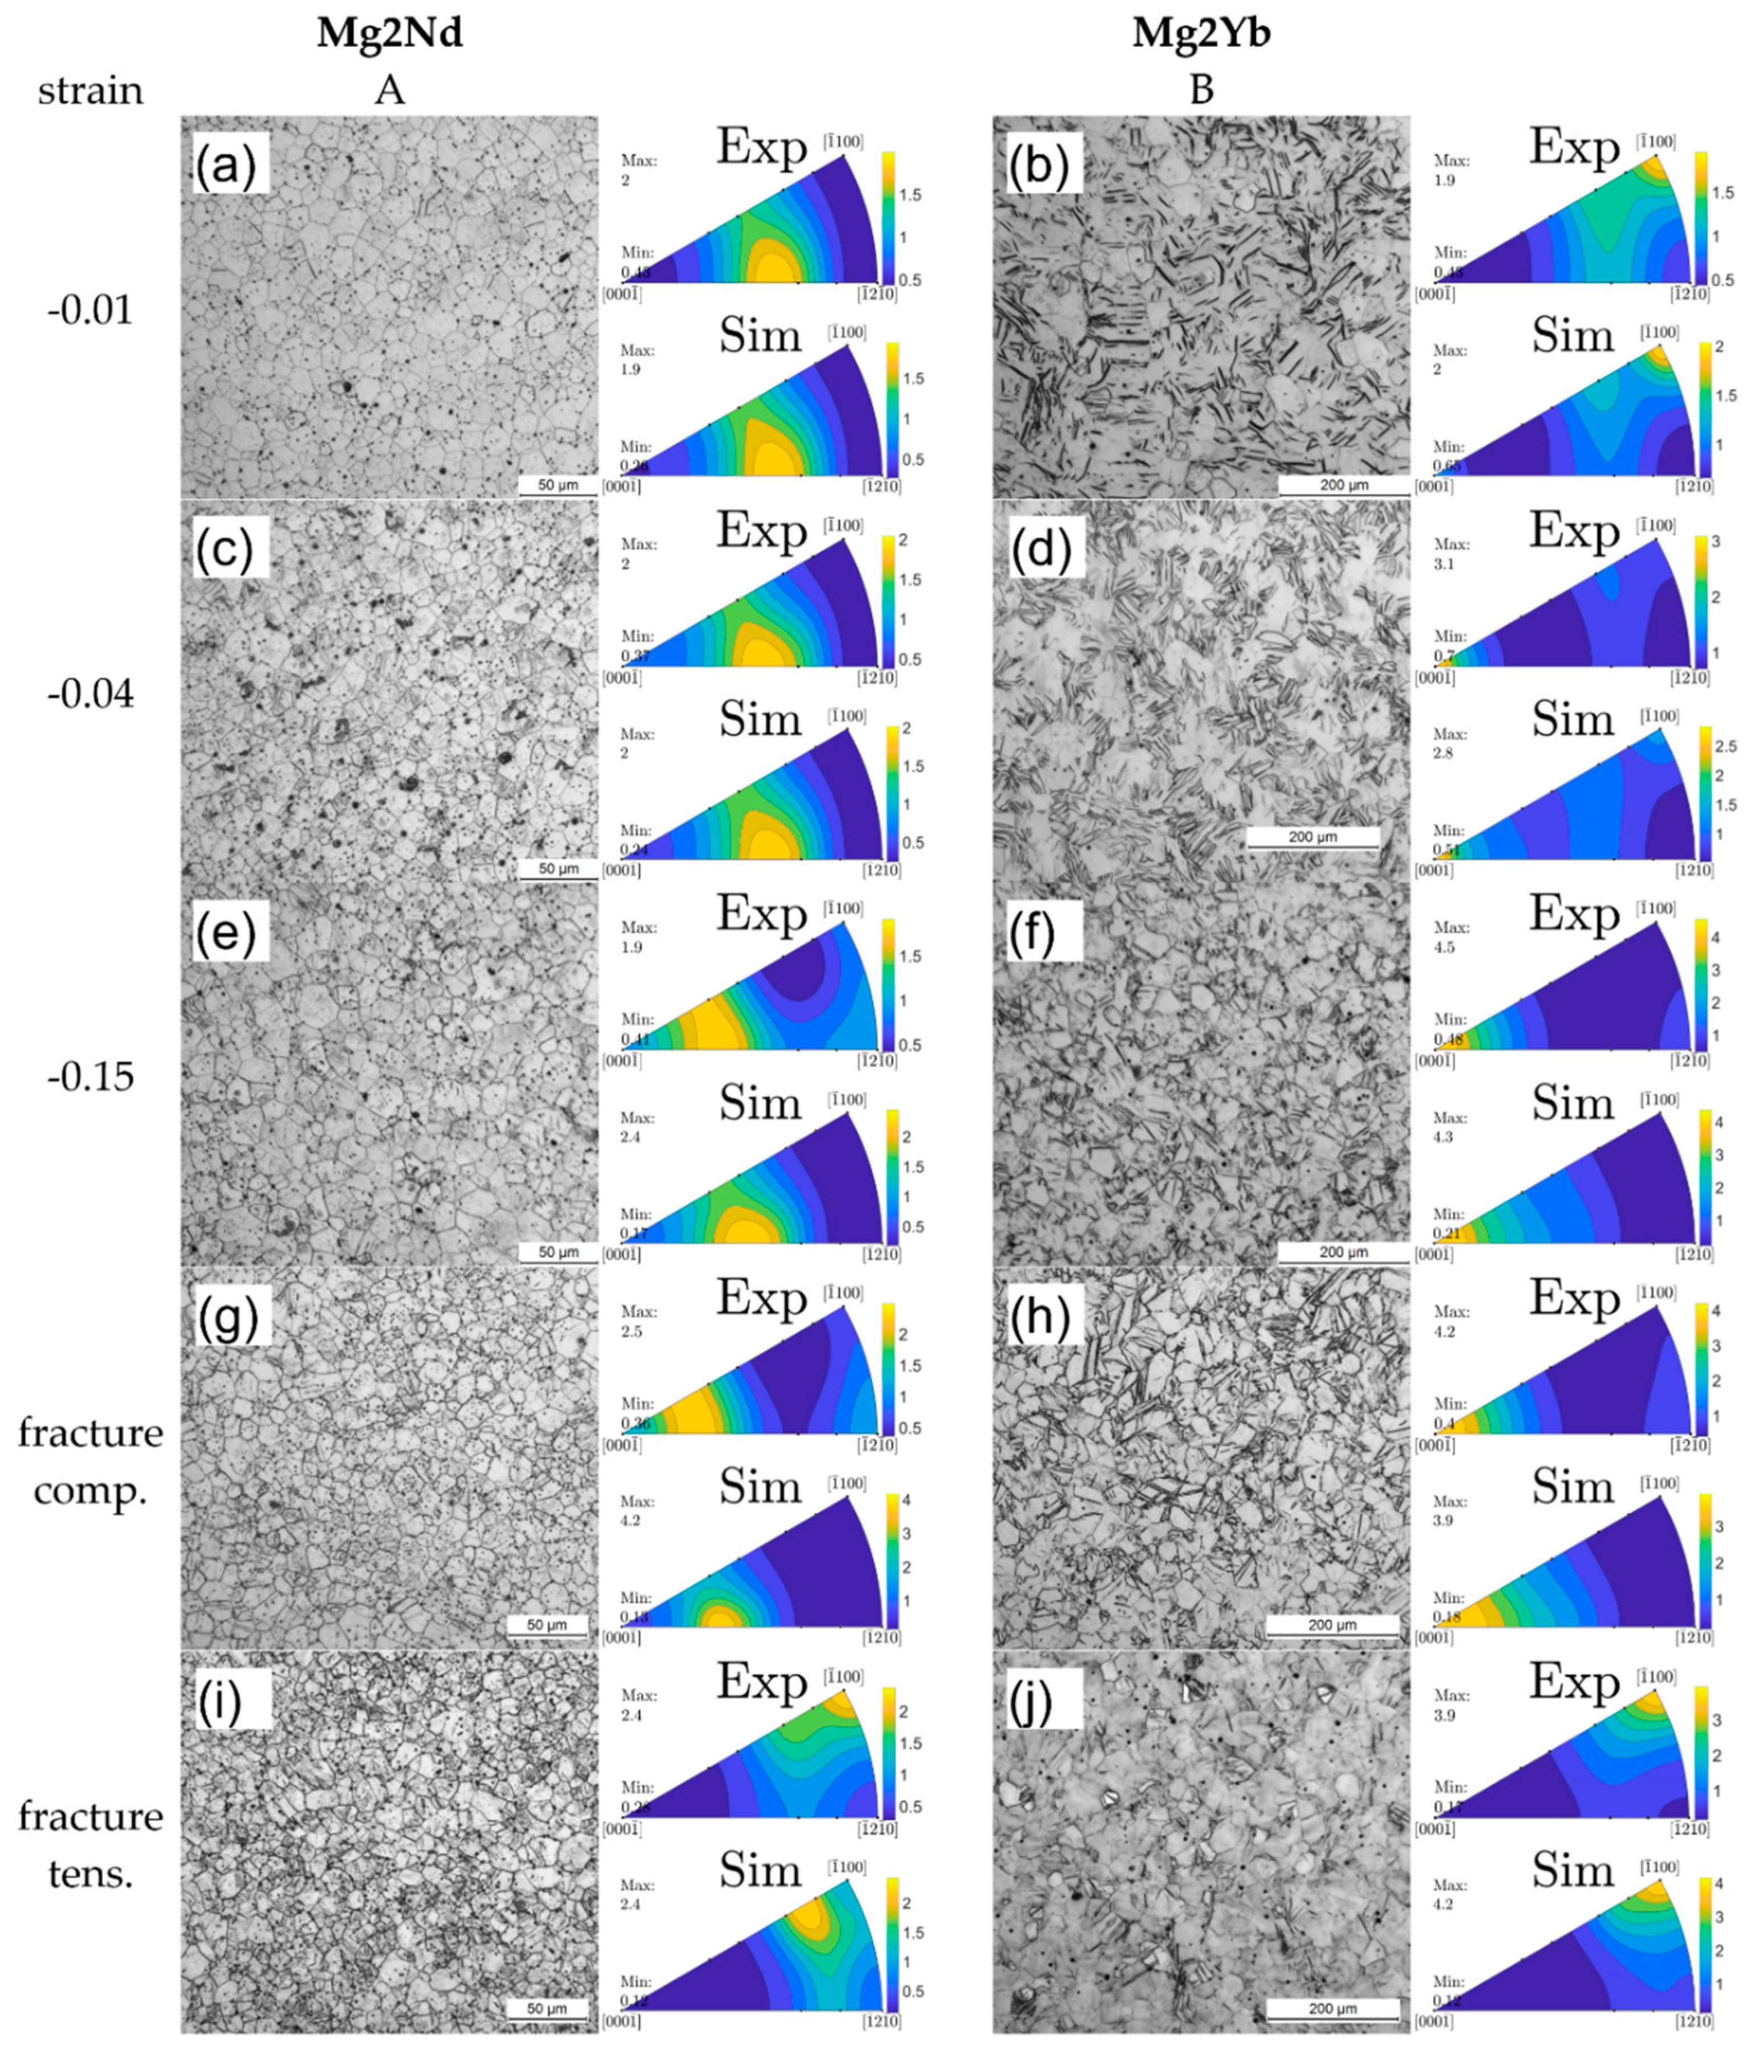
3.3. Deformed Microstructure
3.3.1. Mg2Nd
3.3.2. Mg2Yb
3.4. EPSC Simulation
3.4.1. Flow Curves
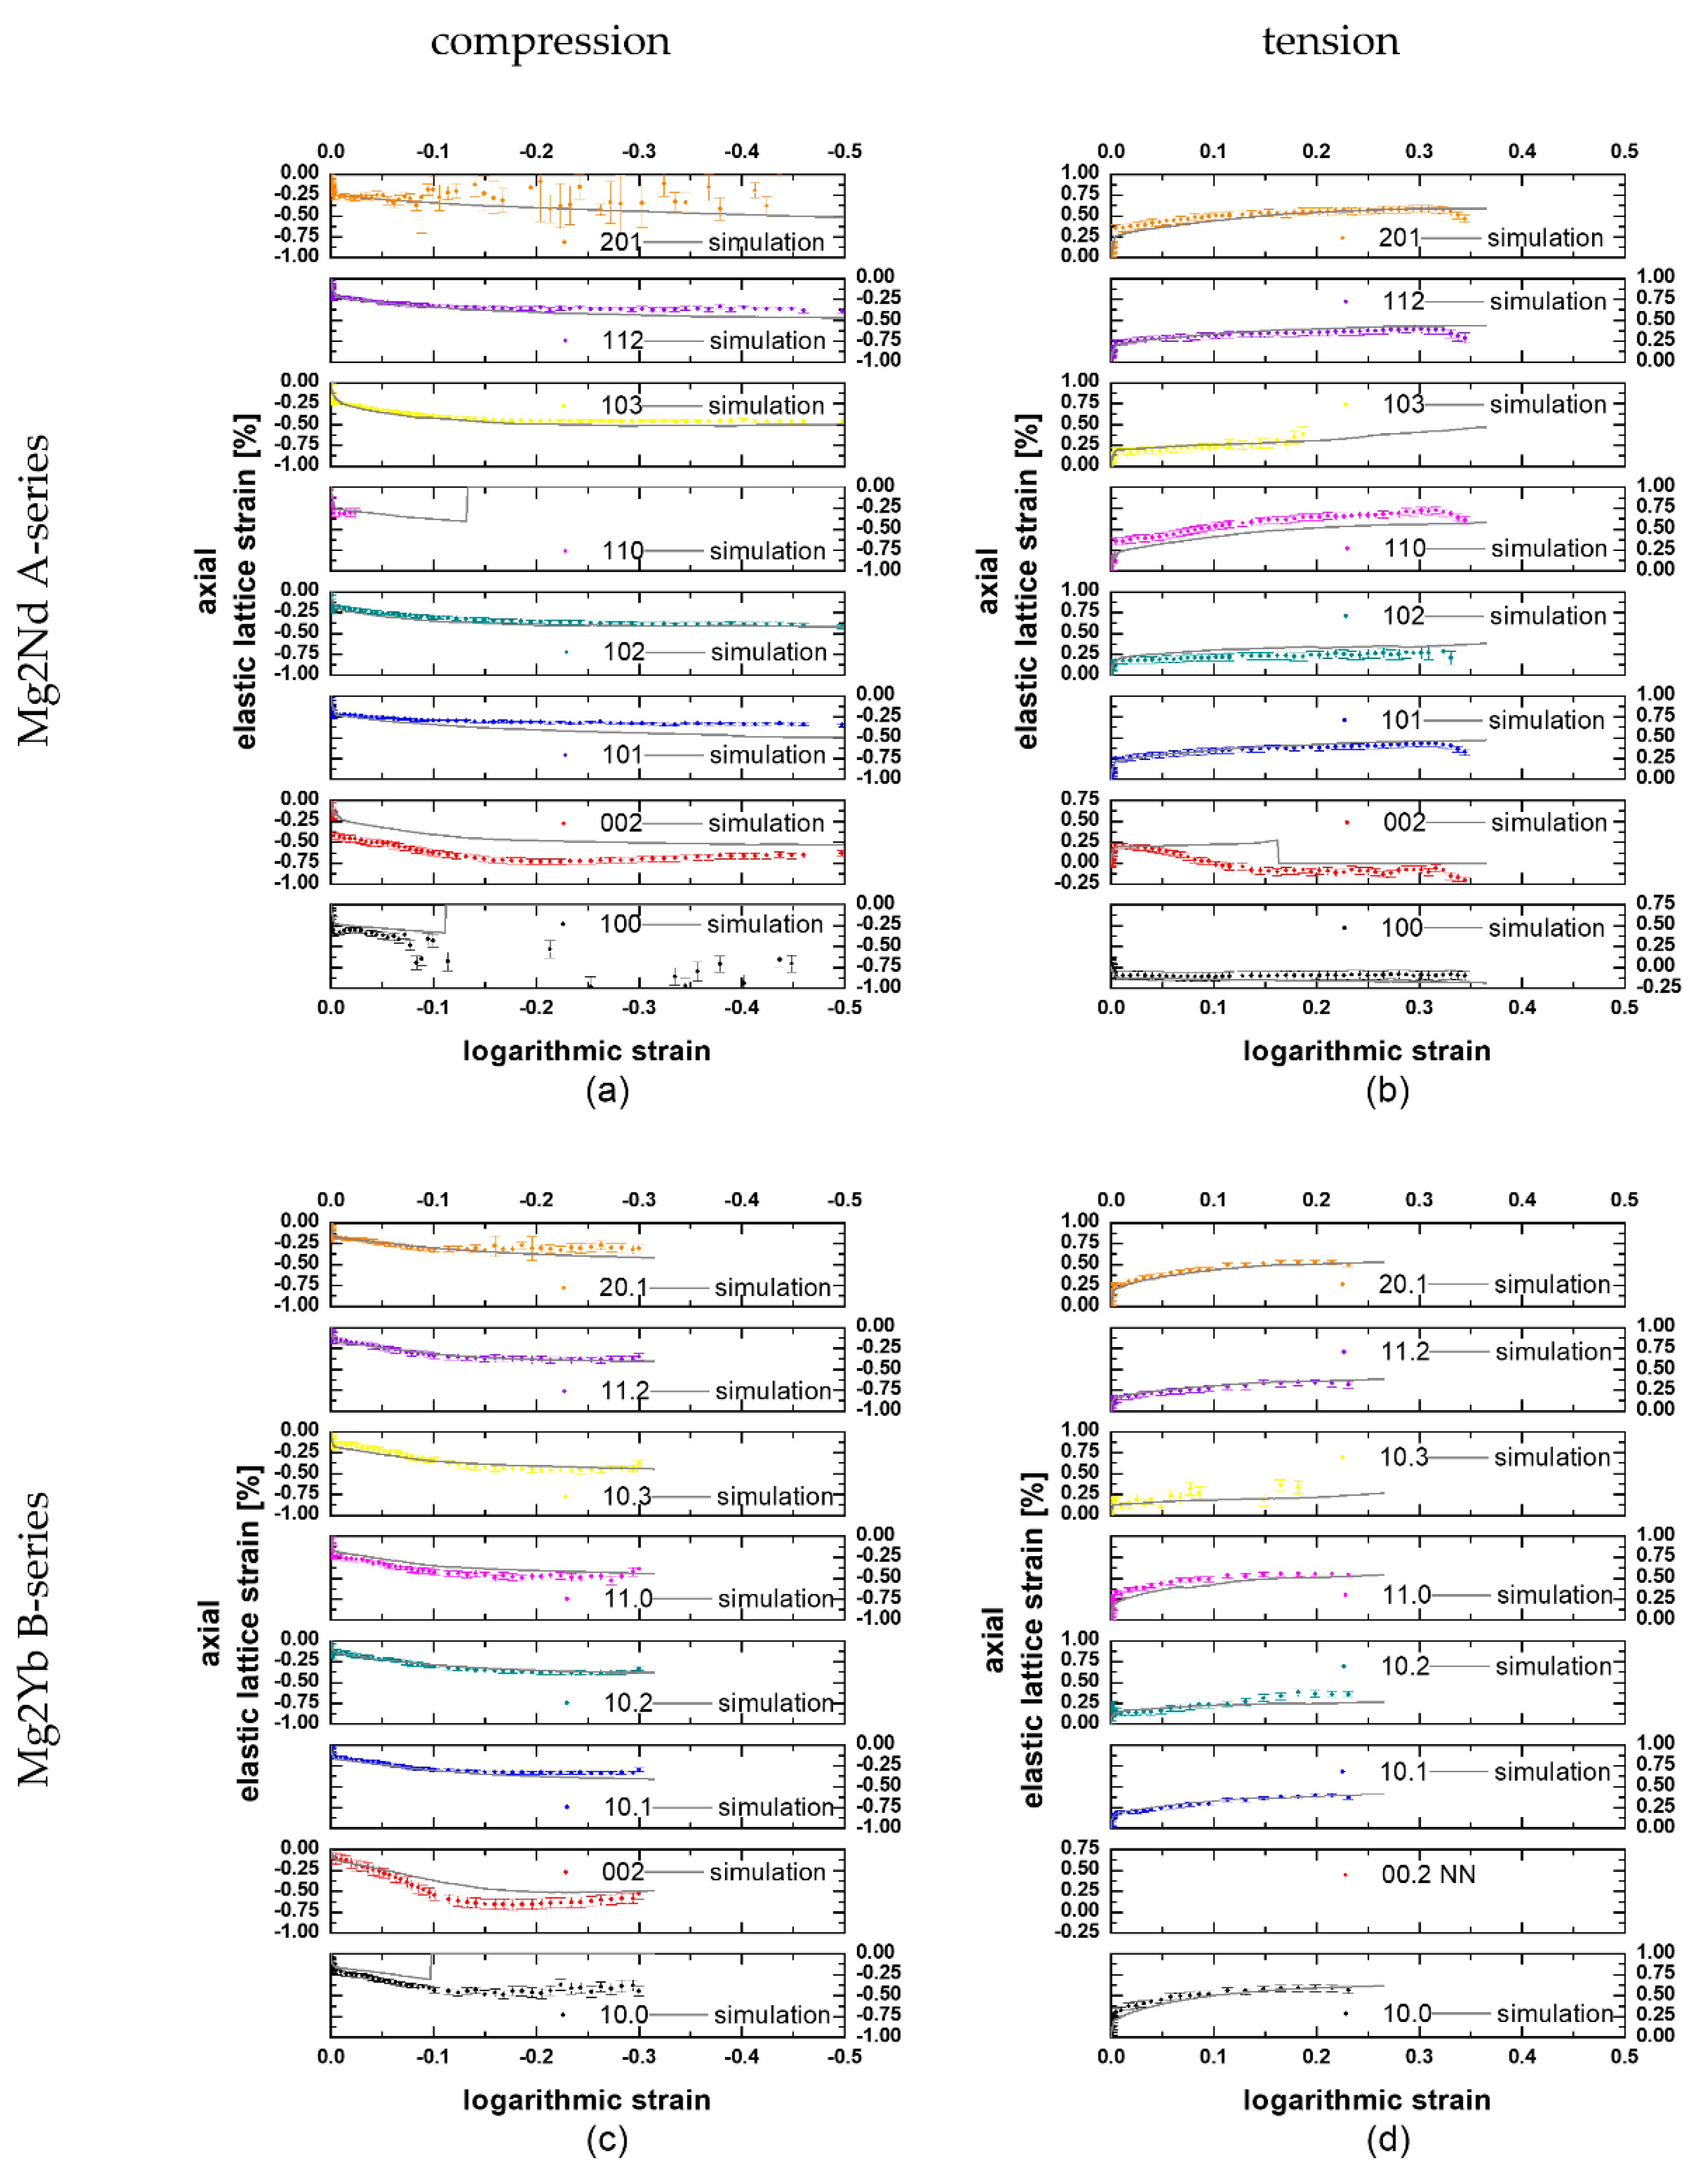
3.4.2. Elastic Lattice Strains
Mg2Nd
Mg2Yb
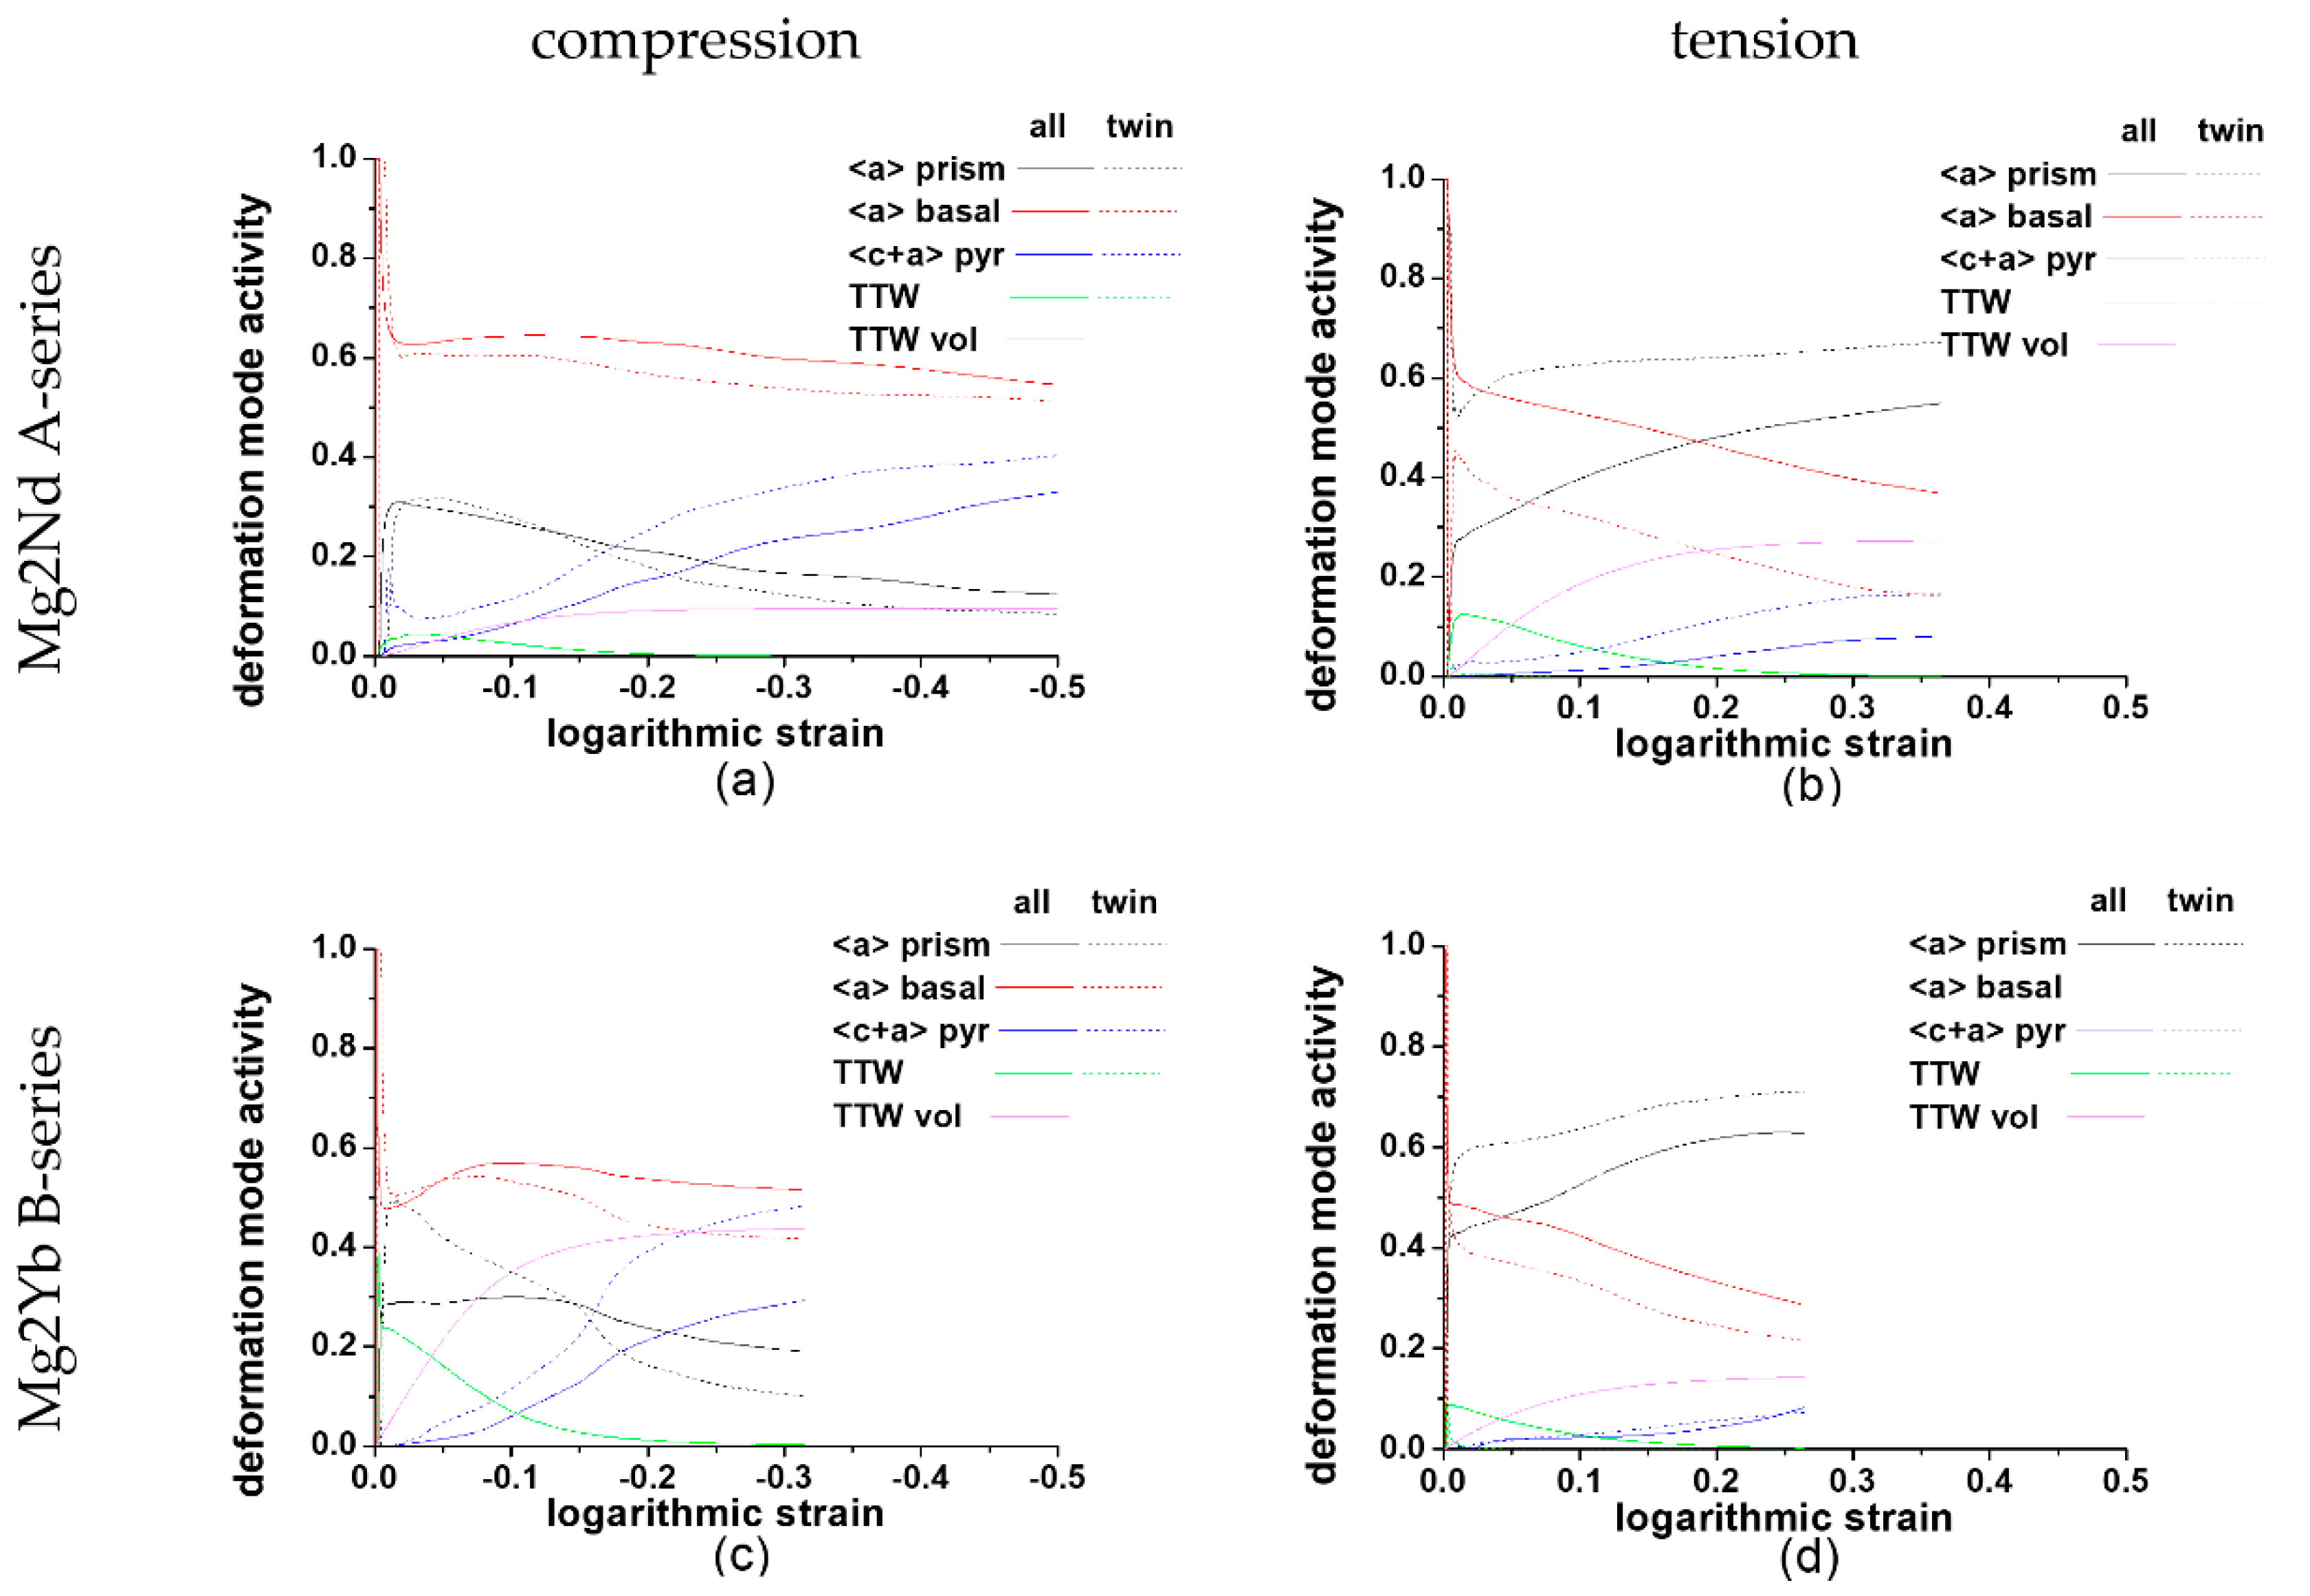
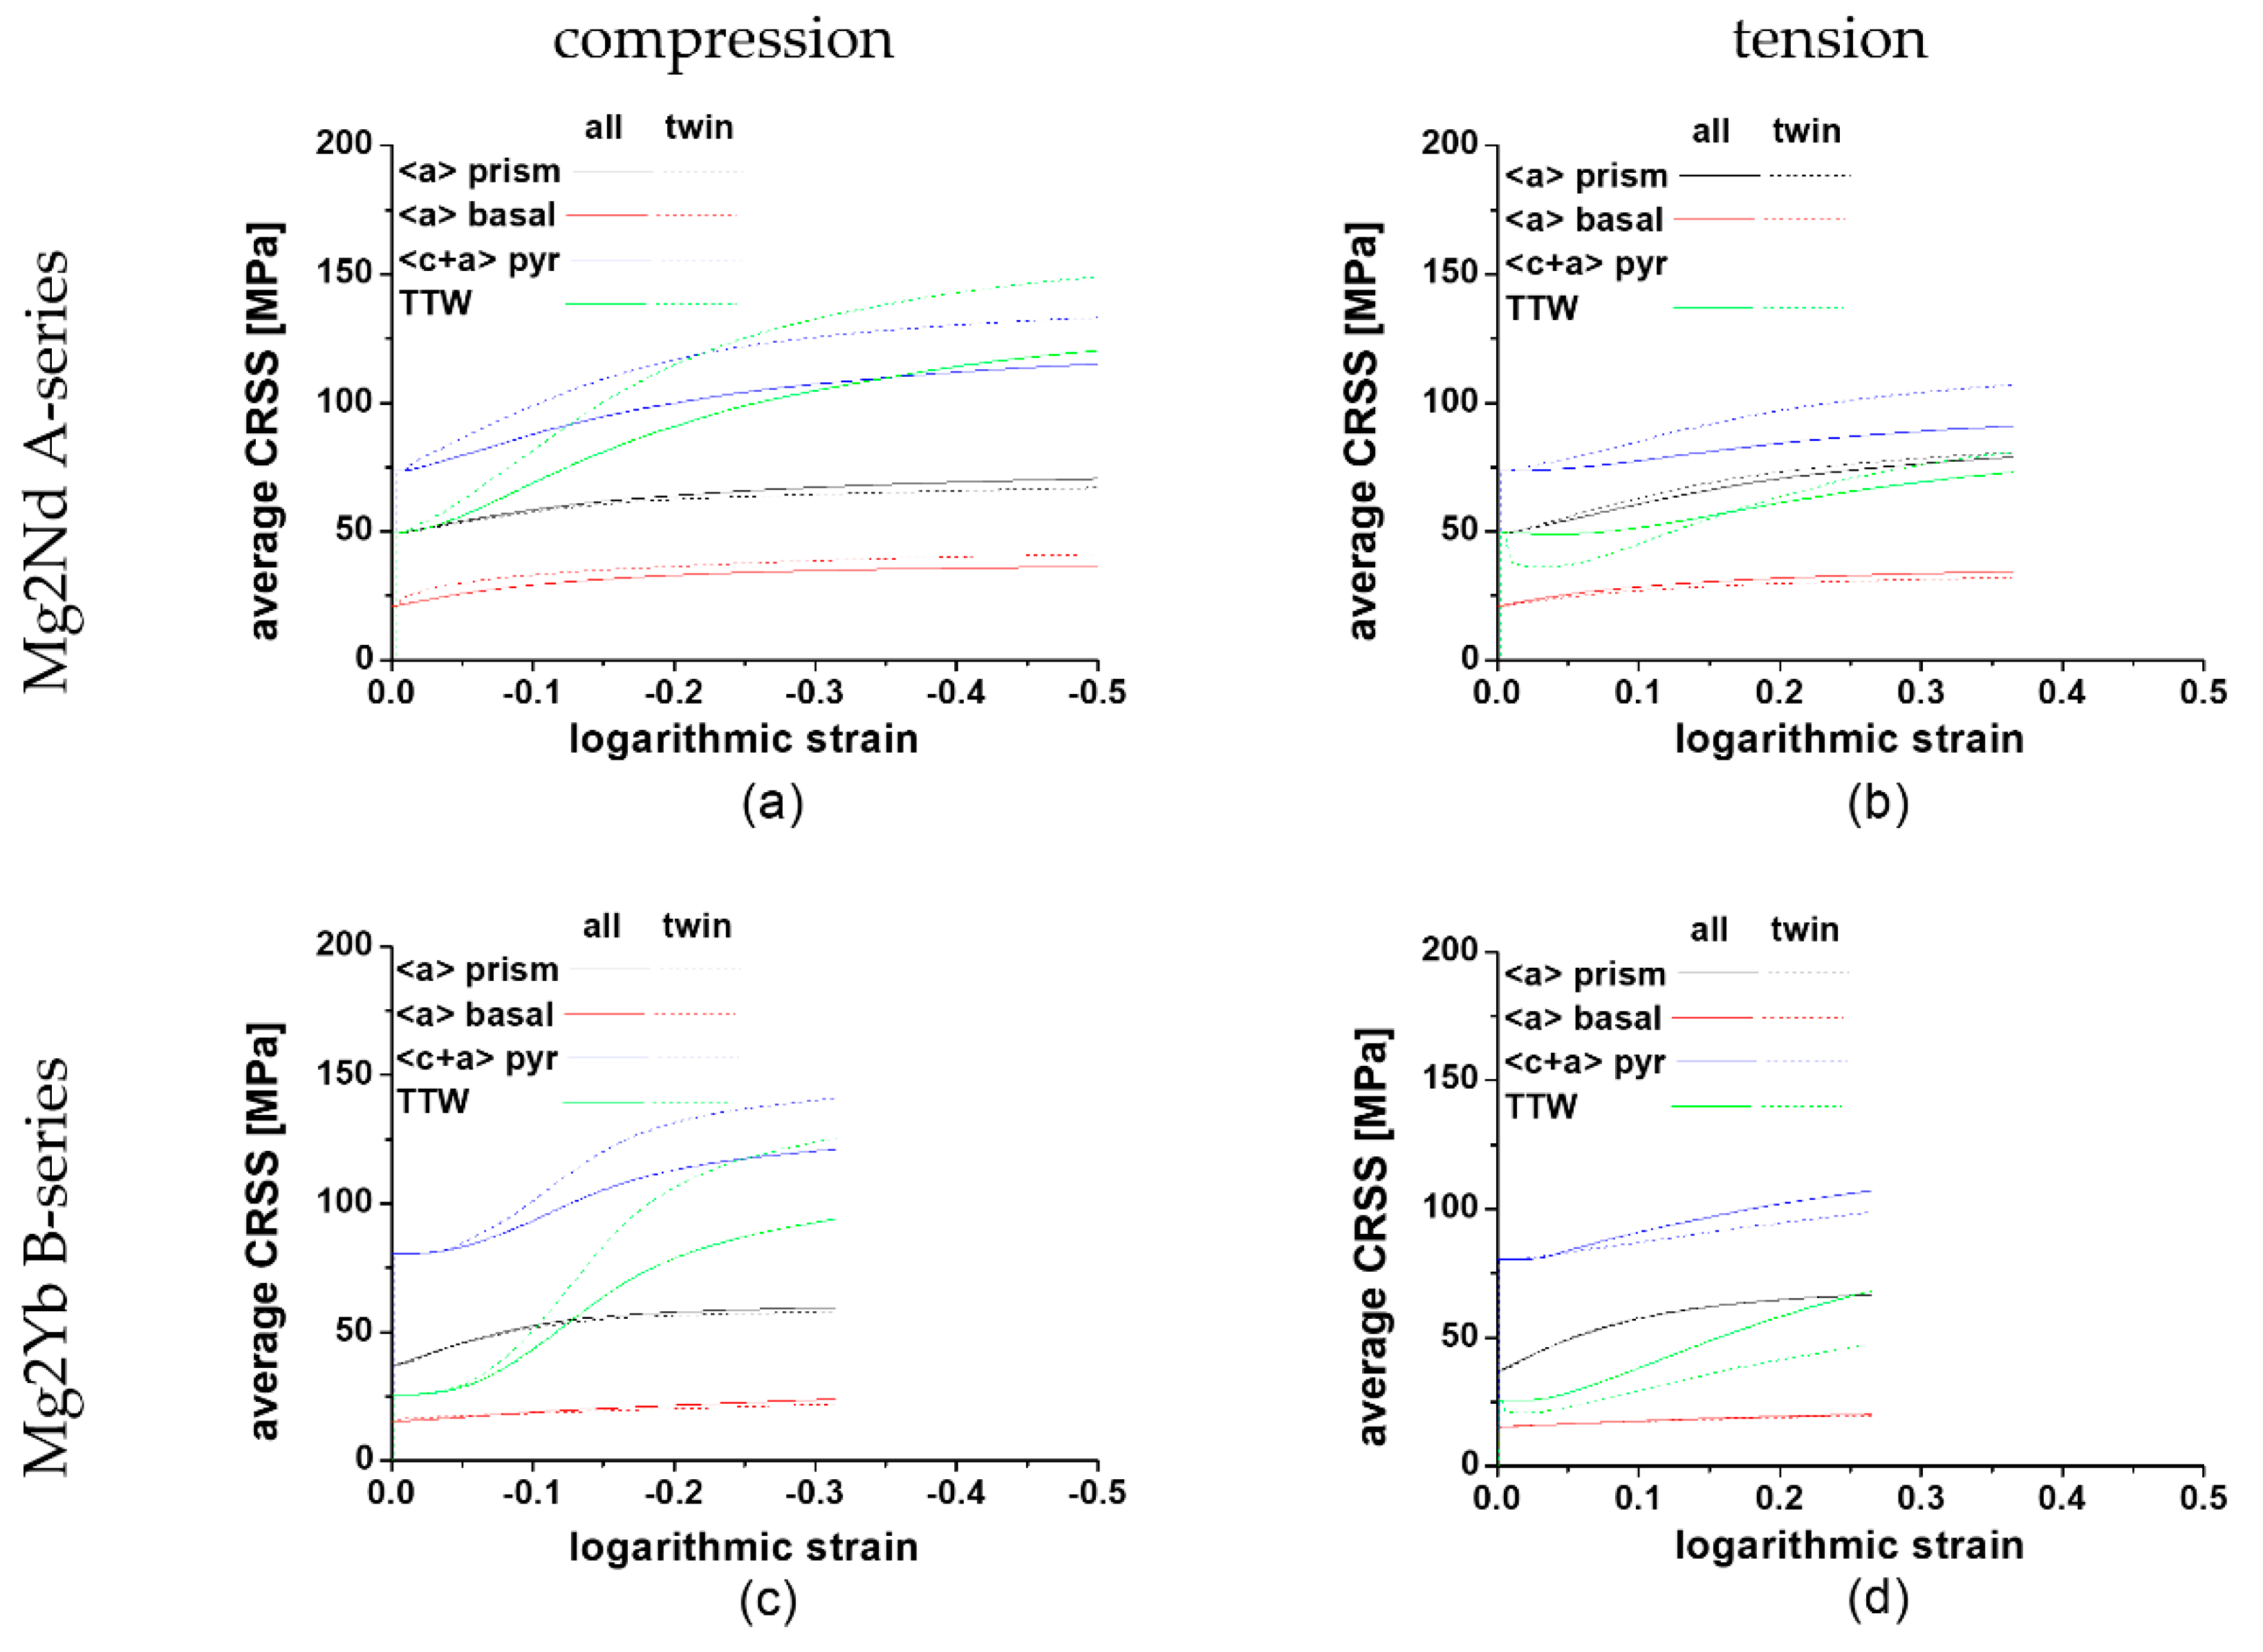
3.4.3. Activities and CRSS of Deformation Systems
Mg2Nd
Mg2Yb
4. Discussion
4.1. Strength
4.2. Plastic Deformation
4.2.1. Mg2Nd
4.2.2. Mg2Yb
4.3. Ductility
5. Conclusions
Supplementary Materials
Author Contributions
Funding
Acknowledgments
Conflicts of Interest
References
- Zeng, Z.; Stanford, N.; Davies, C.H.J.; Nie, J.-F.; Birbilis, N. Magnesium extrusion alloys: A review of developments and prospects. Int. Mater. Rev. 2019, 64, 27–62. [Google Scholar] [CrossRef]
- Mordike, B.; Ebert, T. Magnesium. Mater. Sci. Eng. A 2001, 302, 37–45. [Google Scholar] [CrossRef]
- Gupta, M.; Sharon, N.M.L. Magnesium, Magnesium Alloys, and Magnesium Composites; Wiley: Hoboken, NJ, USA, 2011; ISBN 9780470494172. [Google Scholar]
- Friedrich, H.E.; Mordike, B.L. Magnesium Technology; Springer: Berlin/Heidelberg, Germany, 2006; ISBN 3-540-20599-3. [Google Scholar]
- Arul Kumar, M.; Beyerlein, I.J.; Tomé, C.N. A measure of plastic anisotropy for hexagonal close packed metals: Application to alloying effects on the formability of Mg. J. Alloy. Compd. 2017, 695, 1488–1497. [Google Scholar] [CrossRef]
- Chelladurai, I.; Miles, M.P.; Fullwood, D.T.; Carsley, J.E.; Mishra, R.K.; Beyerlein, I.J.; Knezevic, M. Microstructure Correlation with Formability for Biaxial Stretching of Magnesium Alloy AZ31B at Mildly Elevated Temperatures. JOM 2017, 69, 907–914. [Google Scholar] [CrossRef] [Green Version]
- Clausen, B.; Tomé, C.N.; Brown, D.W.; Agnew, S.R. Reorientation and stress relaxation due to twinning: Modeling and experimental characterization for Mg. Acta Mater. 2008, 56, 2456–2468. [Google Scholar] [CrossRef]
- Hutchinson, W.B.; Barnett, M.R. Effective values of critical resolved shear stress for slip in polycrystalline magnesium and other hcp metals. Scr. Mater. 2010, 63, 737–740. [Google Scholar] [CrossRef]
- Ion, S.E.; Humphreys, F.J.; White, S.H. Dynamic recrystallisation and the development of microstructure during the high temperature deformation of magnesium. Acta Metall. 1982, 30, 1909–1919. [Google Scholar] [CrossRef]
- Yoo, M.H. Slip, twinning, and fracture in hexagonal close-packed metals. MTA 1981, 12, 409–418. [Google Scholar] [CrossRef]
- Liu, B.-Y.; Liu, F.; Yang, N.; Zhai, X.-B.; Zhang, L.; Yang, Y.; Li, B.; Li, J.; Ma, E.; Nie, J.-F.; et al. Large plasticity in magnesium mediated by pyramidal dislocations. Science 2019, 365, 73–75. [Google Scholar] [CrossRef]
- Yoo, M.H.; Lee, J.K. Deformation twinning in h.c.p. metals and alloys. Philos. Mag. A 1991, 63, 987–1000. [Google Scholar] [CrossRef]
- Beyerlein, I.J.; Zhang, X.; Misra, A. Growth Twins and Deformation Twins in Metals. Annu. Rev. Mater. Res. 2014, 44, 329–363. [Google Scholar] [CrossRef]
- Kumar, M.A.; Beyerlein, I.J. Local microstructure and micromechanical stress evolution during deformation twinning in hexagonal polycrystals. J. Mater. Res. 2020, 35, 217–241. [Google Scholar] [CrossRef]
- Knezevic, M.; Beyerlein, I.J. Multiscale Modeling of Microstructure-Property Relationships of Polycrystalline Metals during Thermo-Mechanical Deformation. Adv. Eng. Mater. 2018, 20, 1700956. [Google Scholar] [CrossRef]
- Christian, J.W.; Mahajan, S. Deformation twinning. Prog. Mater. Sci. 1995, 39, 1–157. [Google Scholar] [CrossRef]
- Stanford, N.; Atwell, D.; Beer, A.; Davies, C.; Barnett, M.R. Effect of microalloying with rare-earth elements on the texture of extruded magnesium-based alloys. Scr. Mater. 2008, 59, 772–775. [Google Scholar] [CrossRef]
- Barnett, M.R. Twinning and the ductility of magnesium alloys. Mater. Sci. Eng. A 2007, 464, 1–7. [Google Scholar] [CrossRef]
- Hirth, J.P.; Cohen, M. On the strength-differential phenomenon in hardened steel. Metall. Trans. 1970, 1, 3–8. [Google Scholar] [CrossRef]
- Spitzig, W.; Sober, R.; Richmond, O. Pressure dependence of yielding and associated volume expansion in tempered martensite. Acta Metall. 1975, 23, 885–893. [Google Scholar] [CrossRef]
- Stanford, N.; Barnett, M.R. The origin of “rare earth” texture development in extruded Mg-based alloys and its effect on tensile ductility. Mater. Sci. Eng. A 2008, 496, 399–408. [Google Scholar] [CrossRef]
- Stanford, N.; Barnett, M. Effect of composition on the texture and deformation behaviour of wrought Mg alloys. Scr. Mater. 2008, 58, 179–182. [Google Scholar] [CrossRef]
- Lentz, M.; Klaus, M.; Coelho, R.S.; Schaefer, N.; Schmack, F.; Reimers, W.; Clausen, B. Analysis of the Deformation Behavior of Magnesium-Rare Earth Alloys Mg-2 pct Mn-1 pct Rare Earth and Mg-5 pct Y-4 pct Rare Earth by In Situ Energy-Dispersive X-ray Synchrotron Diffraction and Elasto-Plastic Self-Consistent Modeling. Metall. Mater. Trans. A 2014, 45, 5721–5735. [Google Scholar] [CrossRef]
- Lentz, M.; Klaus, M.; Wagner, M.; Fahrenson, C.; Beyerlein, I.J.; Zecevic, M.; Reimers, W.; Knezevic, M. Effect of age hardening on the deformation behavior of an Mg–Y–Nd alloy: In-situ X-ray diffraction and crystal plasticity modeling. Mater. Sci. Eng. A 2015, 628, 396–409. [Google Scholar] [CrossRef]
- Bohlen, J.; Yi, S.; Letzig, D.; Kainer, K.U. Effect of rare earth elements on the microstructure and texture development in magnesium–manganese alloys during extrusion. Mater. Sci. Eng. A 2010, 527, 7092–7098. [Google Scholar] [CrossRef]
- Seitz, J.-M.; Eifler, R.; Stahl, J.; Kietzmann, M.; Bach, F.-W. Characterization of MgNd2 alloy for potential applications in bioresorbable implantable devices. Acta Biomater. 2012, 8, 3852–3864. [Google Scholar] [CrossRef] [PubMed]
- Turner, P.A.; Tomé, C.N. A study of residual stresses in Zircaloy-2 with rod texture. Acta Metall. Et Mater. 1994, 42, 4143–4153. [Google Scholar] [CrossRef]
- Zecevic, M.; Knezevic, M.; Beyerlein, I.J.; Tomé, C.N. An elasto-plastic self-consistent model with hardening based on dislocation density, twinning and de-twinning: Application to strain path changes in HCP metals. Mater. Sci. Eng. A 2015, 638, 262–274. [Google Scholar] [CrossRef] [Green Version]
- Rokhlin, L.L. Magnesium Alloys Containing Rare Earth Metals; CRC Press: London, UK, 2003; ISBN 9780429179228. [Google Scholar]
- Bachmann, F.; Hielscher, R.; Schaeben, H. Texture Analysis with MTEX—Free and Open Source Software Toolbox. Solid State Phenom. 2010, 160, 63–68. [Google Scholar] [CrossRef] [Green Version]
- Klaus, M.; Garcia-Moreno, F. The 7T-MPW-EDDI beamline at BESSY II. JLSRF 2016, 2. [Google Scholar] [CrossRef] [Green Version]
- Genzel, C.; Denks, I.A.; Coelho, R.; Thomas, D.; Mainz, R.; Apel, D.; Klaus, M. Exploiting the features of energy-dispersive synchrotron diffraction for advanced residual stress and texture analysis. J. Strain Anal. Eng. Des. 2011, 46, 615–625. [Google Scholar] [CrossRef] [Green Version]
- Beyerlein, I.J.; Knezevic, M. Mesoscale, Microstructure-Sensitive Modeling for Interface-Dominated, Nanostructured Materials. In Handbook of Materials Modeling; Andreoni, W., Yip, S., Eds.; Springer International Publishing: Cham, Switzerland, 2020; pp. 1111–1152. ISBN 978-3-319-44676-9. [Google Scholar]
- Wang, J.; Zecevic, M.; Knezevic, M.; Beyerlein, I.J. Polycrystal plasticity modeling for load reversals in commercially pure titanium. Int. J. Plast. 2020, 125, 294–313. [Google Scholar] [CrossRef]
- Beyerlein, I.J.; Tomé, C.N. A dislocation-based constitutive law for pure Zr including temperature effects. Int. J. Plast. 2008, 24, 867–895. [Google Scholar] [CrossRef]
- Knezevic, M.; Beyerlein, I.J.; Brown, D.W.; Sisneros, T.A.; Tomé, C.N. A polycrystal plasticity model for predicting mechanical response and texture evolution during strain-path changes: Application to beryllium. Int. J. Plast. 2013, 49, 185–198. [Google Scholar] [CrossRef]
- Proust, G.; Tomé, C.N.; Kaschner, G.C. Modeling texture, twinning and hardening evolution during deformation of hexagonal materials. Acta Mater. 2007, 55, 2137–2148. [Google Scholar] [CrossRef]
- Nie, J.-F. Precipitation and Hardening in Magnesium Alloys. MTA 2012, 43, 3891–3939. [Google Scholar] [CrossRef] [Green Version]
- Lefebvre, W.; Kopp, V.; Pareige, C. Nano-precipitates made of atomic pillars revealed by single atom detection in a Mg-Nd alloy. Appl. Phys. Lett. 2012, 100, 141906. [Google Scholar] [CrossRef]
- Dobromyslov, A.V.; Kaigorodova, L.I.; Sukhanov, v.d.; Dobatkina, T.V. Decomposition of a supersaturated solid solution in the Mg-3.3 wt% Yb alloy. Phys. Met. Met. 2007, 103, 64–71. [Google Scholar] [CrossRef]
- Dobroň, P.; Chmelík, F.; Yi, S.; Parfenenko, K.; Letzig, D.; Bohlen, J. Grain size effects on deformation twinning in an extruded magnesium alloy tested in compression. Scr. Mater. 2011, 65, 424–427. [Google Scholar] [CrossRef]


| Alloys | Series | TB (°C) | Cooling | R | vP (m/min) |
|---|---|---|---|---|---|
| Mg2Nd | A | 400 | Air | 61:1 | 0.5 |
| B | 400 | Water | 61:1 | 0.5 | |
| C | 400 | Water | 61:1 | 0.25 | |
| Mg2Yb | A | 400 | Air | 61:1 | 1.3 |
| B | 400 | Water | 61:1 | 1.6 | |
| C | 300 | Water | 61:1 | 1.8 |
| Alloy | Series | Heat Treatment | CYS (MPa) | εfc (-) | TYS (MPa) | εft (-) | SDE |
|---|---|---|---|---|---|---|---|
| Mg2Nd | A | - | −105 | −0.32 | 107 | 0.36 | −0.02 |
| A + HT | 150 °C, 6 h | −123 | −0.24 | 129 | 0.20 | −0.05 | |
| B | - | −125 | −0.29 | 122 | 0.41 | 0.02 | |
| B + HT | 150 °C, 7 h | −160 | −0.24 | 133 | 0.17 | 0.18 | |
| C | - | −176 | −0.22 | 175 | 0.34 | 0.01 | |
| C + HT | 150 °C, 7 h | −197 | −0.18 | 203 | 0.34 | −0.03 | |
| C + HT | 204 °C, 3 h | −191 | −0.2 | 197 | 0.33 | −0.03 | |
| Mg2Yb | A | - | −58 | −0.3 | 89 | 0.3 | −0.42 |
| A + HT | 300 °C, 15 min | −65 | −0.29 | 104 | 0.21 | −0.47 | |
| B | - | −77 | −0.22 | 100 | 0.32 | −0.26 | |
| B + HT | 300 °C, 15 min | −83 | −0.23 | 110 | 0.25 | −0.28 | |
| C | - | −111 | −0.22 | 115 | 0.32 | −0.04 |
| Parameter | Mg2Nd (c/a = 1.623) | Mg2Yb (c/a = 1.626) | ||||||
|---|---|---|---|---|---|---|---|---|
| Prismatic | Basal | Pyramidal | TTW | Prismatic | Basal | Pyramidal | TTW | |
| (Mpa) | 39 | 11 | 60 | 18 | 21 | 1 | 67 | 2 |
| (m−1) | 2.2 × 10⁸ | 6.0 × 10⁷ | 4.5 × 10⁹ | - | 4.0 × 10⁸ | 3.0 × 10⁷ | 5.5 × 10⁹ | - |
| (MPa) | 4.5 × 10³ | 3.0 × 10³ | 3.5 × 10³ | - | 4.0 × 10³ | 4.0 × 10³ | 4.0 × 10³ | - |
| 7.2 × 10⁻³ | 4.3 × 10⁻³ | 7.3 × 10⁻³ | - | 6.5 × 10⁻³ | 4.8 × 10⁻³ | 7.2 × 10⁻³ | - | |
| 70 | 90 | 30 | 110 | 190 | 150 | 40 | 110 | |
| 50 | 50 | 400 | - | 50 | 50 | 400 | - | |
| Alloy | Mg2Nd | Mg2Yb | ||
|---|---|---|---|---|
| HP Parameter | CYS | TYS | CYS | TYS |
| K (MPa µm0.5) | 239 ± 14 | 232 ± 29 | 243 ± 28 | 116 ± 22 |
| σ0 (MPa) | −37 ± 6 | 39 ± 12 | −25 ± 7 | 74 ± 6 |
| Alloy | Series | GS (µm) | CRSSba | CRSSpr | CRSSpy | CRSSttw | CRSS Ratio ba:pr:py:ttw |
|---|---|---|---|---|---|---|---|
| Mg2Nd | A | 13 | 20.7 | 49.2 | 73.4 | 49.4 | 1: 2.4: 3.6: 2.4 |
| B | 7 | 23.2 | 51.1 | 74.7 | 61.6 | 1: 2.2: 3.2: 2.7 | |
| Mg2Yb | A | 49 | 12.7 | 34.4 | 79.5 | 19.7 | 1: 2.7: 6.3: 1.6 |
| B | 26 | 15.0 | 37.3 | 80.4 | 25.6 | 1: 2.5: 5.4: 1.7 |
Publisher’s Note: MDPI stays neutral with regard to jurisdictional claims in published maps and institutional affiliations. |
© 2021 by the authors. Licensee MDPI, Basel, Switzerland. This article is an open access article distributed under the terms and conditions of the Creative Commons Attribution (CC BY) license (http://creativecommons.org/licenses/by/4.0/).
Share and Cite
Schmidt, J.; Beyerlein, I.J.; Knezevic, M.; Reimers, W. Adjustment of the Mechanical Properties of Mg2Nd and Mg2Yb by Optimizing Their Microstructures. Metals 2021, 11, 377. https://doi.org/10.3390/met11030377
Schmidt J, Beyerlein IJ, Knezevic M, Reimers W. Adjustment of the Mechanical Properties of Mg2Nd and Mg2Yb by Optimizing Their Microstructures. Metals. 2021; 11(3):377. https://doi.org/10.3390/met11030377
Chicago/Turabian StyleSchmidt, Jonas, Irene J. Beyerlein, Marko Knezevic, and Walter Reimers. 2021. "Adjustment of the Mechanical Properties of Mg2Nd and Mg2Yb by Optimizing Their Microstructures" Metals 11, no. 3: 377. https://doi.org/10.3390/met11030377