Article

Combining Differential Scanning Calorimetry and Cooling-Heating Curve Thermal Analysis to Study the Melting and Solidification Behavior of Al-Ce Binary Alloys

CanmetMATERIALS, Natural Resources Canada, Hamilton, ON L8P 0A5, Canada
*
Author to whom correspondence should be addressed.
Metals 2021, 11(2), 372; https://doi.org/10.3390/met11020372
Submission received: 27 January 2021 / Revised: 16 February 2021 / Accepted: 18 February 2021 / Published: 23 February 2021
(This article belongs to the Special Issue Phase Transformations in Lightweight Alloys)

Abstract

:
Two common techniques of thermal analysis, Differential Scanning Calorimetry (DSC) and Cooling/Heating Curve Thermal Analysis (CCTA), based on different signal collected and utilizing samples with a weight difference of three orders of magnitude, were used to assess the solidification and melting behavior of Al-Ce binary alloys, containing from 5 to 20 wt. % Ce. Thermal analysis was accompanied by microscopic observations of solidified structures. For heating/cooling rates of 0.2–0.4 °C/s, temperatures of eutectic transformation L ↔ Al + Al11Ce3 in the Al-10Ce alloy along with additional proeutectic reactions L ↔ Al in the Al-5Ce hypoeutectic alloy and L ↔ Al11Ce3 in Al-15Ce and Al-20Ce hypereutectic alloys, were determined. Although there was a general agreement in major transformations, registered by DSC and CCTA during melting and solidification, differences in the reaction temperature determined exceeded the typical measurement errors for each technique. In addition, DSC and CCTA exhibited differences in detecting some proeutectic reactions and minor non-equilibrium effects, accompanying the eutectic transformation. Some factors that could contribute to differences observed and their implications for engineering practice were discussed.

Graphical Abstract

1. Introduction

Solidification plays a paramount role in the property control of cast metals and alloys, affecting not only their phase composition, microstructure, and homogeneity but also integrity, including defects such as cracks or porosity. Similarly, solidification has a prominent influence on properties of wrought materials since a cast state represents their precursor, subjected to further thermomechanical processing. Melting, in contrast, is of importance, for example, for alloy precursor preparation for semisolid-state processing, as is the case in manufacturing the billets for thixoforming. To identify thermal events that occur in a material during melting and solidification, thermal analysis is used as the fundamental tool [1].
In metallurgy, the primary techniques of thermal analysis include cooling/heating curve thermal analysis (CCTA) and differential scanning calorimetry (DSC), working on essentially different principles. The CCTA (or CA-CCTA-computer aided) is performed by acquisition of a cooling curve (temperature versus time function) from a sample of liquid material that expresses a balance between the evolution of heat in the sample and the heat transported away from it. The concept is utilized in a Universal Metallurgical Simulator and Analyzer (UMSA), capable of recording and analyzing the “energy signature” of a test sample with a high degree of accuracy and repeatability [2]. In contrast, Differential Scanning Calorimetry is based on heat flow principle, where a difference in the amount of heat required for increasing the temperature of a test sample and the reference is measured as a function of temperature [3]. Apart from the signal collected, there is a substantial difference in the material volume utilized by both techniques. The as-cast structures often exhibit macro-segregation of alloying and impurity elements, gas and shrinkage porosity that affect the solidification thermal output. It is anticipated, therefore, that for cast alloys, the UMSA technique, through employing a relatively large sample corresponding to about 70 g of Al-Ce alloys, may lead to a different outcome to the DTA/DSC techniques that use micro-size samples of approximately 0.02 g. At present, these factors and their potential influence on the results generated are not emphasized in the literature; there is no direct comparison of challenges both techniques create during melting/solidification assessment of metallurgical alloys, signal interpretation and the transfer of findings to industrial practice.
To address the above concerns, the CCTA and DSC techniques were combined in this study to assess the solidification and melting behavior of Al-Ce binary alloys in the Al-rich side of the phase diagram, where the technologically important Al-Al11Ce3 eutectic is located [4]. Controlling solidification of the Al-Al11Ce3 eutectic is of particular importance since due to a lack of solid-state solubility of Ce in Al, the eutectic is insensitive to the post-casting heat treatments. Hence, solidification represents the key way to modify its morphology and the resultant alloy properties.

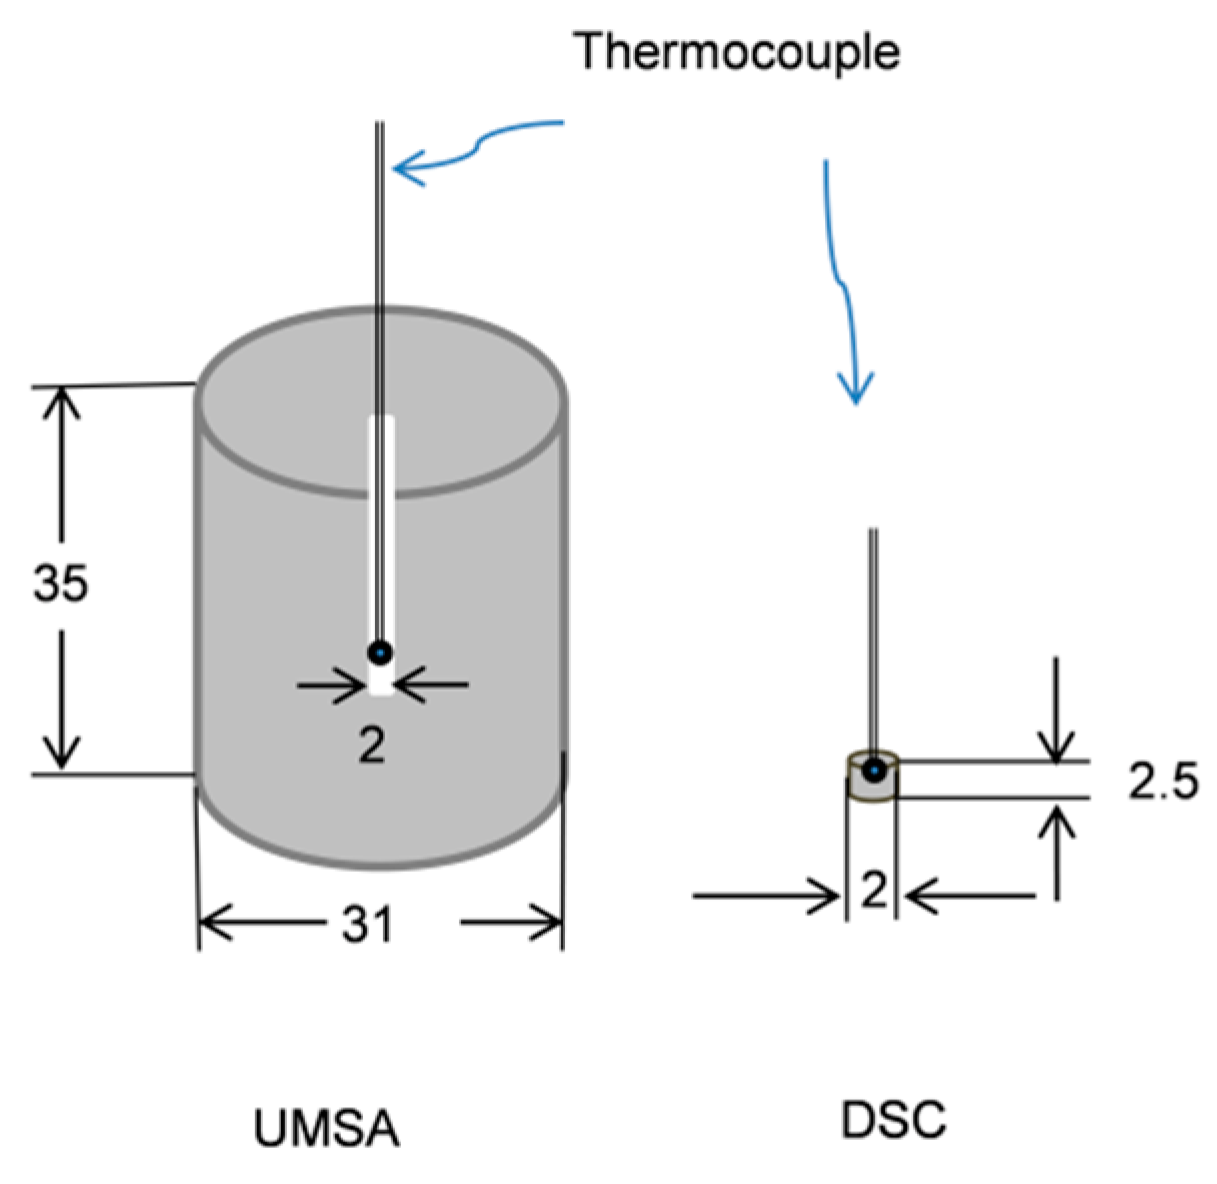
2. Materials and Methods

The Al-Ce alloys with a nominal Ce content from 5 wt. % to 20 wt. % were cast in an in-house pilot-scale foundry, using elemental Al and Ce, both of 99.9 wt. % purity with processing details described earlier [5]. Following solidification, the cerium concentration was determined by Inductively Coupled Plasma (ICP) and remaining elements were measured by Optical Emission Spectroscopy (OES) with results being listed in Table 1.
The phase nucleation and growth during melting and solidification was assessed through a Computer-Aided Cooling Curves Thermal Analysis associated with measurements using a Universal Metallurgical Simulator and Analyzer [2]. For clarity it should be stated that by analogy, during heating cycles, the heating curves were used as a source of information. The UMSA apparatus employs a cylindrical sample with a diameter of 31 mm and a height of 35 mm, having a pre-drilled hole and an insert of the stainless steel tube for a thermocouple. The test samples were processed in low thermal mass stainless steel foil, coated with boron nitride and protected against oxidation in the UMSA chamber with an inert argon atmosphere. Controlled heating to 780 °C was performed at a rate of 0.4 oC/s, followed by isothermal holding at 780 °C for 5 min and natural cooling to 50 °C at a rate of 0.2 °C/s. Since 780 °C was found insufficient for hypereutectic alloys, these chemistries were re-run using 850 °C as the maximum temperature for UMSA furnace setting. For each sample, the heating/cooling cycles were conducted at least three times to verify a repeatability of readings.
The Heat-Flux Differential Scanning Calorimetry, DSC STA 449C Jupiter, NETZSCH-Gerätebau GmbH, Selb, Germany, fitted with NETZSCH Proteus Thermal Analysis Software version 4.8.4, was used as another thermal analysis tool. Samples with sizes of 2.5 mm in diameter and 2 mm in thickness were contained within closed alumina crucible under a protective atmosphere of argon and placed into a temperature-controlled DSC cell. A second crucible without sample was used as a reference. The maximum temperature setting for all alloys was 850 °C with equal heating and cooling rates of 0.2 °C /s. DSC Heat Flow (for Heat Capacity determination) was calibrated before each and every test, as obligated by the ASTM E1269 standard, using synthetic Sapphire. The geometry and dimensions of samples for UMSA and DSC are specified in Figure 1. The UMSA and DSC samples were sectioned from ingots with a diameter of 32 mm and height of 127 mm. Metallographic samples were prepared via a conventional surface preparation process starting from grinding to polishing. No etching was applied and as-polished surfaces were examined using a scanning electron microscope (SEM), LEO 440 Hitachi 3400-N.

3. Results

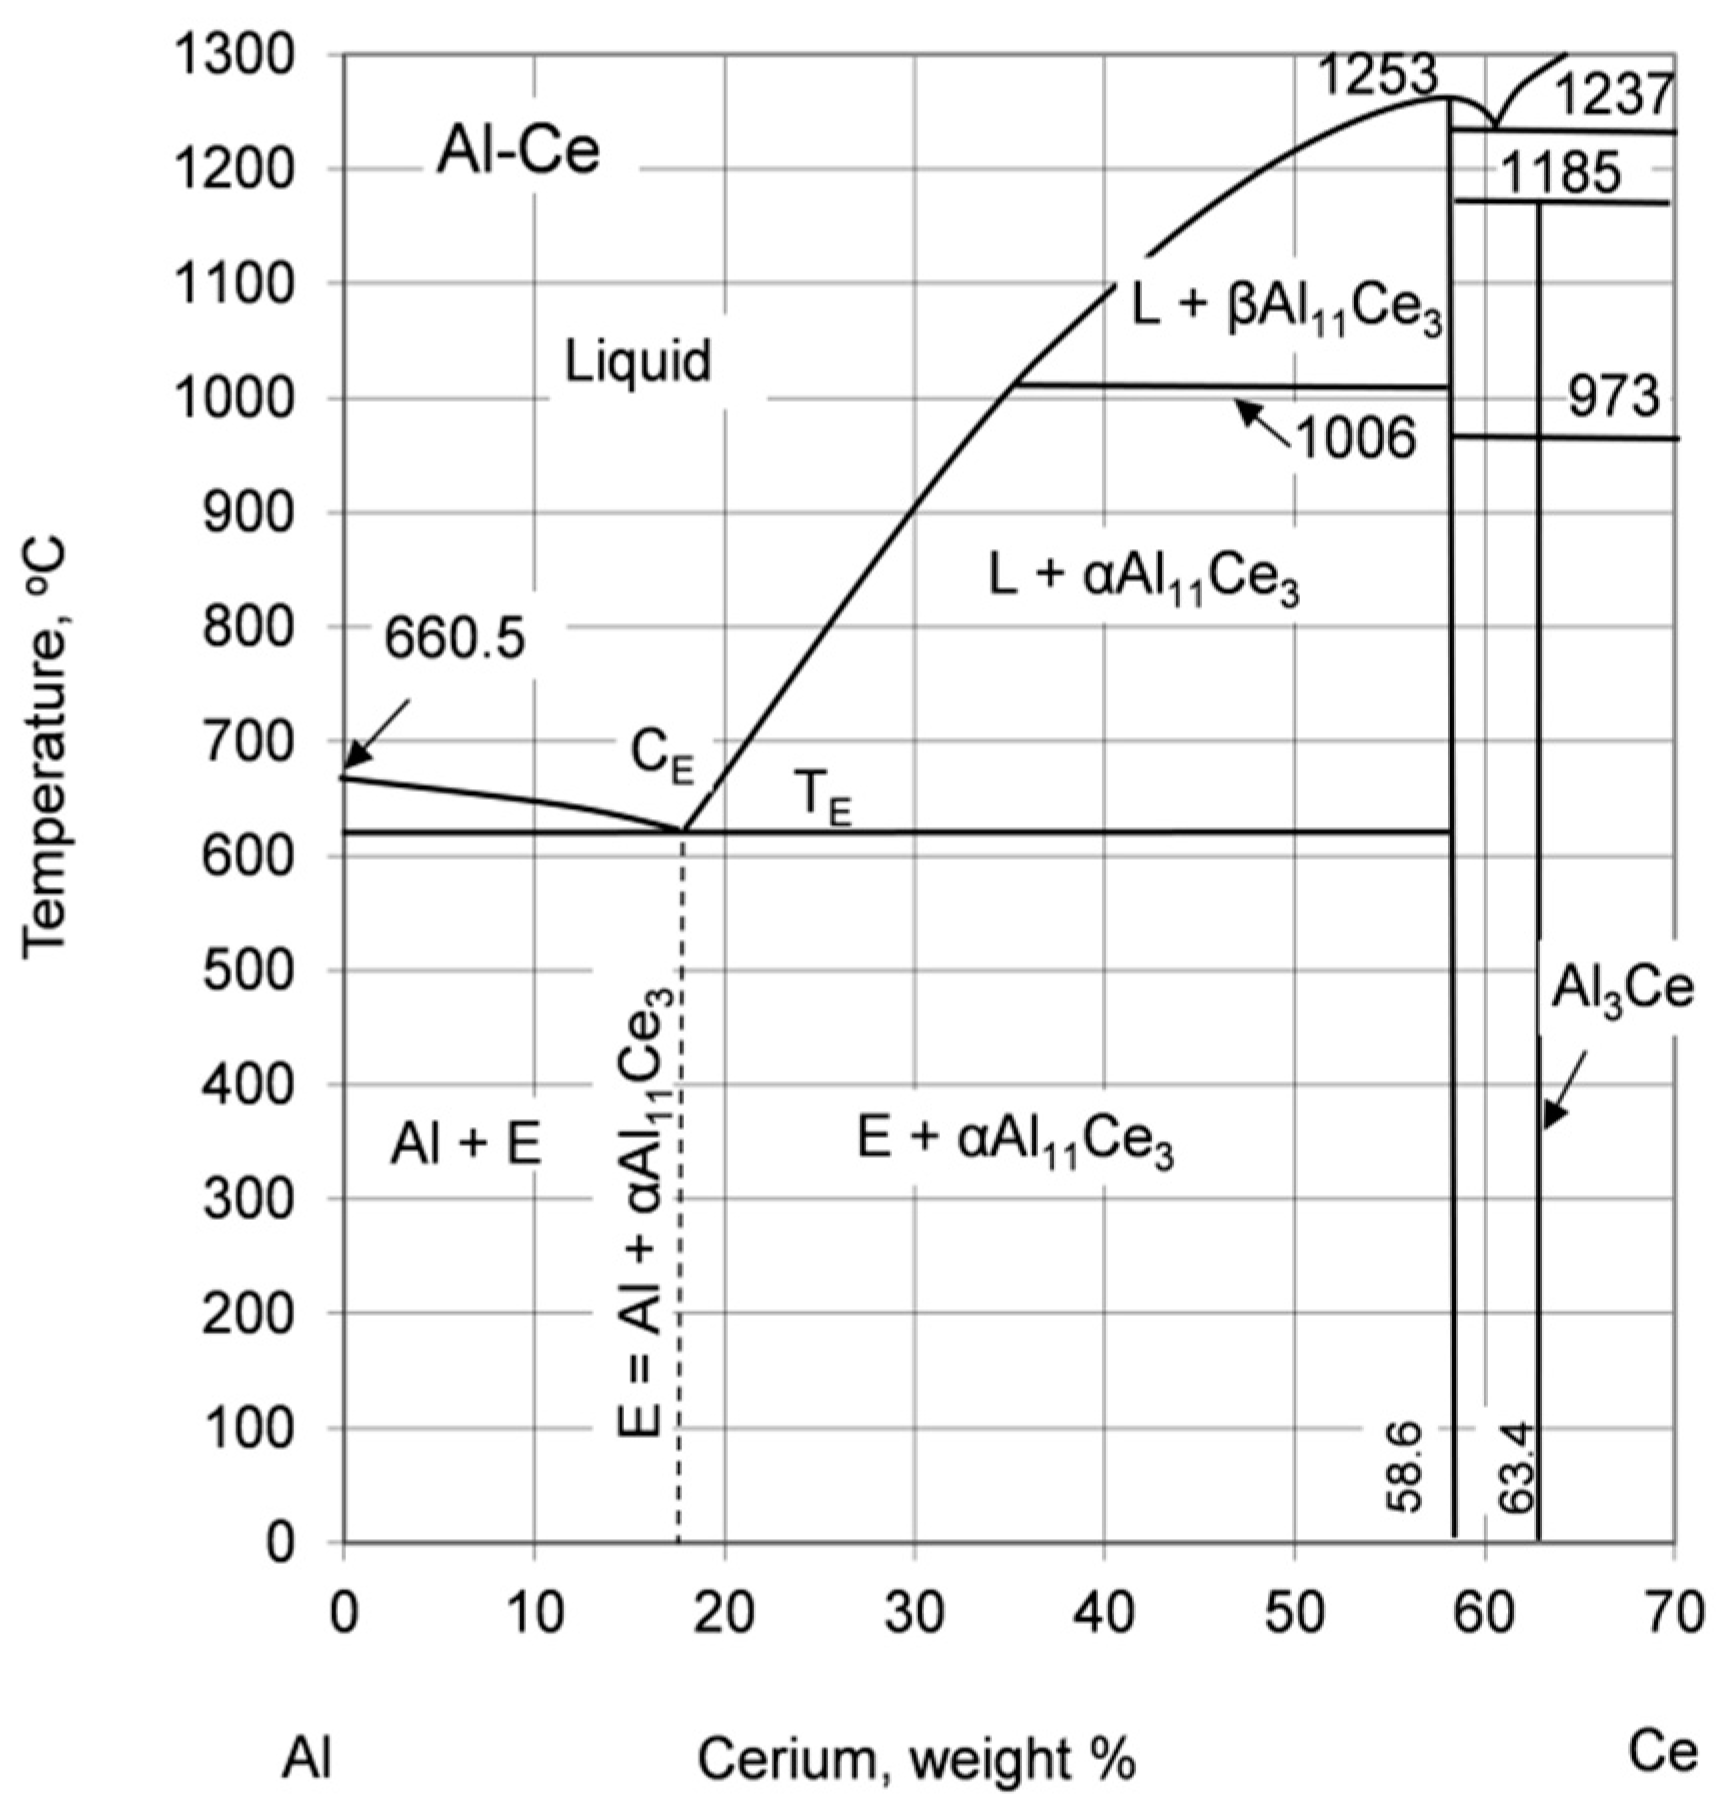
3.1. Al-Ce Phase Diagram and Location of Tested Alloys

The chemical compositions of alloys examined cover the hypo- and hypereutectic ranges of an Al-Ce phase diagram around the technologically important eutectic L → Al + αAl11Ce3 (Figure 2). As the eutectic phases of the above reaction, Al and αAl11Ce3, are commonly accepted in the literature. There are differences in high-temperature modifications of the Al11Ce3 phase with some sources supporting the idea that above 1006 °C the αAl11Ce3, orthorhombic oI28 phase transforms to βAl11Ce3 tetragonal tI10. According to other data [6], instead of βAl11Ce3 the Al4Ce, tetragonal tI10 phase, is reported. For simplicity, Al11Ce3 annotation is commonly used for αAl11Ce3. The key issue is, however, in coordinates of the eutectic point with discrepancies exceeding 20 °C and 10 wt. % of Ce [7,8].
Very limited data are available on the solid-state solubility of cerium in aluminum, being of importance for post-casting heat treatment and age hardening. There is a consensus that the solid-state solubility of Ce in Al is negligible. As a value, maximum of 0.01 at. % Ce (0.05 wt. % Ce) soluble in Al at the eutectic temperature of 640 °C was reported in [9]. This number was obtained by an extrapolation from the lower temperature solid-state solubility data provided earlier [10]. A computer-calculated version of the diagram predicts the cerium solubility in aluminum even lower at 0.0001 wt. % [11]. Hence, from an engineering perspective, both numbers support a practical lack of solubility.

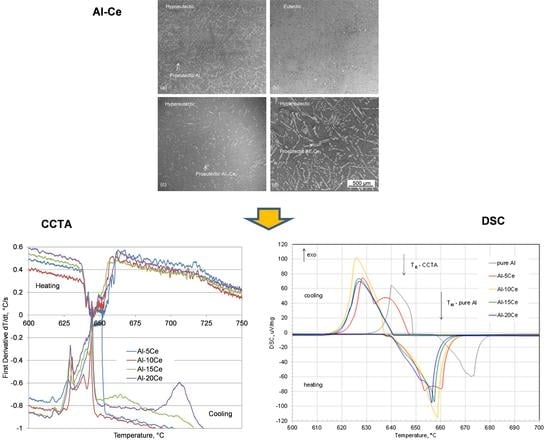
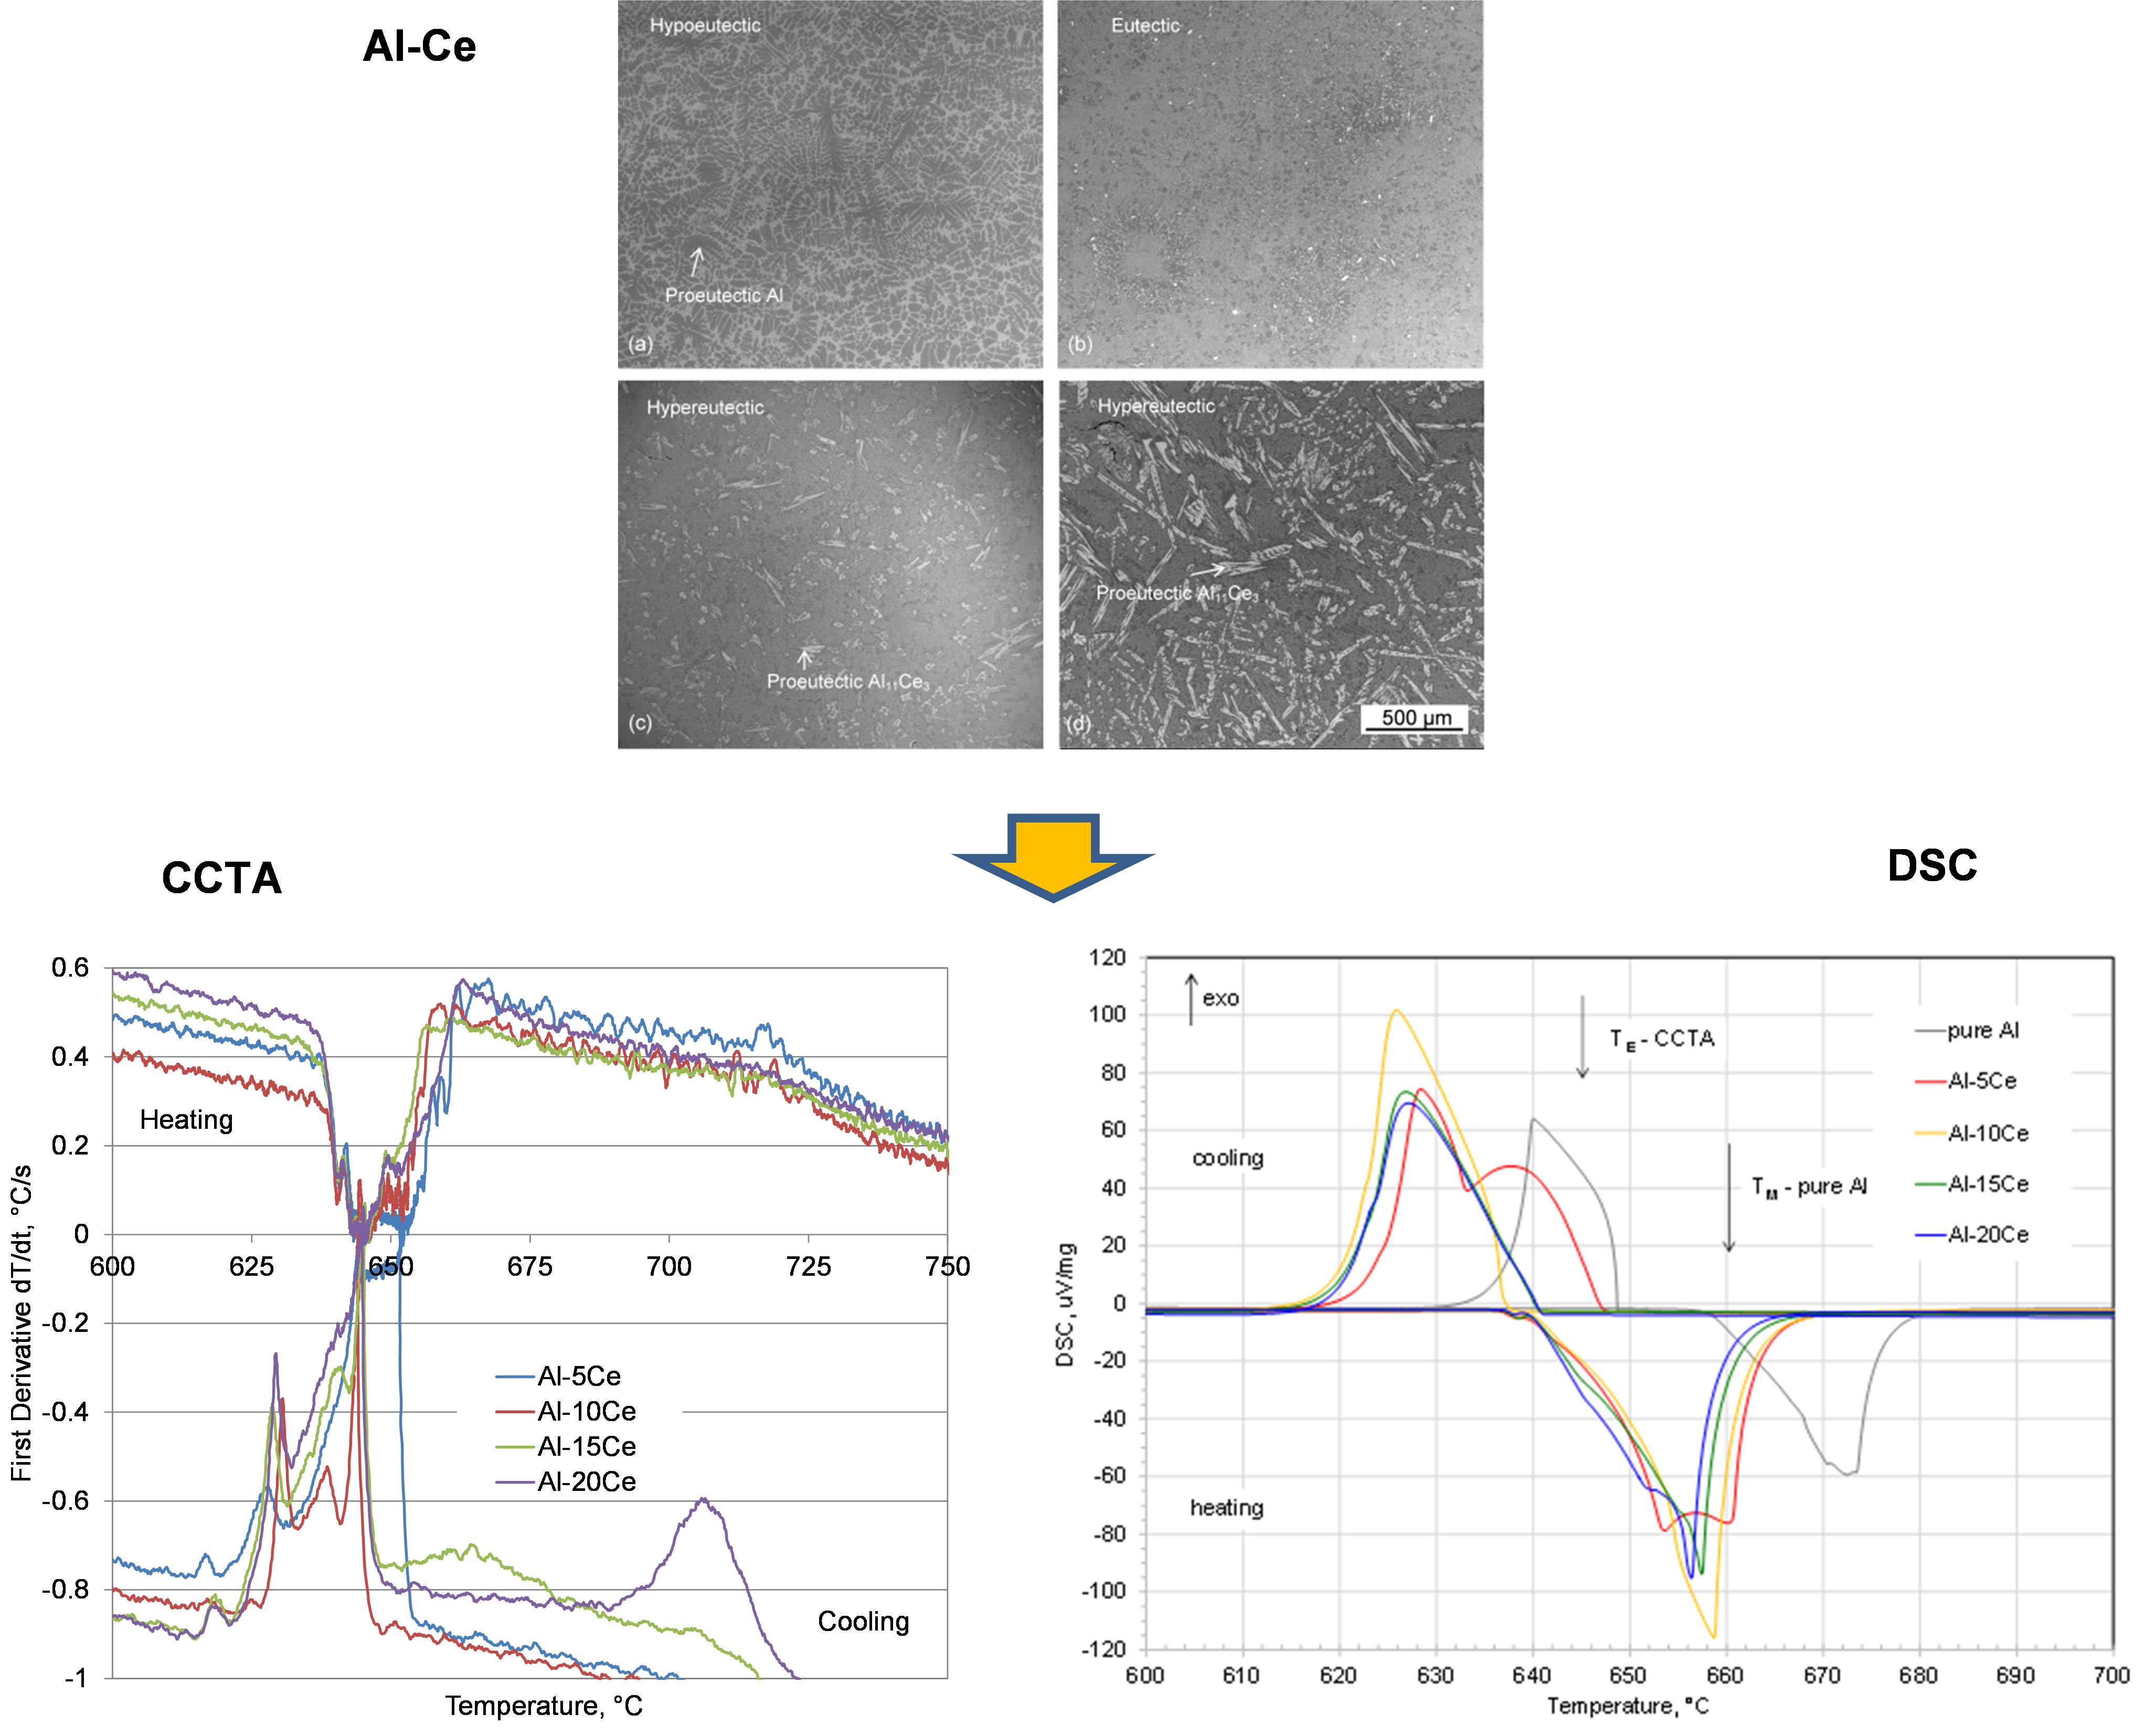
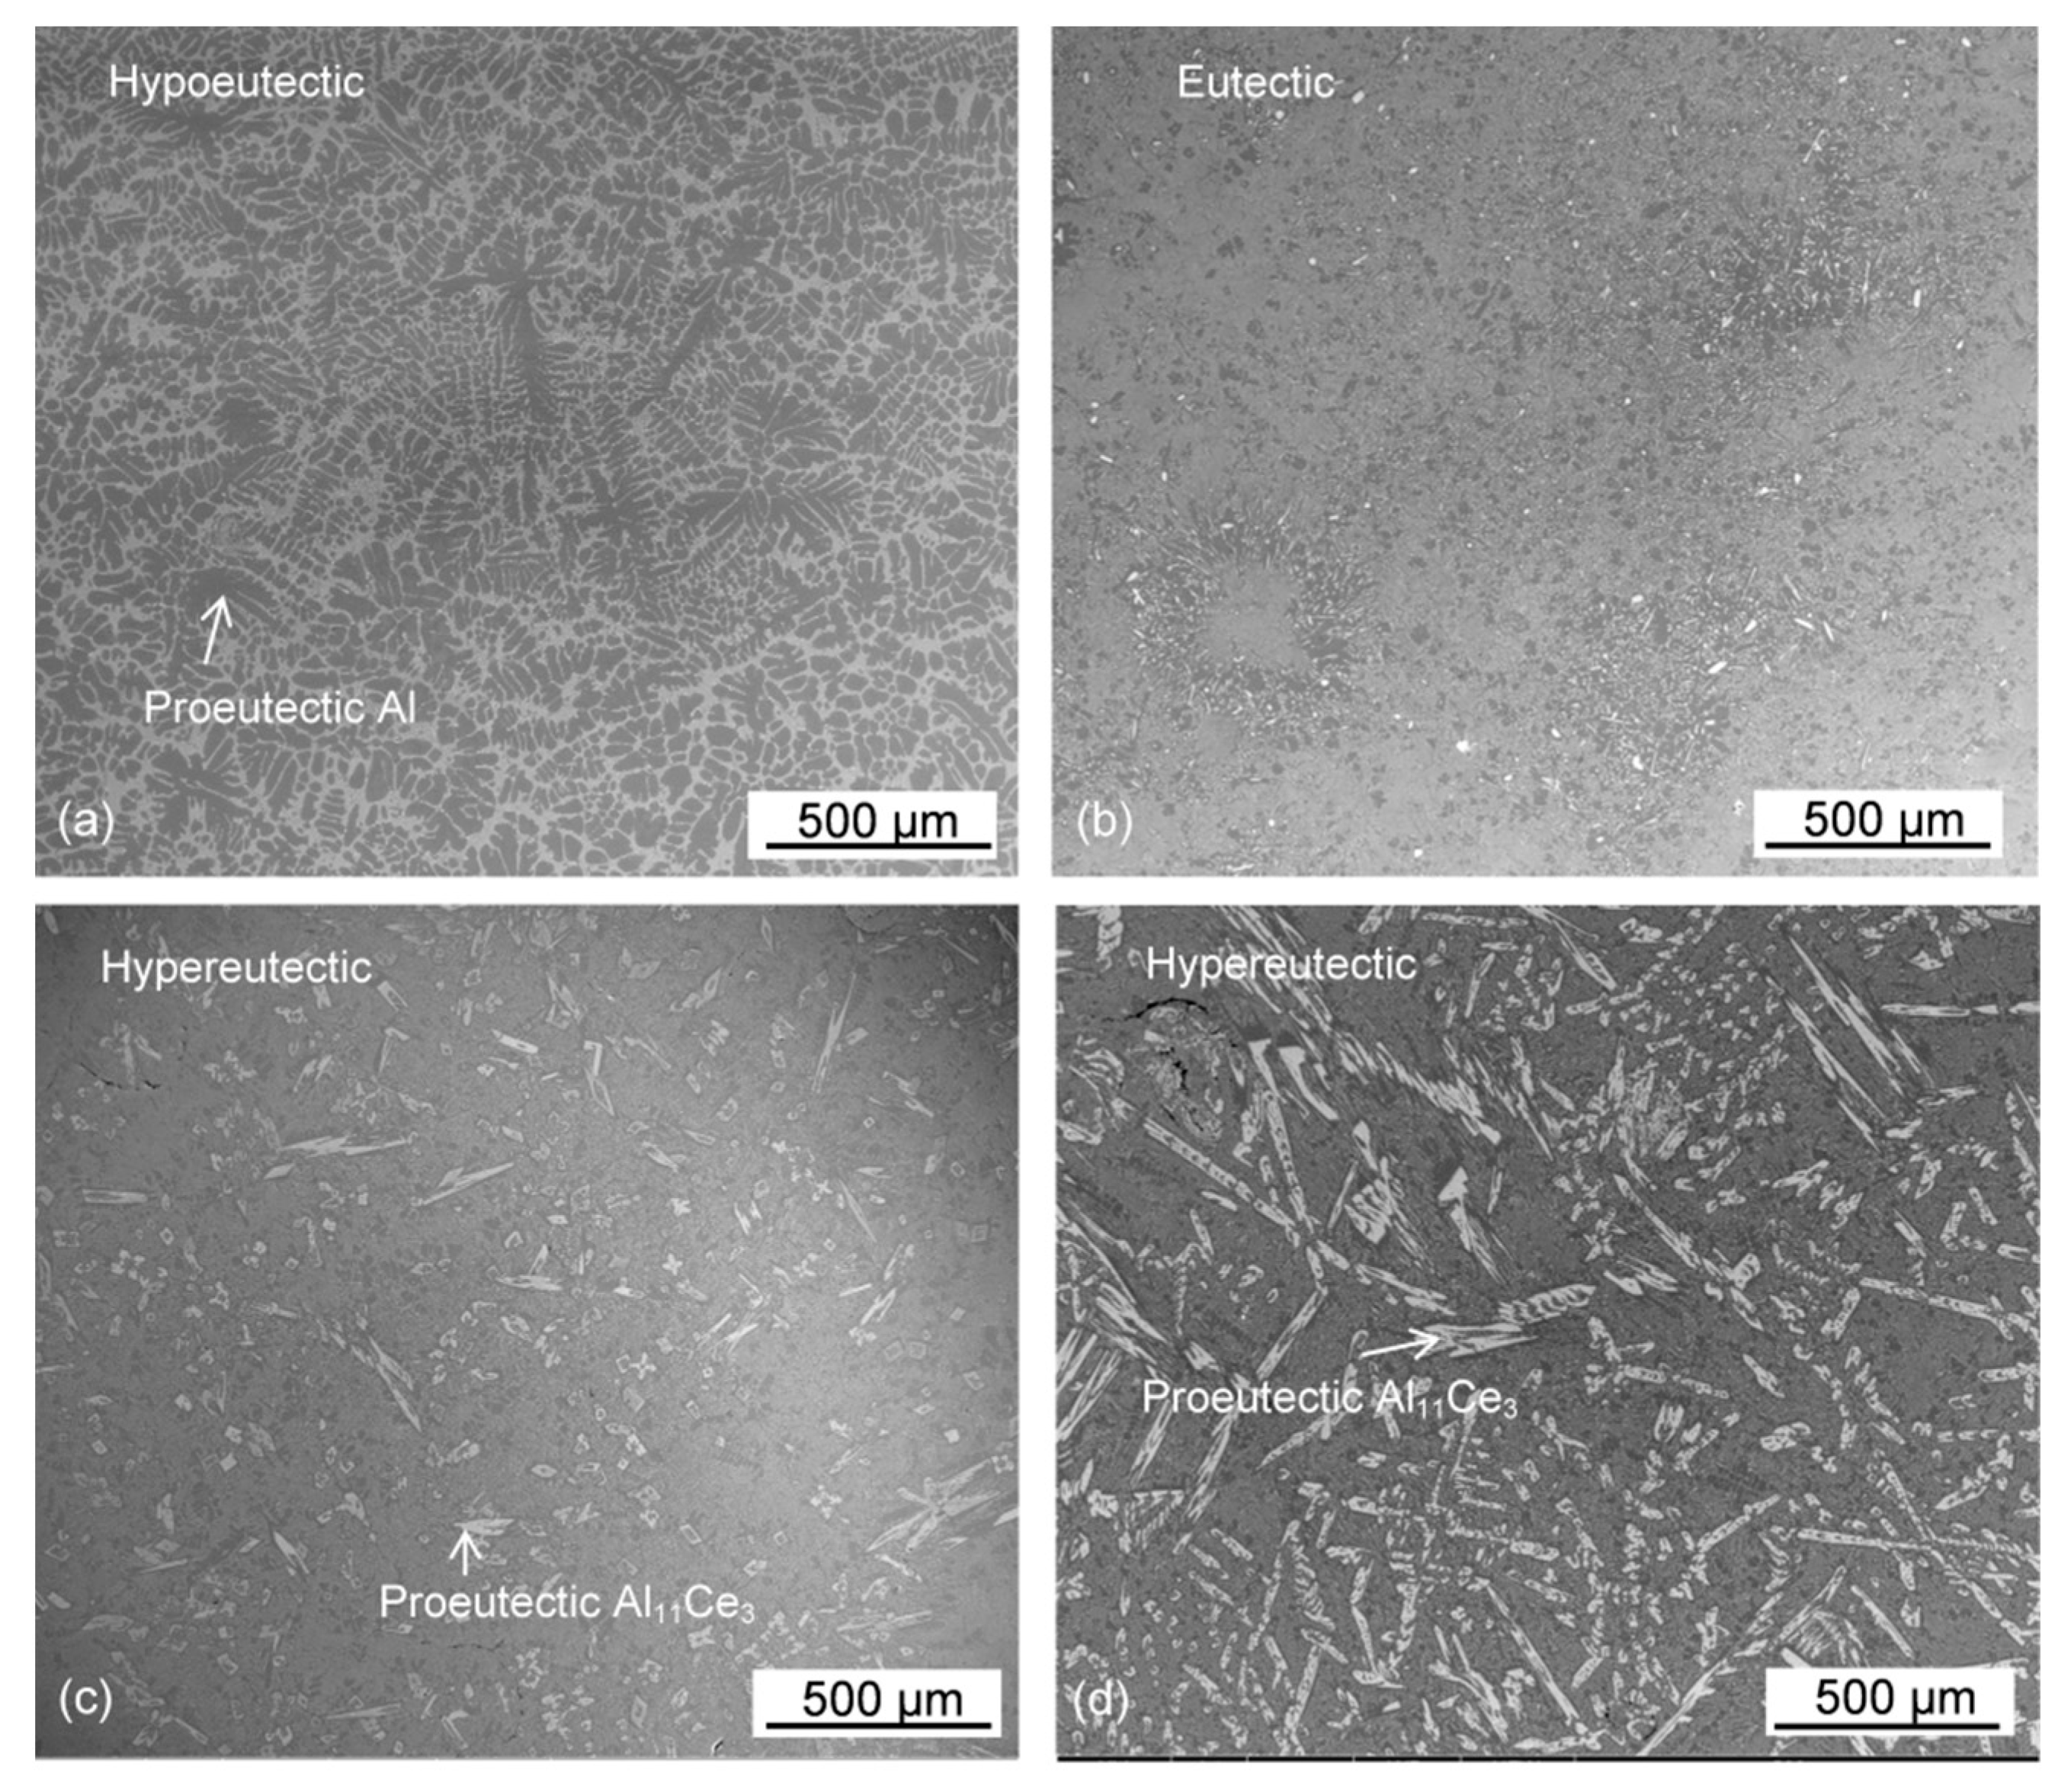
3.2. Solidification Microstructure: Effect of Ce Content

The solidification microstructures of Al-Ce alloys were directly influenced by the Ce content. For Al-5Ce, the microstructure was clearly hypoeutectic, where in addition to eutectic regions, the proeutectic Al dendrites that solidified first, are present (Figure 3a). Increasing the Ce content to 10 wt. % resulted in a disappearance of the proeutectic Al dendrites and practically 100% surface area of polished sections was covered by the eutectic (Figure 3b). Further increasing the Ce content to 15 wt. % led to formation of the proeutectic Al11Ce3 phase, seen as having a white image contrast (Figure 3c). At low magnifications, it had a shape of truncated rods with a square cross section and a length exceeding 200 µm. The contribution of the proeutectic Al11Ce3 phase increased markedly for Al-20Ce (Figure 3d). A symmetric arrangement of individual compound rods suggests a certain crystallographic orientation relationship between the matrix and the proeutectic Al11Ce3 phase.

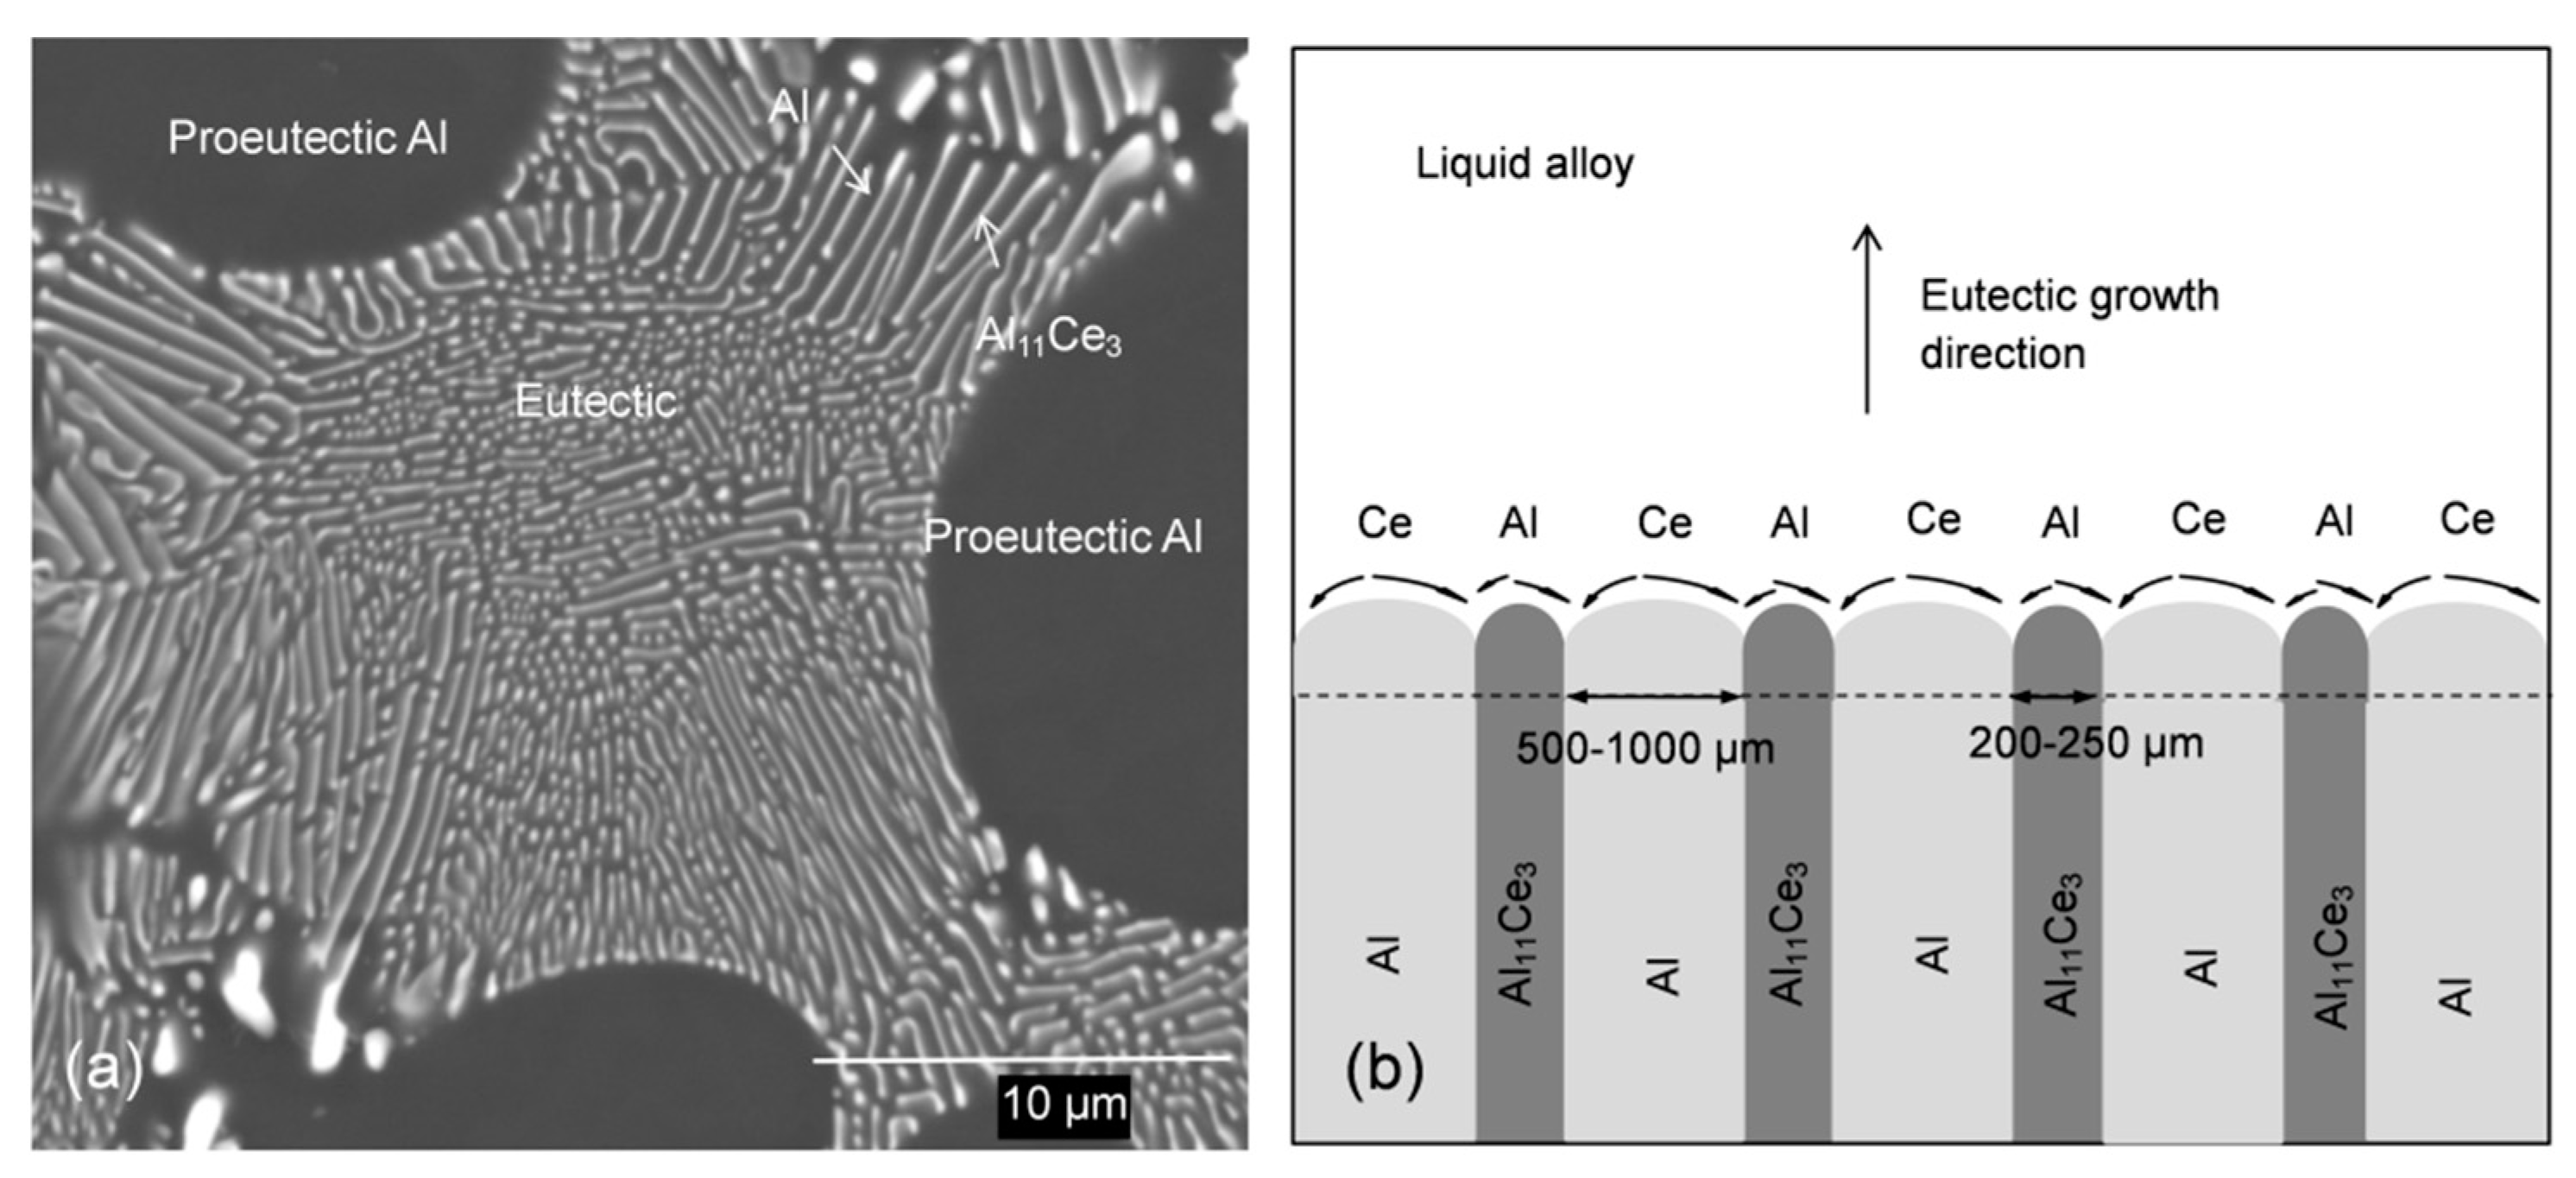
3.3. Eutectic Transformation and Product Morphology

The key phase transformation for the chemical compositions examined was the eutectic reaction with its product shown in Figure 4a. For hypoeutectic and eutectic alloys the solidified eutectic had a well-developed lamellar morphology with differently oriented lamellae colonies, intersecting the polished section surface. There were some changes of the eutectic morphology with increasing Ce content, in particular during the transient to hypereutectic compositions. For those alloys the proeutectic Al11Ce3 phase affected the morphology of the eutectic Al11Ce3 phase, which deviated from the lamellae, towards more complex truncated shapes. The schematic of eutectic formation with growth direction and diffusion of Al Ce in the liquid alloy, ahead from the moving solid-liquid interface is shown in Figure 4b. The dimensions of the Al11Ce3 and Al lamellae, portrayed there, were determined earlier through high-magnification imaging [5].

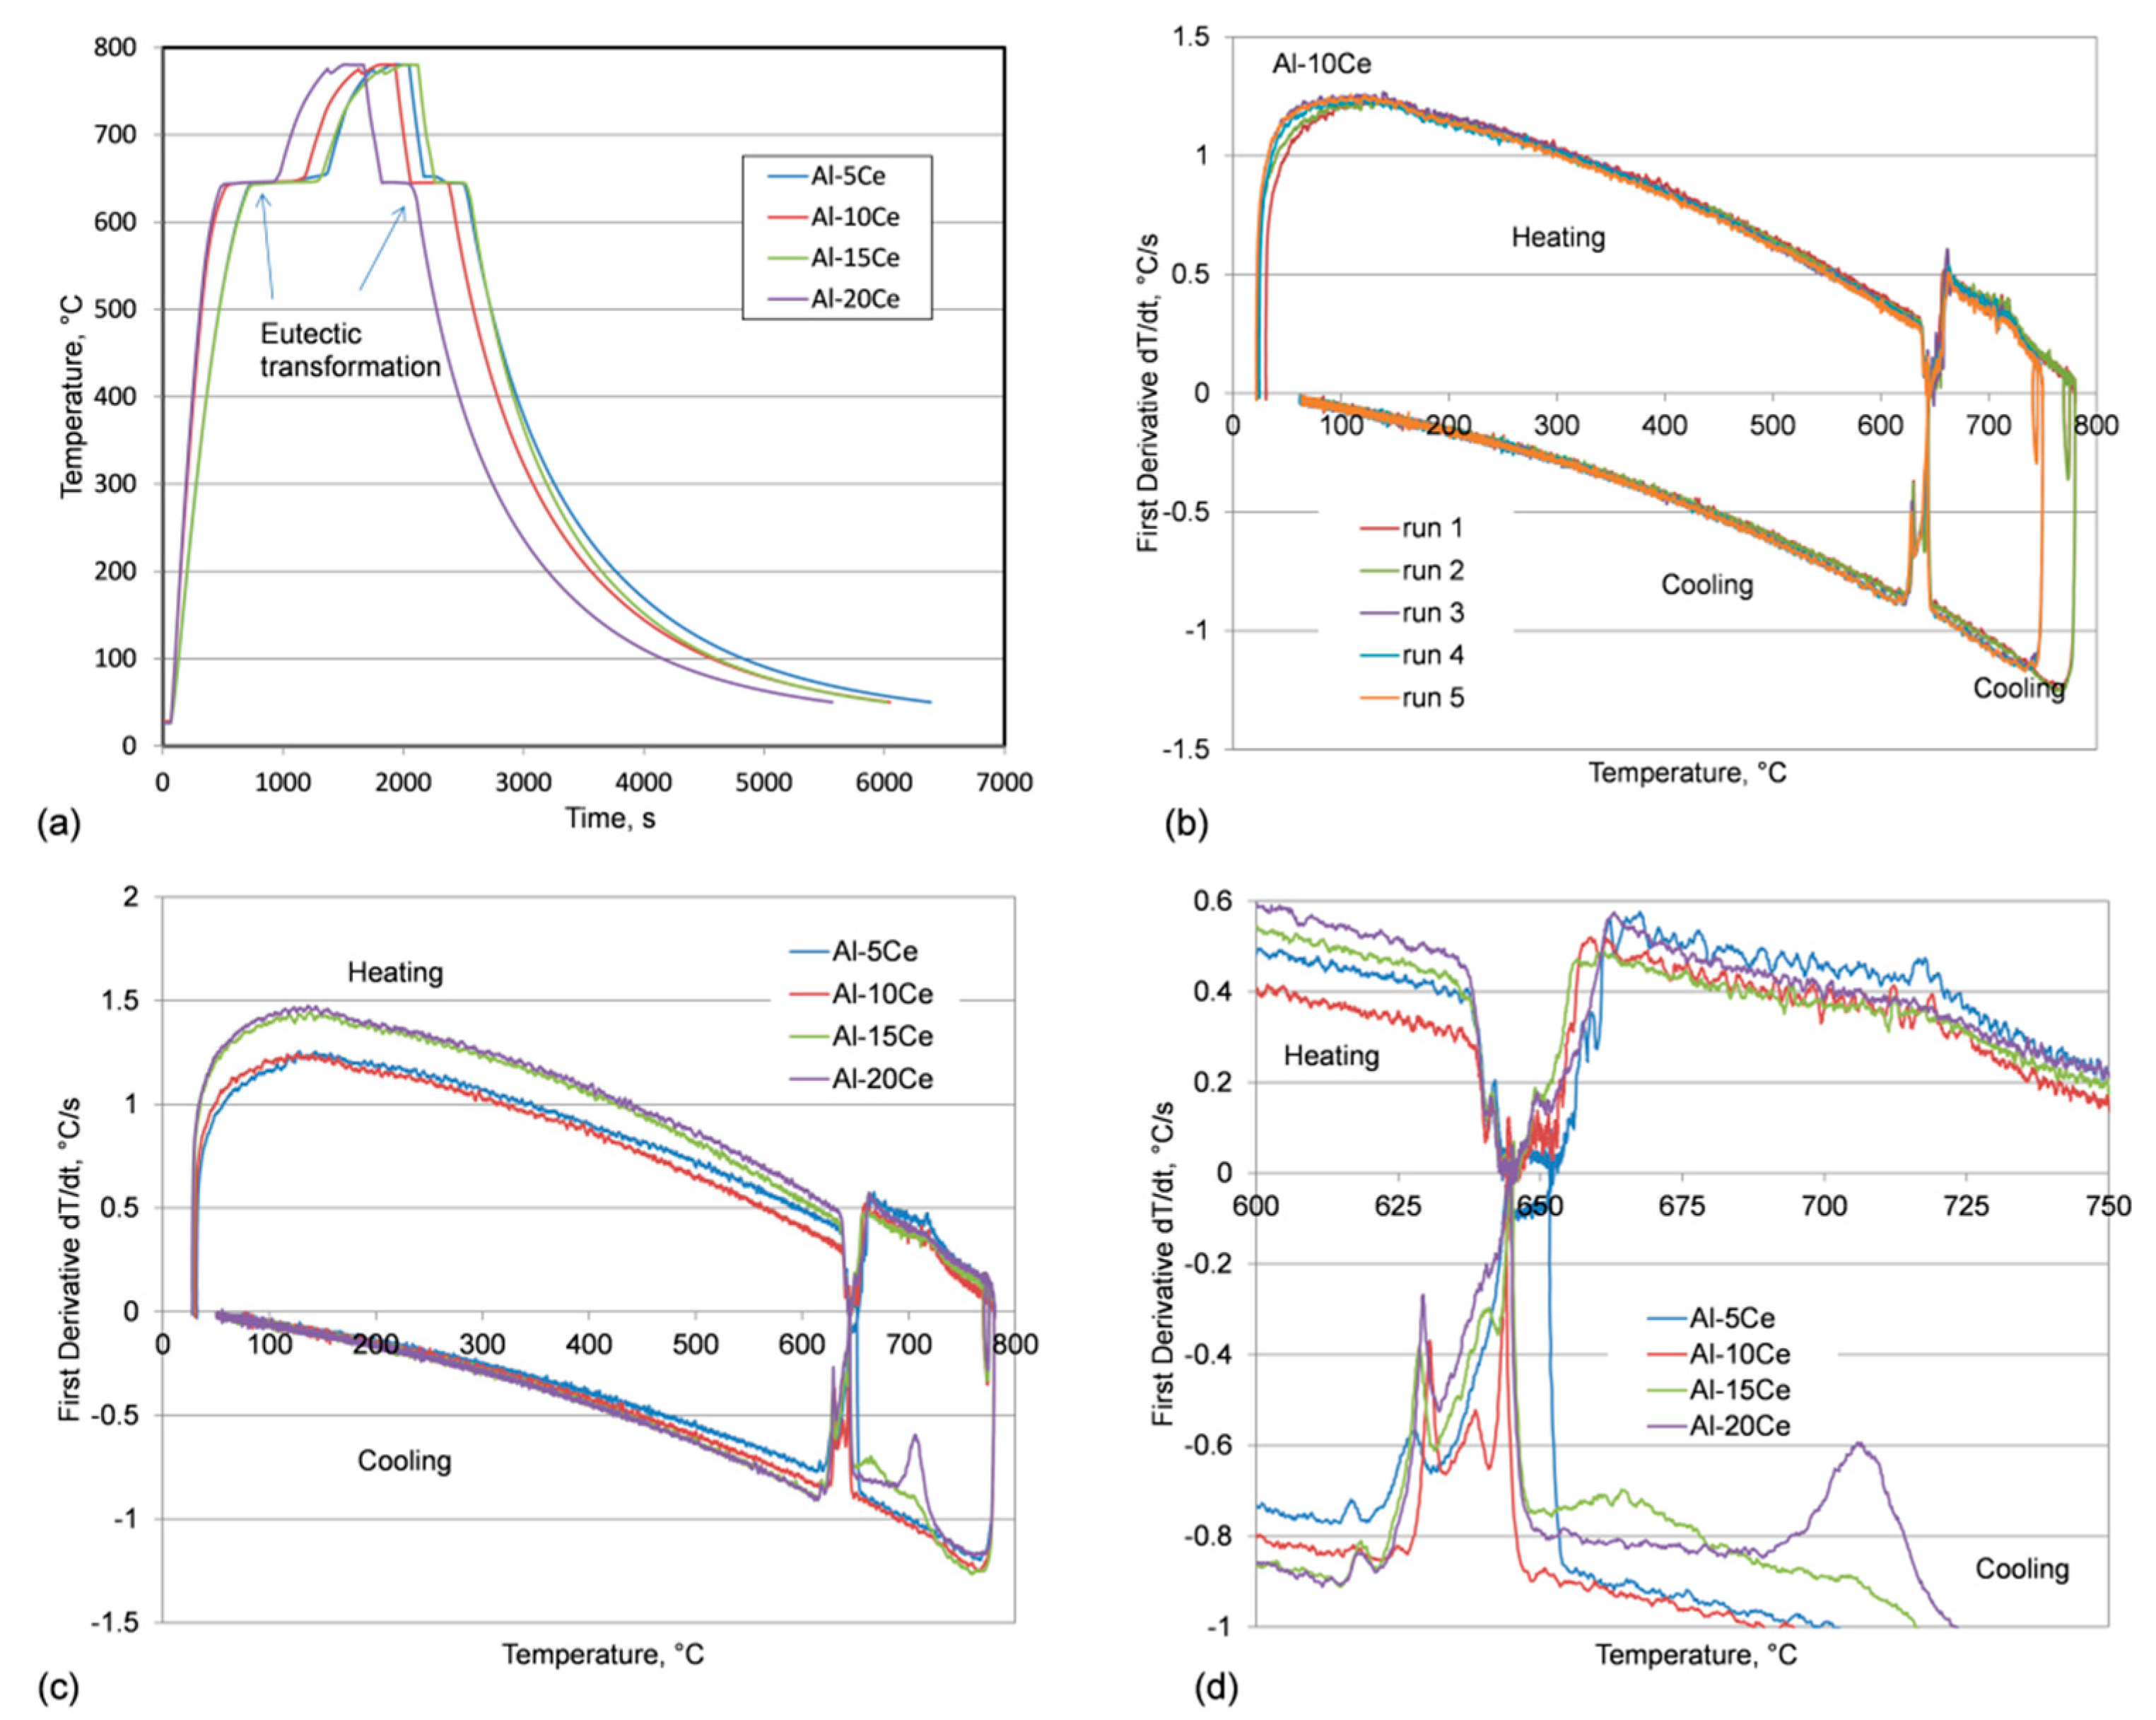
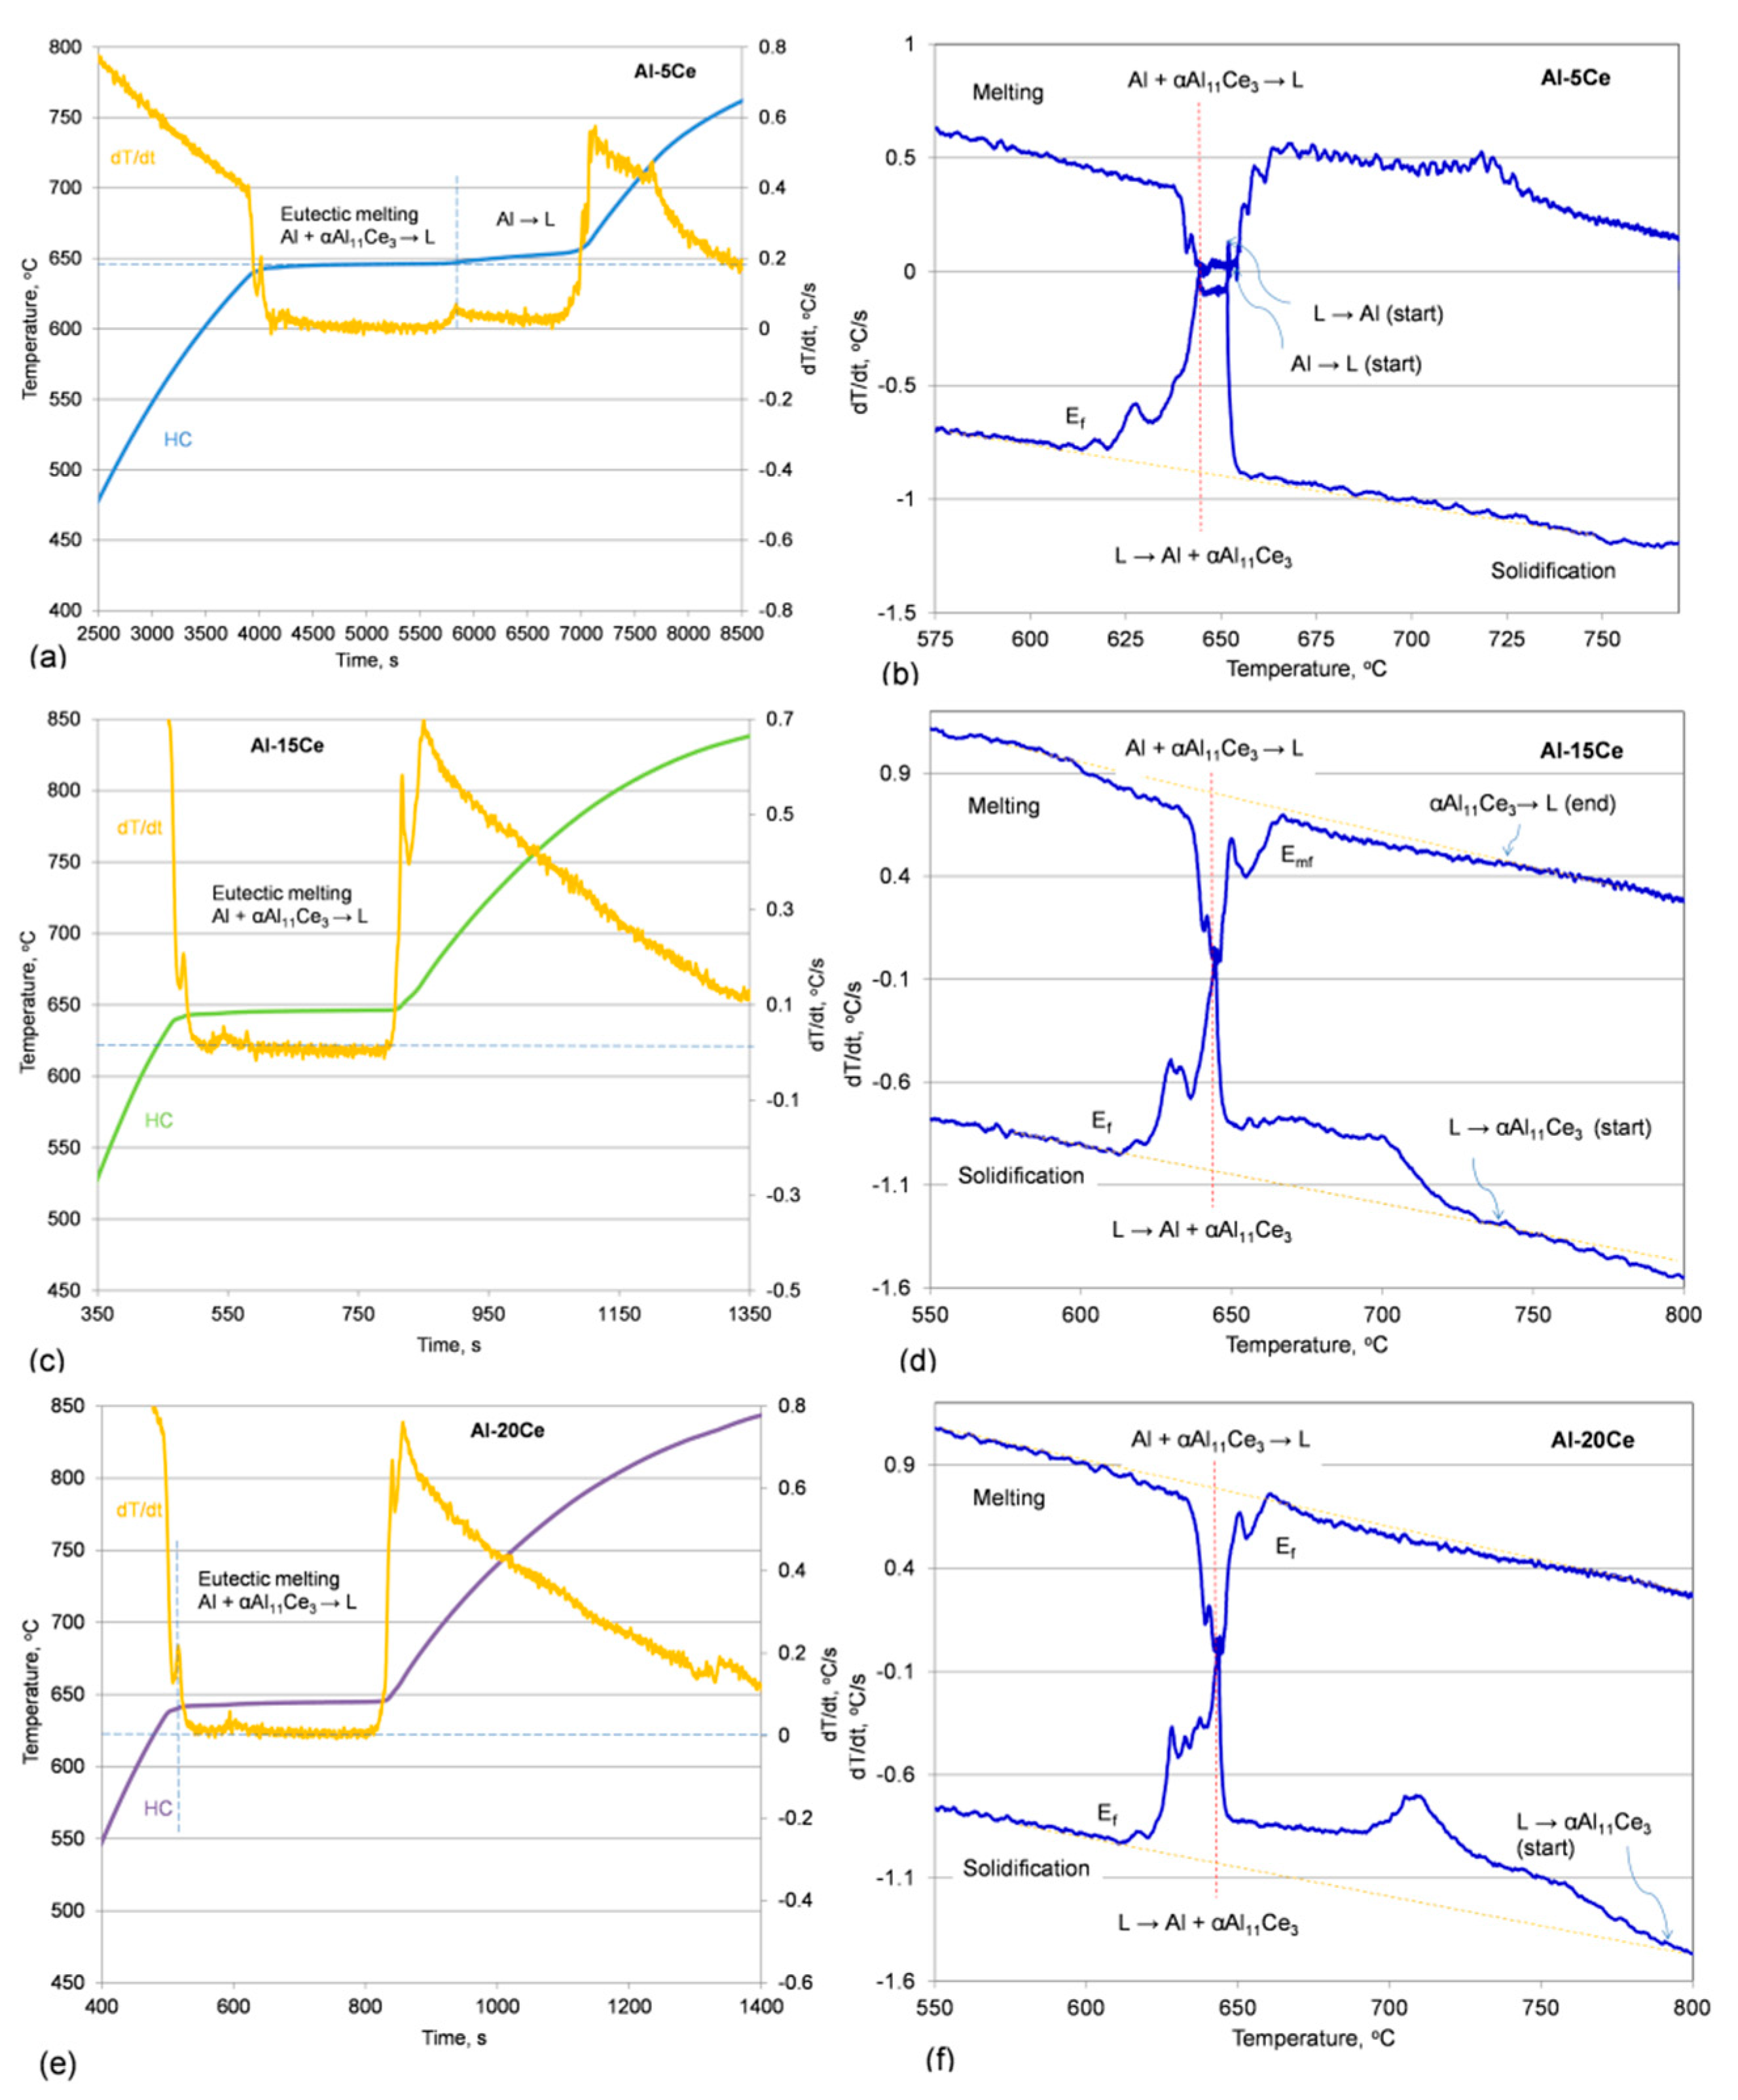
3.4. Cooling/Heating Curves Thermal Analysis

3.4.1. Effect of Ce Content on Alloy Melting and Solidification Characteristics

The complete UMSA heating and cooling cycles for all alloy compositions examined are shown in Figure 5a. It should be noticed that the essential plateau for heating and for cooling was located at the same temperature. This means that the heating and cooling rates used were slow enough to not cause the substantial shift in transformation temperatures. To verify the reproducibility of UMSA measurements, several heating/cooling runs were conducted for each alloy. As shown in Figure 5b, the first derivatives dT/dt, plotted as a function of temperature, are superimposed on each other, supporting the good reproducibility.
The set of derivative curves dT/dt for different Ce contents is shown in Figure 5c. To emphasize closely the eutectic transformation, the dT/dt curves were magnified in a vicinity of the eutectic temperature (Figure 5d). Although the temperature versus time plots exhibited evident plateau, related to the eutectic transformation, the first derivative dT/dt curves show many distinct peaks. This also applies to the Al-10Ce alloy with the exact eutectic composition. In order to understand meanings of individual peaks, the dT/dt plots were correlated with the solid fraction variations during solidification and melting.

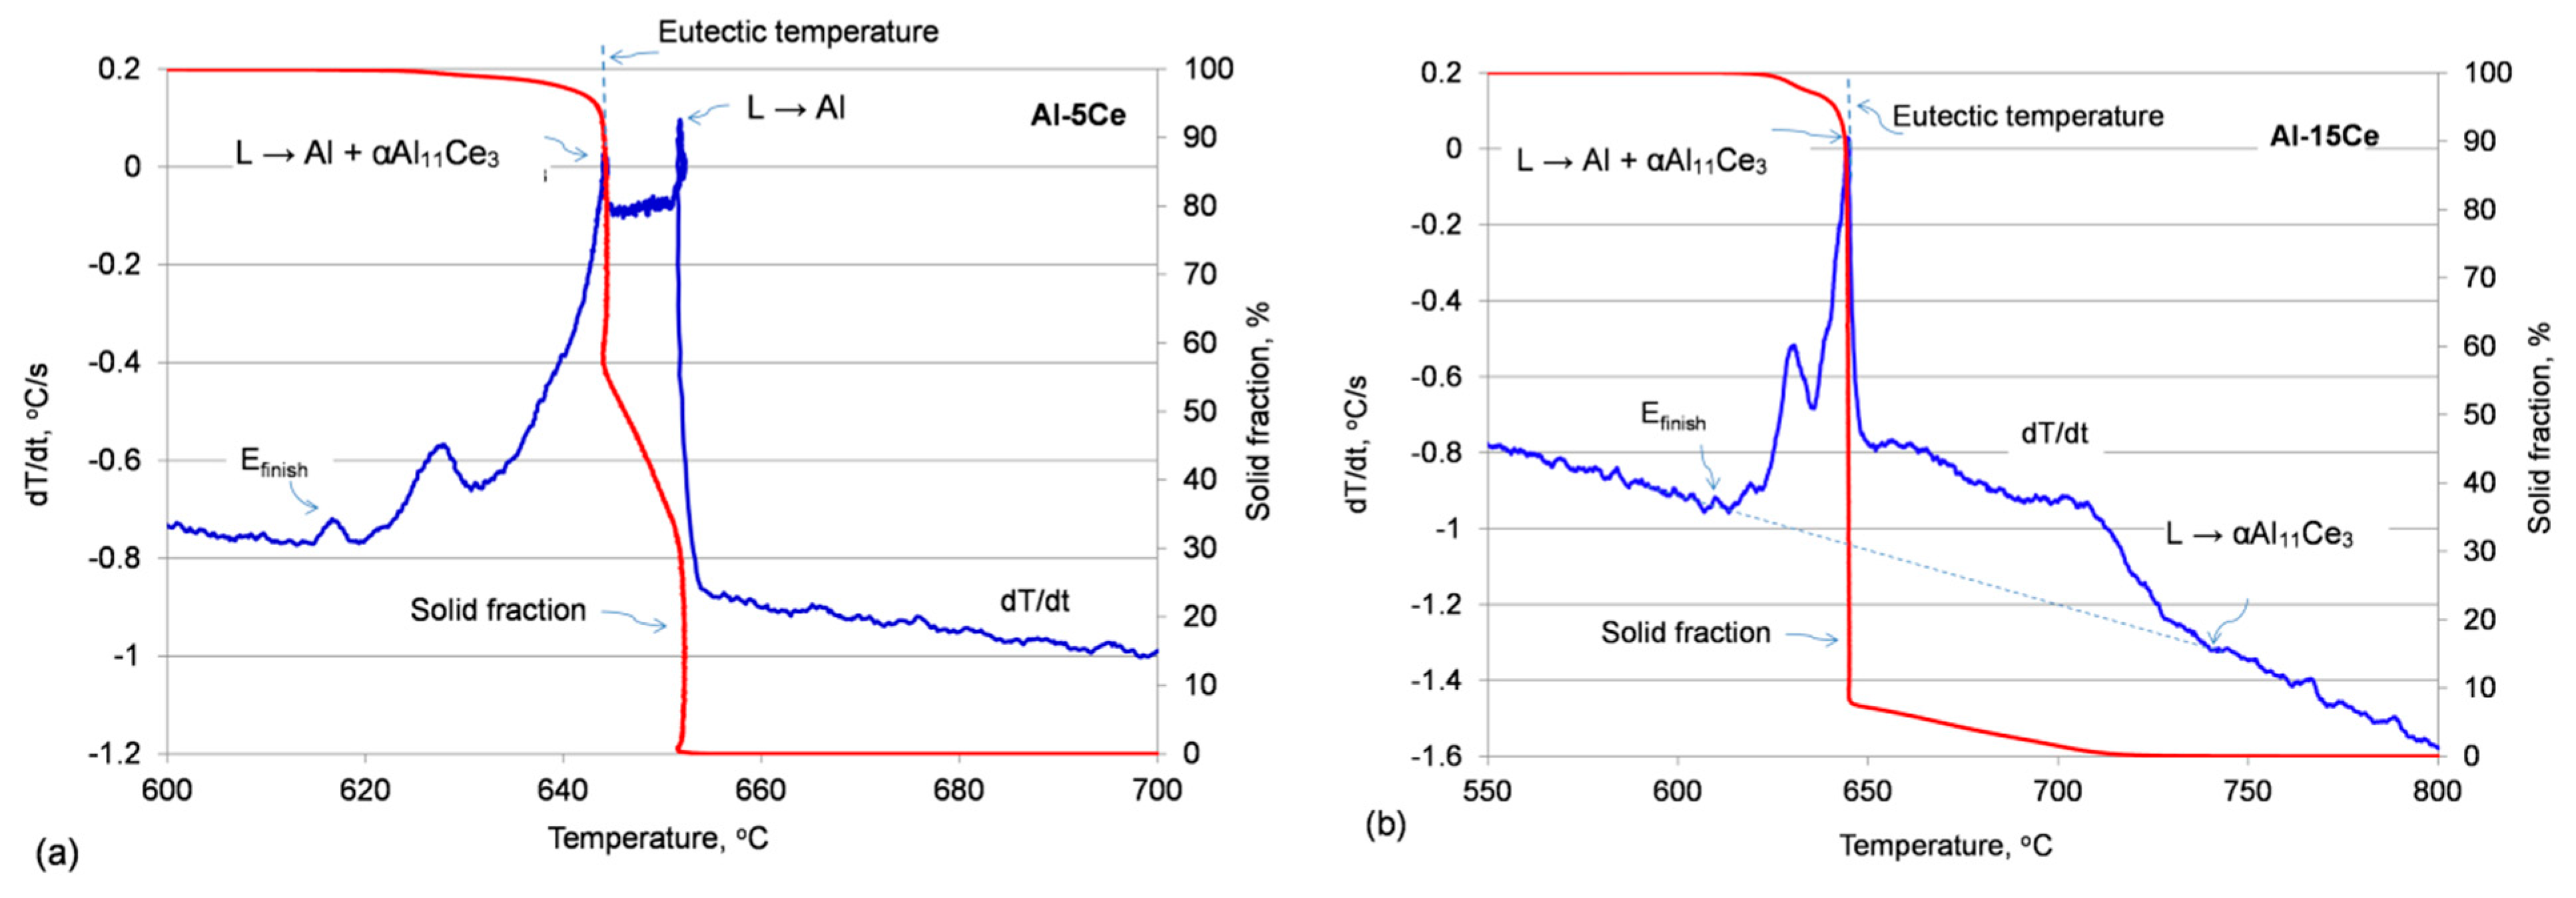
3.4.2. Fraction Solid and Solidification Pathways

To determine the detailed pathway of alloy melting/solidification the progress of solid fraction versus temperature fs is critical. A fraction solid fs is proportional to the amount of latent heat that evolved during solidification. Some direct and indirect methodologies used to determine the solid fraction evolution with their advantages and limitations, specific to certain applications, are summarized in [12]. Since models are developed based on fundamental solidification data of simple alloys, they should apply well to the Al-Ce binary system, used in this study [13].
The solid fraction versus temperature plots, combined with the first derivative plots, allow to assess the alloy transformation during melting/solidification. For the Al-5Ce alloy, having a hypoeutectic nature, the first peak of dT/dt is associated with a beginning of solidification of the proeutectic Al phase at 651.5 °C (Figure 6a). After fraction solid reached 52%, the eutectic growth started, which corresponds to distinct peak on derivative dT/dt and a temperature of 644 °C. This peak is aligned with the beginning of the second step plateau on the cooling curve, shown above in Figure 5a. As seen in Figure 6a, the eutectic transformation was not completed at the eutectic temperature but a small liquid fraction of about 4% continued to solidify under non-equilibrium conditions at temperatures up to 20 °C below the equilibrium level.
The solidification pathway for the hypereutectic Al-15Ce alloy is shown in Figure 6b. Before reaching the eutectic temperature, about 8% liquid fraction transformed into the proeutectic Al11Ce3 phase. The solidification of the Al11Ce3 phase started at 742 °C. The process continued until the eutectic solidification took over at 645 °C. For Al-15Ce, the remaining 4–8% of liquid fraction continued the non-equilibrium solidification until 618 °C.

3.4.3. Melting Versus Solidification Characteristics

Transformations during heating should, in principle, be deduced by reversing the reactions recorded during solidification. In practice, however, despite the low heating/cooling rates, there are differences that require experimental verifications. A selection of thermal effects recorded during melting a solidification of Al-Ce alloys is shown in Figure 7a–f. To compare melting and solidification, the derivative dT/dt curves, plotted as a function of temperature, are presented along with plots of temperature and first derivative dT/dt versus time. Although for all compositions the major plateau that is associated with eutectic melting, Al + αAl11Ce3 → L, is located at the same temperature of 644–645 °C, a tiny fraction of each eutectic melted earlier at a temperature of around 630 °C. The tiny step, seen at the beginning of the temperature versus time plateau, is a measure of the involved solid fraction. It is of interest that both the temperature and dT/dt derivative plots did not reveal the end of some proeutectic reactions during melting cycles, i.e., liquidus temperatures.
For the Al-5Ce alloy, having the hypoeutectic composition, isothermal melting of the eutectic started the process, which was followed by melting of the proeutectic Al phase. The plot of temperature versus time in Figure 7a indicates the narrow temperture gap between the solidus and liquidus for that composition. As shown in Figure 7b, for the cooling cycle, the derivative curve dT/dt developed a distinct peak indicating the eutectic transformation at 645 °C with smaller peaks extended to a temperature below 620 °C. The different scenario is shown through the upper curve dT/dt, which represents melting the hypoeutectic structure upon heating. Although the major peak at 645 °C coincides with its equivalent during cooling, there are smaller peaks at both lower and higher temperatures. These peaks indicate that the eutectic melting started at temperature as low as 635 °C and ended at around 655 °C. As explained above, the solid fractions subjected to melting at these deviated temperatures were very small.
There were also differences between thermal effects recorded during melting and solidification of hypereutectic alloys. For Al-15Ce, the plot of temperature and first derivative dT/dt did not reveal effects that could be assocciated with the end of melting of the proeutectic Al11Ce3 phase (Figure 7c). As portrayed through the plot of dT/dt versus temperature in Figure 7d, such a thermal effect was clearly present around 740 °C during the solidfication cycle. The same finding was revealed for the Al-20Ce alloy where the eutectic solidification took plase at the tempeature of 644 °C with small fraction solidifying under non-equilibrium temperatures, around 620 °C (Figure 7d). During melting, small solid fractions of the alloy started melting at 637 °C and continued until 655 °C. It should be pointed out that in the Al-20Ce alloy, the Al11Ce3 proeutectic phase remained solid well above 655 °C and there is no clear thermal effect indicating the end of its melting. When compared with the solidification cycle, the end of the Al11Ce3 melting should take place around 790 °C (Figure 7f).

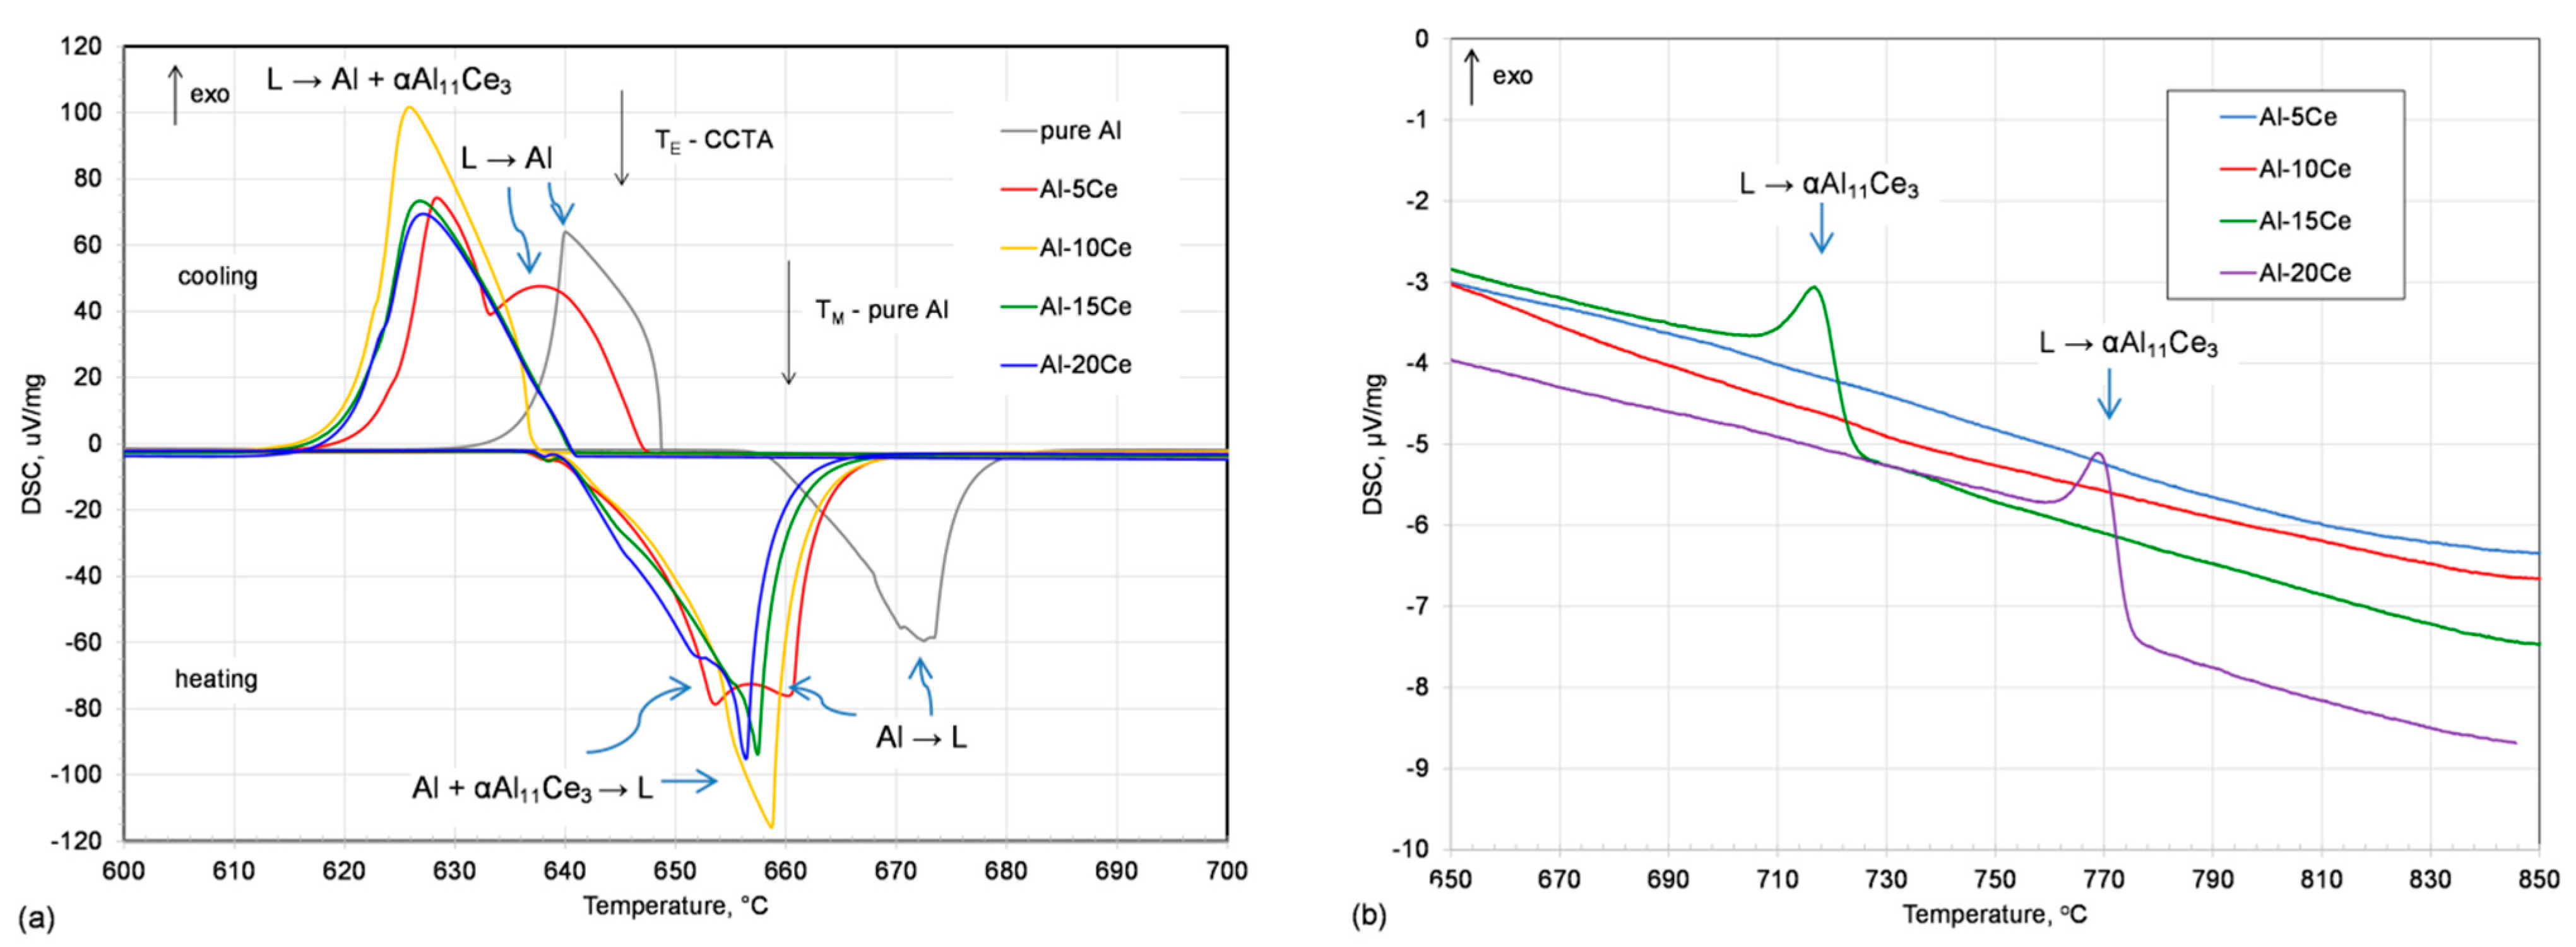
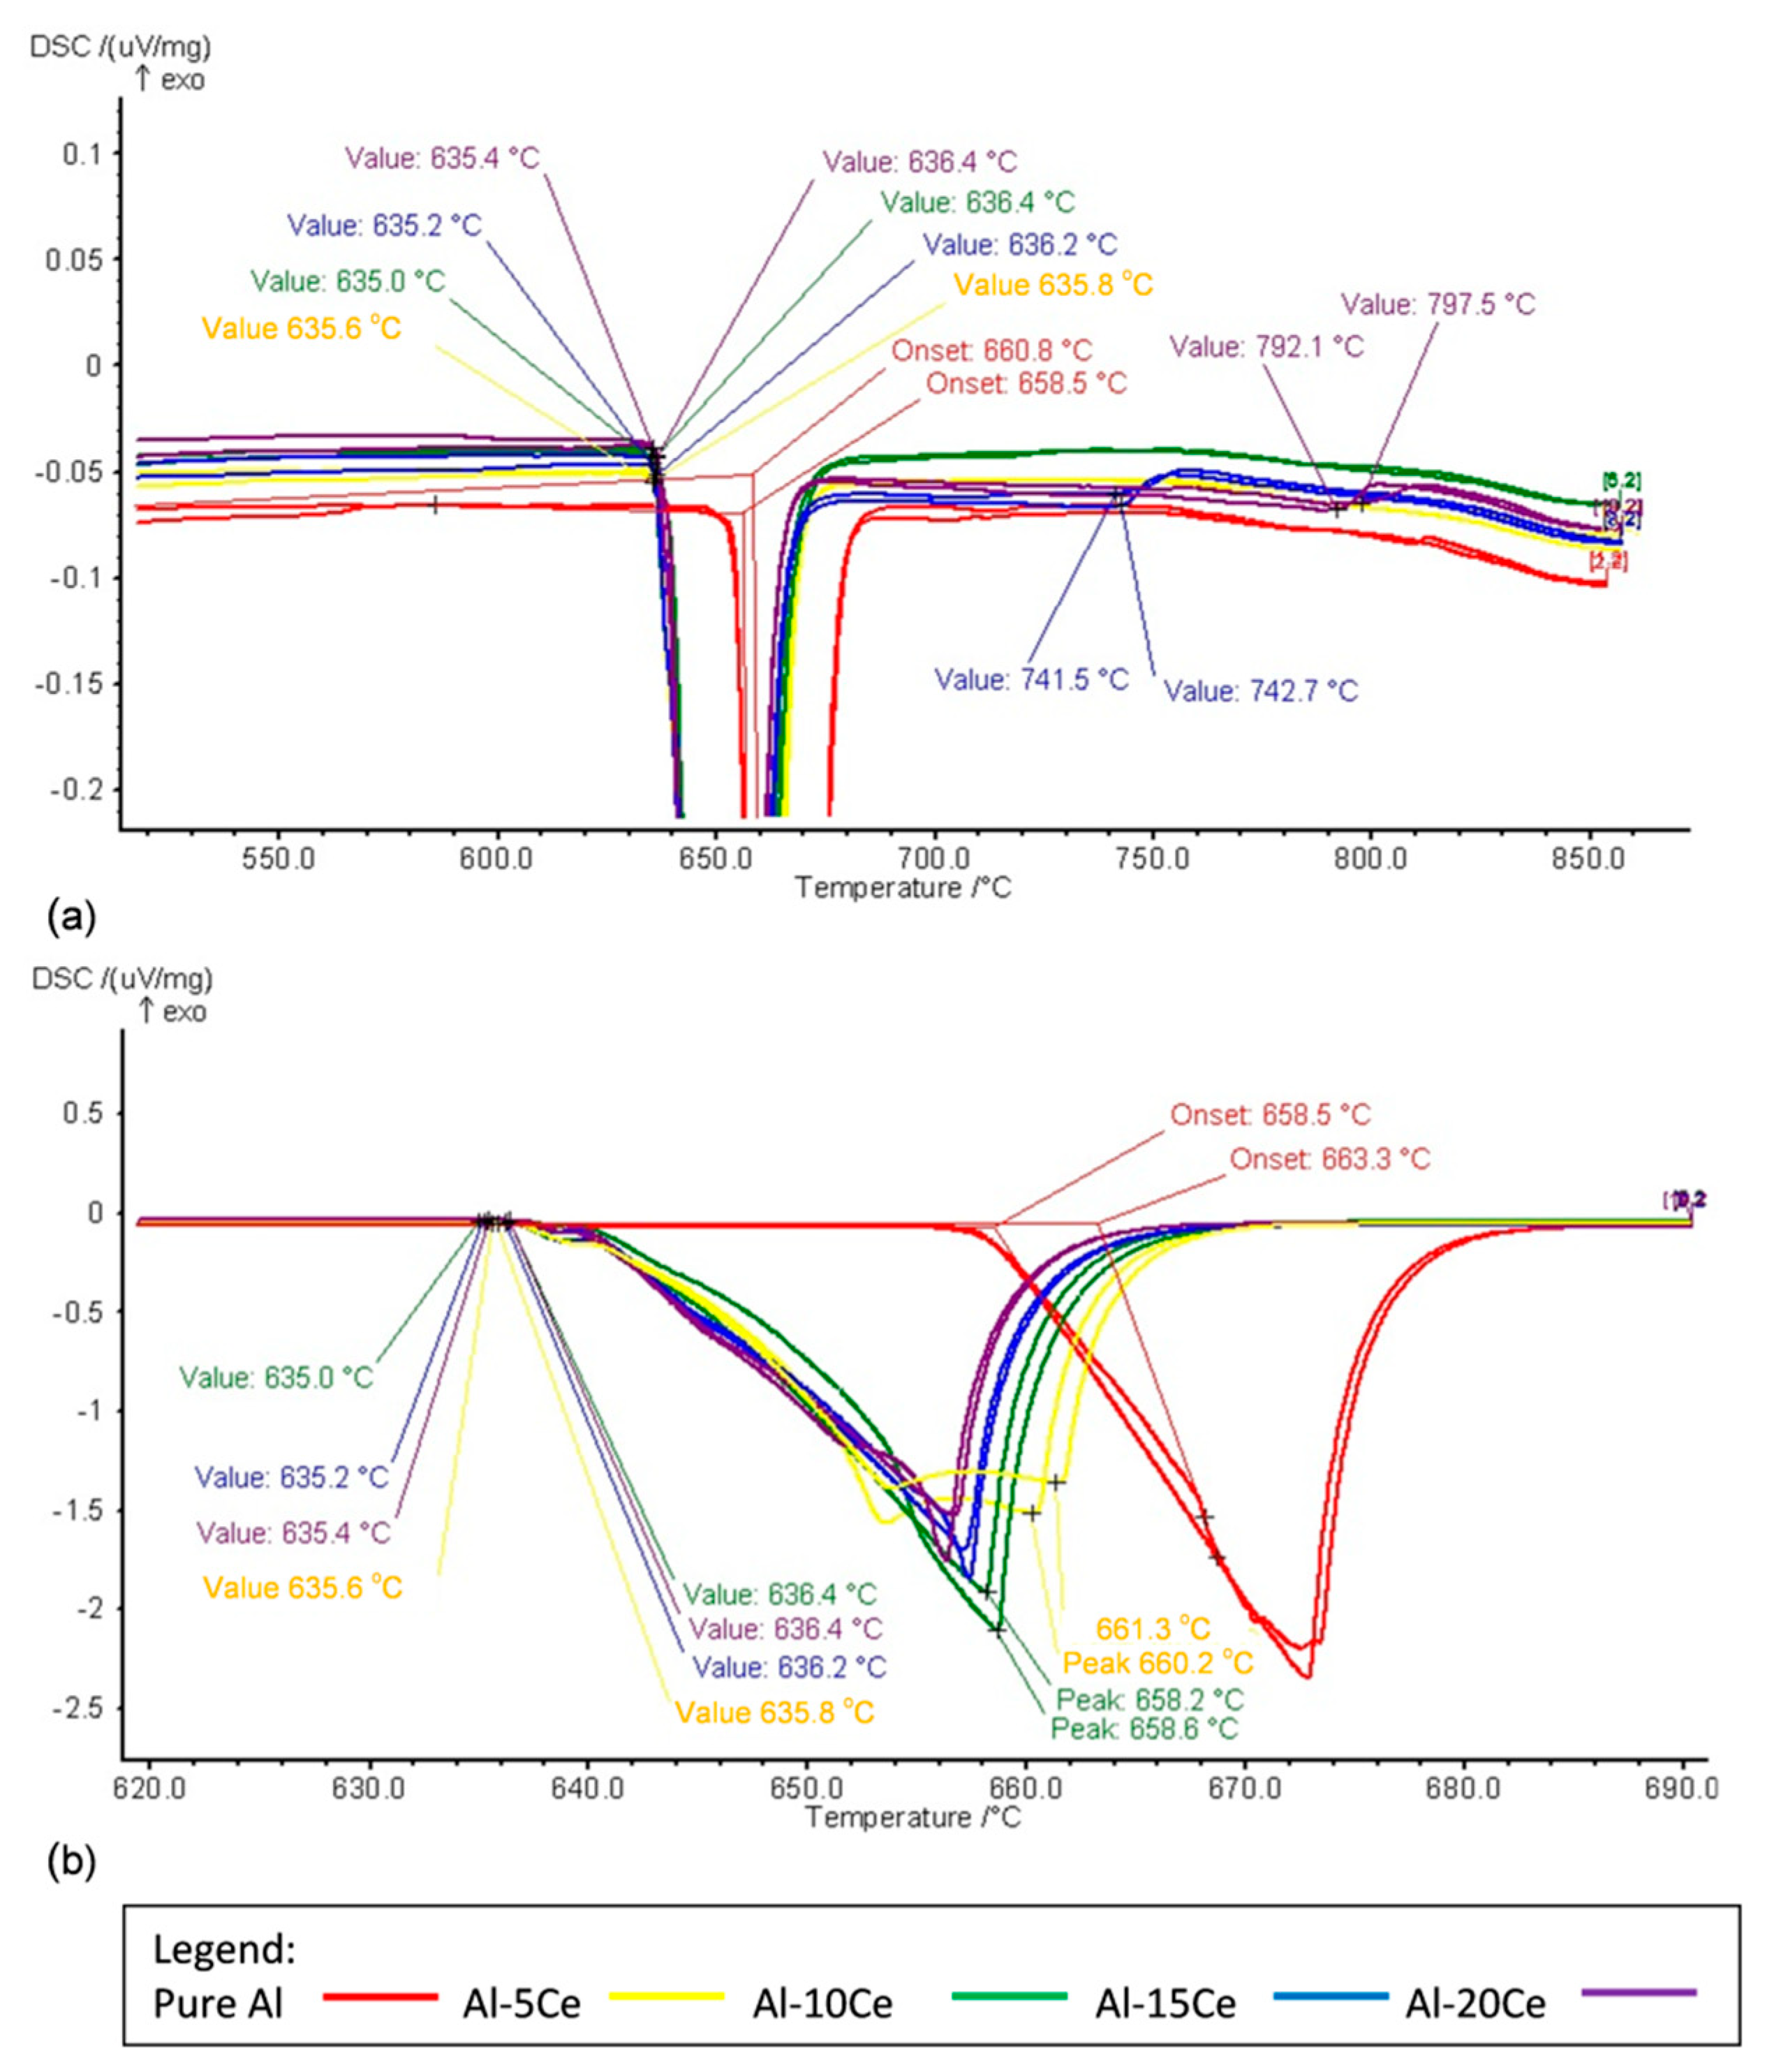
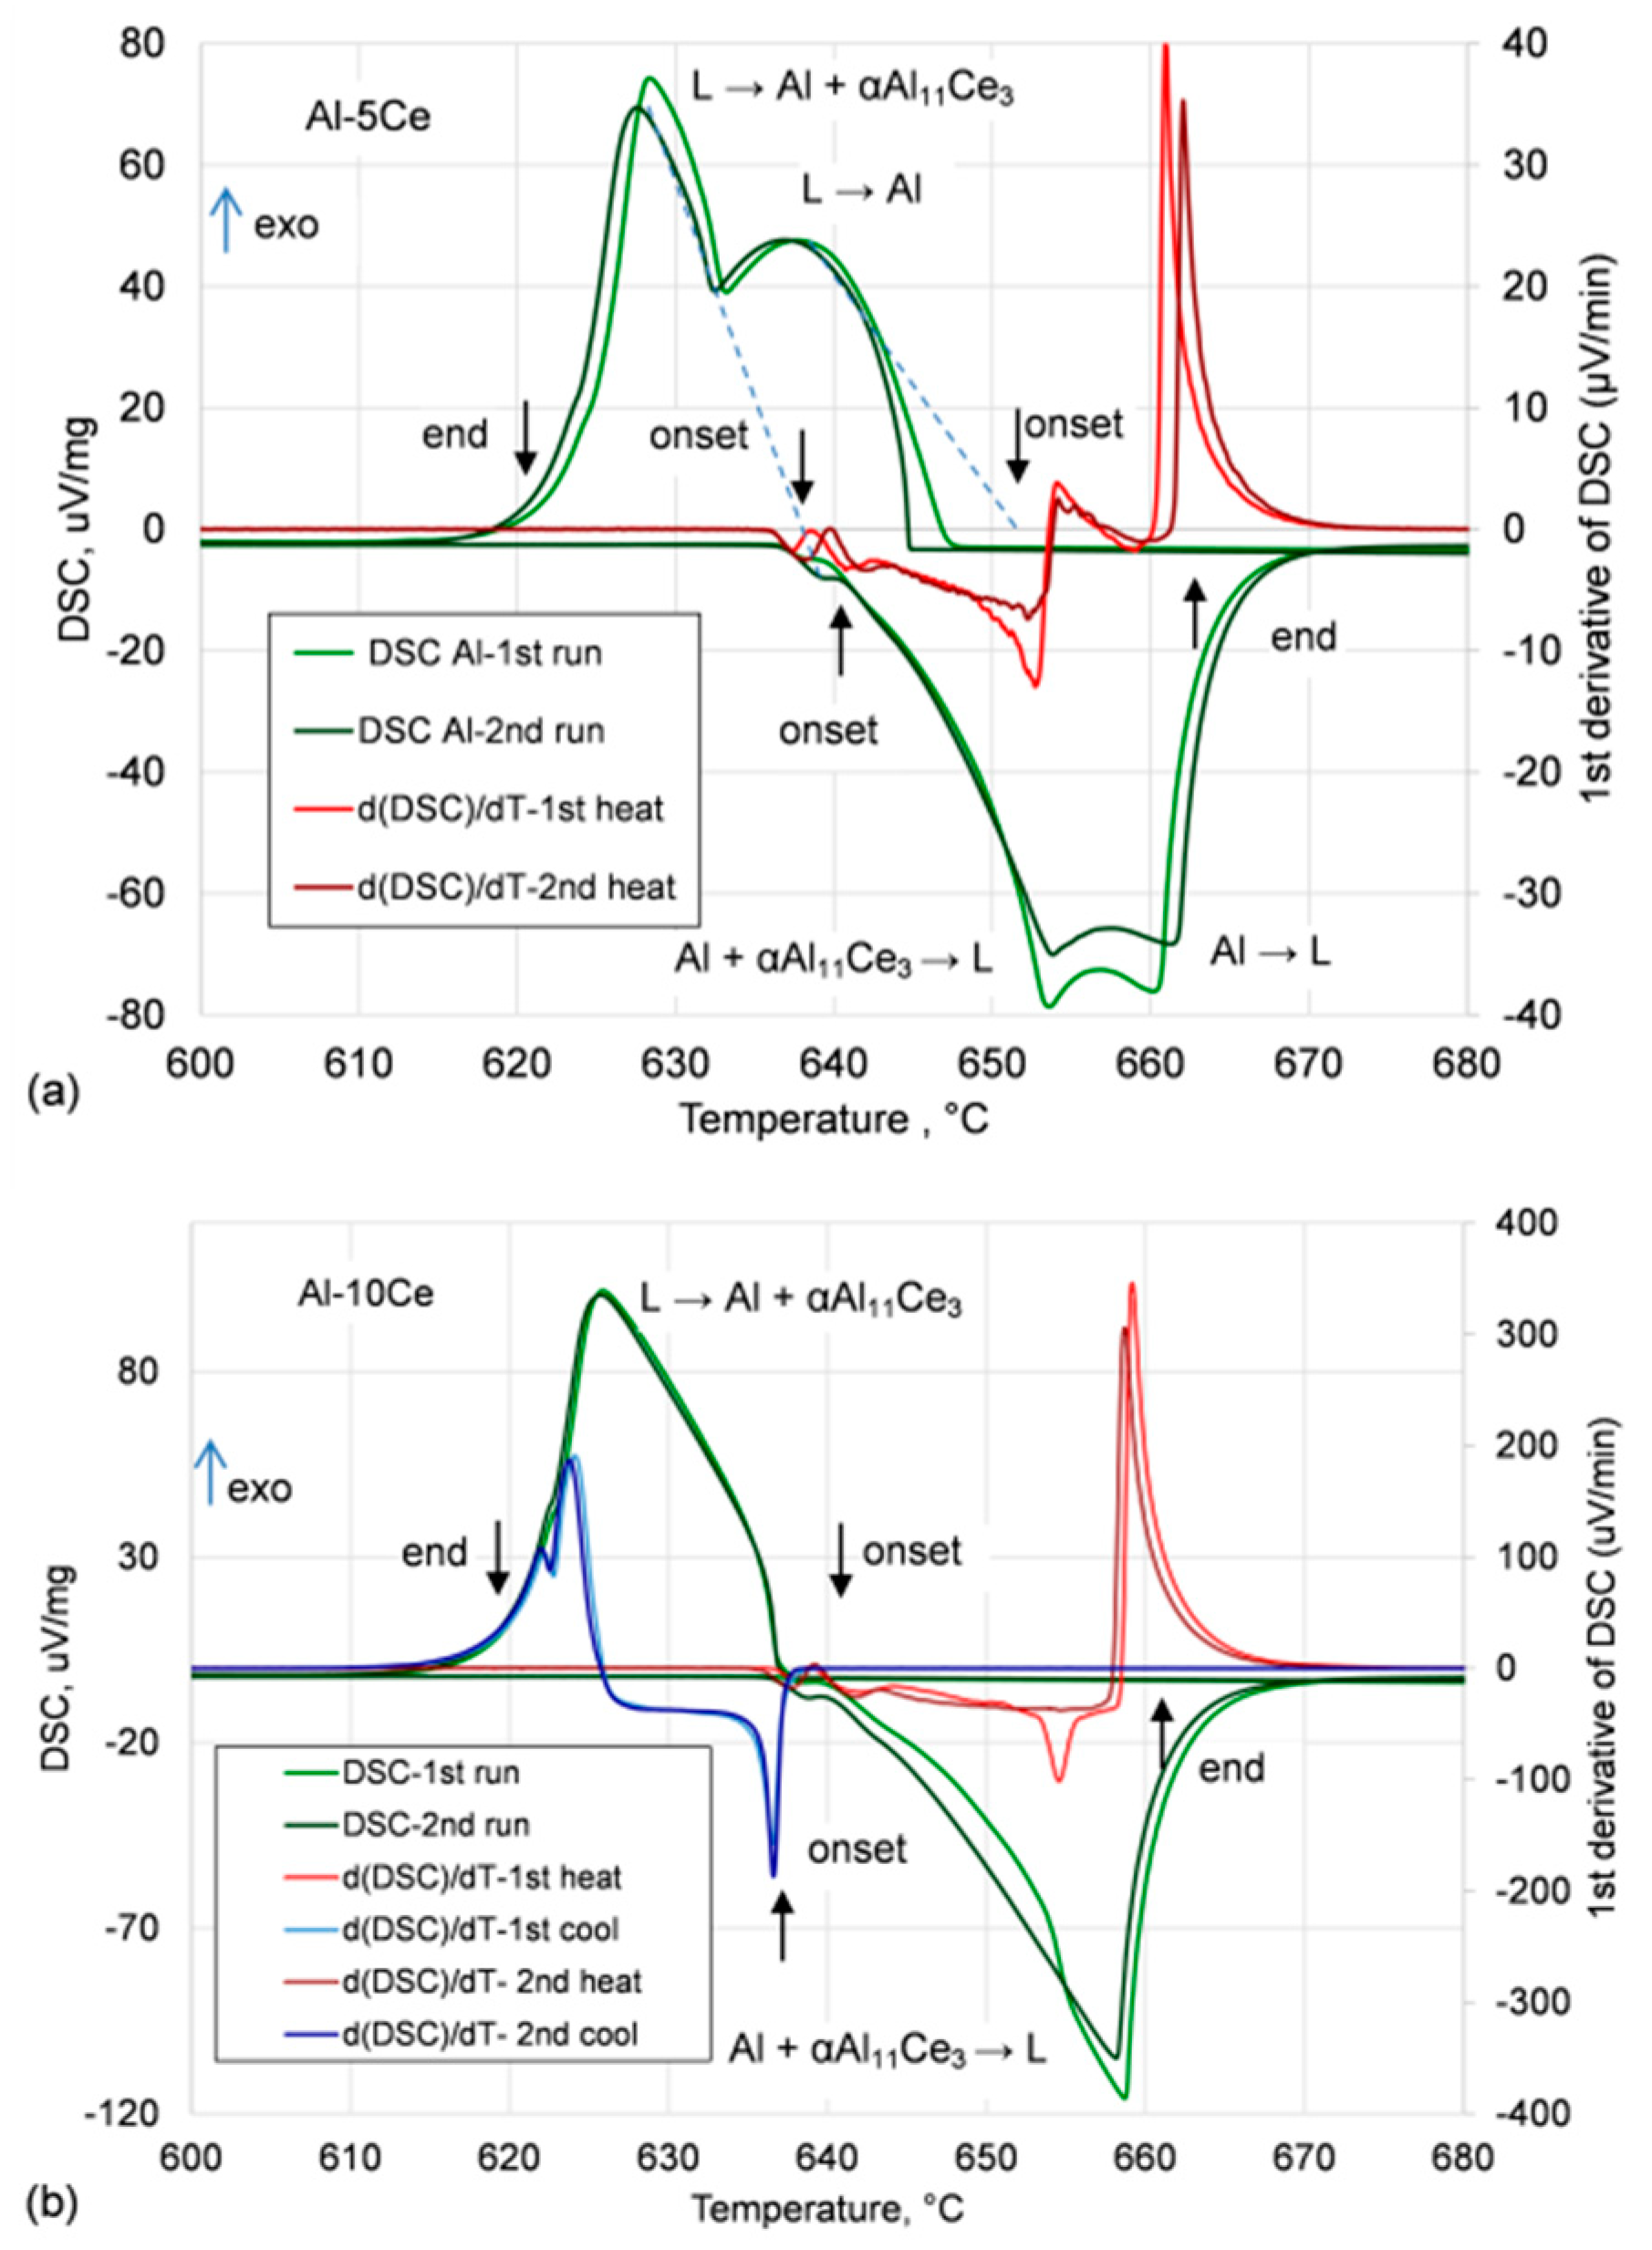
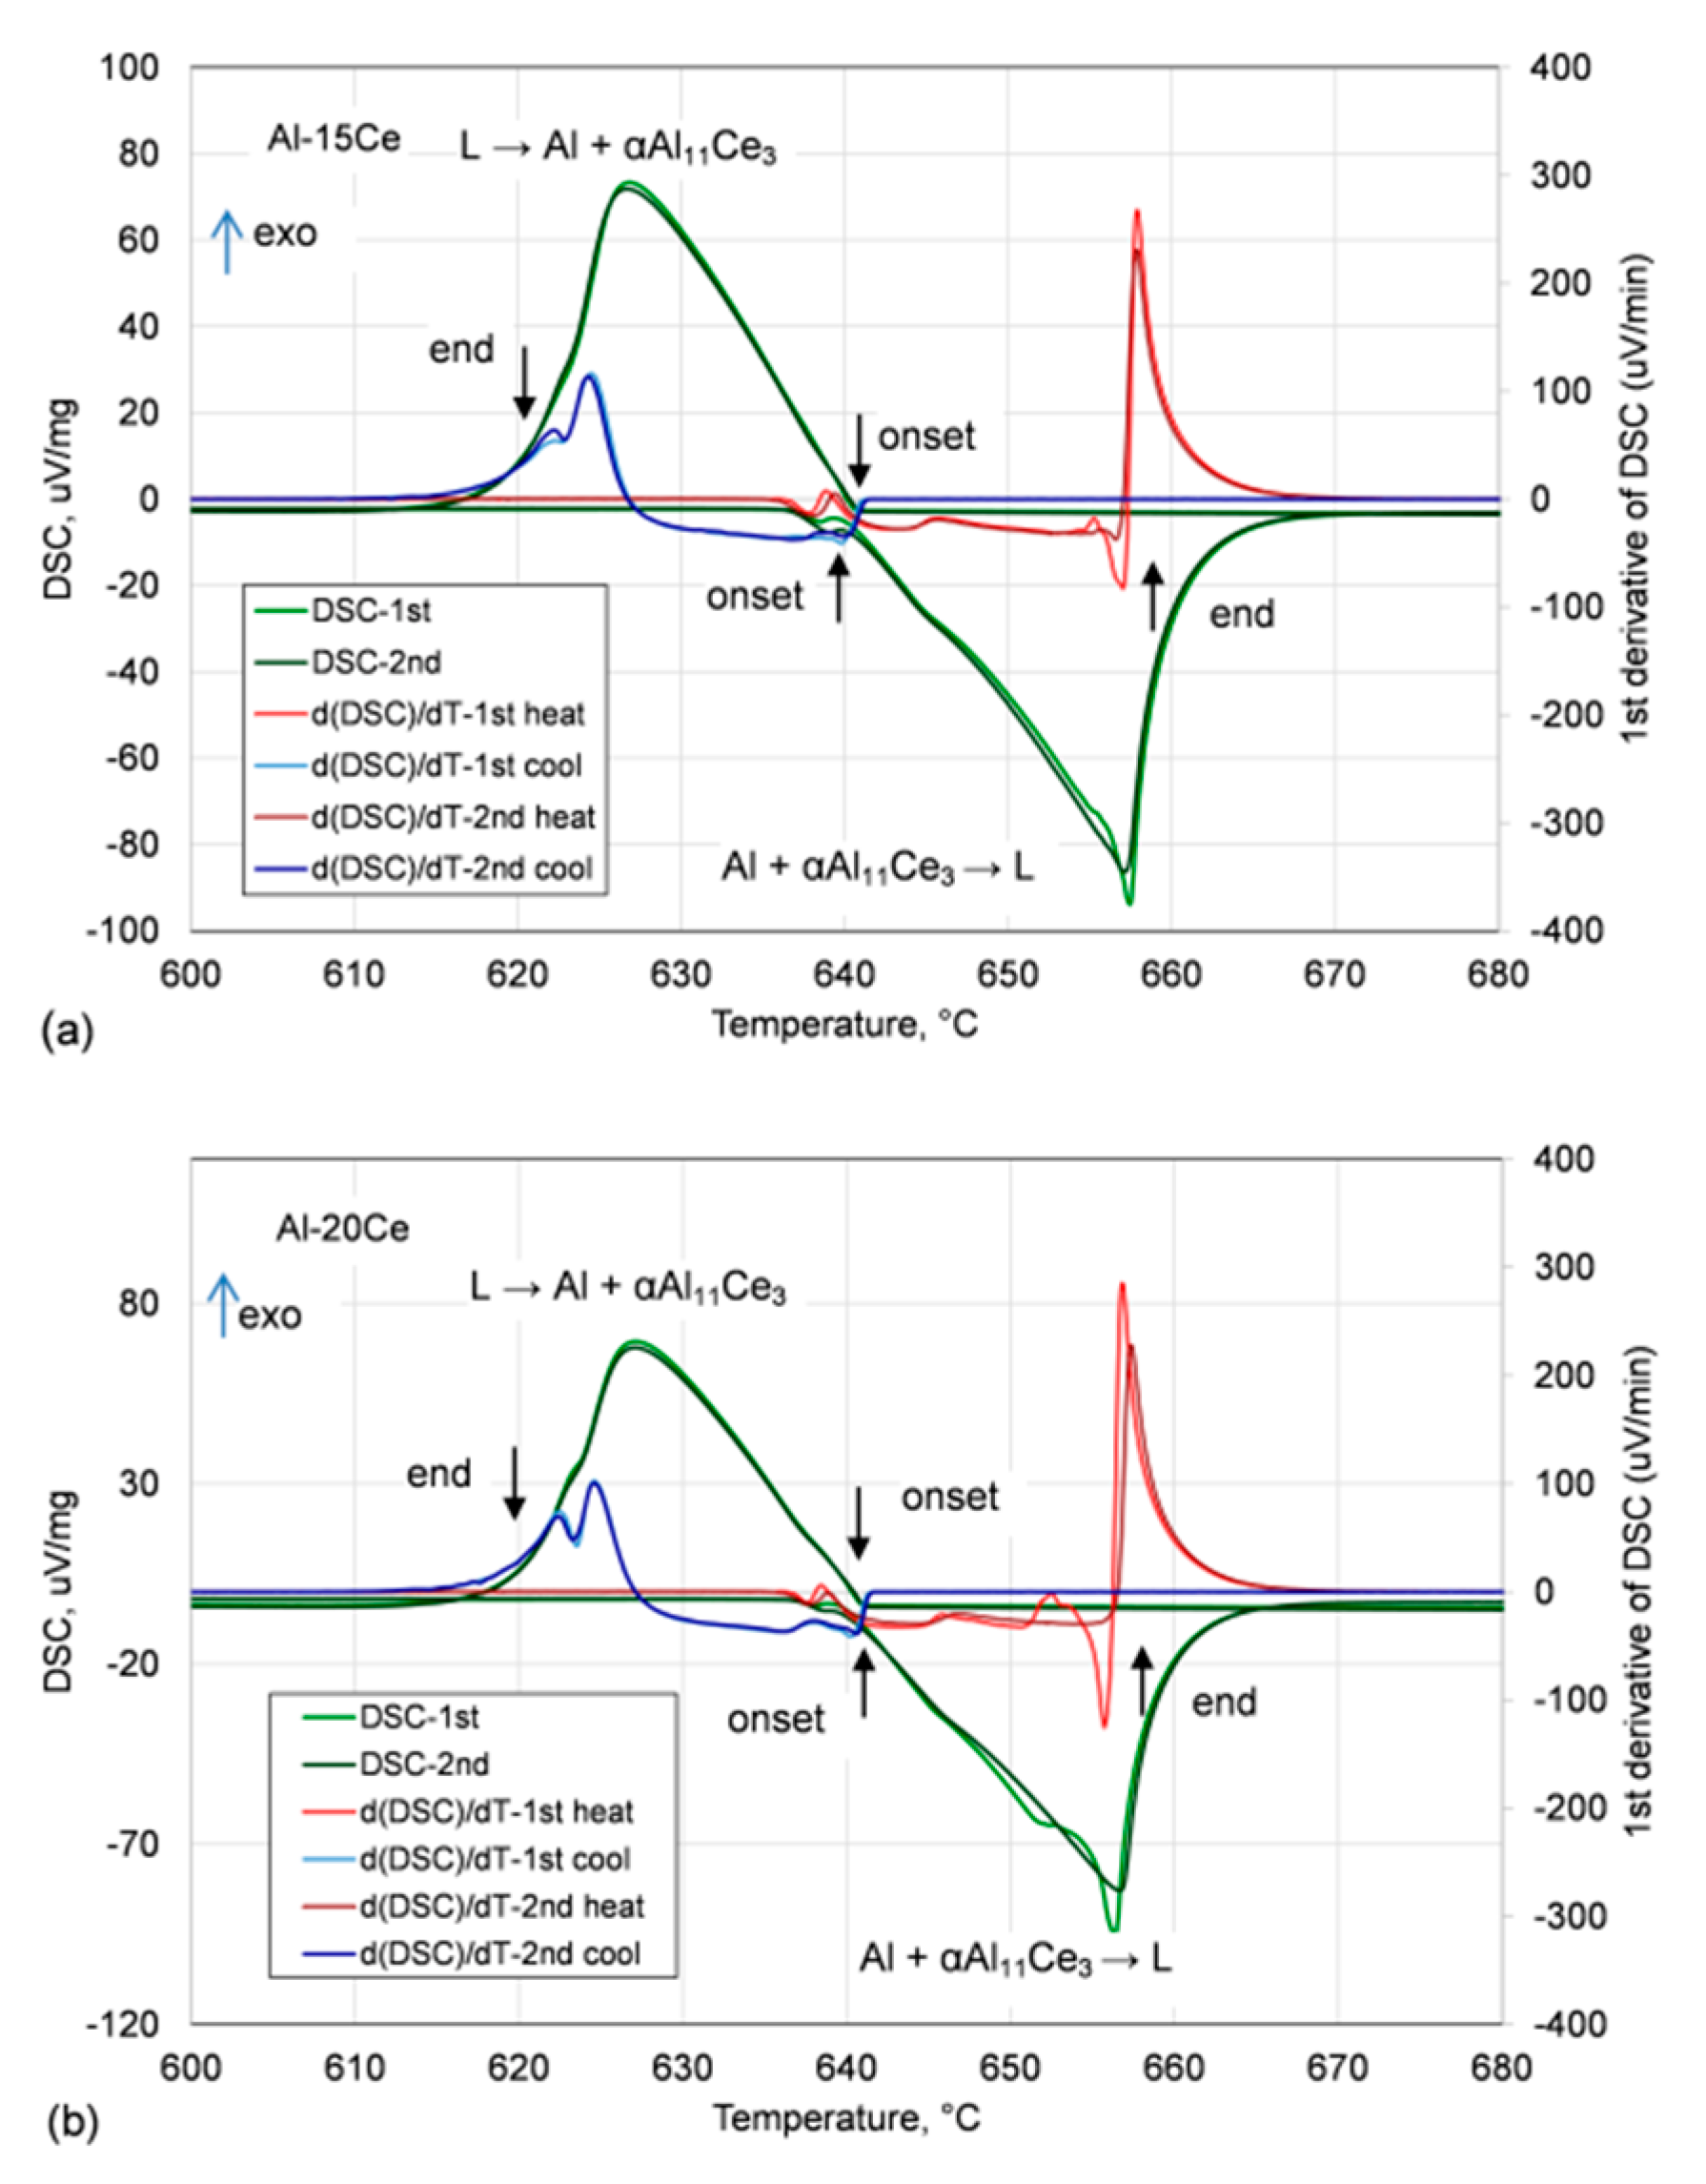
3.5. Differential Scanning Calorimetry

The DSC curves, recorded during melting and solidification of Al-Ce alloys and unalloyed Al, are shown in Figure 8a, where the solidification peaks point upward and melting peaks point downward. In this plot, the area under the characteristic peaks corresponds to the evolution of the solid fraction. The major peaks of DSC curves are associated with the eutectic transformation L ↔ Al + αAl11Ce3, which takes place at a constant temperature and exhibits an isothermal jump in the enthalpy versus temperature at the transition temperature. An exception is represented by the Al-5Ce alloy, where the double peak is split between the eutectic and proeutectic solidification/melting of Al that precedes the eutectic reaction. For general reference, the eutectic temperature in Al-Ce alloys, determined by CCTA and melting temperature of unalloyed Al are marked there.
The high-temperature effects were registered in both hypereutectic alloys Al-15Ce and Al-20Ce, as shown in Figure 8b. These thermal effects are associated with the start of solidification reactions of the proeutectic compound L → αAl11Ce3. Such high-temperature effects were absent in the Al-5Ce and Al-10Ce alloys with hypo- and eutectic compositions.

3.5.1. Methodology of DSC Peaks Interpretation

Applying DSC to metallurgical alloys brings differences as compared to its typical use to molecular materials such as polymers or organics. Therefore, it involves a unique methodology of measuring the critical temperatures of transformations, taking place during alloy melting and solidification. The major approach is explained in Figure 9a, showing the DSC responses during heating of Al-Ce alloys and pure Al over a wide temperature range, where the critical temperatures of melting onsets are marked, based on the detectible deviations of the DSC signal from the baseline. This methodology is recommended by National Institute of Standards and Technology (NIST) [14]. The temperature readings shown there are around 10 °C below the eutectic value determined by CCTA. For unalloyed Al the melting temperature was determined based on a criterion of the intersection of a linear fit to the downward sloping linear section of the transformation peak and a linear extrapolation of the baseline. Although it is a common practice, according to [14] the procedure of using the intersection temperature of a tangent to the DSC curve and the extrapolated baseline can lead to significant differences. This is because, in general, the DSC signal does not have linear sections and an attempt of extrapolating the curvature is an arbitrary procedure that introduces error.
This aspect is explained in Figure 9b, where a portion of the DSC signal is plotted over the narrow temperature range surrounding the eutectic level. The onset determination for the pure Al standard should read 660.5 °C [15], but it was slightly higher, at 658.5 °C, meaning that all temperatures may be around 1°C deviated from the reported one. The possible error with temperature determination is shown in this graph, where the extrapolation led to much higher reading of 663.5 °C. It should be emphasized that not all temperatures extracted from the DSC signal have a physical meaning with regards to tested alloys and some of them may simply be caused by thermal lags within the instrument.

3.5.2. Testing Reproducibility and Critical Temperatures for Al-Ce Alloys

The DSC results for Al-Ce alloys are shown in Figure 10 and Figure 11. During testing, all alloys were subjected to two heating/cooling cycles with very little difference registered between the 1st and 2nd run, aside from some shifting and curve shape changes that is likely to be caused by oxidation. It was noticed that Al-Ce samples showed a dark discolored top surface after testing, but not underneath, where the temperature was measured. This would indicate a reaction with traces of oxygen.
For all alloys, during heating, DSC curves showed the strong endothermic effect associated with melting of eutectic phases. During cooling, DSC curves exhibited strong exothermal effects associated with crystallization of the eutectic. The phase transformations, occurring during melting and solidification, were detected by means of the peaks observed on the heat flow curves. Both methods described in the earlier section were used to determine transformation temperatures. The “onset” temperature means where the signal first departed from the baseline and which corresponded to the leading portion of the peak. For some transformations, the “onset” and “end” values were determined by the intersection of tangents to the maximum rate of the melting/solidification and the linear zones before/after the effects. In graphs of Figure 10 and Figure 11, the first derivatives of the heat flow curve with respect to temperature, d(Heat-Flow)/dT, are also included. The first derivatives of the d(HeatFlow)/dT curve, which show deviations from a baseline heat extraction rate allowing the more acurate determination of transformation temperatures.
As seen in Figure 10a, for the Al-5Ce alloy, having a hypoeutectic nature, due to the narrow gap between the eutectic temperature and solidification start/melting end of the proeutectic Al, both peaks are partly overlapped. For this chemistry, an interpretation of the heat flow signal is not straightforward. During cooling, within the double peak, the first one is associated to the solidification start of the proeutectic Al phase, i.e., it indicates the liquidus of the alloy, the second one is generated by solidification of the eutectic. The DSC signal interpretation is even more complex for heating cycle of Al-5Ce composition, where it is not clear how to separate contributions of melting of the eutectic mixture from the end of melting of the proeutectic Al phase.
For Al-10Ce with a eutectic composition, there are strong single peaks on solidification and melting sides, associated with reactions Al + αAl11Ce3 → L and L → Al + αAl11Ce3 (Figure 10b). The similar thermal effects, associated with the eutectic solidification and melting, were revealed by DSC for hypereutectic alloys Al-15Ce and Al-20Ce (Figure 11a,b). For both compositions, there was very good reproducibility between the DSC signal collected during individual runs. For hypereutectic alloys, a separate reaction is associated with start of solidification/end of melting of the proeutectic Al11Ce3 phase. Therefore, the Al-15Ce and Al-20Ce alloys showed some small effects well above the eutectic temperature, at 726 °C for Al-15Ce and at 774 °C for Al-20Ce on cooling, signaling the start of proeutectic reactions.

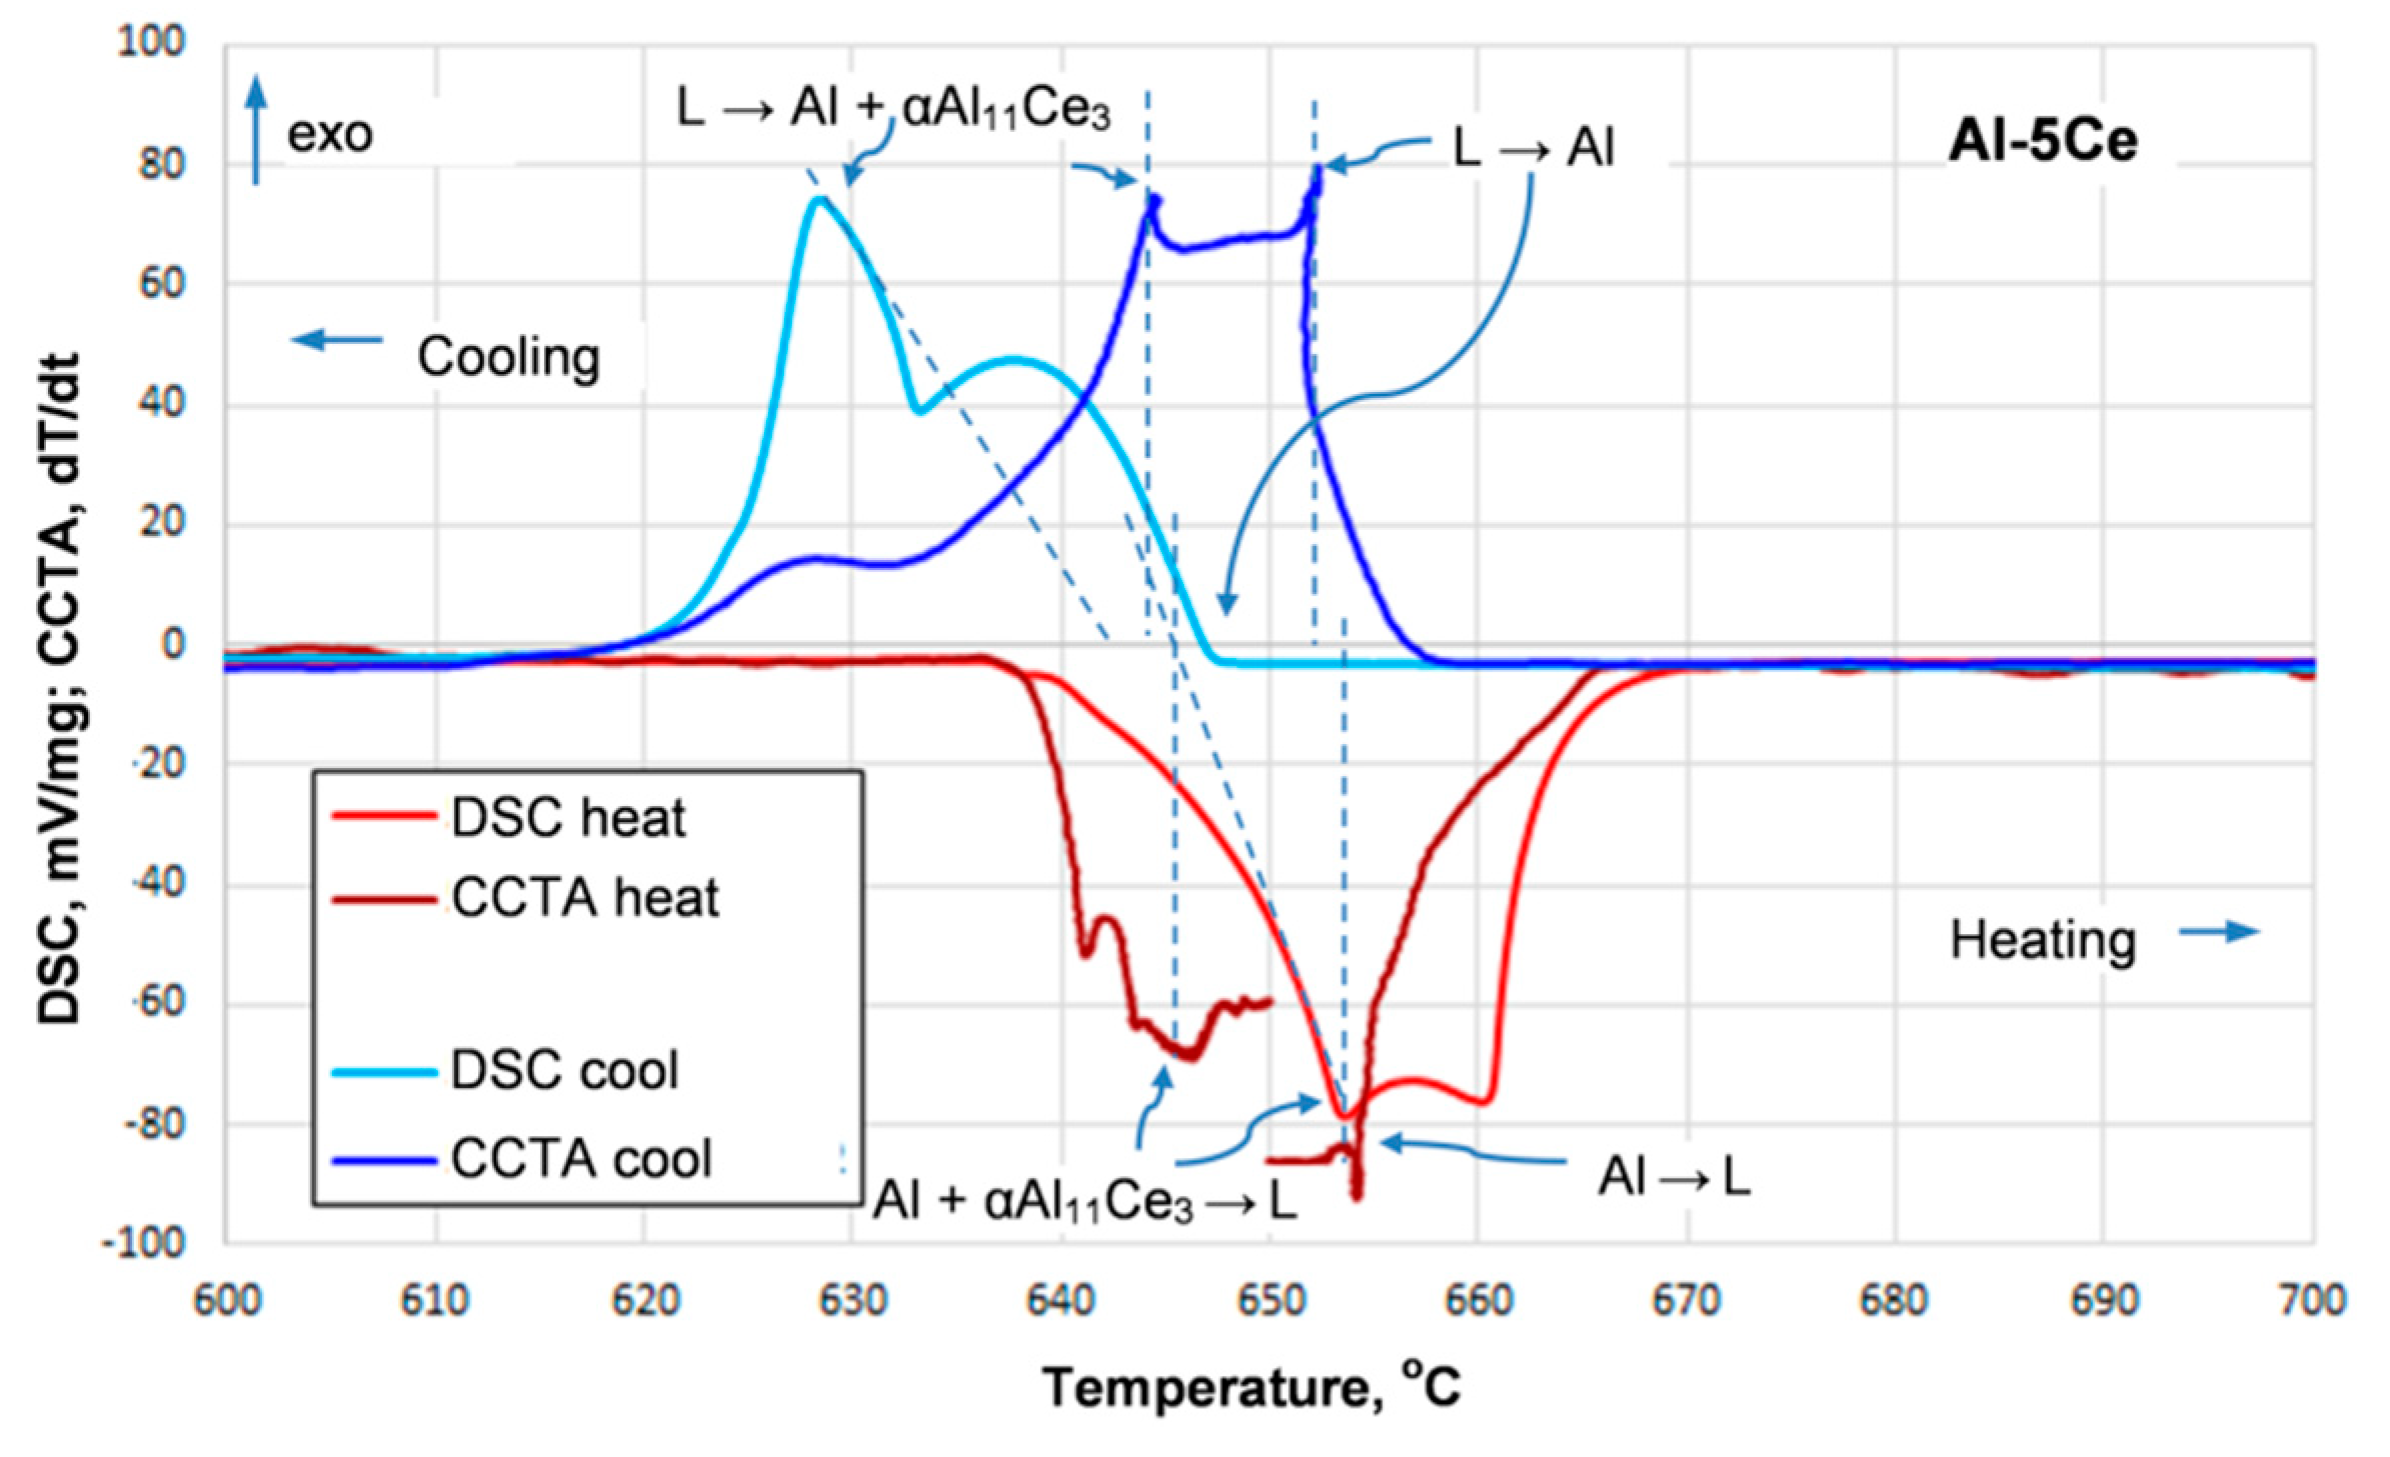
3.6. Comparison of DSC and CCTA Results

The transformation temperatures determined, based on the CCTA and DSC techniques, are listed in Table 2 and Table 3. According to the CCTA technique, supported by the UMSA platform, the eutectic transformation took place at 644–645 °C for all Ce contents up to 20 wt. %. Differential scanning calorimetry curves showed during cooling cycles the major exothermal effects, related to the eutectic solidification in the temperature range of 637–641 °C to 620–621 °C. During heating, CCTA revealed the dissolution of the eutectic at essentially the same temperature of 644–645 °C. On other hand, the DSC curves showed the major endothermal effect due to eutectic melting in the temperature range of 638–642 °C to 658–662 °C. The differences between DSC and CCTA results exceed scatters of individual readings, seen in this study for both techniques.
The comparison of signals generated by DSC and CCTA is portrayed through the outcome of both techniques for the Al-5Ce alloy, plotted in a single graph in Figure 12. The data were converted, so consistently with DSC plots, the upper portion refers to cooling (solidification) and the lower one to heating (melting). The reactions, corresponding to individual peaks generated by both techniques, are indicated along with temperatures associated with each transformation. This plot shows that the CCTA technique helped to determine the transformation temperatures on the DSC plot. As mentioned earlier, for the Al-5Ce alloy, a narrow gap between the eutectic temperature and the temperature of solidification of proeutecatic Al, both peaks on the DSC plot were partly overlapped, creating challenges in the reaction temperature determination. This is in contrast to the melting end of the proeutectic Al11Ce3 phase in Al-15Ce and Al-20Ce alloys where the CCTA technique failed short of its detection.

4. Discussion

The Al-Ce binary alloys examined in this study contain the technologically important eutectic Al-Al11Ce3, whose morphology can only be controlled through solidification conditions [16]. It is anticipated that high thermal stability of the Al11Ce3 phase with a melting point of 1253 °C, low diffusion coefficient of Ce in Al, accompanied by a lack of solid state solubility of Ce in Al, could drastically improve the alloy thermal stability, and the commercial potentials of this are emphasized in the literature [15]. The data on the binary Al-Ce system are needed to establish fundamentals for development of multi-component lightweight aluminum alloys for high temperature applications that could explore the Al-Ce eutectic. In this respect, transformations during melting or solidification are of critical importance.
Although additions of cerium to aluminum alloys were first researched over a century ago [17,18], there are still questions regarding the Al-Ce binary phase diagram and coordinates of some phase transformations, as emphasized in Figure 2. The large differences in temperature of the L → Al + αAl11Ce3 eutectic transformation still exist between two official versions of the Al-Ce phase diagram [7,8]. This aspect was partly explained by solidification studies using the CCTA technique through answering differences between experimental and computed-generated results [5]. However, differences could also be caused by measurement techniques, which are difficult to resolve due to experimental conditions. It was anticipated, therefore, that an application of two major techniques of thermal analysis, DSC and CCTA, will not only allow us to accurately determine melting and solidification characteristics of alloys from the Al-Ce binary system and help to clarify the existing ambiguities in transformation temperatures, but also improve understanding of still-present general challenges with an application of CCTA and DSC techniques to study metallurgical alloys.
The DSC and CCTA are considered the routine techniques of thermal analysis with an application to a variety of materials. Metallurgical alloys may create some unique challenges in this respect. In the literature, a fragment of the DSC/CCTA spectrum is most often shown to document certain thermal effects [19]. Not common is a presentation of both spectra that cover melting and solidification. Finally, it is rather rare a simultaneous presentation of entire melting and solidification spectra of metallurgical alloys, recorded using both DSC and CCTA. Although scientific guidelines of determination of critical temperatures from thermal spectra appear straightforward [14], this study shows that their application to metallurgical alloys may create challenges.
During eutectic solidification, L → Al + αAl11Ce3, both solid phases form directly from the liquid; that is, locally one has L → Al and L → αAl11Ce3. A redistribution of the solid, which is necessary for the reaction to continue, takes place within the liquid ahead of the individual interfaces, being in a close proximity (Figure 4b). A cooling or heating curve represents the balance between the evolution of heat in the sample and the heat flow away from the sample. Therefore, the beginning of solidification can be determined by the latent heat associated with the liquid-solid transformation. In the Al-Al11Ce3 system, there is a large difference between formation enthalpies of individual phases with low enthalpy of formation for Al of 10.7 kJ/mol being accompanied by high enthalpy for Al11Ce3 given as 41 kJ/mol [20] or 39.5 kJ/mol [6,21]. A lack of thermal effects associated with the end of dissolution of the Al11Ce3 proeutectic phase during melting of Al-15Ce and Al-20Ce alloys (Figure 7c–f), despite so high a melting enthalpy, may be caused by its low volume fraction in these alloys. This is in contrast to melting of the proeutectic Al, of which dissolution in the Al-5Ce alloy was well detected, despite its low melting enthalpy (Figure 7a,b).
According to cooling curve thermal analysis, supported by the UMSA platform, the eutectic transformation took place at 644–645 °C for all Ce contents tested. The value is well above the 621 °C, reported in the latest ASM-affiliated phase diagram [7]. The eutectic reaction is accompanied by proeutectic solidification of Al in Al-5Ce alloy at 651 °C and Al11Ce3 phase at 742 °C in Al-15Ce and 791 °C in Al-20Ce alloys. A comparison of cooling curves and their derivatives with plots of solid fraction versus temperature shows that for a cooling rate of 0.2 °C /s, a liquid fraction of 4–10 vol.% continued the transformation at temperatures below 645 °C with solidification completed around 620 °C (Table 2). The same transformation sequence was detected by DSC measurements, though for exactly the same cooling rate of 0.2 °C /s the eutectic temperature showed a larger scatter between 637–641 °C, being below the level determined by CCTA (Table 3).
During heating, due to the specific microstructure of the eutectic, where phases are aligned to each other, both solid phases melt very close to the common temperature. As determined by CCTA the dissolution of the eutectic during heating took place at essentially the same temperature of 644–645 °C for all Ce contents. There are, however, differences in minor non-equilibrium effects, accompanying the eutectic transformation. In contrast to cooling, where the eutectic transformation L → Al + αAl11Ce3 continues through non-equilibrium solidification until 620 °C, during heating, Al + αAl11Ce3 → L melting starts at a slightly lower temperature and the eutectic transformation temperature is reached after the small fraction is melted. Difficulties with calculation of solid fraction during melting did not allow for a detailed description of the melting path. The DSC assessment of eutectic melting gives larger scatter of temperature values. For CCTA measurements of the eutectic, the standard deviation was below 0.5 °C [5]. Similarly, for the DSC technique, alignment of signal collected during two cycles shows a very low scatter of temperature readings. It appears therefore, that the difference in the eutectic transformation temperature between DSC and CCTA techniques is beyond the measurement error of each technique.
Literature examples show rather large differences between DSC and CCTA measurements. For the AlSi9Cu3 (wt. %) alloy during heating the α-AlCu-β eutectic melting was 554–630 °C for DSC and 562 °C CCTA [22]. During cooling the eutectic transformation was at 495–525 °C for DSC and 536 °C for CCTA. Differences in sample mass and cooling rates were blamed for measured differences. The similarly high differences were registered during experiments with EN AC 48000 AlSi12CuNiMg (wt. %) alloy [23]. The double eutectic α(Al) +β(Si) in this alloy crystallized in a temperature range of approximately 549 to 557 °C according to DSC and at 574 °C according to the CCTA technique. As in the case of the former alloy, differences in the sample weight with cooling rates was named as the sole cause of variations in the temperature readings.
As specified in the experimental section, there is an essential difference in the size between samples used by DSC and UMSA. DSC itself is strongly sensitive to the sample size; when too-large samples cause a delay in measurements due to thermal mass, too-small samples reduce accuracy in measurements because peaks are small in magnitude. For Al-Ce alloys examined in this study, samples of about 20 mg were found optimal. The sample size used in UMSA apparatus, of the order of tens of grams, is seen to represent the as-cast structures with macro-segregation of alloying and impurity elements, nonmetallic inclusions, gas and shrinkage porosity that could potentially affect the thermal output. The very small DSC sample, of an order of milligrams, is often not fully representative of the cast components structures. It is argued in the literature that the very small sample provides the substance properties rather than the bulk sample properties.
Although differences between DSC- and CCTA-determined critical temperatures in this study (Table 2 and Table 3) were lower than that presented in the literature for commercial Al alloys [22,23], they still exceeded the typical errors, which is characteristic for individual techniques. At present, there is no clear explanation of how internal defects in metallurgical alloys affect the signal collected during thermal analysis and how the centrally located thermocouple is capable of characterizing the entire volume of the UMSA sample. Since solidification conditions affect the defect nature, one would anticipate that the samples solidified in an original crucible during casting and the one that re-solidified in the UMSA furnace should give different temperature readings, which was not the case in this study (Figure 5). The hypothesis involving the sample size, therefore, still requires fundamental research. More relevant could be the potential effect of chemical segregation after casting and, therefore, the small DSC samples may differ in detailed chemistry from large UMSA ones.
The experiments of this study show that also the nature of thermal effects, recorded by each technique, and methodologies of their interpretation, may contribute to differences in the transformation temperature determined. In particular, the complex DSC signal may create some interpretation challenges, as was the case for the hypoeutectic Al-5Ce composition. In this respect, a simultaneous assessment of the same alloy through CCTA helped to interpret the DSC signal. Hence, although these experiments do not provide a clear explanation of the differences in temperatures determined by DSC and CCTA, they point out some of the challenges these techniques impose. Thus, the results of this study should help in the interpretation of thermal analysis signals collected during melting and solidification of metallurgical alloys.

5. Conclusions

A combination of differential scanning calorimetry (DSC) and cooling curve thermal analysis (CCTA) revealed the reactions taking place during melting and solidification of Al-Ce binary alloys with Ce contents from 5 to 20 wt. %. For heating/cooling rates of 0.2–0.4 °C /s, temperatures of eutectic transformation L ↔ Al + Al11Ce3 in the Al-10Ce alloy along with additional proeutectic reactions L ↔ Al in the Al-5Ce hypoeutectic alloy and L ↔ Al11Ce3 in Al-15Ce and Al-20Ce hypereutectic alloys, were determined.
Although there was a general agreement in the major transformations registered by DSC and CCTA during melting and solidification of Al-Ce alloys, differences in the reaction temperatures determined exceeded the typical measurement errors for each technique. In addition, DSC and CCTA revealed the differences in detecting some proeutectic reactions and minor non-equilibrium effects, accompanying the eutectic transformation.
The experiments suggest that differences in transformation temperatures measured by DSC and CCTA are not only related to what is emphasized in the literature as the sample size effect, but also to the nature of thermal effects, recorded by each technique, and the methodologies of their interpretation. In particular, the DSC signal may create some interpretation challenges, as was the case for the hypoeutectic Al-5Ce composition. Hence, DSC and CCTA techniques complemented each other in providing the accurate quantitative description of melting and solidification pathways of Al-Ce alloys.

Author Contributions

Conceptualization, F.C.; investigation, M.A., T.S., F.C.; writing—original draft preparation, review and editing, F.C. All authors have read and agreed to the published version of the manuscript.

Funding

This research was funded by the Program of Energy Research and Development (PERD) of Natural Resources Canada.

Data Availability Statement

Any requirement about the data of this research must be consulted directly to the corresponding author.

Acknowledgments

The authors would like to thank the CanmetMATERIALS team for their assistance during research including Renata Zavadil for metallography work and Peter Newcombe, Howard Webster, Frank Benkel, Douglas McFarlan, and David Saleh for casting the Al-Ce alloys.

Conflicts of Interest

The authors declare that they have no conflict of interest.

References

  1. Mikhail, S.; Webster, H. Thermal Analysis in Metallurgy. In Handbook of Thermal Analysis and Calorimetry; Brown, M.E., Gallagher, P.K., Eds.; Elsevier B.V.: New York, NY, USA, 2003; Volume 2. [Google Scholar]
  2. Sokolowski, J.; Kierkus, W.; Kasprzak, M.; Kasprzak, W. Method and Apparatus for Universal Metallurgical Simulation and Analysis. U.S. Patent 7,354,491 B2, 8 April 2008. [Google Scholar]
  3. Lukas, K.; LeMaire, P.K. Differential scanning calorimetry: Fundamental overview. Resonance 2009, 14, 807–817. [Google Scholar] [CrossRef]
  4. Czerwinski, F. Cerium in aluminum alloys. J. Mater. Sci. 2020, 55, 24–72. [Google Scholar] [CrossRef]
  5. Czerwinski, F.; Amirkhiz, B.S. On the Al-Al11Ce3 eutectic transformation in aluminum-cerium binary alloys. Materials 2020, 13, 4549. [Google Scholar] [CrossRef] [PubMed]
  6. Gao, M.; Rollet, A.; Widom, M. Lattice stability of aluminum-rare earth binary systems: A first-principles approach. Phys. Rev. B 2007, 75, 174120. [Google Scholar] [CrossRef] [Green Version]
  7. Okamoto, H. Al-Ce (Aluminum-Cerium). J. Phase. Equilib. Diff. 2011, 32, 392–393. [Google Scholar] [CrossRef]
  8. Okamoto, H. Al-Ce (Aluminum-Cerium). J. Phase Equilibria 1998, 19, 396. [Google Scholar] [CrossRef]
  9. Gschneidner, K.; Verkande, M. Selected Cerium Phase Diagrams; Rare Earth Information Center, Iowa State University: Ames, IA, USA, 1975. [Google Scholar]
  10. Drits, M.; Kadaner, E.; Shoa, N. Solid solubility of rare earth metals in aluminum. Izv. Akad. Nauk SSSR 1969, 1, 219–223. [Google Scholar]
  11. Weiss, D.; Rios, O.; Sims, Z. Casting characteristics of high cerium content aluminum alloys. In Light Metals 2017; LLNL-JRNL-738126; Lawrence Livermore National Laboratory: Livermore, CA, USA, 2017. [Google Scholar]
  12. Marchwica, P.; Sokolowski, J.; Kierkus, W. Fraction solid evolution characteristics of AlSiCu alloys-dynamic baseline approach. J. Achiev. Mater. Manuf. Eng. 2011, 47, 115–236. [Google Scholar]
  13. Liang, S.; Chen, R.; Blandin, J.; Suery, M.; Han, E. Thermal analysis and solidification pathways of Mg–Al–Ca system alloys. Mater. Sci. Eng. A 2008, 480, 365–372. [Google Scholar] [CrossRef]
  14. Boettinger, W.; Kattner, U.; Moon, K.; Perepezko, J. DTA and Heat-Flux DSC Measurements of Alloy Melting and Freezing; National Institute of Standards and Technology: Washington, DC, USA, 2006. [Google Scholar]
  15. Czerwinski, F. Thermal stability of aluminum alloys. Materials 2020, 13, 3441. [Google Scholar] [CrossRef] [PubMed]
  16. Czerwinski, F. Assessing differences between the use of cerium and scandium in aluminum alloying. Mater. Sci. Technol. 2020, 36, 255–263. [Google Scholar] [CrossRef]
  17. Barth, O. Die Erhohung der chemischen Widerstandsfahigkeit mechanisch noch gut bearbeitbarer, fur Konstructionszwecke verwendbarer Legierungen; Teil II: Uber den Einfluss des Cers auf die mechanischen und chemischen Eigenschaften des Aluminiums (in German). Metall. Z. Gesamte Huttenkd. 1912, 8, 261–276. [Google Scholar]
  18. Gillett, H.; Schnee, V. Cerium in aluminum alloys. Ind. Eng. Chem. 1923, 15, 709–711. [Google Scholar] [CrossRef]
  19. Cao, Z.; Kong, G.; Che, C.; Wang, Y.; Peng, H. Experimental investigation of eutectic point in Al-rich Al-La, Al-Ce, Al-Pr and Al-Nd systems. J. Rare Earths 2017, 35, 1022–1028. [Google Scholar] [CrossRef]
  20. Borzone, G.; Cacciamani, G.; Ferro, R. Heats of formation of aluminum-cerium intermetallic compounds. Metall. Trans. A 1991, 22, 2119–2123. [Google Scholar] [CrossRef]
  21. Sommer, F.; Keita, M. Determination of the enthalpies of formation of intermetallic compounds of aluminium with cerium, erbium and gadolinium. J. Less-Common Met. 1987, 136, 95. [Google Scholar] [CrossRef]
  22. Piatkowski, J.; Przeligorz, R.; Gontarczyk, A. The study of phase transformations of AlSi9Cu3 Alloy by DSC method. Arch. Foundry Eng. 2016, 16, 109–112. [Google Scholar] [CrossRef] [Green Version]
  23. Piatkowski, J.; Przeligorz, R.; Szymszal, J. The application of ATD and DSC methods to study of the EN AC-48000 alloy phase transformation. Arch. Foundry Eng. 2017, 17, 207–211. [Google Scholar] [CrossRef] [Green Version]
Figure 1. Geometry and dimensions of samples used in UMSA and DSC systems. The weight of Al-Ce samples for UMSA is about 70 g and for DSC it is only 0.02 g.
Metals 11 00372 g001
Figure 2. Aluminum-rich portion of the Al-Ce phase diagram, emphasizing the eutectic transformation L → Al + αAl11Ce3. According to [7], CE = 17.8 wt. % Ce, TE = 621 °C; according to [8] CE = 17.8 wt. % Ce, TE = 640 °C. Adapted with permission from [7] Copyright 2011 Springer Nature.
Metals 11 00372 g002
Figure 3. Microstructure of Al-Ce binary alloys in as-cast state: (a) Al-5Ce, hypoeutectic; (b) Al-10Ce, eutectic; (c) Al-15Ce, hypereutectic; (d) Al-20Ce, hypereutectic.
Metals 11 00372 g003
Figure 4. Eutectic Al + Al11Ce3 in Al-5Ce alloy: (a) lamellar morphology of the eutectic along with proeutectic Al; (b) mechanism of eutectic formation with dimensions of Al and Al11Ce3 lamellae.
Metals 11 00372 g004
Figure 5. Computer-aided cooling/heating curve thermal analysis of Al-xCe alloys with x = 5, 10, 15, 20 wt. %: (a) heating and cooling curves; (b) first derivatives (dT/dt) versus temperature curves for Al-10Ce recorded during several cycles of heating and cooling showing the good reproducibility of results; (c) first derivatives (dT/dt) versus temperature curves; (d) first derivatives (dT/dt) versus temperature plots emphasizing the eutectic transformation.
Metals 11 00372 g005
Figure 6. First derivatives of the cooling curves (dT/dt) plotted versus temperature (T) and solid fraction calculated for solidification data: (a) Al-5Ce; (b) Al-15Ce alloys.
Metals 11 00372 g006
Figure 7. Computer-aided cooling/heating curves thermal analysis of Al-Ce alloys during heating: (a) plot of temperature and first derivative dT/dt versus time for Al-5Ce alloy; (b) first derivative dT/dt during heating and cooling plotted versus time for Al-5Ce alloy; (c) plot of temperature and first derivative dT/dt versus time for Al-15Ce alloy; (d) first derivative dT/dt during heating and cooling plotted versus time for Al-15Ce alloy; (e) plot of temperature and first derivative dT/dt versus time for Al-20Ce alloy; (f) first derivative dT/dt during heating and cooling plotted versus time for Al-20Ce alloy.
Metals 11 00372 g007
Figure 8. DSC signal versus temperature for heating and cooling of Al-Ce alloys: (a) temperature range emphasizing eutectic region; (b) temperature emphasizing solidification beginning of the pro-eutectic Al11Ce3 phase in Al-15Ce and Al-20Ce alloys. The eutectic temperature determined by CCTA and melting point of pure Al are indicated.
Metals 11 00372 g008
Figure 9. DSC signal collected during heating of Al-Ce alloys and Al standard with marked characteristic temperatures in 2 repeated cycles: (a) temperature range showing melting of eutectic Al + Al11Ce3 and proeutectic Al11Ce3; (b) temperature range emphasizing the eutectic melting in Al-Ce alloys and in Al standard sample.
Metals 11 00372 g009
Figure 10. DSC signal and first derivative versus temperature for heating and cooling recorded during two repeated cycles: (a) Al-5Ce-hypoeutectic alloy; (b) Al-10Ce eutectic alloy.
Metals 11 00372 g010
Figure 11. DSC signal and first derivative versus temperature for heating and cooling recorded during two repeated cycles: (a) Al-15Ce –hypereutectic alloy; (b) Al-20Ce hypereutectic alloy.
Metals 11 00372 g011
Figure 12. DSC signal and first derivative dT/dt from CCTA, both plotted versus temperature for the Al-5Ce hypoeutectic alloy. The characteristic temperatures determined from both techniques are marked for comparison.
Metals 11 00372 g012
Table 1. Chemical compositions of Al-Ce alloys determined by OES and ICP techniques.
AlloyMeasureAl-5CeAl-10CeAl-15CeAl-20Ce
Ce wt. %5.2110.6115.8020.76
at. % converted1.052.233.494.80
Trace elementswt. %Si 0.016–0.056; Mg 0.019–0.110; Ni 0.013–0.072; Ti 0.038 max, Mn 0.019 max; Cu 0.006 max.
Table 2. Liquidus and solidus/eutectic temperatures of Al-Ce alloys determined by cooling/heating curves thermal analysis. Heating at a rate of 0.4 °C/s and cooling at a rate of 0.2 °C/s. Temperatures: TL- liquidus; TE—eutectic solidification/melting; Tf—end of non-equilibrium melting/ solidification of the eutectic portion. (*) signal does not allow the clear reading.
AlloyLiquidus, °CSolidus/Eutectic, °C
HeatingCoolingHeatingCooling
TL TL TETfTETf
Al-5Ce652.4-651.5-644.2653.5644.1617.4
Al-10CeThe same as solidus645.6652.8645.0617.0
Al-15Ce*-742.1-644.2650.4645.2618.8
Al-20Ce*-791.2-645.1653.5644.9617.2
Table 3. Liquidus and solidus/eutectic temperatures of Al-Ce alloys determined by Differential Scanning Calorimetry. Heating and cooling at a rate of 0.2 °C/s. (*) signal does not allow the clear reading.
AlloyLiquidus, °CSolidus/Eutectic, °C
HeatingCoolingHeatingCooling
OnsetEndOnsetEndOnsetEndOnsetEnd
Al-5Ce**652.5*641.4662.3637.5621.4
Al-10CeThe same as solidus639.1661.2640.5621.2
Al-15Ce743.3747.6726.4708.6638.7658.2641.5621.3
Al-20Ce794.1801.2774.3762.4642.1658.6641.0620.6
Publisher’s Note: MDPI stays neutral with regard to jurisdictional claims in published maps and institutional affiliations.

