Article

A New Systematic Approach Based on Dilatometric Analysis to Track Bainite Transformation Kinetics and the Influence of the Prior Austenite Grain Size

by
David San-Martin
1,
Matthias Kuntz
2,
Francisca G. Caballero
1 and
Carlos Garcia-Mateo
1,*
1
MATERALIA Research Group, Department of Physical Metallurgy, National Center for Metallurgical Research (CENIM-CSIC), Avda. Gregorio del Amo 8, 28040 Madrid, Spain
2
Robert Bosch GmbH, Corporate Research, Renningen, 70465 Stuttgart, Germany
*
Author to whom correspondence should be addressed.
Metals 2021, 11(2), 324; https://doi.org/10.3390/met11020324
Submission received: 20 January 2021 / Revised: 4 February 2021 / Accepted: 9 February 2021 / Published: 13 February 2021
(This article belongs to the Special Issue Advanced High-Strength Bainitic Steels)

Abstract

:
This investigation explores the influence of the austenitisation heat treatment and thus, of the prior austenite grain size (PAGS), on the kinetics of the bainitic transformation, using as A case study two high-carbon, high-silicon, bainitic steels isothermally transformed ( T Iso = 250, 300, 350 °C), after being austenised at different temperatures ( T γ = 925–1125 °C). A methodology, based on the three defining dilatometric parameters extracted from the derivative of the relative change in length, was proposed to analyse the transformation kinetics. These parameters are related to the time to start bainitic transformation, the time lapse for most of the transformation to take place and the transformation rate at the end of the transformation. The results show that increasing the PAGS up to 70 µm leads to an increase in the bainite nucleation rate, this effect being more pronounced for the lowest T Iso . However, the overall transformation kinetics seems to be weakly affected by the applied heat treatment ( T γ and T Iso ). In one of the steels, PAGS > 70 µm ( T γ > 1050 °C), which weakly affects the progress of the transformation, except for T Iso = 250 °C, for which the enhancement of the autocatalytic effect could be the reason behind an acceleration of the overall transformation.

1. Introduction

Bainitic microstructures have been receiving much attention in the development of modern steel grades. In such development, it becomes fundamental to characterise the kinetics of the bainitic transformation and understand the necessary parameters to tailor it. Considering that the most common and direct way to characterize the transformation kinetics relies on dilatometry, it is paramount that a unified, accurate and objective description of dilatometric curves during the bainitic transformation is adopted, engendering confidence in the interpretation of the results and in the transformation models actually being developed.
In brief, the bainitic reaction proceeds by the consecution of nucleation events of ferrite subunits at either austenite grain boundaries ( γ / γ interface) or at the interphase boundary of a previously nucleated subunit ( α b / γ interface), autocatalytic bainite nucleation [1,2], followed by its growth occurring by a displacive and diffusionless process similar to that of martensite [1].
A subunit of bainitic ferrite grows and lengthens until the capacity of the surrounding untransformed austenite to accommodate plastic strain is exhausted. The newly formed subunit, which is supersaturated with carbon, rejects its excess to the surrounding austenite. A new subunit then nucleates at the boundary of a previously nucleated subunit ( α b / γ interface) and this way, the characteristic sheaf structure evolves [3].
The number density of potential grain boundary nucleation sites mainly depends on the prior austenite grain size (PAGS); the grain boundary area decreases with increasing austenite grain size, leading to less nucleation sites [4]. However, it has to be considered that the grain boundary and autocatalytic density of potential nucleation sites is also a function of the volume fraction of bainite formed. The density of available α b / γ interfaces depends on both the fraction of bainite formed and the fraction of remaining available austenite. The density of available α b / γ interfaces also depends on the density of γ / γ interfaces since the grain boundary nucleation is a precursor for autocatalytic nucleation. Given the displacive character of bainite growth, the surrounding austenite is plastically deformed, which implies that the dislocation densities around the bainite/austenite interfaces may vary as the bainitic growth continues to form sheaves. Therefore, the activation energies of autocatalytic nucleation and of grain boundary nucleation will also vary differently [5]. When bainitic ferrite plates reject their excess of C to the surrounding austenite, the extension of the generated C fields/profiles, mainly controlled by the diffusion coefficient of C in austenite, will also influence the available driving force for the remaining transformation events.
Careful consideration of the aforementioned mechanisms puts on display the important influence the austenitisation heat treatment and thus, the PAGS, have on the kinetics of the bainitic transformation, from the control of potential nuclei sites to the strain accommodation effects due to the Hall–Petch size-related strengthening effect [6,7], the probability of hard impingement events, C diffusion distances, etc. However, despite the numerous efforts made in depicting the effect that the PAGS has on bainitic transformation, there is still an open debate, as the reported effects show that decreasing its size can accelerate the bainite formation kinetics [1,8,9,10,11,12], while other studies show the contrary [11,13,14,15,16]. Given that among the aforementioned studies, there is not a unified criterion to characterise the transformation kinetics, the comparison of results from different sources is at least debatable. To overcome this reasonable doubt, we propose a unified, accurate and objective method using a case study of two bainitic steels, isothermally transformed at the same temperature after being austenised at different temperatures, to generate different PAGS.

2. Materials and Methods

For this work, two different steels were used: a high C designed steel and a commercial steel produced by Ovako (Hofors, Sweden), denoted as Sp11C and OVA, respectively. Their chemical composition can be found in Table 1. Both alloys were selected for their high C and Si content that makes them perfect candidates for this study, having transformation kinetics that evolve slowly and progressively, as revealed later in this manuscript. It has to be noted that the formation of cementite during the bainitic transformation in both alloys was suppressed thanks to their high Si contents (~1.5 wt. %) [17].
Thermal treatments were performed in a DIL Bahr 805D high-resolution dilatometer (TA Instruments, Hüllhorst, Germany) from TA Instruments equipped with an induction heating coil. Helium was used as the quenching gas and the temperature was controlled by a type K thermocouple welded to the central part of the sample surface. The equipment enabled thermal and thermomechanical treatments while tracking the phase transformations by monitoring the change in the length of the sample. The dilatometry tests were performed using a specific module, equipped with fused silica push-rods to measure the longitudinal length changes. Cylindrical specimens (height × diameter=) 10 × 4 mm3 were used in these experiments.
Quantitative X-ray diffraction (XRD) analyses were used to determine the amount of retained austenite and bainitic ferrite. Samples were step-scanned in a Bruker AXS D8 X-ray diffractometer (Bruker AXS GmbH, Karlsruhe, Germany) with a rotating Co anode X-ray tube as a radiation source, Goebel mirror optics and a LynxEye Linear Position Sensitive Detector (Bruker AXS GmbH, Karlsruhe, Germany) for ultra-fast XRD measurements. A current of 30 mA and a voltage of 40 kV were employed as tube settings. Operational conditions were selected to obtain the X-ray diffraction data of sufficiently high quality. XRD data were collected over a 2 h range of 35°–135° with a step size of 0.01°. The amount of austenite and bainite were obtained from the integrated intensities of the (002) (112), and (022) peaks, which correspond to the ferrite planes, and from the (200) (220) and (311) austenite peaks [18]. Using several peaks has been proven to prevent non-accurate results related to the crystallographic texture [19].
The sample preparation for XRD included grinding and polishing up to 1 μm diamond paste, followed by a cycle of etching (3% Nital for 10 s) and polishing in order to remove the surface layer that had been plastically deformed during the grinding step. This surface layer might contain traces of martensite induced by the sample preparation, which would underestimate its real amount of austenite/bainite.
The microstructure was revealed by the same process that was just described, followed by a final etching with a 2% Nital solution, more appropriate for fine microstructures than the commonly used metallographic preparation procedure [20]. The microstructure was observed under a JEOL JSM-6500 field emission gun scanning electron microscope (FEG-SEM, JEOL Ltd, Tokyo, Japan) operating at 10 kV. Specimens were inspected throughout the transverse circular section of the dilatometry samples.
The thermal etching technique has been used to reveal the prior austenite grains size (PAGS). This technique allows the austenite grain boundaries to be revealed in dummy samples previously subjected to the same austenisation treatments but vacuum cooled to room temperature instead (cooling rate ~10 °C/s), in order to prevent the darkening of the sample surface due to the residual oxygen present in the helium gas, which is the inert gas normally used to control the cooling rate in the dilatometer. Special sample preparation conditions are given elsewhere [21,22]. Once the parent grains were revealed, their areas were measured on light optical micrographs by an image processing program [23], from which the equivalent diameter of the grains could be calculated. Note that at least 200 grains were measured per condition.

3. Results and Discussion

3.1. Austenitisation Conditions

A first set of experiments, to accurately determine the Ac3 temperature of both alloys, consisted of austenitising at a heating rate of 5 °C/s above 1050 °C, holding for 5 min and cooling down at 20 °C/s. Dilatometric curves of the relative change in length (RCL) vs. temperature, as can be seen in Figure 1, were used to determine the Ac3 temperatures [24]. Results thus obtained are summarized in Table 1. Based on these results, the selected austenitisation temperature ( T γ ) range was set between 925–1125 °C and 950–1100 °C for the Sp11 and OVA steel, respectively, in steps of 50 °C. It should be noted that the selected cooling rate after austenitisation, 20 °C/s, is only enough to allow the martensitic transformation to take place.
The martensite start temperature, Ms, was measured at all selected T γ conditions, and when possible, the prior austenite grain size (PAGS) was revealed and measured as well; the results thus obtained are presented in Figure 2. It is clear that the effect of the austenitisation heat treatment and thus, of the PAGS on the Ms of the steels, is very limited if not negligible, which agrees with recent reports that show that average austenite grain sizes above 15–20 µm have a negligible effect on the Ms temperature of steels [25,26,27].

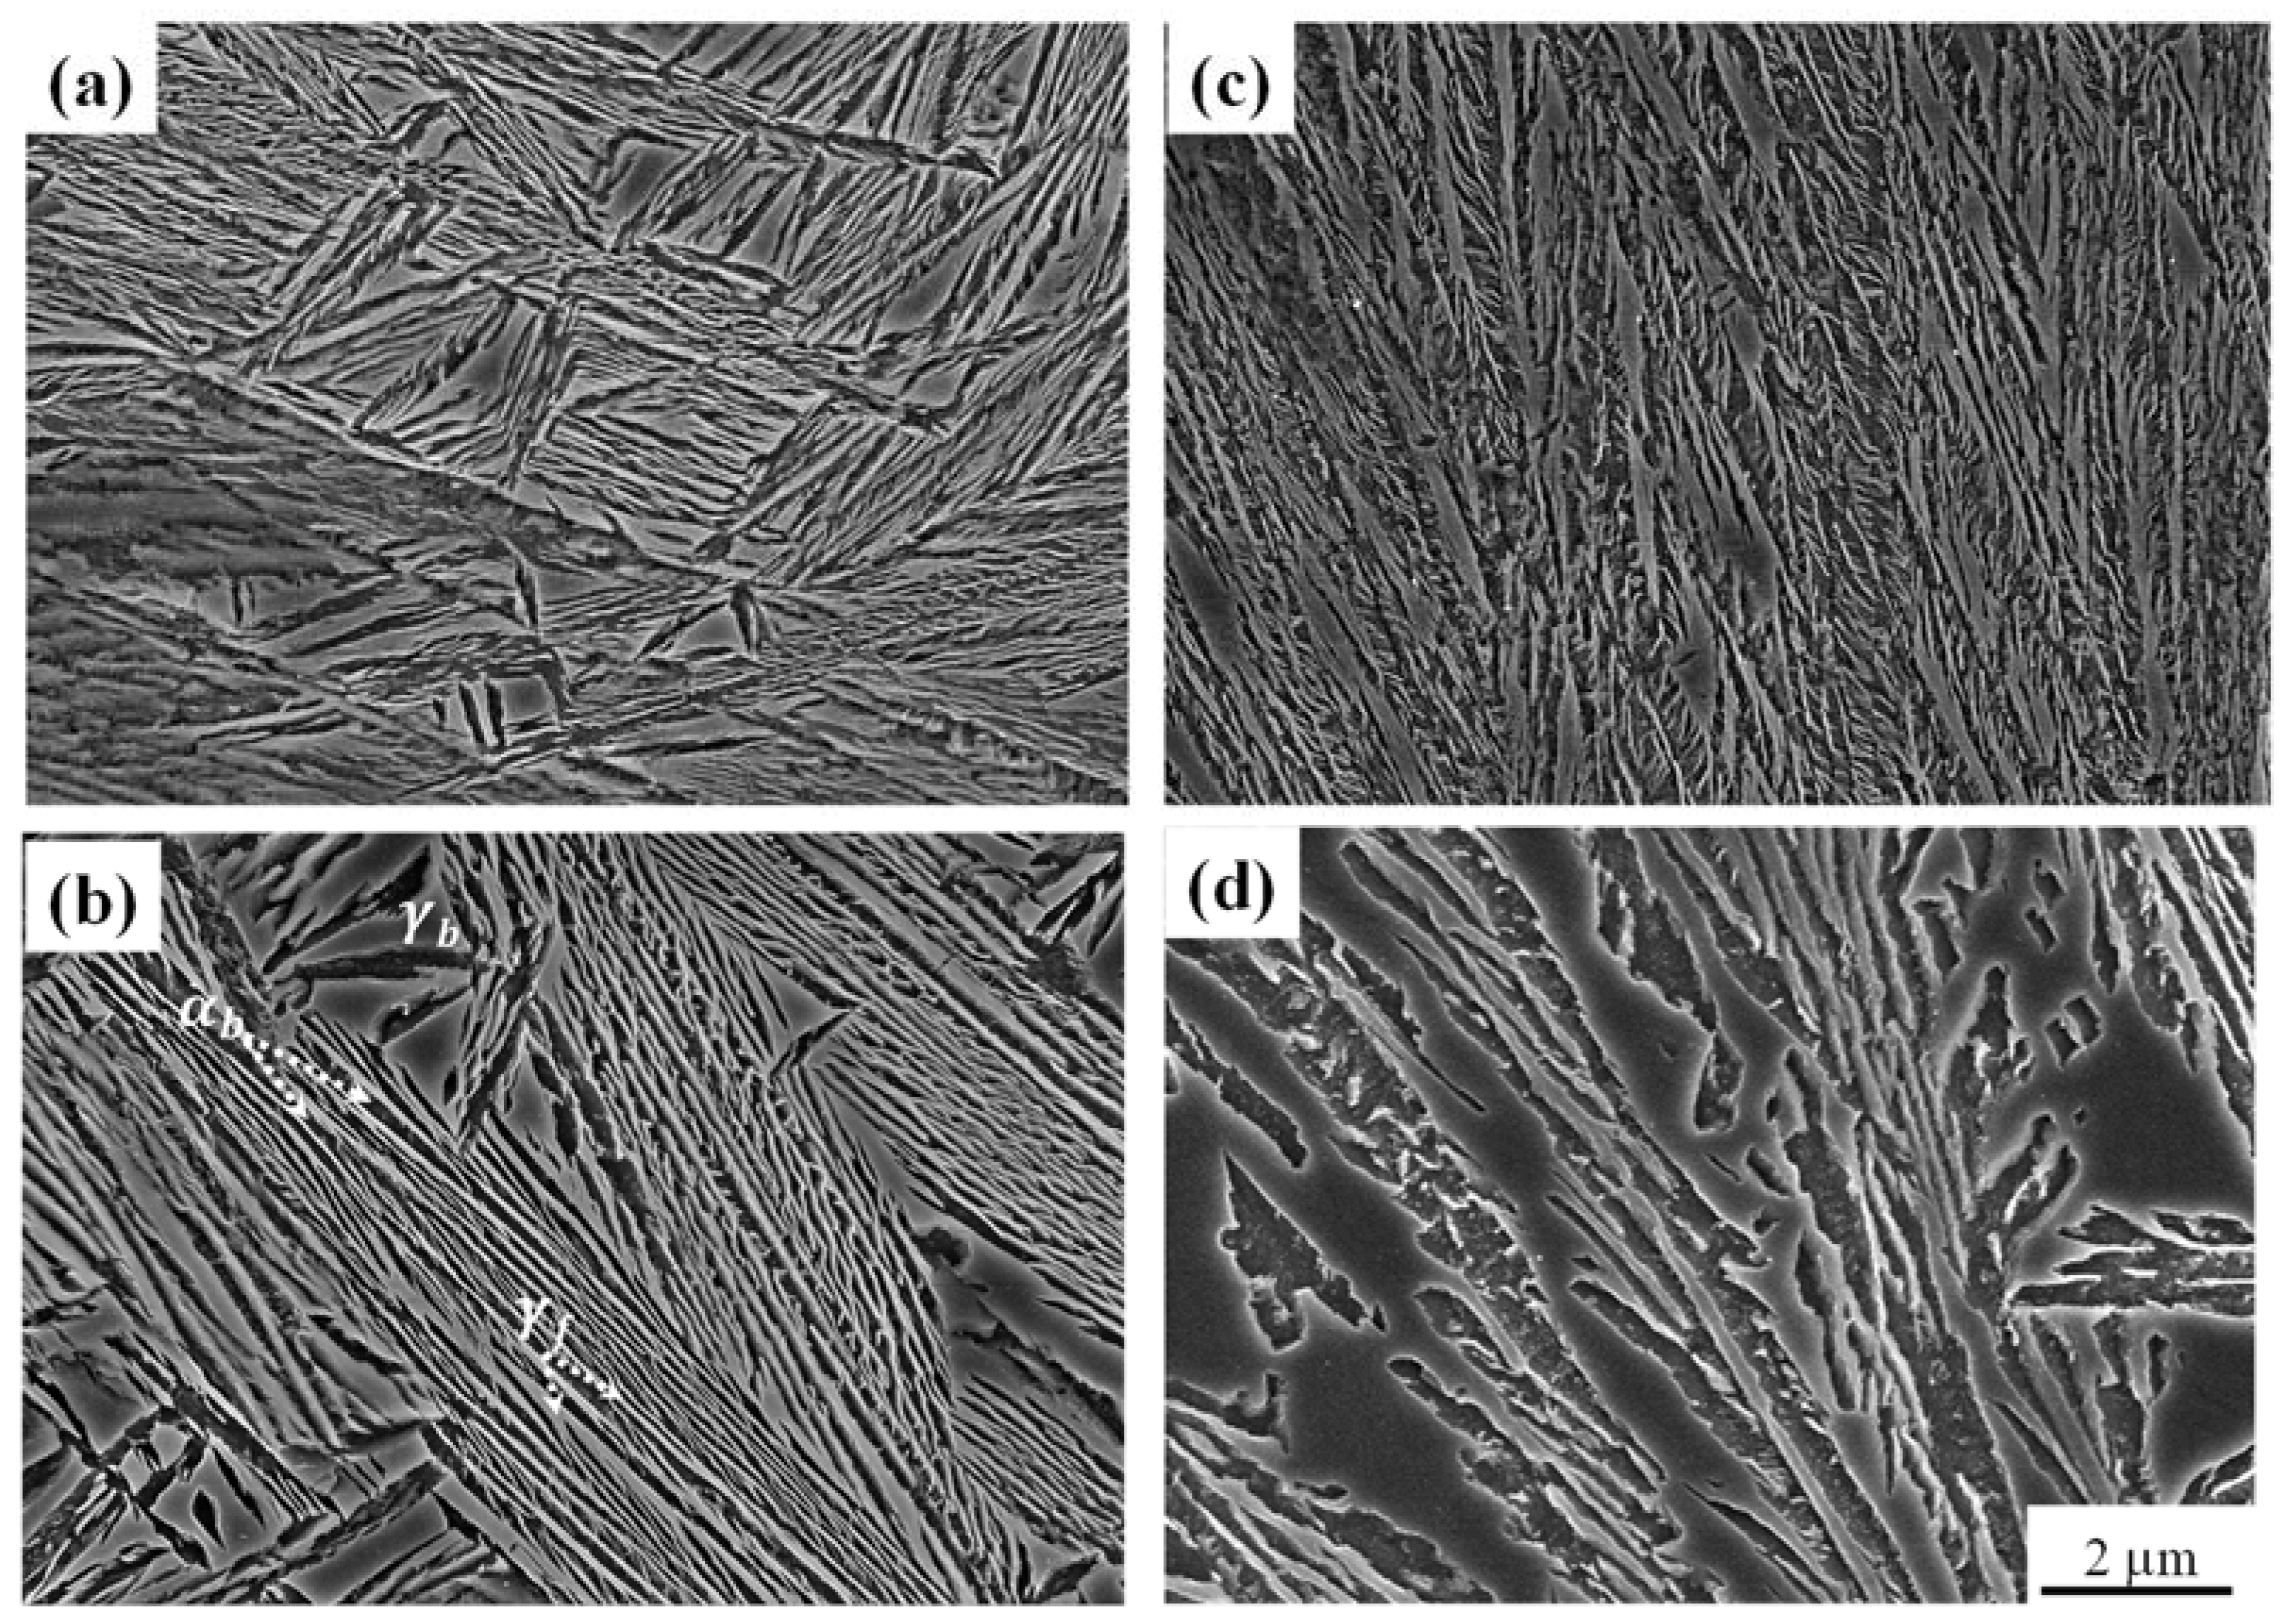
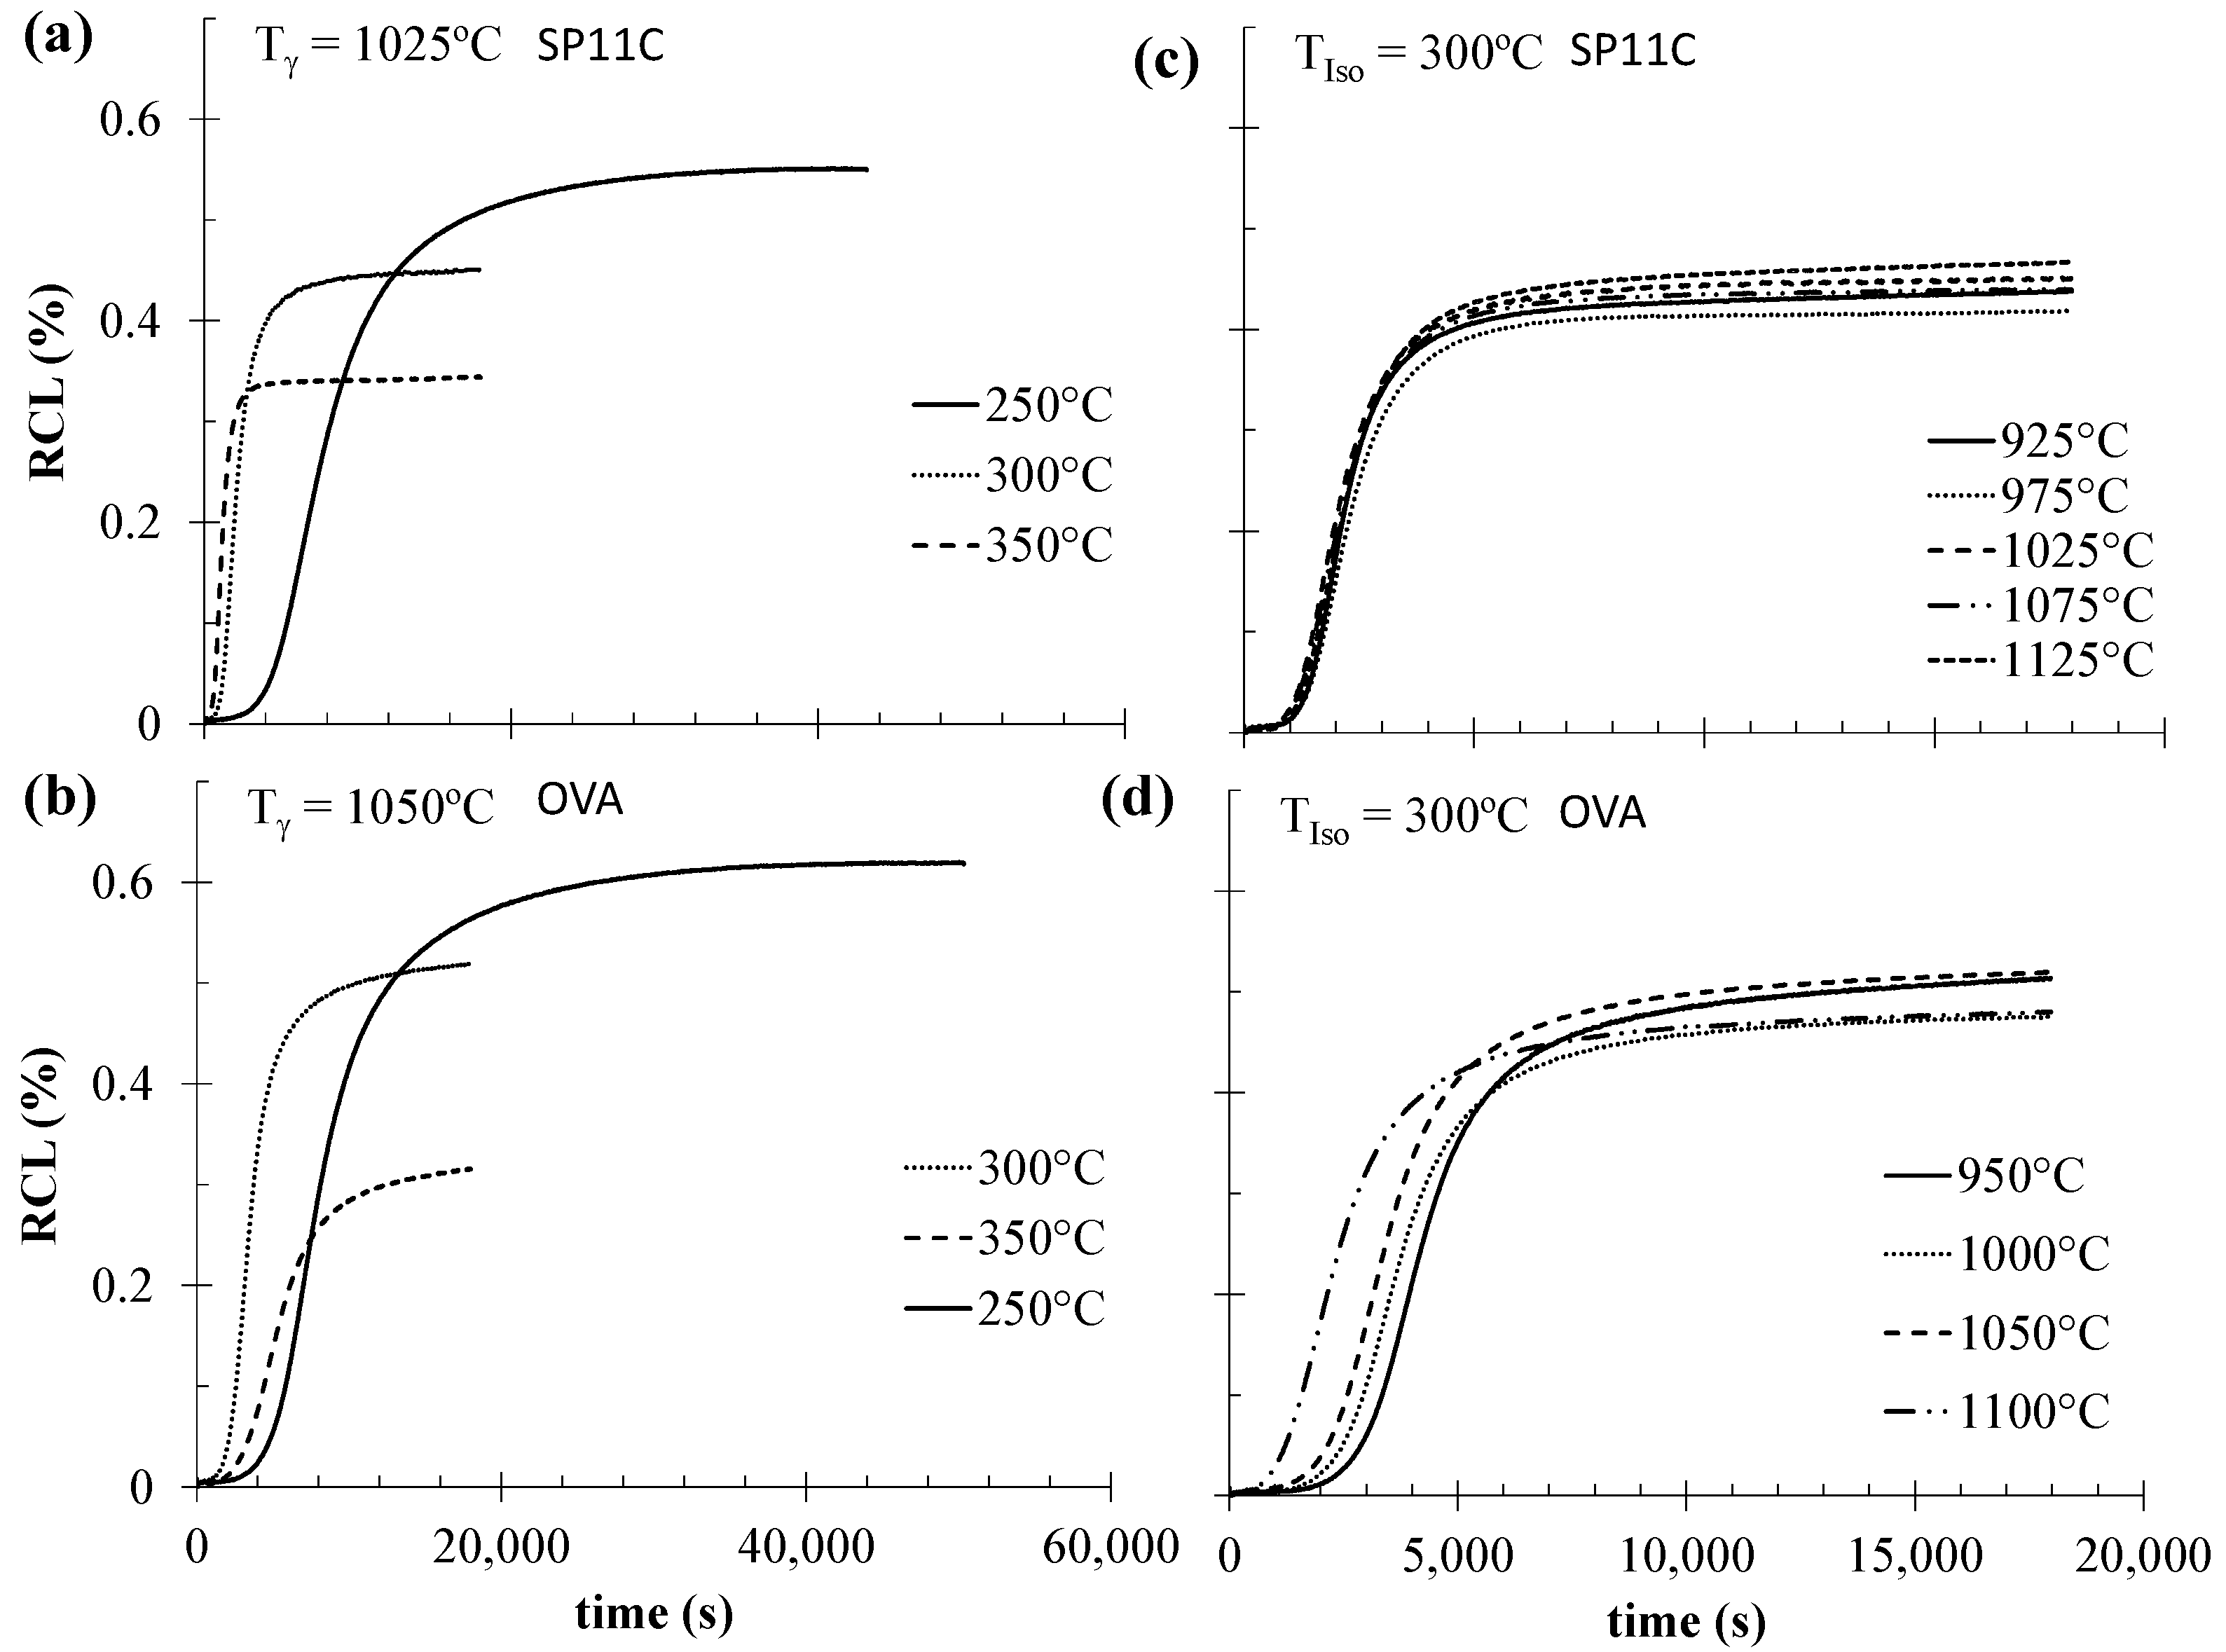
3.2. Bainitic Transformation Conditions

Based on the results from the previous section, the selected isothermal transformation temperatures ( T Iso ) to develop bainite were 250, 300 and 350 °C for both alloys. The times selected, t Iso , were adapted to the chemical compositions in order to ensure that the bainitic transformation reached its completion. Those times varied between 12–14 h at 250 °C and 5 h at 300 and 350 °C. Further details on the determination of T Iso t Iso can be found in previous works [28,29,30,31].
Under all studied conditions, and for both alloys, the final microstructures consisted of bainite, i.e., bainitic ferrite ( α b ) and retained austenite ( γ ), either as thin films ( γ f ) trapped between the plates or as blocks ( γ b ), trapped between the sheaves of bainite. The XRD results in Figure 3 show that the microstructures are mainly composed of bainitic ferrite, whose amounts ( V b ), which are very similar between both steels, tend to decrease as the isothermal temperature increases [1]. Irrespective of the PAGS, at a given T Iso , the bainitic ferrite fraction V b was almost the same since they were driven to transform under the same magnitude of chemical driving force. It is important to highlight the fact that, after bainitic transformation, martensite formation was not detected by dilatometry in any of the tested conditions.
Selected examples of the typical diffraction patterns and microstructures obtained are presented in Figure 3 and Figure 4, respectively.
The distinctive sigmoidal curve obtained by dilatometry during the isothermal bainitic transformation has three regions that define the progress of bainite reaction (Figure 5). An initial period where the transformation has not yet started or is not detectable (RCL~0) leads to the start and progress of the transformation (rapid increase in RCL) and when it is finished, and no further transformation occurs, a steady state is reached (RCL~const.). Thus, at a given T γ , and for different T Iso , the kinetics of the transformation is easily debatable when comparing the temporal evolution of the RCL curves (see Figure 5a,b). It has to be noted that under the assumption of isotropic transformation, the magnitude of the RCL of the plateaus, in Figure 5 curves, is directly related to the amount of bainitic ferrite formed ( V b ); in this sense, it is clear that the dilatometry results and those obtained by XRD, Figure 3, align.
For SP11C, the transformation becomes slower as T Iso decreases, while for OVA steel, although the slowest transformation is at 250 °C, the fastest is detected at the intermediate temperature of 350 °C. However, such an analysis can become an almost impossible task, when using the same type of curves, or when one tries to elucidate the effect that T γ has on the bainitic transformation, as can be seen in the curves at T Iso = 300 °C in Figure 5c,d.
In this work, the method that the authors propose is based on the derivate of the RCL (DRCL) curve and the analysis of the width of its bell shape. Figure 6 shows two selected examples, with very different transformation kinetics, to explain the proposed methodology, both corresponding to the SP11C alloy austenitised at T γ = 975 °C and isothermally treated at 250 and 350 °C, with very slow and very fast transformation, respectively.
Obviously, the DRCL is a reflection of the actual RLC, showing that after the initial incubation period, the transformation rate increases dramatically, reaching a maximum (Max., t max ) after which the transformation decelerates. It is important to note that the maximum transformation rate occurs relatively early in the experiment and, therefore, t max is independent of both the exact duration of the test and also whether the asymptotic line at the end of the curve is actually reached or not. From the same Figure 6, it is also evident that the deceleration process is not constant, and the transformation becomes very sluggish as it advances toward its completion; for example, in the more evident case of the transformation at 250 °C where the distance between the t max and t f continuously increases as the transformation advances. In order to parametrize such behaviour, it is proposed to adopt a similar approach as that used, for example, in the XRD peak broadening analysis, by determining the full width at half maximum (FWHM). In the present example, in Figure 6, three possibilities are explored and denoted as FW@M, where @ identifies the height of the maximum at which the analysis is performed, i.e., 1 / 2 , 1 / 4 and 1 / 10 of the maximum, and t o and t f delimit the magnitude and position of the corresponding FW@M (=   t f t o ) . Given the sharp increase in the DRCL plot at the beginning of the transformation, different @ only leads to small differences in t o , and what it is even more important, also to small variations of the RCL, i.e., the amount of bainitic ferrite transformed. As an example, for the 250 °C case, the variation in time measured between the t o at 1 / 2 and 1 / 10 is of 28 min and the estimated difference in the amount transformed is ~4% while in the case of T Iso = 350 °C, the time span is 6 min with a variation in the amount of bainite of ~4%. The same calculation for the t o at 1 / 4 and 1 / 10 reduces the differences in time and the amount of bainite to 14 min/~1% and 3 min/~1% for the 250 and 350 °C case, respectively. The estimation of the amount of bainitic ferrite at a given time (t) is given as ( RCL ) t   ( V b ) steady   state ( RCL ) steady   state .
On the contrary, as the transformation proceeds and it becomes slower, the lower the @ value is, the bigger the t f is. However, since in this region the RCL curve is already close to the plateau, the variations in RCL are not as great as those in t o . Again, a rough estimation in the intervals @ 1 2 and 1 10 and 1 4 and 1 10 reveals differences in the time and amount of bainite of 113 min/~14% and 68 min/~4% for the 250 °C test, while for the 350 °C case, differences are 15 min/~10% and 8 min/~4%.
In view of these results, it seems sensible to assume that regardless of the chosen @ value, t o will provide a fair estimation of the beginning of the transformation, while for the t f , it will be more reasonable to use a small value of @, i.e., 1 10 , which represents 90 and 94% of transformation at 250 °C and 350 °C, respectively.
With this type of calculation, it is possible to draw the TTT diagrams using the systematic approach just described, as seen in Figure 7, which shows the fronts corresponding to t o @ 1 10 , t max and t f @ 1 10 . In the case of the OVA steel, the fronts of the TTT diagram correspond to those typical C shapes, implying that the transformation is faster at the intermediate T of 300 °C, slower at 350 °C and much slower at the lowest isothermal T of 250 °C. SP11C shows, on the other hand, the typical transformation front of higher C bainitic steels [32,33], where the transformation becomes slower as T Iso decreases.
Even with this type of diagram, there is an inherent difficulty in depicting the influence of the PAGS on the bainite transformation kinetics. Three parameters have been selected for a better comparison of the transformation kinetics, see Figure 8. These are t o (@= 1 10 ) as the initial time for the transformation; FW@M (@= 1 10 ) as the time lapse for most of the transformation to take place; and finally, the slope of the DRLC curve between t f @ 1 4 and t f @ 1 10 , χ in Figure 6, which provides an estimation of the sluggishness of the transformation at its later stages. Note that higher absolute values of χ must be interpreted as a faster approach to the end of the transformation at its later stages, i.e., the transformation would become less sluggish.
As for the effect of the T γ and thus, the PAGS (Figure 2), on the bainitic transformation kinetics, the initial period ( t o (@= 1 10 ) ) in the OVA steel decreases as the T γ /PAGS increases, with a sharp decrease at the highest T γ /PAGS and being more pronounced at the lowest T Iso . Interestingly, the time span of the transformation, FW@M, does not seem to change much and only relevant differences are found at the highest T Iso (350 °C), where it seems that transformation shortens as the T γ PAGS increases. The sluggishness (χ) of the transformation seems to be almost unaffected by the T γ PAGS with only a mild decrease in it for the highest T Iso and T γ .
For the SP11C alloy, two regimes are observable. The first one corresponds to T γ = 925–1025 °C where the PAGS is < 70 µm (Figure 2) and the t o and FW@M behaviour in both alloys is essentially the same. On the other hand, as the PAGS increases above 70 µm with T γ (1025–1125 °C), t o seems to remain steady, while FW@M only shows a relevant increase at T Iso = 250 °C, remaining roughly invariant for the other two temperatures.
The χ parameter behavior is more complex, as it depends on the T Iso . Thus, the transformation rate reduces weakly as T γ increases at the lowest T Iso , while at 300 °C, a stronger reduction is observed up to T ≤ 1025 °C (PAGS < 70 µm) when it becomes faster. As for the 350 °C treatments, the opposite situation is detected, as the last stages of the transformation become faster up to PAGS < 70 µm, moment at which it becomes slower.
Broadly speaking, it can be concluded that increasing the PAGS up to 70 µm leads to an increase in the bainite nucleation rate ( t o ), this effect being more pronounced for the lowest T Iso and for the OVA steel. However, the results suggest that the overall transformation kinetics (FW@M) is weakly affected by the applied heat treatment ( T γ and T Iso ). When the PAGS > 70 µm (results only available for SP11C steel, T γ > 1050 °C), it weakly affects the progress of the transformation ( t o , FW@M), except for T Iso = 250 °C, for which larger T γ /PAGS accelerate the nucleation and overall transformation kinetics, suggesting that, in this steel, the autocatalytic effect may become important for larger PAGS and low T Iso . The results found in SP11C seem to be in line with the observations of Hu et al. [14], who observed that there seems to be a critical PAGS below and above which there is a distinctly grain size effect. Nonetheless, the reasons lying beneath the existence of a critical PAGS beyond which the behaviour of SP11C alloy changes, are speculative and further research is needed on this topic. This grain size effect might have not been observed in the OVA steel because the grain size is much smaller (Figure 2). Finally, regarding the approach to the later stages of the transformation, no definitive conclusions can be drawn as very different results are found in the steels under study as a function of T γ and T Iso .

4. Summary

A methodology, based on the three defining dilatometric parameters extracted from the derivative of the relative change in length (DRCL), has been proposed to analyse the transformation kinetics of bainitic transformation:
(1) The initial time for the transformation, represented by t o (@ = 1 10 ) ;
(2) The time lapse for most of the transformation to take place, represented by FW@M (@ = 1 10 ), the full width at 1 10 of the height of the DRLC curve;
(3) The slope of the DRLC curve between t f @ 1 4 and t f @ 1 10 ( χ ), as an indication of the sluggishness of the transformation at its later stages, where t o and t f delimit the magnitude and position of the corresponding FW@M (= t f t o ) , respectively, and @ identifies at which height of the maximum of the DRLC curve the analysis is performed.
Such methodology has been tested using a case study in which the influence of the austenitisation temperature ( T γ = 925–1125 °C), i.e., of the prior austenite grain size (PAGS), has on the kinetics of isothermal bainitic transformation ( T Iso = 250, 300, 350 °C) of two high-carbon, high-silicon, bainitic steels.
The results show that increasing the PAGS up to 70 μm increases the bainite nucleation rate (t0), this effect being more pronounced for the lowest T Iso and for the OVA steel. However, the overall transformation kinetics (FW@M) seems to be weakly affected by the applied heat treatment ( T γ and T Iso ). In the SP11C steel, PAGS > 70 µm ( T γ > 1050 °C) barely affects the progress of the transformation ( t o , FW@M) except for T Iso = 250 °C, for which larger T γ /PAGS accelerate the nucleation and overall transformation kinetics, suggesting that, in this steel, the autocatalytic effect may become important for larger PAGS and low T Iso . This grain size effect might have not been observed in the OVA steel because the grain size is much smaller. Regarding the approach to the later stages of the bainitic transformation (χ), no definitive conclusions can be drawn as very different results are found in the steels under study as a function of T γ and T Iso .

Author Contributions

Data curation, C.G.-M.; funding acquisition, M.K. and C.G.-M.; investigation, D.S.-M.; methodology, C.G.-M.; project administration, M.K. and C.G.-M.; resources, F.G.C.; writing—original draft, C.G.-M.; writing—review and editing, D.S.-M., M.K., F.G.C. and C.G.-M. All authors have read and agreed to the published version of the manuscript.

Funding

This research was funded by the European Research Fund for Coal and Steel under the Contracts RFCS-2016-754070 and RFCS-2019-899251.

Institutional Review Board Statement

Not applicable.

Informed Consent Statement

Not applicable.

Data Availability Statement

Not applicable.

Acknowledgments

The authors also acknowledge the support of the following laboratories at CENIM: X-ray diffraction, Metallography and Phase Transformations, in addition to Ovako for kindly providing the OVA steel grade.

Conflicts of Interest

The authors declare no conflict of interest.

References

  1. Bhadeshia, H.K.D.H. Bainite in Steels. Theory and Practice, 3rd ed.; Maney Publishing: London, UK, 2015; ISBN 978-1-909662-74-2. [Google Scholar]
  2. Tszeng, T.C. Autocatalysis in bainite transformations. Mater. Sci. Eng. A 2000, 293, 185–190. [Google Scholar] [CrossRef]
  3. Bhadeshia, H.K.D.H.; Christian, J.W. Bainite in steels. Metall. Trans. A 1990, 21, 767–797. [Google Scholar] [CrossRef]
  4. Kvačkaj, T.; Mamuzic, I. A quantitative characterization of austenite microstructure after deformation in nonrecrystallization region and its influence on ferrite microstructure after transformation. Iron Steel Inst. Jpn. 1998, 38, 1270–1276. [Google Scholar] [CrossRef] [Green Version]
  5. Ravi, A.M.; Sietsma, J.; Santofimia, M.J. Bainite formation kinetics in steels and the dynamic nature of the autocatalytic nucleation process. Scr. Mater. 2017, 140, 82–86. [Google Scholar] [CrossRef]
  6. García-Junceda, A.; Capdevila, C.; Caballero, F.G.; de Andrés, C.G. Dependence of martensite start temperature on fine austenite grain size. Scr. Mater. 2008, 58, 134–137. [Google Scholar] [CrossRef] [Green Version]
  7. Furuhara, T.; Kikumoto, K.; Saito, H.; Sekine, T.; Ogawa, T.; Morito, S.; Maki, T. Phase transformation from fine-grained austenite. Iron Steel Inst. Jpn. 2008, 48, 1038–1045. [Google Scholar] [CrossRef] [Green Version]
  8. Umemoto, M.; Horiuchi, K.; Tamura, I. Transformation kinetics of bainite during isothermal holding and continuous cooling. Trans. Iron Steel Inst. Jpn. 1982, 22, 854–861. [Google Scholar] [CrossRef] [Green Version]
  9. Lee, S.J.; Park, J.S.; Lee, Y.K. Effect of austenite grain size on the transformation kinetics of upper and lower bainite in a low-alloy steel. Scr. Mater. 2008, 59, 87–90. [Google Scholar] [CrossRef]
  10. Garcia-Mateo, C.; Caballero, F.G.; Bhadeshia, H.K.D.H. Acceleration of low-temperature bainite. Iron Steel Inst. Jpn. 2003, 43, 1821–1825. [Google Scholar] [CrossRef] [Green Version]
  11. Matsuzaki, A.; Bhadeshia, H.K.D.H. Effect of austenite grain size and bainite morphology on overall kinetics of bainite transformation in steels. Mater. Sci. Technol. 1999, 15, 518–522. [Google Scholar] [CrossRef]
  12. Jiang, T.; Liu, H.; Sun, J.; Guo, S.; Liu, Y. Effect of austenite grain size on transformation of nanobainite and its mechanical properties. Mater. Sci. Eng. A 2016, 666, 207–213. [Google Scholar] [CrossRef]
  13. Xu, G.; Liu, F.; Wang, L.; Hu, H. A new approach to quantitative analysis of bainitic transformation in a superbainite steel. Scr. Mater. 2013, 68, 833–836. [Google Scholar] [CrossRef]
  14. Hu, F.; Hodgson, P.D.; Wu, K.M. Acceleration of the super bainite transformation through a coarse austenite grain size. Mater. Lett. 2014, 122, 240–243. [Google Scholar] [CrossRef]
  15. Yuan, L.; Liu, Q.; Li, H.; Gao, B. Effect of austenitizing temperature on the bainitic transformation in a high-carbon high-silicon steel. Met. Sci. Heat Treat. 2015, 57, 156–160. [Google Scholar] [CrossRef]
  16. Hasan, S.M.; Kumar, S.; Chakrabarti, D.; Singh, S.B. Effect of prior austenite grain size on the formation of carbide-free bainite in low-alloy steel. Philos. Mag. 2020, 100, 1–15. [Google Scholar] [CrossRef]
  17. Bhadeshia, H.K.D.H.; Edmonds, D.V. The bainite transformation in a silicon steel. Metall. Trans. A 1979, 10, 895–907. [Google Scholar] [CrossRef]
  18. Garcia-Mateo, C.; Caballero, F.G.; Miller, M.K.; Jimenez, J.A. On measurement of carbon content in retained austenite in a nanostructured bainitic steel. J. Mater. Sci. 2012, 47, 1004–1010. [Google Scholar] [CrossRef]
  19. Dickson, M.J. Significance of texture parameters in phase analysis by X-Ray diffraction. J. Appl. Crystallogr. 1969, 2, 176–180. [Google Scholar] [CrossRef]
  20. Vander Voort, G.F. Metallography: Principles and Practice; ASM International: Materials Park, OH, USA, 1999; ISBN 978-0-87170-672-0. [Google Scholar]
  21. García de Andrés, C.; Caballero, F.G.; Capdevila, C.; San Martín, D. Revealing austenite grain boundaries by thermal etching: Advantages and disadvantages. Mater. Charact. 2002, 49, 121–127. [Google Scholar] [CrossRef] [Green Version]
  22. San Martín, D.; Palizdar, Y.; Cochrane, R.C.; Brydson, R.; Scott, A.J. Application of Nomarski differential interference contrast microscopy to highlight the prior austenite grain boundaries revealed by thermal etching. Mater. Charact. 2010, 61, 584–588. [Google Scholar] [CrossRef] [Green Version]
  23. Schneider, C.A.; Rasband, W.S.; Eliceiri, K.W. NIH image to ImageJ: 25 years of image analysis. Nat. Methods 2012, 9, 671–675. [Google Scholar] [CrossRef]
  24. Caballero, F.G.; Capdevila, C.; de Andrés, C.G. Modelling of kinetics of austenite formation in steels with different initial microstructures. Iron Steel Inst. Jpn. 2001, 41, 1093–1102. [Google Scholar] [CrossRef] [Green Version]
  25. van Bohemen, S.M.C.C.; Morsdorf, L. Predicting the Ms temperature of steels with a thermodynamic based model including the effect of the prior austenite grain size. Acta Mater. 2017, 125, 401–415. [Google Scholar] [CrossRef]
  26. Celada-Casero, C.; Sietsma, J.; Santofimia, M.J. The role of the austenite grain size in the martensitic transformation in low carbon steels. Mater. Des. 2019, 167, 107625. [Google Scholar] [CrossRef]
  27. Arlazarov, A.; Soares Barreto, E.; Kabou, N.; Huin, D. Evolution of Ms temperature as a function of composition and grain size. Metall. Mater. Trans. A 2020, 51, 6159–6166. [Google Scholar] [CrossRef]
  28. Garcia-Mateo, C.; Jimenez, J.A.J.A.; Lopez-Ezquerra, B.; Rementeria, R.; Morales-Rivas, L.; Kuntz, M.; Caballero, F.G. Analyzing the scale of the bainitic ferrite plates by XRD, SEM and TEM. Mater. Charact. 2016, 122, 83–89. [Google Scholar] [CrossRef]
  29. Morales Rivas, L. Microstructure and Mechanical Response of Nanostructured Bainitic Steels; CSIC—Centro Nacional de Investigaciones Metalúrgicas (CENIM): Madrid, Spain; Universidad Carlos III de Madrid: Getafe, Spain, 2016. [Google Scholar]
  30. Sherif, M.Y. Characterisation and Development of Nanostructured, Ultrahigh Strength, and Ductile Bainitic Steels. Ph.D. Thesis, University of Cambridge, Cambridge, UK, 2006. [Google Scholar]
  31. Garcia-Mateo, C.; Caballero, F.G.; Capdevila, C.; de Andres, C.G.d.G. Estimation of dislocation density in bainitic microstructures using high-resolution dilatometry. Scr. Mater. 2009, 61, 855–858. [Google Scholar] [CrossRef] [Green Version]
  32. Garcia-Mateo, C.; Caballero, F.G.; Bhadeshia, H.K.D.H. Development of hard bainite. Iron Steel Inst. Jpn. 2003, 43, 1238–1243. [Google Scholar] [CrossRef] [Green Version]
  33. Sourmail, T.; Smanio, V.; Ziegler, C.; Heuer, V.; Kuntz, M.; Caballero, F.G.; Garcia-Mateo, C.; Cornide, J.; Elvira, R.; Leiro, A.; et al. Novel nanostructured bainitic steel grades to answer the need for high-performance steel components (Nanobain). RFSR-CT-2008-00022. In European Commission Directorate G—Industrial Technologies, Unit G.5—Research Fund for Coal and Steel; Directorate-General for Research and Innovation, Ed.; European Commission: Luxembourg, 2013; ISBN 978-92-79-29234-7. [Google Scholar]
Figure 1. Relative change in length (RCL) during heating (5 °C/s) and cooling (20 °C/s) from different T γ in SP11C and OVA steels.
Metals 11 00324 g001
Figure 2. Evolution of the martensite start temperature (Ms) and the prior austenite grain size (PAGS) as a function of the austenitisation temperature ( T γ ) in SP11C and OVA steels.
Metals 11 00324 g002
Figure 3. Amount (%) of bainitic ferrite ( V b ) as a function of T γ and T Iso in SP11C and OVA steels. Illustrative XRD patterns for OVA steel after austenitisation at 1050 °C and isothermal treatment at the indicated temperatures.
Metals 11 00324 g003
Figure 4. Selected examples of bainitic microstructures, for steel SP11C treated at T γ = 925 °C and (a) T Iso = 250 °C and (b) T Iso = 300 °C, for steel OVA treated at T γ = 1050 °C and (c) T Iso = 250 °C and (d) T Iso = 300 °C. Where α b stands for bainitic ferrite and γ f and γ b for retained austenite films and blocks. Note that scale bar applies to all images.
Metals 11 00324 g004
Figure 5. Examples of the relative change in length (RCL) during isothermal treatments, for different TIso at a given T γ (a,b), and for the same TIso the effect of the T γ (c,d).
Metals 11 00324 g005
Figure 6. The relative change in length (RCL) and its derivate (DRCL) during two characteristic isothermal treatments, corresponding to the SP11C alloy austenitised at T γ = 975 °C and isothermally treated at 250 and 350 °C.
Metals 11 00324 g006
Figure 7. For both steels, TTT diagrams presenting the fronts for the t o and t f @   1 10 and t max at different T γ .
Metals 11 00324 g007
Figure 8. Selected dilatometric parameters for the comparison of bainite transformation kinetics.
Metals 11 00324 g008
Table 1. The chemical composition of the low-temperature bainitic alloys used in this study, all in wt. % (with Fe to balance). Ac3 temperature (in °C), after heating at 5 °C/s, has been estimated from dilatometric experiments.
AlloyCSiMnCrMoCoAlAc3
Sp11C0.81.6210.2441.7870 ± 8
OVA0.71.51.310.2400820 ± 11
Publisher’s Note: MDPI stays neutral with regard to jurisdictional claims in published maps and institutional affiliations.

