Article

Effect of Microsegregation and Bainitic Reaction Temperature on the Microstructure and Mechanical Properties of a High-Carbon and High-Silicon Cast Steel

by
Alejandro Basso
1,*,
Adriana Eres-Castellanos
2,
Nicolás Tenaglia
1,
David San-Martin
2,
José Antonio Jimenez
2 and
Francisca G. Caballero
2
1
Department of Metallurgy, INTEMA—CONICET, University of Mar del Plata, Mar del Plata 7600, Argentina
2
MATERALIA Research Group, Department of Physical Metallurgy, Centro Nacional de InvestigacionesMetalúrgicas (CENIM—CSIC), E-28040 Madrid, Spain
*
Author to whom correspondence should be addressed.
Metals 2021, 11(2), 220; https://doi.org/10.3390/met11020220
Submission received: 7 January 2021 / Revised: 16 January 2021 / Accepted: 20 January 2021 / Published: 27 January 2021
(This article belongs to the Special Issue Advanced High-Strength Bainitic Steels)

Abstract

:
Bainitic microstructures obtained in high-carbon (HC) and high-silicon (HSi) steels are currently of great interest. Microstructural evolution and the bainitic transformation kinetics of a high-carbon and high-silicon cast steel held at 280, 330, and 380 °C was analyzed using dilatometry, X-ray diffraction, optical and scanning electron microscopy, and electron backscatter diffraction (EBSD). It is shown that the heterogeneous distribution of silicon (Si), manganese (Mn), and chromium (Cr) associated to microsegregation during casting has a great impact on the final microstructure. The transformation starts in the dendritic zones where there is a lower Mn concentration and then expands to the interdendritic ones. As Mn reduces the carbon activity, the interdendritic areas with a higher Mn concentration are enriched with carbon (C), and thus, these zones contain a greater amount of retained austenite plus martensite, resulting in a heterogeneous microstructure. Higher transformation temperatures promote higher amounts of residual austenite with poor thermal/mechanical stability and the presence of martensite in the final microstructure, which has a detrimental effect on the mechanical properties. Tensile tests revealed that the ultra-fine microstructure developed by the transformation at 280 °C promotes very high values of both tensile and yield stress (≈1.8 GPa and 1.6 GPa, respectively), but limited ductility (≈2%).

1. Introduction

Nowadays, metal casting is widely used to produce high-performance parts or components [1,2]. One of the advantages of the casting process is the flexible design in terms of shape and dimensions of the cast parts, especially with complex shapes and hollow section parts. Moreover, casting offers exceptional capacity for detailed designs, often eliminating the need for additional fabrication and the assembly of different parts. In addition, the casting process is highly adaptable to the requirements of mass production, since a large number of cast parts can be produced quickly [3,4]. Many metals can be cast, but iron and steel in particular feature excellent mechanical properties for a wide range of applications, including transport, construction, farming, mining, machine tools, and defense, among others [5].
However, cast parts present some defects that attempt against its performance [6,7,8,9,10,11]. Most of these defects, which are shrinkage cavities, inclusions, cracks, or hot tearing, among others, can be avoided by a proper feeding and gating designs; however, microsegregation cannot be totally suppressed and is the main characteristic of castings. Microsegregation occurs during solidification due to different partition coefficients of alloying elements in solid and liquid phases, and it produces a heterogeneous distribution of solute at the dendritic scale. In the case of the solidification of steels in sand molds, microsegregation can be a problem, especially when the cast parts need to be subjected to heat treatments to achieve a desired final microstructure. This is because solid-state transformations are influenced by the chemical composition, and therefore, a chemical heterogeneity in the parts could generate the presence of brittle phases after a particular thermal cycle, obtaining a poor mechanical behavior [12,13,14,15]. On the other hand, when castings are subjected to heat treatments the presence of microsegregation could generate microstructures in which the matrix phases formed during cooling are distributed heterogeneously [16,17,18,19,20]. For example, this microsegregation often promotes, in wrought steel parts, after rolling, microstructures that can display what it is named as “microstructural banding”, which has its origin in the presence of a “chemical banding”, and which can be described as a banded appearance with alternating bands (consisting of planar arrays) of two or more pairs of phases at room temperature: ferrite, pearlite, bainite, and/or martensite [17,18,19]. There have been several studies of the effect of banding on mechanical properties [17,20], showing that the banding has a significant effect on the anisotropy of tensile and fracture properties.
During the last few years, there have been significant advances in the development of high-carbon and high-silicon steels (HC-HSi-Steels) with nano-scale bainitic structures containing retained austenite. Such microstructures are obtained through isothermal heat treatments similar to those used in the production of conventional bainitic steels, and they show excellent mechanical properties compared with other more expensive steels [21,22,23,24]. As it was reported, exceptional results were achieved in terms of tensile, toughness, and wear properties using steels with high carbon content (0.6–1.0 wt.%C) and austempering at low temperatures (250–300 °C); this carbon content allows obtaining carbide-free bainitic steels with a tensile strength of 1600–2000 MPa [25,26,27,28]. Toughness values of nearly 130 MPa m1/2 have been obtained for strength values in the range of 1600–1700 MPa. This compares well with maraging steels, which are at least ninety times more expensive. It is important to point out that tensile properties showed by these microstructures satisfy those specified for advanced high-strength steels (AHSS) in standard ASTM A1088 for complex phase (CP), dual phase (DP), Transformation-Induced Plasticity (TRIP),and also for many maraging steels; and they also satisfy the requirements of standard ASTM A148 for high-strength cast steels, showing much better performance than the minimum required in many cases. Regarding metallic alloy elements, Cr and Mn are commonly added in the chemical composition of these kinds of steel. These alloying elements improve hardenability, avoiding the formation of any other undesired transformation products, such as pearlite, before the isothermal holding in the bainite temperature range, but the alloying additions need to be kept to a minimum in order to accelerate the bainite formation kinetics and to control alloying costs. Typically, additions ranging about 0.5–2.0 wt.%Cr and 0.5–2.0 wt.%Mn are chosen [25,26,27,28].
Most of the reported works in the literature concerned with nano-structured bainitic steels are focused on steels previously homogenized and hot rolled, which significantly affect (reduce) the microsegregation patterns caused during the solidification. However, many steel parts produced for the automotive, mining, or oil industries are normally obtained through the casting process. It is widely recognized that the microstructures and mechanical properties of castings differ from those obtained on rolled or forged parts of the same chemical composition, which is mainly due to the typical casting defects (non-metallic inclusions, porosity, voids, micro-shrinkage, etc.) and to the macro and microsegregation of alloying elements present in the structure.
The aforementioned promotes the study of the performance of potential castings with carbide-free bainitic microstructures, mainly evaluating how the typical casting defects, such as those mentioned above, could affect the microstructures and mechanical properties. That is the case for industrial parts with different geometries and thicknesses such as crankshafts, camshafts, pump bodies, suspension parts, etc., which would be potential applications to be manufactured with this type of bainitic steel due to the remarkable mechanical properties reported by this kind of microstructures.
At the present, a limited number of works were conducted on carbide-free bainitic microstructures obtained from cast steels. As expected, the mechanical properties reported for cast steels are lower than those obtained for wrought steels, particularly regarding total elongation at rupture during tensile tests, which is mainly due to the presence of some defects in the cast pieces such as micro-shrinkage cavities, inclusions, and microsegregation, among others. Putatunda [26] has obtained cast carbide-free bainitic steels with tensile strengths in the range 575–2100 MPa with a maximum elongation of 7%. Fu et al. [27] also reported tensile strengths ranging from 1180 to 1730 MPa and elongations up to 3.5%, while Mandal [28] developed microstructures with an elongation of 27%, but with a tensile strength lower than 700MPa.
The authors of this work have begun to carry out studies in this line of research, particularly in subjects related to the segregation phenomena present in HC-HSi steel. In a previous work, the authors have investigated in detail the macro and microsegregation patterns of Cr, Mn, and Si in a HC-HSi steel, with an appropriate chemical composition to obtain bainitic structures and casted using different keel block sizes [29]. The results have revealed that all these elements segregate into the interdendritic zones during the primary formation of austenite from the melt. This microsegregation behavior implies that the partition coefficient, k, of these elements is lower than unity (k < 1), which causes a significant chemical heterogeneity.
The presence of microsegregation patterns could lead to a non-uniform development of the bainitic reaction in cast parts, modifying its kinetics and the resulting microstructures. This point has not been reported yet, and it is considered of utmost importance when considering the production of castings with carbide-free bainitic microstructures. This work addresses this subject and continues this line of research, evaluating the effect of the microsegregation on the bainite transformation kinetics, microstructures, and mechanical properties for this type of steel. In this regard, the bainite transformation will be evaluated at different austempering temperatures. Then, a microstructural characterization of the resulting microstructures will be performed. Finally, tensile and impact properties will be determined.

2. Materials and Methods
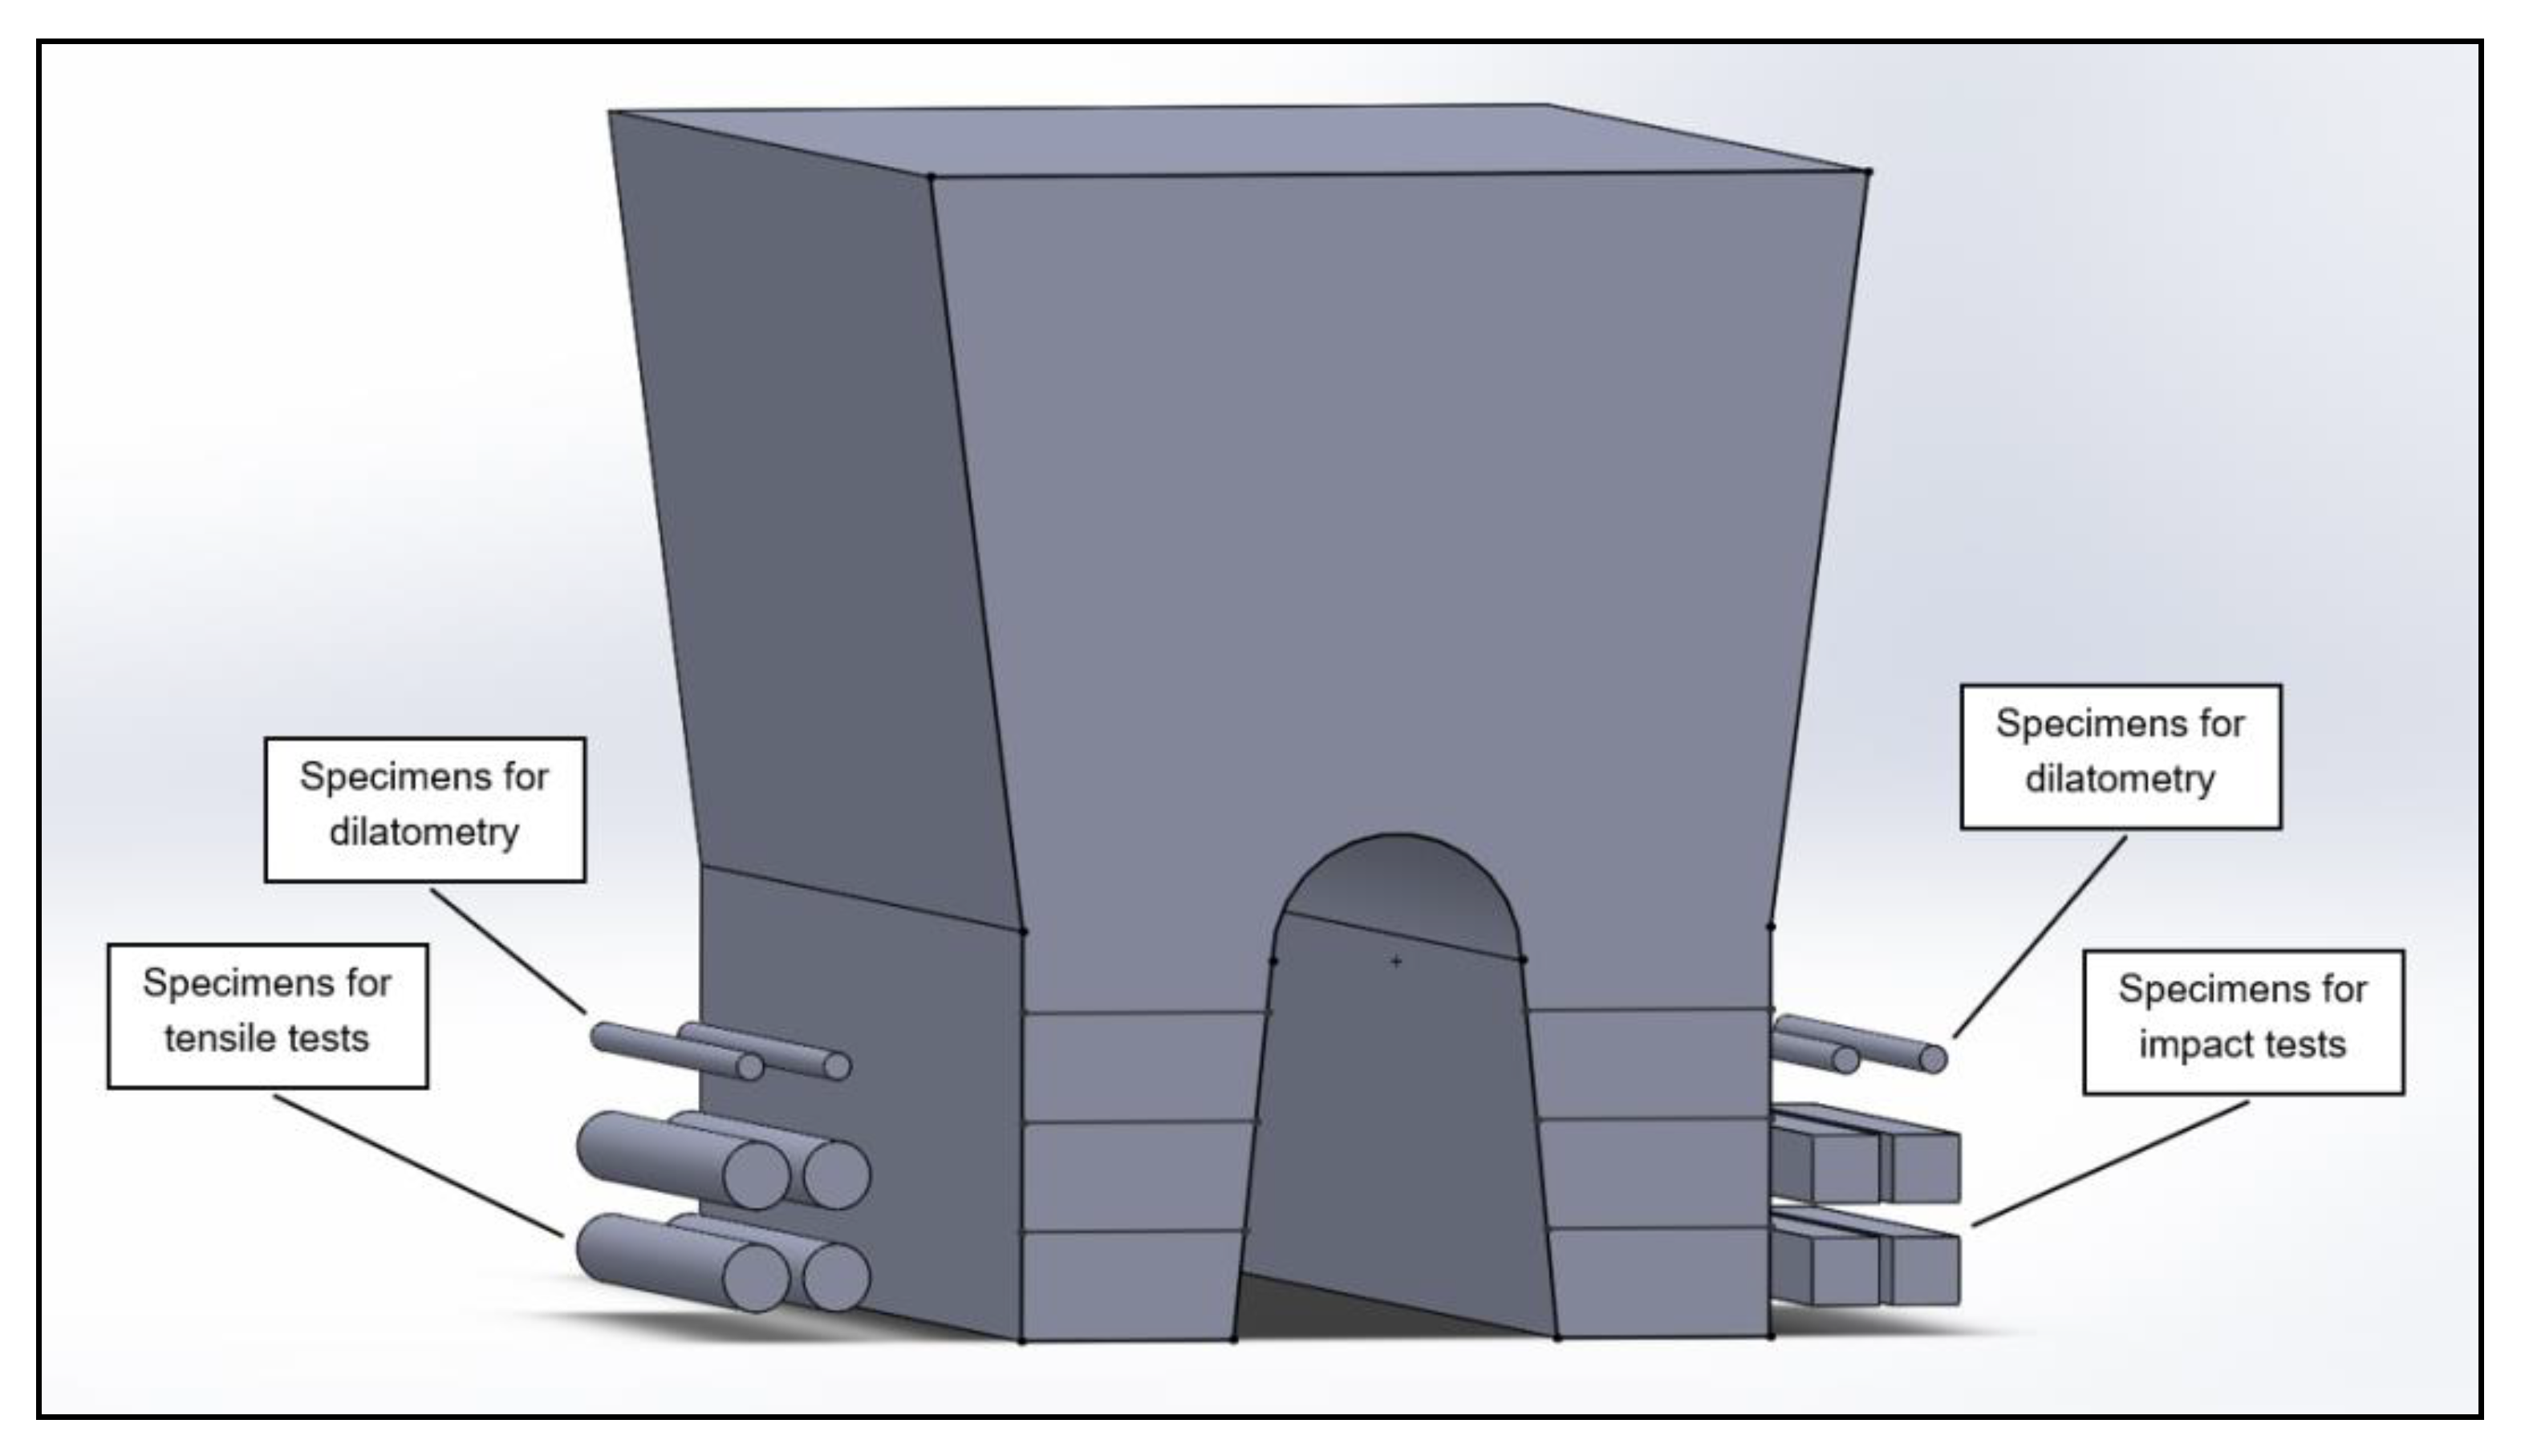
2.1. Material

This study is based on a HC-HSi cast steel alloyed with Cr and Mn. Steel with a chemical composition of Fe-0.8C-2.2Si-1.0Mn-1.1Cr (wt.%) was selected based on several works on bainitic steels reported in the literature [23,24,25,30,31,32]. A high C content promotes the formation of bainite at low temperatures, obtaining very high strength microstructures [30,31,32]. The microsegregation of this steel was studied in a previous work [29], and it was concluded that a mean Si content of 2.2 wt.% ensures suppression of the carbide precipitation from austenite [33]. Finally, Mn and Cr were added in order to increase the steel hardenability [23,30,31,34].
The chemical composition of the manufactured steel was determined by spark emission spectrometry using a Baird DV6 spectrometer (Baird Corporation, Bedford-Massachusetts, MA, USA), according to ASTM D350 standard. The complete chemical composition of the steel is shown in Table 1.
Melt was prepared in an industrial foundry using a high-frequency induction furnace of 120 kg capacity and poured into 25 mm keel block-shaped sand molds (ASTM A703). Keel-blocks were sectioned as shown in Figure 1 to obtain the different samples used for this study.

2.2. Heat Treatments Using a High-Resolution Dilatometer

2.2.1. Determination of the Ms Temperature and the Prior Austenite Grain Size

The Ms (martensite start) temperature corresponds to the start of the austenite (γ) to martensite (α’) phase transformation, and determining its value becomes essential to select the proper bainitizing heat treatments. The Ms temperature was estimated using a DIL Bahr 805A/D quenching dilatometer from TA Instruments (New Castle, DE, USA) after the application of a conventional quenching heat treatment. Cylindrical specimens of 4 mm diameter and 10 mm length were used for the dilatometry experiments. These specimens were machined from positions of the poured keel-blocks, as it is shown in Figure 1. The thermal cycle consisted of a full austenitization at a temperature of 920 °C for 60 min (heating at a rate of 5 °C/s), followed by quenching down to room temperature from the austenitization temperature (see cycle Q in Figure 2). The cooling rate was 50 °C/s, as this was shown to be sufficient to avoid pearlite formation during cooling after the austenitization step. Heating was carried out using induction, and cooling was assisted by controlling the helium gas flow. To estimate the Ms temperature, the offset method proposed by Yang and Bhadeshia [35] was used. The method consists in considering the Ms temperature as that at which a certain strain, corresponding to the formation of 1 vol.% of martensite, is achieved. In this work, an offset of 0.02%, close to the one suggested by Yang and Bhadeshia, was adopted. The temperature reported in this work is the average value of three independent experiments.
Several works have demonstrated that the thermal etching technique is a powerful tool to determine the prior austenite grain size (PAGS), since it allows unveiling the prior austenite grain boundaries clearly [36,37,38,39]. This technique involves a prior metallographic preparation of the samples before heat treating. In this regard, cylindrical dilatometry samples were mounted in bakelite, and a finely polished surface of 2–3 mm wide was prepared parallel to the main axis of the cylinder, using standard metallographic techniques and finishing with 1 µm diamond paste. Then, the sample was carefully unmounted, avoiding damaging the polished surface. Subsequently, the sample was subjected to the same austenization heat treatment as for the quenched samples (920 °C—60 min) followed by cooling (5–10 °C/s), all under vacuum conditions, in order to avoid the oxidation/darkening of the polished surface. The heating/cooling system and parameters of the high-resolution dilatometer mentioned above was used to apply this heat treatment. At high temperatures, grooves form at the intersection of the austenite grain boundaries with the polished surface by surface tension effects and matter transport mechanisms (evaporation–condensation, volume diffusion, and surface diffusion), and the grooves remain visible at room temperature. The grain size was determined by manually tracing the grain boundaries on different micrographs using an image-editing software to create a skeleton outline. Approximately 90 prior austenite grains were analyzed for this condition using the Image J software (version 1.47s, NIH, Stapleton, NY, USA, 2013). The freeware program enables the automatic determination of the area and Feret diameter of the grains; which in this work was assumed and reported as the PAGS.

2.2.2. Isothermal Heat Treatments

The isothermal heat treatments were performed using the dilatometer mentioned above, using similar cylindrical specimens as those used for the quenching heat treatments. The thermal cycle used to obtain the bainitic microstructures consisted of a full austenitization step at 920 °C for 60 min (heating at a rate of 5 °C/s), followed by quenching (50 °C/s) down to the transformation temperature. In this work, three different temperatures were evaluated: 280, 330, and 380 °C. For each isothermal temperature, holding times of 20, 80, 160, and 360 min were tested to study the microstructural evolution as a function of temperature and time. After the isothermal treatments, the samples were quenched to room temperature. Figure 2 provides a scheme of the heat treatments carried out in this work.

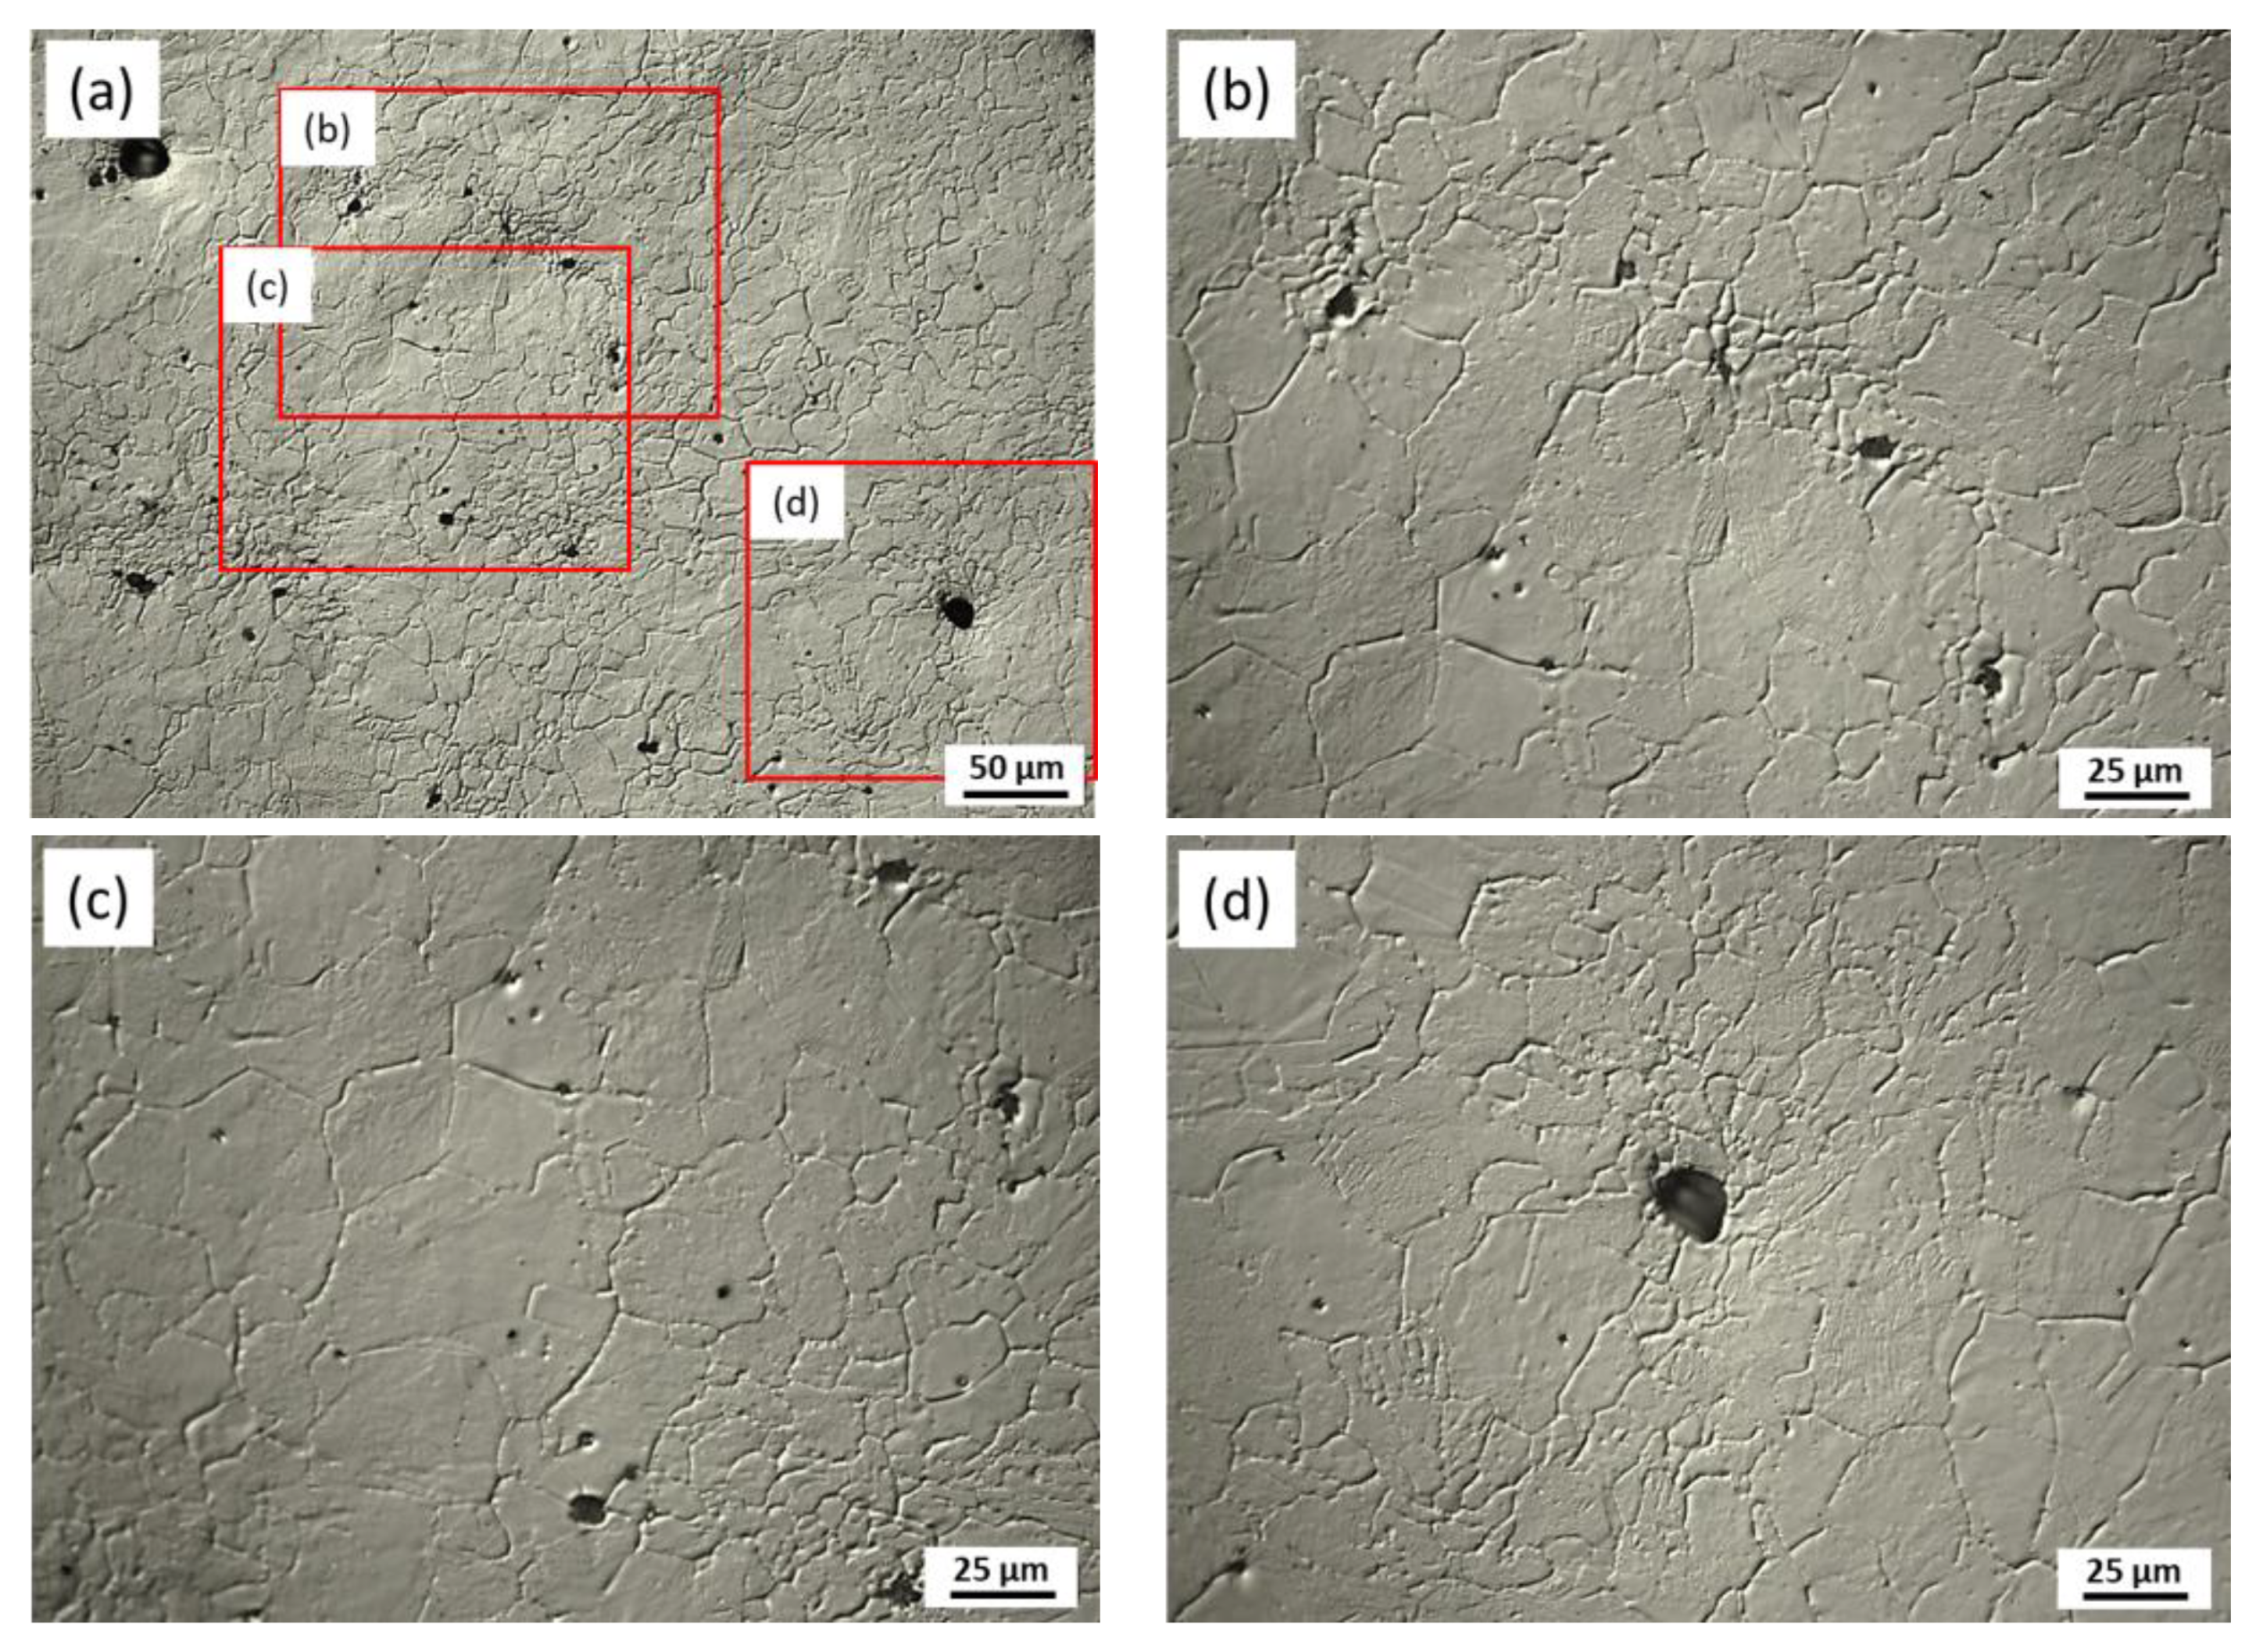
2.3. Microstructural Characterization

The metallographic preparation and the microstructural observation of austempered samples were performed using standard methods that included grinding using 80 to 2000 grit water sand abrasive paper, and polishing with 3 μm and 1 μm diamond paste. The microstructures were revealed after etching with Nital 2%. Micrographs were taken using light optical (LOM) and scanning electron microscopy (SEM) in a Nikon Epiphot 200 (Nikon Instrucments, Inc., Melville, NY, USA)and a Hitachi S 4800 microscope (15.0 kV, Hitachi Ltd., Chiyoda, Tokyo, Japan), respectively.
X-ray diffraction (XRD) analyses were used to estimate the amount of retained austenite present in the microstructures of treated samples. For these experiments, samples were prepared in the same way as those used for the microstructural observation using LOM (grinding and polishing, finishing with 1 µm diamond paste) and then subjected to several cycles of etching and polishing to minimize the amount of deformation introduced in the surface by the mechanical polishing, which could lead to martensite induced by deformation, thus artificially decreasing the volume fraction of austenite. Then, the final polishing of the samples was carried out with a colloidal silica solution. XRD measurements were carried out with a Bruker AXS D8 Discover diffractometer (Bruker AXDS GmbH, Karlsruhe, Germany) equipped with a Co X-ray tube, Goebel mirror optics, and a LynxEye Linear Position Sensitive detector (Bruker AXS GmbH, Karlsruhe, Germany). XRD data were collected over a 2θ range of 35 to 135° with a step size of 0.015°. For the Rietveld refinement of the diffractograms, a program DIFFRACplusTopas Version 4.2 (Bruker AXS GmbH, Karlsruhe, Germany, 2009) has been used, and the crystallographic information of the phase was obtained from Pearson’s Crystal Structure Database for Inorganic Compounds [40].
The influence of the microsegregation on the bainitic microstructures was analyzed by EBSD. For this purpose, the samples subjected to the bainitizing heat treatments corresponding at the three different temperatures held for 360 min were chosen. EBSD samples were prepared using the same methodology as for those samples intended for the microstructural observation using LOM: grinding using 80 to 2000 grit water sand abrasive paper, and polishing with 3 μm and 1 μm diamond paste. Later, the samples were etched with Nital 2%. After etching, two square regions of 39.9 × 30.0 µm2, corresponding to dendritic and interdendritic areas (with low and high percentages of alloying elements Cr, Mn, and Si), were selected in the microstructures. These regions were delimited with hardness indentations. It is important to point out that in this kind of steel, the etching response/contrast of the dendritic and interdendritic regions is different due to the microsegregation. This phenomenon was observed and reported by the authors in a previous work [29]. Next, the surfaces were lightly re-polished to remove the etched superficial layers with a 1 µm diamond cloth but preserving the indentations. Finally, the samples were carefully polished with 50 nm colloidal silica suspension for 15 min in the final stage of the metallographic preparation. EBSD analyses were performed using a FEG-SEM JEOL JSM 6500F (JEOL Ltd., Tokyo, Japan) coupled to a Channel 5 detector (HKL Technology-JEOL Ltd., Tokyo, Japan), operating at 15 kV. The indexation of the Kikuchi lines and the determination of the orientations were done with software also developed by HKL Technology. The maps were acquired using a step size of 0.15 μm. The EBSD analysis was performed by means of the MTEXMatlab® toolbox [41].

2.4. Mechanical Properties

Hardness measurements were carried out using Vickers indentation under 5 kg load, according to the standard ASTM E10 “Standard Test Method for Brinell Hardness of Metallic Materials”. The values reported for each microstructure correspond to the average of five measurements. The influence of the reaction temperature on the tensile and impact properties of cast steels with bainitic microstructures was evaluated after transformation at 280, 330, and 380 °C for 360 min. The samples for the mechanical testing were prepared from the poured keel blocks. A pre-form of the tensile and Charpy specimens was machined prior to the heat treatments. Afterwards, these pre-forms were machined and rectified to obtain the final dimensions (Figure 2) and thus eliminate any surface defects generated as a result of these heat treatments. The austenitization was carried out at 920 °C for 60 min using an in-house made electrical furnace under an open-air atmosphere. To minimize the oxidation/decarburization and protect the samples, they were introduced in a stainless steel box and covered with a pack of cast iron turnings and granules of charcoal. After the austenitization, the samples were quickly transferred to a molten salt bath (50% sodium nitrite—50% potassium nitrate), previously set to the targeted isothermal (bainitising) temperature and held for 360 min. Finally, the samples were quenched in water. It should be pinpointed that in order to obtain reliable conclusions, the authors confirmed, using dummy samples heat-treated along with the tensile/Charpy samples, that the microstructures obtained after these heat treatments were very similar to those obtained after the heat treatments performed with the dilatometer. Tensile tests were carried out according to the standard ASTM E8 “Standard Test Methods for Tension Testing of Metallic Materials” using 6.35 mm diameter specimens in a Instron test machine (Instron, Norwood, MA, USA). Charpy impact tests were carried out according to the ASTM E23 “Standard Test Methods For Notched Bar Impact Testing Of Metallic Materials” were added in the text, using notched test specimens of (10 × 10 × 55) mm3. For every microstructure, the reported values for the mechanical properties (yield stress, ultimate tensile strength, total elongation, and impact energy) are the mean of three independent tests. Figure 3 shows a scheme of the tensile and impact samples used in this work.

3. Results and Discussion

3.1. Determination of the Ms Temperature and the Prior Austenitic Grain Size

After processing the high-resolution dilatometry data for the sample subjected to conventional quenching heat treatment, the Ms temperature was estimated to be 140 ± 10 °C.
Regarding the determination of the PAGS, Figure 4a–d show LOM micrographs of the prior austenite grain boundaries revealed by thermal etching after austenitizing at 920 °C for 60 min and cooling to room temperature. Figure 4a shows an image of the microstructure at low magnification. The images in Figure 4b,c correspond to the areas shown in Figure 4a and were taken using Nomarski microscopy (also known as differential interference contrast, DIC, microscopy). Comparing these micrographs, it is clear that the PAGS varies along the microstructure. Regions near non-metallic inclusions and micro-shrinkages, which are associated to interdendritic zones, display smaller grains; while areas free of these defects, which are associated with a dendritic region, show bigger grains.
Figure 5 shows the PAGS distribution of the microstructure shown in Figure 2. As it would be expected, the results depict a clear bi-modal lognormal distribution due to the different grain size populations observed in the interdendritic and dendritic regions. A bimodal lognormal distribution can be described by Equation (1), where “y” is the theoretical probability (in percentage) of a prior austenite grain of size “x” (in µm). Function y1 (x) and y2 (x) describe the probability of a prior austenite grain of size x in the interdendritic and dendritic regions, respectively; p is a constant that represents the weight of y1 (x); μ1 and μ2 are two constants that represent the mean of the logarithmic values of y1 (x) and y2 (x), respectively; σ1 and σ2 are two constants that represent the standard deviation of the logarithmic values of y1 (x) and y2 (x), respectively, and x0 is a constant that increases as y2 (x) is shifted horizontally to higher values.
y = p y 1 ( x ) + ( 1 p ) y 2 ( x ) = ( p e x p ( 0.5 ( l n ( x ) μ 1 σ 1 ) 2 ) σ 1 x 2 π + ( 1 p ) e x p ( 0.5 ( l n ( x x 0 ) μ 2 σ 2 ) 2 ) σ 2 x 2 π ) 100
The values of the variables p, μ1,μ2, σ1, σ2, and x0 were fitted by using the simplex search method of Lagarias et al. [42], which was implemented in MatLab®, to minimize the absolute error with the experimental data, and they are included in Table 2. The fitted theoretical probability function was included in Figure 5 as a solid red line.
From the fitted distribution, the statistical variables were calculated and are shown in Table 3, where it can be observed that the average PAGS in the dendritic regions is 22.4 µm, while an average PAGS of 6.4 µm is observed in the interdendritic zones. Moreover, it can be concluded that prior austenite grains have a more homogeneous size in the interdendritic regions, in comparison with the dendritic ones, for which a wider distribution is observed. Note that the variance is only 6.7 µm in the former regions, whereas it is 65.7 µm in the latter ones.
The origin of the smaller grains, which are present close to the non-metallic inclusions and micro-shrinkage regions is not obvious, but it seems to be linked to the microsegregation patterns, as these small grains are only present in the interdendritic zones. Similar results were reported in the literature [43,44,45]. As it was described, the dendritic regions, which have the lower concentration of solutes, showed a larger average prior grain size than the interdendritic areas (≈22 and ≈6µm, respectively). As it was discussed in a recent paper by the authors [46], this difference in grain size is attributed to the combined influence of the following: (1) the presence of undissolved cementite in segregated areas would pin the grain boundaries, inhibiting grain growth; and (2) differences on transformation temperatures between dendritic and interdendritic areas associated to different concentration of alloying elements. In zones with a smaller ΔT=Tγ − Accm, austenite grains would have less driving force to grow and would remain smaller. Thus, during the austenitization heat treatment at 920 °C, the austenite grains that have nucleated and grown in Si, Mn, and Cr-rich zones (last austenite to be formed) are smaller due to the smaller ΔT. (3) A factor that may be favoring a bi-modal distribution is the so-called solute drag effect [47,48,49]. It is well-known that solute atoms (impurities or alloying elements) segregated to the austenite grain boundaries can reduce their mobility and exert a drag force that retards the kinetics. In this case, the higher levels of alloying elements (Cr, Mn, and Si) present in interdendritic regions could be favoring the solute drag effect in these regions. The large difference observed in the variance of the two populations would be explained similarly; grains could grow more freely in the dendritic regions were there exist fewer pinning obstacles. This would lead to having wider distributions.

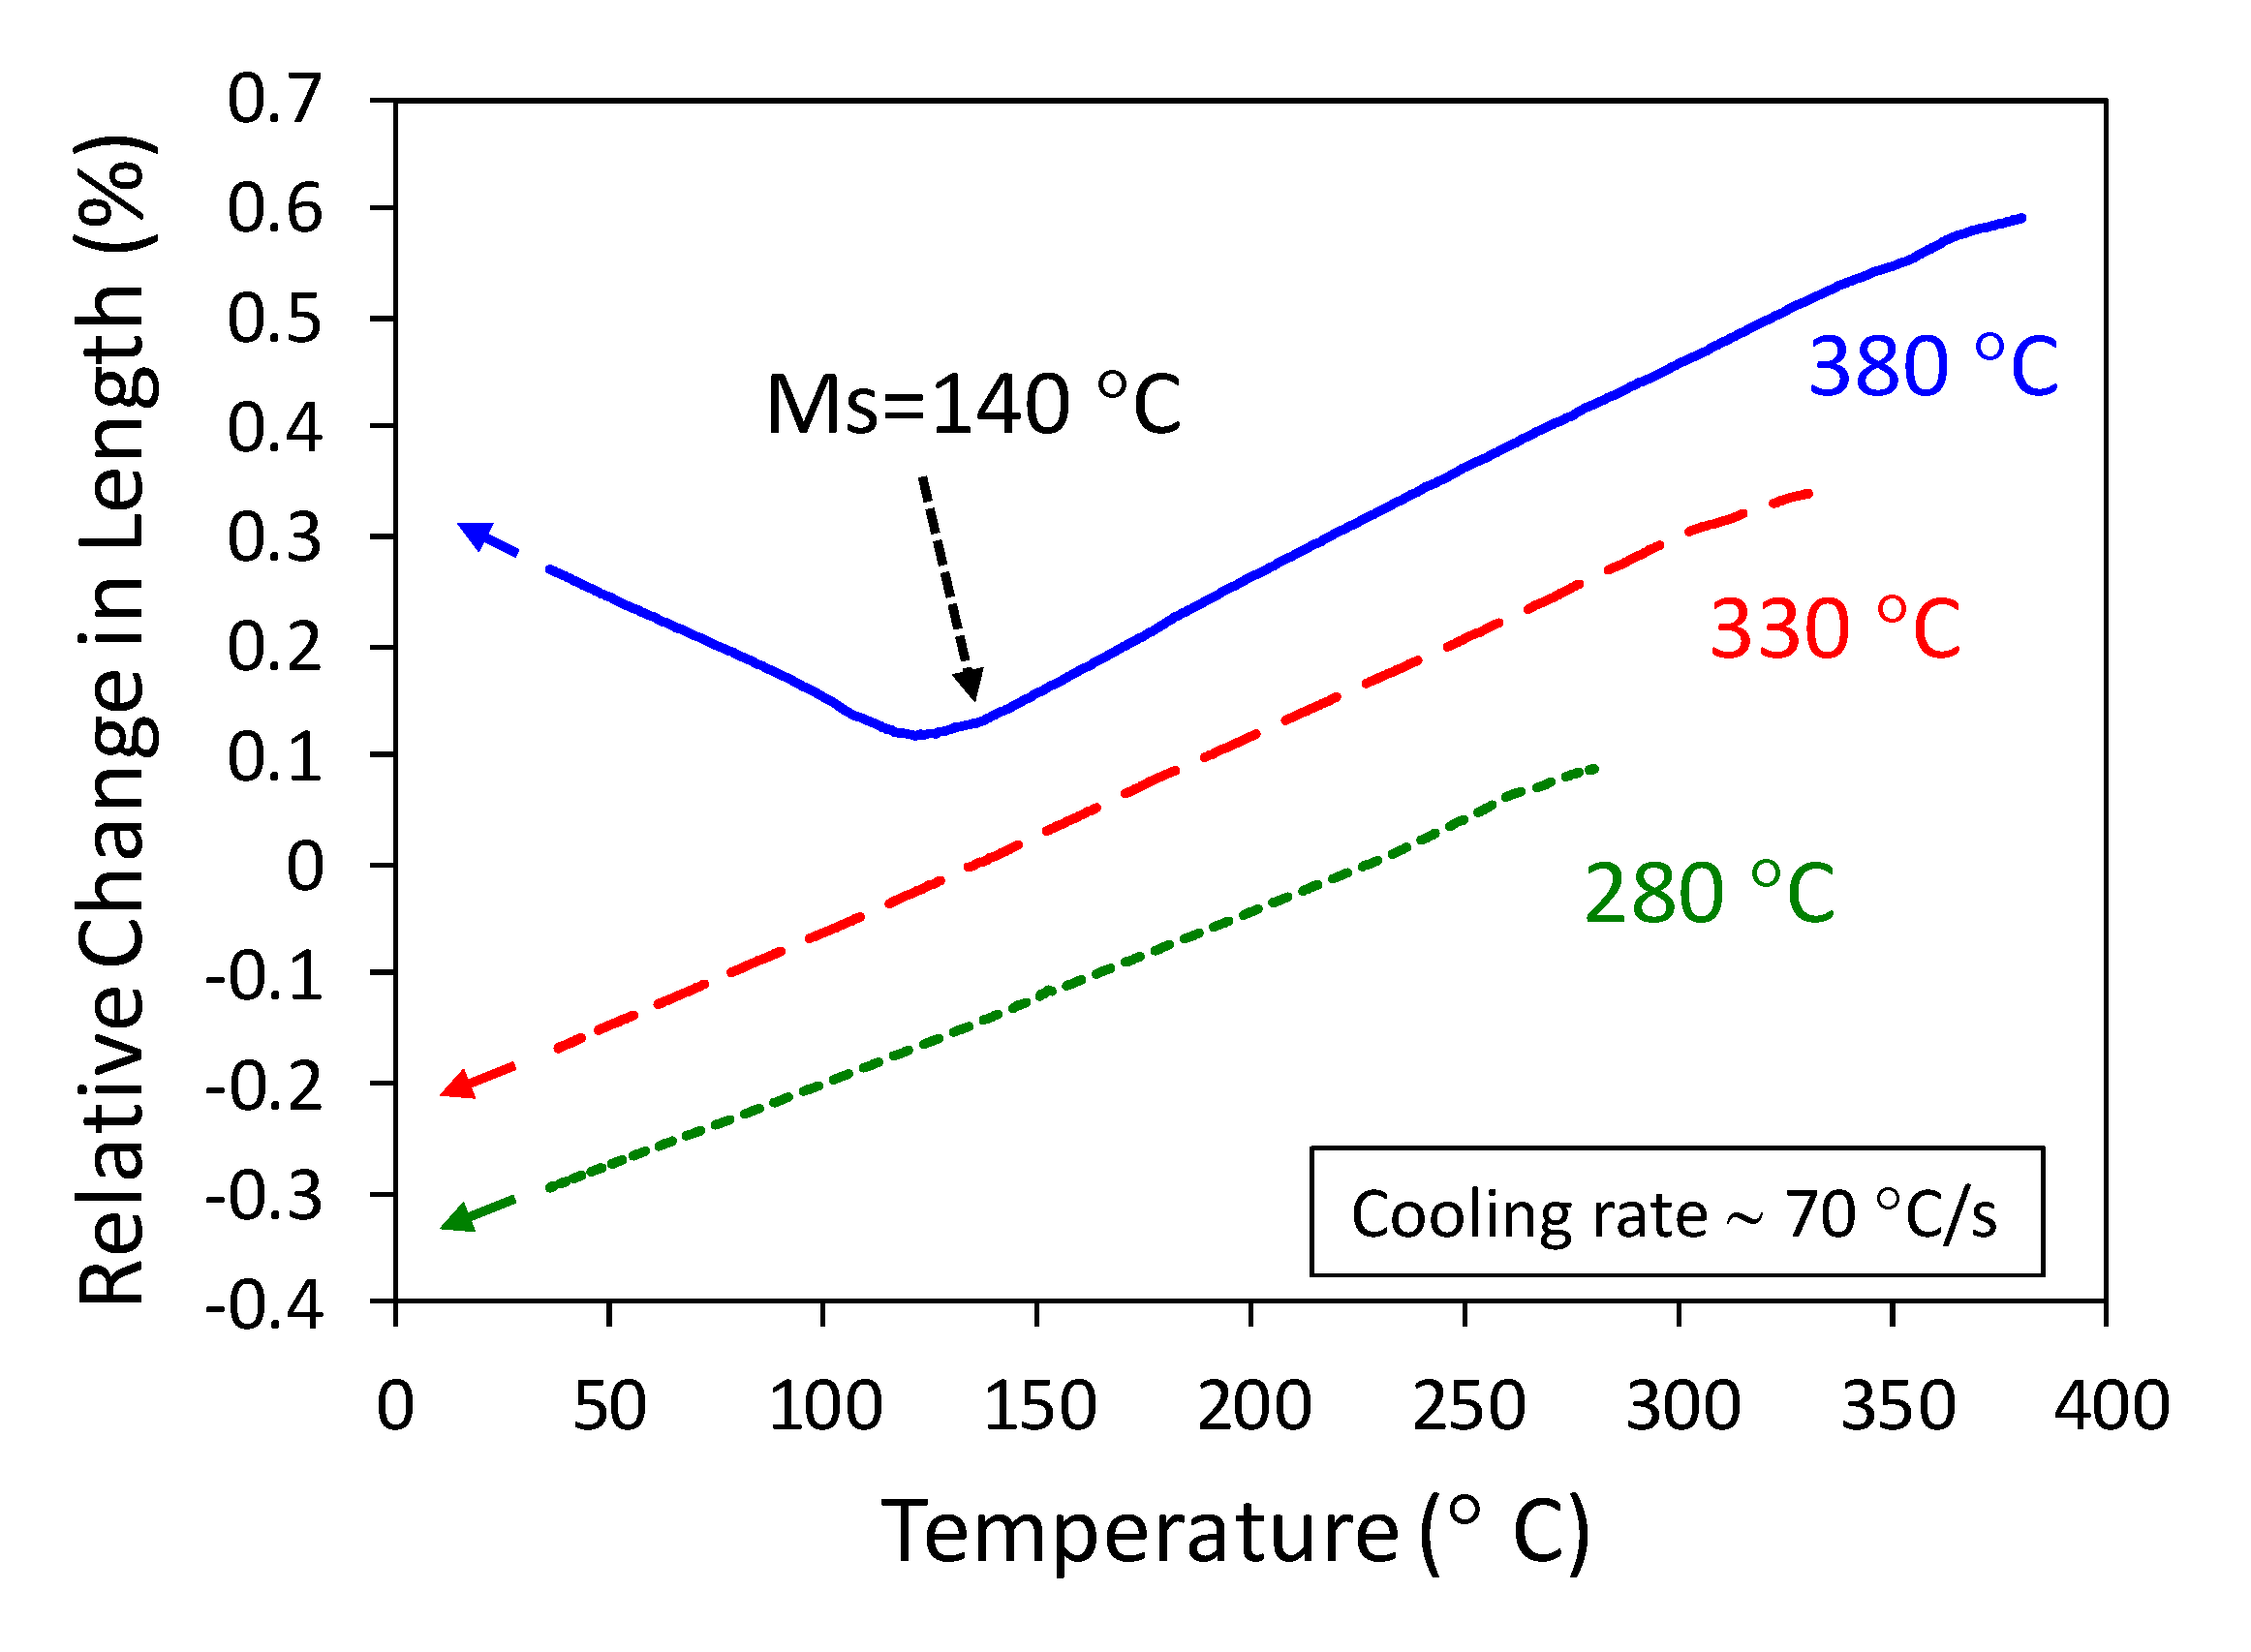
3.2. Kinetics of the Bainitic Reaction

Figure 6a shows the evolution of the relative change in length (RCL), as a function of the holding time for the three temperatures investigated. It can be observed that the progress of the bainitic reaction with the holding time follows a characteristic sinusoidal behavior, as widely reported [50,51,52,53]. The formation of bainitic ferrite from austenite implies a volume increase (expansion of the sample) due to the different atomic volume of these phases. As the dilatometry curves correspond to isothermal treatments, the dilatation is not due to changes in temperature and, thus, the volume changes can be exclusively associated with the formation of bainitic ferrite. However, when the three dilatometric signals are compared, one should bear in mind that the higher the austempering temperature, the larger the lattice parameters of austenite and ferrite, and this affects the total expansion recorded. For a fixed temperature and, as no other phase is forming in this range of temperatures, it is possible to follow the bainitic transformation by measuring the dilatation of the samples as function of time: a larger volume change implies a greater formation of bainitic ferrite.
The end time for the transformation was determined within the steady region of the dilatometry curves, using the method based on the derivative of the RCL (DRCL). A value of 4% of the maximum value of DRCL was selected, according to Santajuana et.al. [54]. As example, Figure 6b shows the determination of the time to end the transformation at 280 °C by means of the DRCL. The times determined were 165, 119, and 199 min for the transformation temperatures of 280, 330, and 380 °C, respectively. An increase in the transformation temperature is not always associated with faster reaction kinetics. The transformation rate at 380 °C is lower than at 330 °C and 280 °C. When the transformation temperature is close to the Bs temperature of the steel, the undercooling is small, there is a lower driving force for the decomposition of austenite into bainitic ferrite and, thus, the transformation rate is lower. At 380 °C, the amount of bainite transformed is also much lower that at 330 °C and 280 °C.
Figure 7 shows the volume fraction of retained austenite and Vickers Hardness (HV) as a function of the holding time for the three different temperatures investigated. It is important to recall that during the progress of the transformation, the untransformed austenite is enriched in carbon, increasing its thermal and mechanical stability. The longer the time, the higher the volume fraction of austenite that is transformed into bainitic ferrite, and the more enriched (and more stable) the untransformed (i.e., residual) austenite is. Figure 7 shows that after 20 min, the samples cooled to room temperature contain for all conditions about 25% of retained austenite in the final microstructure. After 80 min, this value increases up to 51, 42, and 34% for the transformation temperatures of 330, 280, and 380 °C, respectively. From this time on, a different behavior is observed after austempering at 280 and 330 °C compared to 380 °C. Although the microstructures obtained at 280 and 330 °C showed maximum values of retained austenite, the dilatometric curves show that beyond 80 min, the transformation has not finished (Figure 6). The amount of retained austenite could increase, and the real peak value could be between 80 and 160 min. At some point, further holding at 280 and 330 °C up to 160 min would increase the amount of bainitic ferrite at the expense of the austenite, leading to the effective decrease observed in the retained austenite after 160 min compared to 80 min. In this range of conditions, the austenite is expected to be quite stable (due to its carbon content), but it should not be discarded that a small amount may be still transforming to fresh martensite during quenching to room temperature for holding times beyond 80 min. A similar behavior was reported for wrought and cast steels [54,55,56]. After 160 min, the dilatometry curves show that the transformation has almost finished at 280 and 330 °C. Accordingly, the amount of retained austenite reaches a plateau in Figure 7. Contrarily, for the transformation temperature of 380 °C, the retained austenite still increases continuously with the holding time up to 360 min, which means the bainitic transformation may have not ended at 160 min. The dilatometric curve (Figure 6) shows that the stop (or end) of the bainitic transformation (maximum amount of bainitic ferrite formed at this temperature) for the transformation temperature of 380 °C has been reached at 199 min. Then, the slight rise in the amount of retained austenite for a transformation temperature of 380 °C after 160 min is attributed at the continuous formation of bainitic ferrite (further carbon enrichment of the austenite) between 160 and the end of the transformation (≈200 min).
The hardness values show an opposite tendency (decrease with holding time) with respect to the amount of retained austenite. This is attributed mainly to the evolution of the amount of martensite present in the microstructures. After 20 min of holding time, the carbon enrichment of the untransformed residual austenite does not stabilize this phase, and a great part of it transforms to martensite by quenching to room temperature. Thus, the resulting microstructures possess very high hardness, ranging from 780 to 830 HV. As the transformation progresses (the holding time increases), the carbon rejected by the bainitic ferrite enriches the austenite, decreases its local Ms temperature, and stabilizes this phase at room temperature. Thus, the amount of martensite (hardest phase) obtained after quenching decreases, as well as the hardness of the microstructure. As for the retained austenite, a different tendency is observed in the hardness of the microstructures transformed at the lowest temperatures (330, 280 °C) compared to the highest ones (380 °C). For the two lowest, the hardness values decrease continuously with increasing the holding times, and a plateau is reached after 80–160 min. It should be noted that in this range, the decrease in hardness is mainly due to the increase in the amount of bainite. This fact could not lead to an increase in the hardness but a slight decrease. In a recent paper regarding the nanomechanical characterization of nanostructured bainitic steels, it has been shown that the hardness of the austenite is a bit higher than that of bainitic ferrite [57] which could assist in explaining this drop between 80 and 160 min. In addition, other investigations in multiphase steels have shown that the nanohardness of the retained austenite is higher than that of bainitic ferrite [58]. Nevertheless, several factors such as the amount of carbon and the size and morphology of the austenite will influence its hardness, and a direct comparison among investigations should be carried out with caution. At 380 °C, no plateau is observed up to 360 min due to the continuous increase in the austenite stability due to the carbon enrichment and the decrease in the amount of martensite.
Figure 8 displays the microstructural evolution characterized by LOM at low magnification for the different transformation temperatures. Figure 8a–c correspond to samples austempered for 20 min and shows a mostly martensitic microstructure (brighter phase). Microstructures obtained at 330 and 380 °C showed the presence of sheaves of bainite (black needles). On the other side, for isothermal treatments at 280 °C, laths of bainitic ferrite were not detected in the microstructure. This means that the bainitic transformation starts after 20 min for a transformation temperature of 280 °C.
In Figure 8b, which corresponds to the sample austempered at 330 °C, it is clear that the formation of bainite (black needles) is associated particularly to the low-alloyed areas or dendritic zones. As it was reported in previous works by the authors [29,46], this cast steel (with the same chemical composition and casted in the same mold sizes) presents a considerable microsegregation that results in dendritic areas with low amounts of alloying elements (≈1.6 wt.%Si, ≈0.8 wt.%Mn and ≈0.7 wt.%Cr) and interdendritic areas with a high concentration of alloying elements (≈2.6 wt.%Si, ≈1.6 wt.%Mn and ≈1.3 wt.%Cr). As Mn is an austenite stabilizer, high concentrations of this element promote slower bainitic transformation kinetics, while dendritic areas present faster reaction kinetics. As it can also be observed, larger non-metallic inclusions and voids (big black ellipsoidal dots) are located mainly in the interdendritic regions, which are the last zones to solidify and present a mainly martensitic microstructure.
As the time increases, the microstructures obtained at different temperatures present more bainite, as expected. For the holding time of 80 min, the reaction at 280 °C has advanced at both dendritic and interdendritic areas (Figure 8d). For a temperature of 330 °C (Figure 8e), there is a considerable advance of the transformation at the dendritic areas and a lower advance at the interdendritic zones. Finally, high alloyed areas in the sample treated at 380 °C (Figure 8f) still do not present bainite, showing that the reaction has not started in these regions yet. As expected, for the time of 160 min, samples treated at the different temperatures present a higher density of plates of bainitic ferrite, as can be seen comparing Figure 8d–f with Figure 8g–i, accordingly.
Finally, as mentioned, for a holding time of 360 min, the reaction has stopped for the three tested temperatures. The resulting microstructures present values of retained austenite of 36 ± 2%, 49 ± 3% and 40 ± 2% and hardness of 592 ± 30 HV, 511 ± 25 HV, and 449 ± 25 HV for transformation temperatures of 280, 330, and 380 °C, accordingly. Despite reaching the end of the transformation, microstructures obtained at 360 min (Figure 8j–l) show a considerable level of heterogeneity, presenting large untransformed areas (austenite/martensite blocks). A detailed characterization of these microstructures will be presented in the following section.

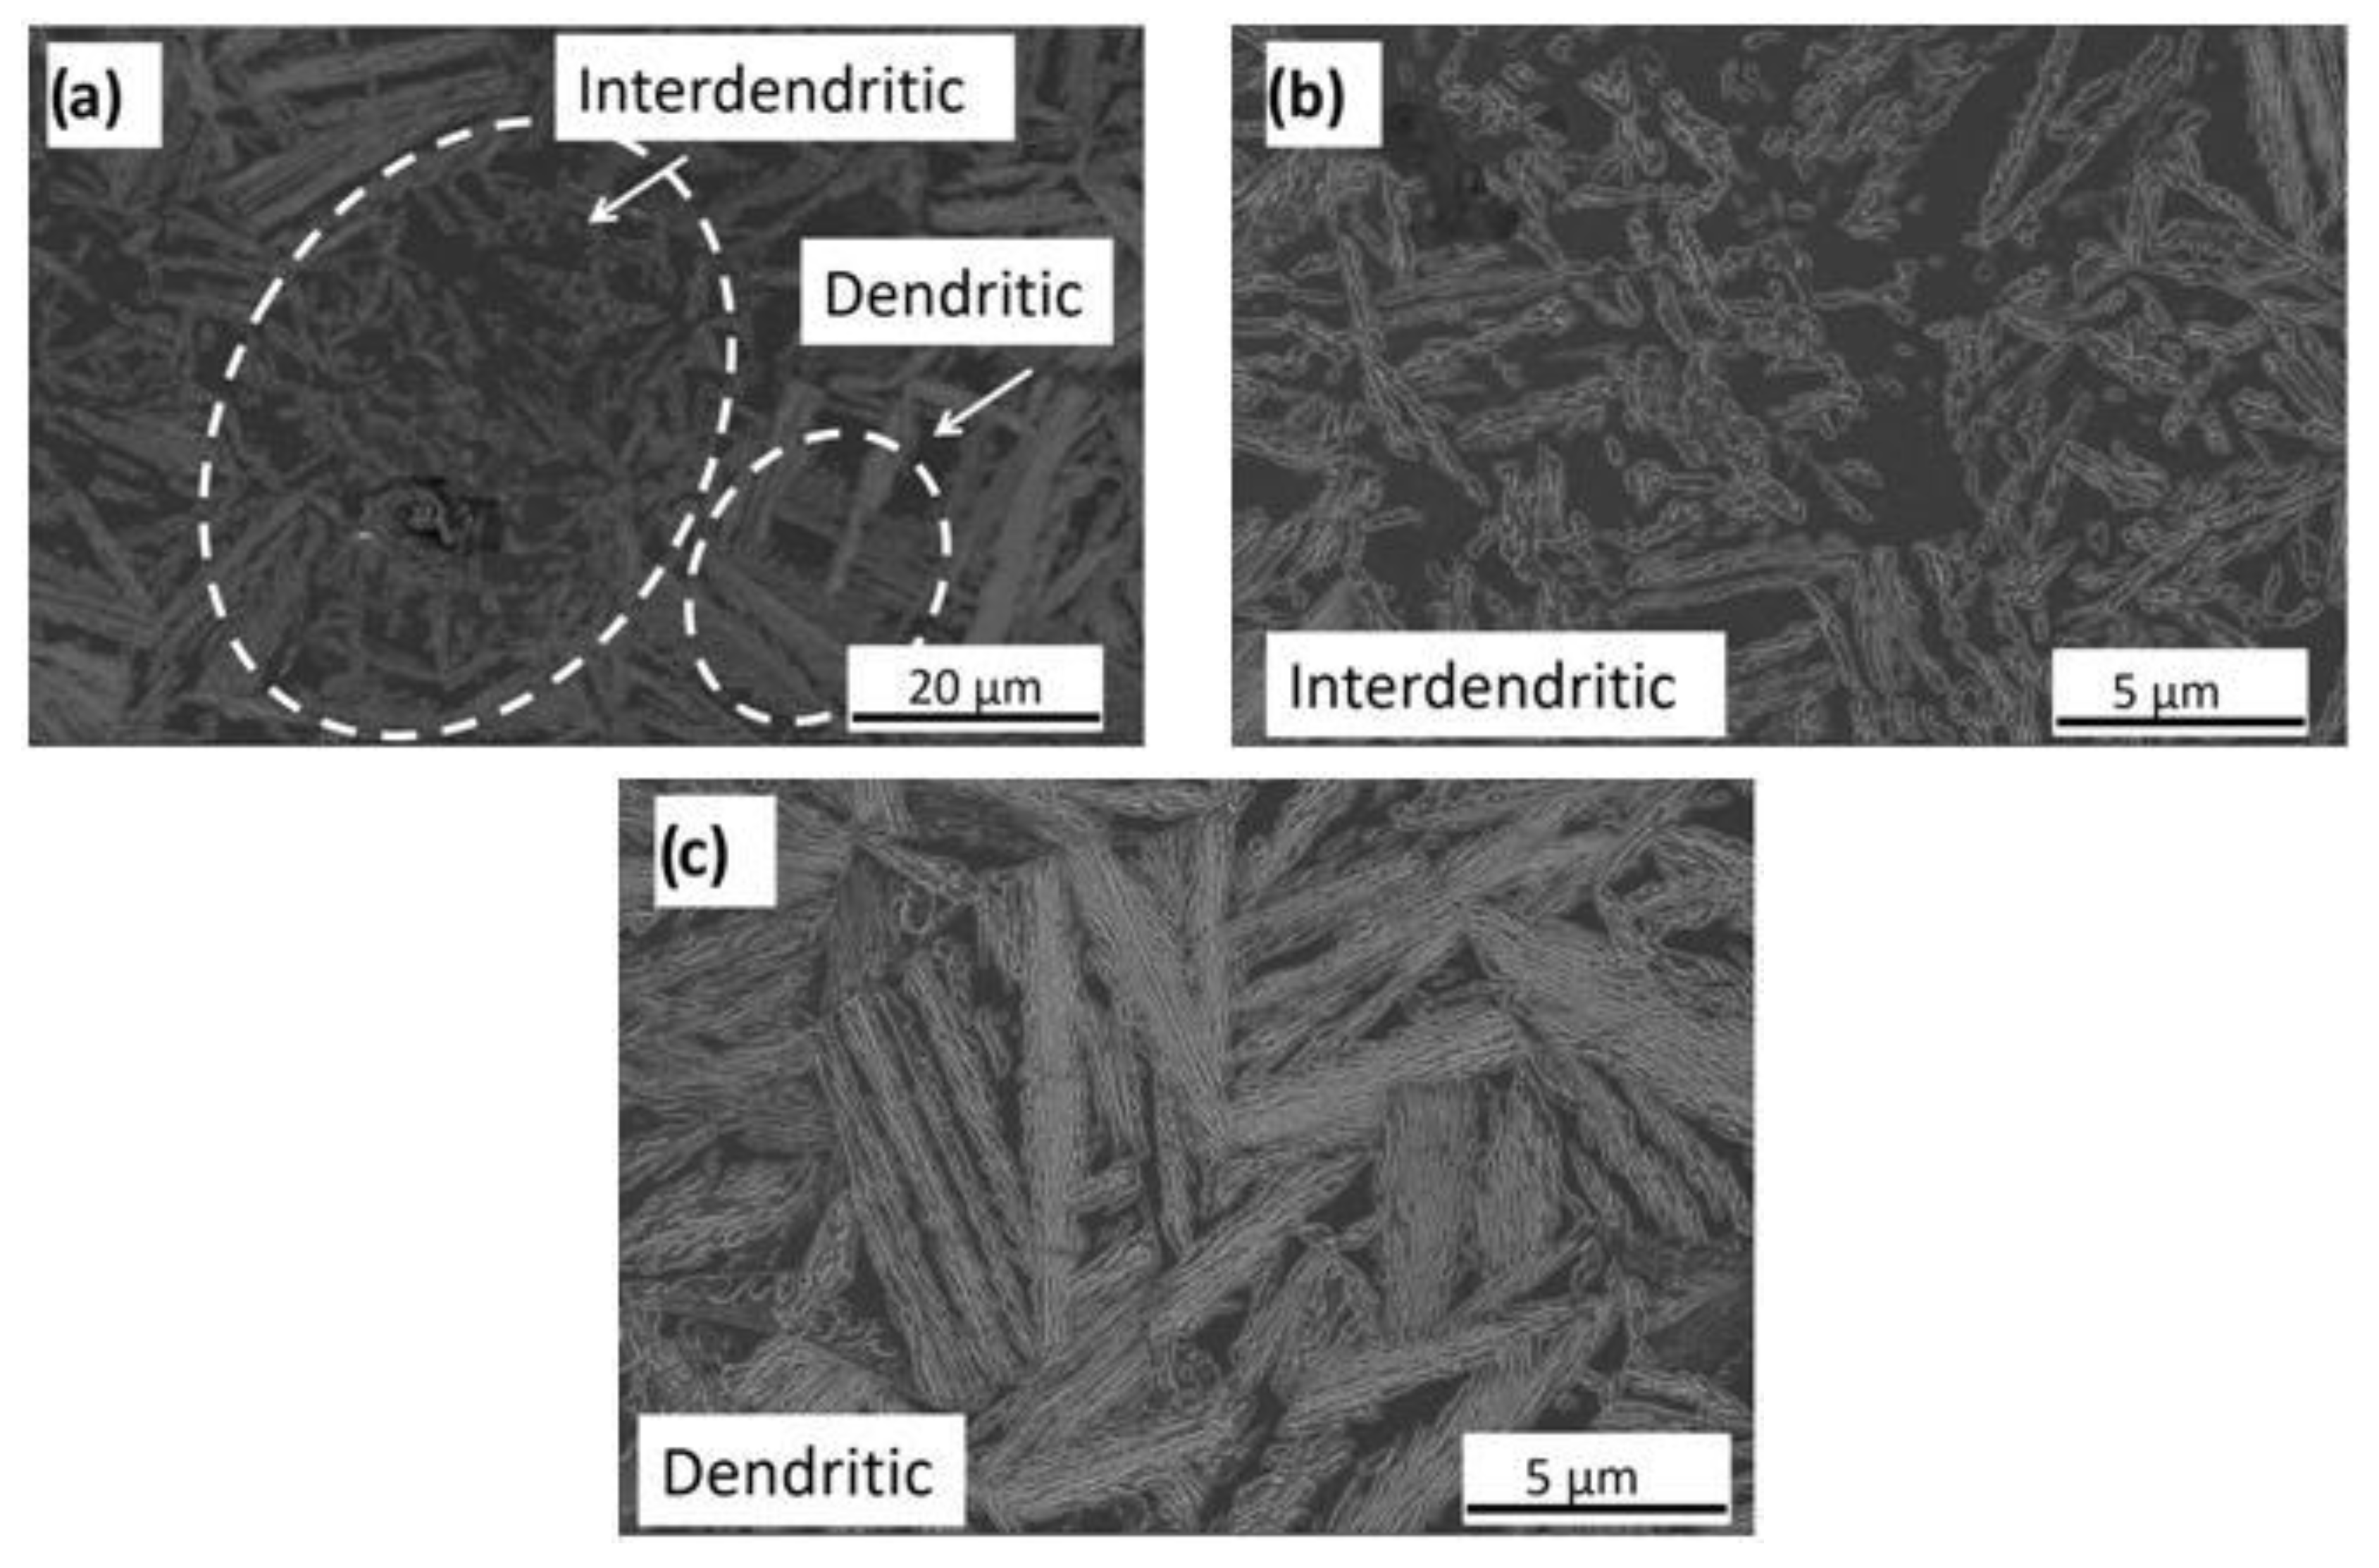
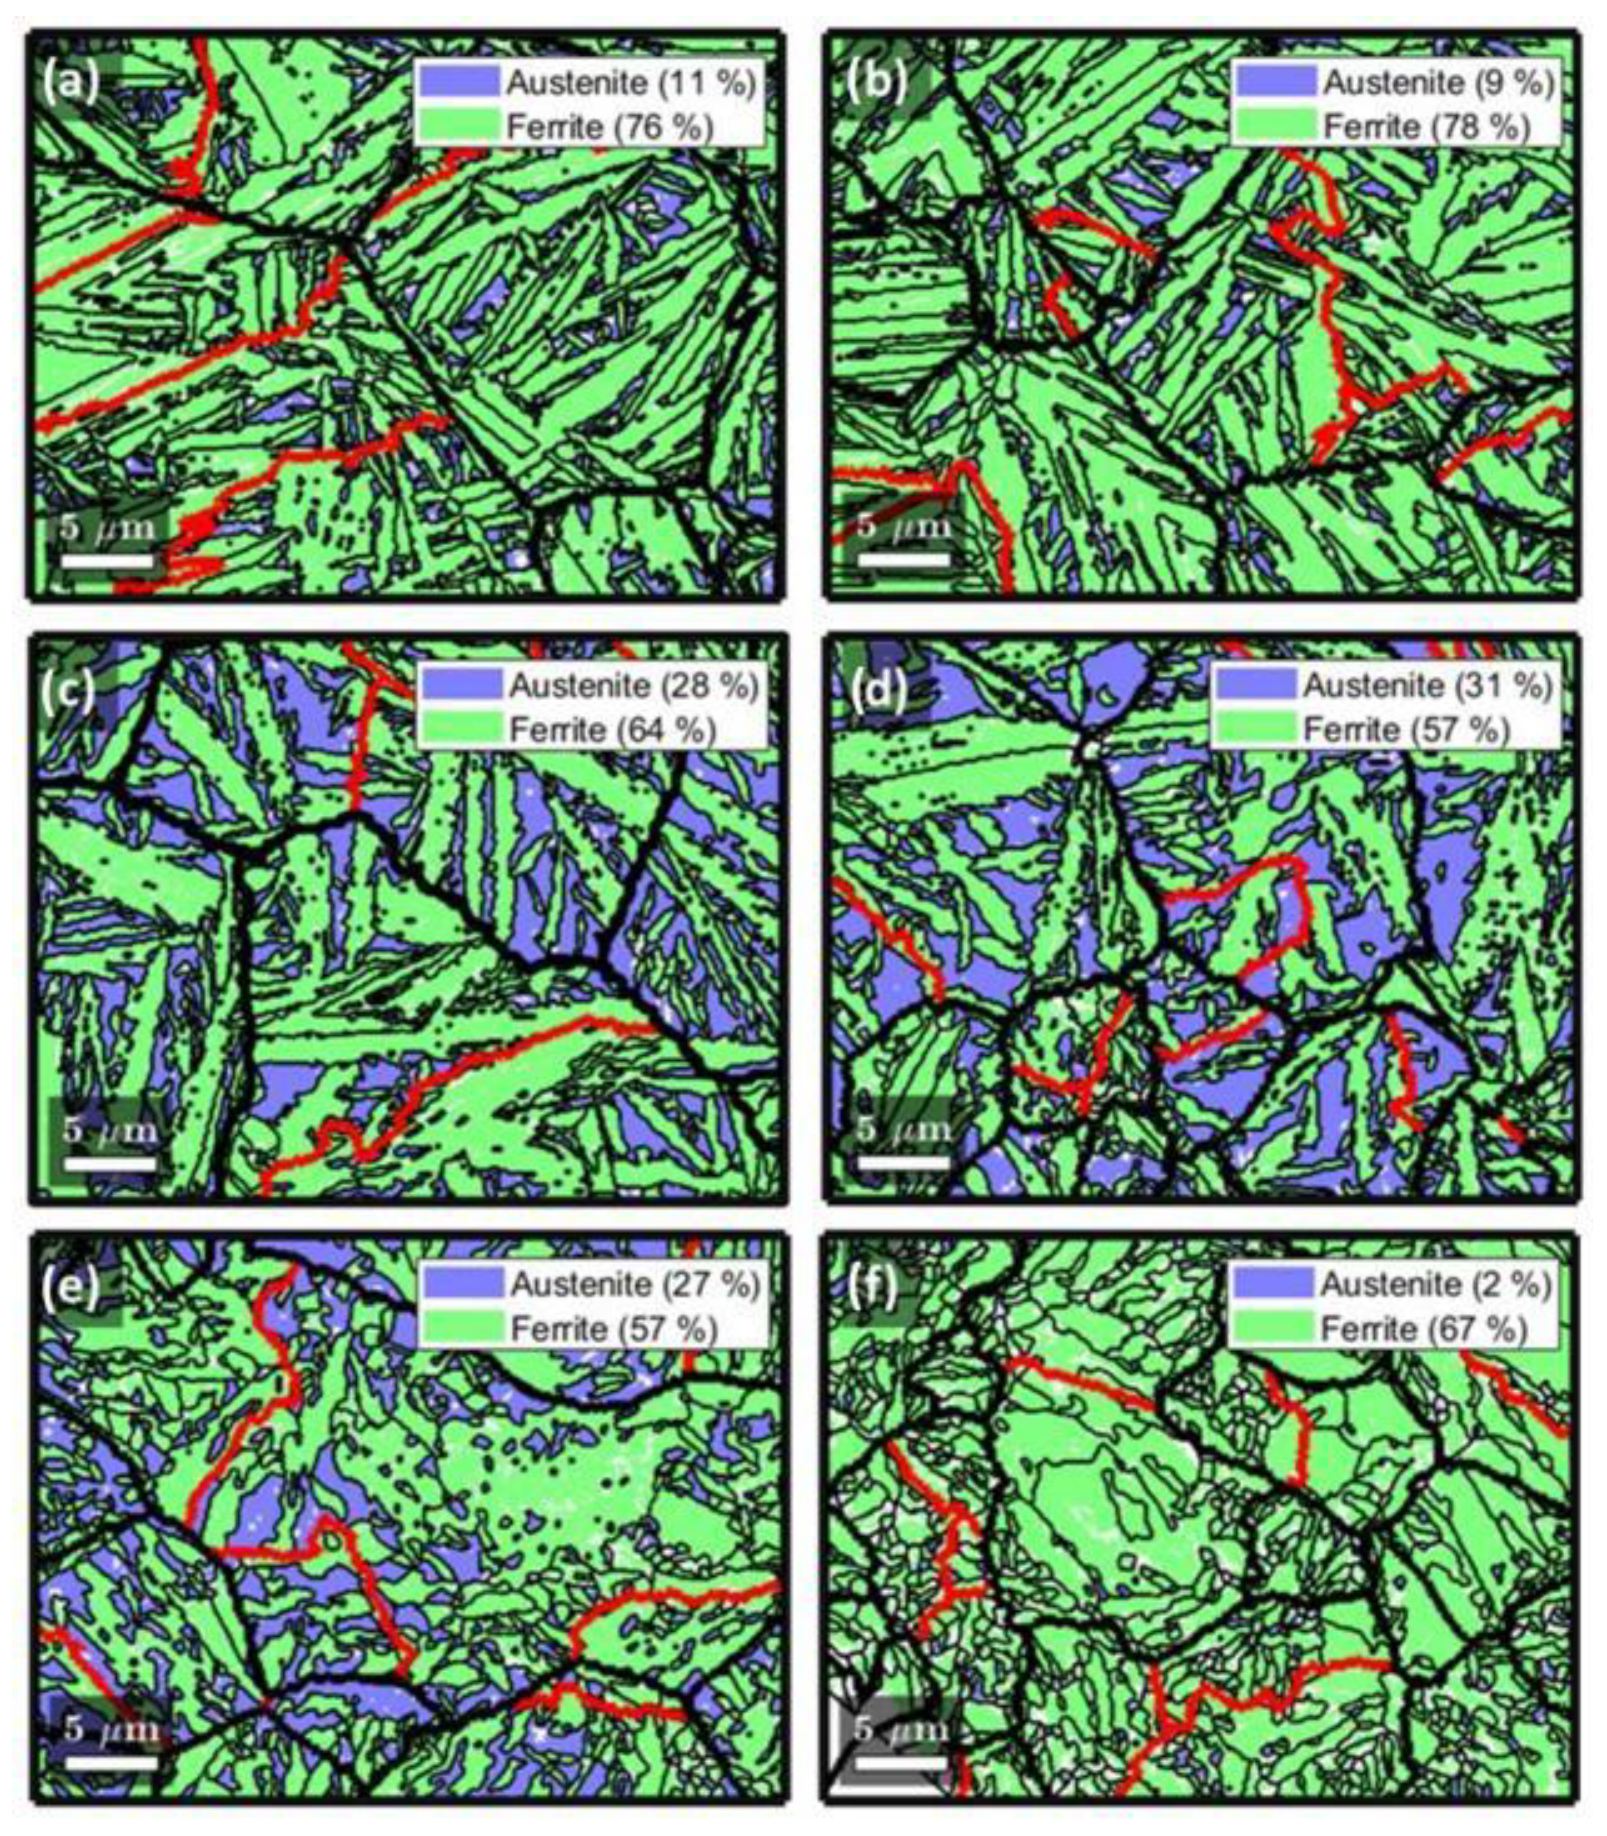
3.3. Microstructural Characterization of Bainitic Microstructures after the Transformation Has Been Stopped

In order to evaluate the influence of the microsegregation on the formation of bainite in this cast steel, microstructures obtained after 360 min at the three different temperatures, i.e., once the transformation has ended, were analyzed. Figure 9, Figure 10 and Figure 11 show FEG-SEM micrographs of the bainitic microstructure obtained at 280, 330, and 380 °C, respectively. The microstructure obtained at 280 °C is composed, according to the XRD measurements (Figure 7), supported by the optical microscopy observations, of bainitic ferrite (≈64%) and retained austenite (≈36%). No martensite was observed in this microstructure. Considering the whole microstructure (dendritic and interdendritic regions), it presents a hardness of 592 HV. Compared with the microstructure formed at 280 °C (Figure 9), after transformation at 330 °C for 360 min (Figure 10), the microstructure is coarser, as expected, presenting larger blocks of retained austenite. This microstructure does not contain martensite, and it is composed by 51% of bainitic ferrite and about 49% of retained austenite. Its hardness is 511 HV. Finally, the amount of bainitic ferrite formed at 380 °C (Figure 11) is lower than that for temperatures 280 and 330 °C. Interdendritic zones are mostly martensitic, as shown in Figure 11b, and the dendritic areas (Figure 11c) present bainitic ferrite, retained austenite, and martensite, this latter phase pointed by white arrows in the micrograph. This microstructure contains 40% of retained austenite and has a hardness of 449 HV. The formation of martensite was confirmed from the temperature-dependent dilatometry measurements recorded during the heat treatments, as shown in Figure 12. This plot shows an expansion of the sample during quenching, after transformation at 380 °C, at around 140 °C (Ms temperature), pinpointing the start of the austenite to martensite phase transformation. On the contrary, a linear contraction was recorded, during quenching down to the room temperature after transformation at 280 and 330 °C, suggesting that no martensite has been transformed, as it was also observed from FEG-SEM examination.
For all the treatment conditions, the images (a) in Figure 9, Figure 10 and Figure 11, taken at the lowest magnification, show clear microstructural heterogeneities associated with the microsegregation. As it was mentioned previously, this microsegregation causes the inhomogeneous distribution of the main alloying elements (Cr, Si, Mn) in the austenite, thus affecting its transformation to bainite. According to the T0 line theory, the bainitic reaction is limited by the position of the T0 line, which is dependent on the chemical composition and determines the carbon concentration at which austenite and ferrite have the same free energy. During the bainitic transformation, the untransformed austenite increases its carbon content due to the carbon partitioning from the bainitic ferrite. When the carbon concentration of austenite reaches the T0 line, the transformation stops. Elements such as Mn are austenite stabilizers and reduce the carbon activity. As a consequence, the interdendritic areas with high Mn content are enriched with carbon during the heat treatment, and transformation temperatures are decreased. Therefore, the transformation rate is low, promoting bainitic microstructures with a higher austenite volume fraction. As it was discussed above, the microsegregation also promotes having a prior austenite microstructure with a bi-modal grain size distribution (Figure 5) in which the interdendritic zones present an average PAGS of about 6.4 μm, while dendritic cores have an average PAGS of 22.4 μm. It is well known that the growth of the bainitic ferrite subunits is limited by the austenite grain boundaries. Therefore, this would explain that the interdendritic areas in, for example, Figure 9b, recognized by the presence of a non-metallic inclusion, present shorter bainitic ferrite plates and a higher volume fraction of retained austenite than the dendritic areas (Figure 9c). This is also evident in the microstructure transformed at 330 °C. The interdendritic zones (Figure 10b) present a higher proportion of retained austenite and shorter subunits of bainitic ferrite than the dendritic zones (Figure 10c). Nevertheless, despite presenting larger blocky retained austenite islands, especially at the interdendritic zones, no martensite was observed in the whole microstructure after quenching, highlighting that the Ms temperature of the retained austenite lays below room temperature, as it was suggested by the dilatometry experiments (Figure 12). In contrast to the previous conditions, the microstructure transformed at 380 °C contains lower amounts of bainitic ferrite, combined with a large amount of residual low carbon austenite. Having a low amount of bainitic ferrite and, thus, a limited austenite carbon enrichment reduces the thermal stability of this phase that easily transforms to martensite during quenching to room temperature after the isothermal treatment. For this reason, the microstructure includes large amounts of martensite (Figure 11). This is especially evident in the interdendritic areas (Figure 11b), which are enriched in Cr, Mn, and Si due to the microsegregation. Similar results have been reported by the authors in a previous work [55]. In this study, the macro and microsegregation patterns of medium C—high Si cast steels of three different levels of alloying were characterized. The study of microsegregation carried out using advanced EDS techniques showed that, for the studied chemical compositions, Si, Mn, Cr, Ni, Mo, and Al tend to concentrate at the interdendritic regions.
The influence of the microsegregation on the characteristics of the bainitic/martensitic ferrite and the austenite phases were analyzed using EBSD analysis. Two areas of 39.9 μm× 30.0 μm were scanned for each transformation temperature, each of them corresponding to a dendritic and an interdendritic region. In all maps, the austenite and ferrite grains were defined by misorientations higher than 7°. Data contained in ferrite grains with less than five indexed pixels were not considered, as their orientation was assumed not to be reliable. This cleaning procedure was not performed for the austenitic phase, as the expected austenite grain size was small, and cleaning the phase would have deeply underestimated the amount of this phase and overestimated its size. Figure 13a,c,e show the clean phase maps corresponding to the dendritic regions of the microstructures obtained at 280, 330, and 380 °C, respectively, and Figure 13b,d,f show the clean phase maps of the interdendritic regions of the same microstructures. The austenite and ferrite grain boundaries have been overlaid on the maps. As it can be observed, in the microstructures found for the two lowest isothermal temperatures, the blocks and packets are evident, as the ferrite grains are elongated parallel to each other. However, the microstructure observed for 380 °C shows more irregular and apparently more refined grains, which correspond to the observed martensite. The sizes of both ferrite and austenite grains will be deeply analyzed after some remarks are made in the next paragraphs.
Firstly, the ferrite area percentages obtained from the clean maps, which are included in Figure 13, show to be clearly over estimated by about 5–10% in comparison with the XRD results. These results were expected, as nanosized austenite films interwoven in between bainitic/martensitic ferrite laths are usually not detected due to the limits of the spatial resolution of the EBSD systems, and they are indexed as body-centered cubic (bcc) with the orientation of their surrounding bcc matrix. Thus, the austenite area fractions can be underestimated by 10–20%. If one considers the point previously made about some thin films indexed as bcc and one observes that most of the unindexed points seem to be clustered and located with a thin-film morphology, one can conclude that any result drawn from the analysis of the austenitic phase mainly applies for its blocks. Note that, for the interdendritic region of the sample heat-treated at 380 °C, only an area fraction of 2% belongs to austenite, as can be observed in Figure 13f, which is most likely because this region consists mainly of martensite, as previously discussed.
The second remark is on the PAGS. The prior austenite grains were reconstructed by the software from Nyyssönen et al. [59], and their boundaries were also included in the maps in Figure 13. Note that the twin boundaries (those boundaries whose misorientations are in the range 58–61° [60]) are depicted by red lines. Although the mean prior austenite grain sizes cannot be properly estimated, as most of the grains are not completely included in the EBSD maps—i.e., their size would be highly underestimated, it can be observed that the prior austenite grains in the map corresponding to the interdendritic region heat treated at 280 °C, see Figure 13b, are unusually large, of the size of the ones found for the dendritic regions (Figure 13a,c,e). Although an explanation to this fact is not evident, it is noteworthy to be mentioned, as it may affect the interpretation of the results.
Figure 14 shows the relative frequency histograms for both austenite and ferrite grain size distribution in the dendritic and interdendritic areas after the bainitic reaction at 280, 330, and 380 °C, which were estimated using the criterion of an equivalent circular diameter. These figures also include a lognormal distribution fitted for each dataset in a similar way to that explained in Section 3.1. Note that the austenite relative frequency distribution is missing in Figure 14f, as the indexed austenite percentage (2%) was not considered high enough to lead to reliable statistics. The mean equivalent diameter and the standard deviation of every condition can be found on the top right of every sub-figure. It is important to remark that the block size of the bainitic ferrite and martensitic depend on several factors. Firstly, a higher PAGS leads to a higher block size of both bainitic ferrite and martensite. This effect is more pronounced for smaller prior austenite grains, which tend to transform to a single variant [61]. Secondly, the effect of other parameters on the block size depends on whether the phase of study is bainitic ferrite or martensite. For bainitic ferrite, the block size was reported to increase, as the driving force is less negative (lower in absolute value) because the transformation of certain variants is promoted [61,62,63,64]. The transformation driving force can be lowered in absolute value by different ways: (a) by increasing the temperature [64]; (b) by increasing the carbon content [64,65]; or (c) by varying the content of any other substitutional alloying element. Goulas et al. [66] studied driving forces in steel with the chemical composition 0.51C–1.02Mn–0.33Si–1.15Cr–0.12V (wt.%) for both dendritic and interdendritic regions. They showed that the interdendritic regions (rich in alloying elements) had lower driving forces for both the nucleation and the growth of bainitic ferrite in absolute value than the dendritic regions (depleted in alloying elements) [66]. This last study shows that there is a competition between PAGS and local chemical composition on the final size of the blocks in steels with alloying elements segregated along the microstructure, such as the one used for this study. Dendritic regions, which have higher PAGS than interdendritic areas leading to higher bainitic block sizes, simultaneously exhibit higher driving forces in absolute value associated with the depletion of alloying elements, leading to lower block sizes. Which of those parameters is more significant will be further studied subsequently.
Unlike bainite, the size of the martensitic block is much less affected by the driving force [61,65] and much more by the strength of the austenitic matrix. As strain associated with the formation of martensite laths is more difficult to self-accommodate in a strong austenitic matrix, blocks of small size with random distribution of variants are formed [67]. For that reason, it has been reported that higher carbon contents lead to smaller martensitic blocks [65,67]. Therefore, for a given chemical composition, the blocks of bainitic ferrite can be bigger than those of martensite, or vice versa. For instance, while De-Castro et al. reported that martensitic blocks were more refined than the bainitic ones for a high-carbon steel [68], Kawata et al. only confirmed this trend for high-carbon contents, whereas low-carbon steels presented smaller bainitic blocks than martensitic blocks [65].
Once the parameters that affect the size of the bainitic/martensitic blocks were reviewed, results on the ferrite block size obtained after the three holding temperatures used for the bainitic reaction can be fully understood. At the lowest temperature (280 °C), no martensite was detected, and the microstructures after transformation shown in Figure 14a,b do not appear to reveal significant differences between the dendritic and interdendritic regions. In this case, the competitive effect between PAGS and the chemical composition (microsegregation) promote similar values on the block size. Although the samples treated at 330 °C did not include martensite either, Figure 14c,d show a clear reduction of the block size in the interdendritic region as compared to the dendritic one. As a PAGS reduction is evident when comparing Figure 13c (dendritic) to Figure 13d (interdendritic), it was concluded that the PAGS parameter dominates over segregation when determining the size of the bainitic blocks. On the other hand, the coarsening of the microstructure in the dendritic areas with increasing the holding temperature is deduced by comparing the microstructure of Figure 13c (330 °C) with that of Figure 13a (280 °C). This coarsening is mainly due to the temperature change, as the PAGS values are comparable in Figure 11a,c. Since PAGS values are not comparable in the interdendritic regions in Figure 13b,d, the expected coarsening is not detected (Figure 14b,d). Instead, a refinement denotes that the effect of the PAGS is much more significant than the one of temperature. Finally, the two microstructures obtained by the heat treatment at 380 °C are more difficult to compare, since the dendritic region includes a mixture of bainite and martensite, while the interdendritic regions are mainly composed of martensite. A reduction of the mean block size is detected when comparing the interdendritic region to the dendritic one, being both mean sizes lower than the rest of the values reported in Figure 14. For the interpretation of these results, several issues must be considered: (a) bainitic ferrite formed at 380 °C is expected to be coarser than that formed at any lower temperatures in the same region, because the driving force at such temperature is very low in absolute value (b) according to the results reported by Kawata et al. [65] and De-Castro et al. [68], and martensite blocks are thinner than bainitic ones for high carbon steels; (c) the martensite formed in the dendritic areas comes from a more C-enriched austenite than that formed in the interdendritic areas, because bainitic transformation has taken place at a higher extent in the former ones. Therefore, as the martensite block size decreases with carbon content [65,67], the martensitic blocks formed in the dendritic areas are more refined than those of the interdendritic zones for a fixed PAGS in both regions; (d) PAGS values are obviously bigger in the dendrites, see Figure 13e, than in the interdendritic areas, Figure 13f, as expected. Therefore, the next hypothesis is suggested for the explanation of the results. In the dendrites, during the bainitic transformation, coarse blocks are formed—higher than those formed in the dendrites at 330 °C, while in the interdendritic areas, only traces of bainite are formed. Thus, once the bainitic transformation is finished, the remaining austenite—stable at 380 °C—is more C-enriched in the dendrites, which in turn leads to a stronger austenitic matrix. For that reason, when microstructures are cooled down to room temperature, thinner martensite blocks are formed in the dendrites than in the interdendritic regions. Finally, the dendrites consist of thick bainitic blocks (in a high fraction) and very thin martensitic blocks, whereas the interdendritic regions only consist of martensitic blocks with some traces of bainite. For that reason, the mean block size in Figure 14e is only slightly higher than that of Figure 14f, being its standard deviation larger. As a result of the presence of martensite, both mean values are lower than the ones obtained at lower isothermal temperature, as shown in Figure 14a,d.
Finally, some conclusions can also be drawn from the austenite results which, as it was mentioned, mainly correspond to the blocky austenite. In accordance with what can be seen in Figure 14, with the previous characterization and with the literature [61], higher temperatures result in bainitic structures containing larger amount of blocky austenite. Blocky austenite is less stable than thin films, because it is usually less carbon enriched and is detrimental for the mechanical properties [61].

3.4. Tensile and Impact Properties

The mechanical properties were evaluated after an isothermal treatment at 280, 330, and 380 °C for 360 min, i.e., once bainitic reaction has been completed. FEG-SEM micrographs were used to measure the plate thickness of bainitic ferrite subunits for these three heat treatment temperatures, using the line intercept method reported in the literature [69]. The main objective of these measurements was to evaluate the influence of the transformation temperature on the plate thickness, neglecting the effect of the chemical composition (caused by the segregation present in the microstructure) on this parameter and to correlate these values with the results of the uniaxial tensile and impact tests summarized in Table 4. This table also includes the plate thickness values that were obtained by averaging the determinations made in both dendritic and interdendritic areas.
It is well established that the main strength contributions to the strength of bainitic steels is related to the amount and characteristic of the bainitic ferrite phase, which is the strongest and dominant phase. In very fine carbide-free bainitic microstructures, the strength is raised from the very fine scale of bainitic ferrite plates, the dislocation density, and the C excess in solid solution. The bainite transformation from austenite introduces a high amount of effective barriers to the dislocation movement such as interfaces and mobile geometrically necessary dislocations that cause an increase in strength and hardness [70]. For constant carbon content, these contributions are weakened as the ferrite plates become coarser with a lower dislocation density, that is, as the transformation temperature is increased [70,71,72,73,74,75,76].
As it was shown previously, the microstructure obtained at the transformation temperature of 280 °C is very fine and presents a high amount of nanosized bainitic ferrite plates, resulting in a very low effective grain size. This ultra-fine microstructure developed a very high strength (≈1.8 GPa), yield stress (YS) (≈1.6 GPa), and reduced total elongation (TE) or ductility (≈2%). The low ductility values observed in Table 2 for the samples treated at 280 and 330 °C were related to defects present in the casting microstructure that act as preferential sites for the nucleation of cracks, such as micro-shrinkage cavities and on-metallic inclusions. The SEM fractographies of Figure 15 reveal with detail the presence of these defects in last solidified liquid (interdendritic regions) in the fracture surface of samples austempered at 280 °C (Figure 15a) and 330 °C (Figure 15b).
The microstructure obtained at 330 °C presents a significantly lower tensile strength and yield stress, almost 500 MPa below those obtained at 280 °C. This is due to the high amount of retained austenite (≈49%) present in the microstructure [70,73,75,76]. In this sense, it has been shown in Figure 10 that interdendritic areas present a larger proportion of retained austenite (mainly blocky austenite) and, therefore, is it possible to assume that these regions contain less than 40% of the bainitic ferrite phase, which is the strongest constituent. The lower proportion of bainite, especially at interdendritic zones, and the coarser bainitic ferrite subunits generate a decrease in the tensile strength. However, due to the presence of casting defects, this amount of austenite retained in the microstructure did not lead to an increase in ductility (the total elongation is ≈3%), as expected [75,76,77].It has been reported that ductility in these structures is controlled by the amount and mechanical stability of retained austenite, which is capable of transforming into martensite by the TRIP effect [70,75,76]. To obtain a higher benefit of the TRIP effect, the mechanical stability of austenite, that is, its capability to transform into martensite under strain, must be moderate. When the mechanical stability of austenite is low, its strain-induced transformation to martensite may occur during the early stages of deformation; thus, there would be no progressive strain hardening with the applied deformation, and necking would occur at low strains. On the other hand, if austenite becomes mechanically more stable and transforms at higher strains gradually, the associated strain-hardening effectively increases the resistance to necking, and fracture is delayed to larger deformation levels. In this case (transformation at 330 °C), the amount of retained austenite should be sufficient to obtain a large deformation at rupture; however, its mechanical stability must be very low (mainly blocky austenite) due to the low formation of bainitic ferrite and a poor carbon enrichment, especially in the microsegregated areas. Figure 16 shows LOM and SEM images of the microstructure of the tensile samples transformed at 280 and 330 °C after testing. The samples were obtained from a region near the fracture surface. The presence of martensite in the sample austempered at 330 °C can be observed, evidencing that the TRIP effect has taken place. Nevertheless, no martensite was observed in the sample transformed at 280 °C, proving a higher stability.
Finally, the microstructure obtained at 380 °C showed the worst mechanical performance. The significant amount of martensite present in this microstructure and the presence of casting defects caused rapid crack propagation, which has resulted in the rupture of samples in the elastic regime (below the yield strength).
The mechanical properties reported in this work are lower than those reported in previous works by the authors. A study carried out on a carbide-free bainitic cast steel with chemical composition 0.54C–2.01Si–0.64Mn–0.50Cr (wt.%) showed a UTS of 1610 MPa, YS 1446 MPa, and TE of 12.3%. These mechanical properties obtained in this cast steel are remarkable, since they combine ultra-high strength and medium ductility [78]. On the other hand, the hardness, UTS, YS, and TE of a family of steels with a combination of different chemical compositions and heat treatment parameters allowed obtaining microstructures with hardness ranging from 40 to 55 HRC, UTS ranging from 1312 to1979 MPa, YS from 1114 to 1799 MPa, and TE values ranging from 0.4% to 17.8% [79].
Figure 17 shows SEM fracture surfaces of tensile samples. These fracture surfaces reveal a quasi-cleavage type fracture in the samples treated at 280 and 330 °C with plenty of flat quasi-cleavage facets and a few tearing ridges and dimples, which is typical in these microstructures [76]. However, in the sample treated at 380 °C, there are larger regions with cleavage fracture, which are attributed to the presence of martensite (see Figure 17f). In addition, when the fracture surfaces are compared at low magnification, (Figure 17a,c,e), it can be observed that the surface corresponding to the samples treated at 380 °C presents the flattest topography of all the fracture surfaces studied, showing the most fragile behavior. Figure 17c shows a microshrinkage, which is a typical casting defect.
Regarding the Charpy tests, the maximum impact toughness value has been obtained for the temperature of 330 °C (12.1 J/cm2), which was followed by the temperatures of 280 and 380 °C. Figure 18 depicts SEM fractographies of the Charpy samples which show quasi-cleavage fracture surfaces. In the case of the sample tested at 380 °C, a large cleavage fracture region, associated with the presence of martensite, can be observed.
The higher impact behavior found in the sample treated at 330 °C (Table 4) can be attributed to the presence of a higher amount of retained austenite. Austenite is the toughest phase and prompts the increase of the impact toughness. Similar results have been reported by other authors when evaluating high-silicon cast steels treated at similar temperatures [73]. For the transformation temperature of 380 °C, the presence of hard and brittle martensite diminishes the toughness (5 J/cm2). However, these values are lower than those for wrought advanced bainitic steels, which are attributed again to the presence of casting defects in the microstructure. Caballero et al. have reported toughness values ranging from 25 to 65 J/cm2 for wrought advanced bainitic steels [20].
Figure 19 shows a chart that summarizes the ultimate tensile strength (UTS) versus total elongation of the microstructures developed in this work against those reported for other wrought advanced bainitic steels [20,75,76,77,80]. The properties obtained in this work are poorer compared to those reported in literature; i.e., for the same UTS, microstructures obtained in this study present lower ductility. This can be mainly attributed to the many defects potentially present in cast steels, such as inclusions, shrinkage cavities, and microsegregation. It is evident that to increase the ductility and toughness and achieve mechanical properties similar to those obtained for forged and wrought steels, improvements in the metallurgical quality of cast steel, to minimize the presence of these defects, should be undertaken. For example, shrinkage casting defects can be prevented by improving the overall casting structure designing a running (gate) system with risers that ensure a continuous flow of molten metal; increasing local heat dissipation by inserting internal chills, cooling ribs, or cooling coils; or reducing the casting temperature to limit the total volume deficit. On the other hand, the presence of non-metallic inclusion can be minimized adding a ceramic filter to the gating system and/or removing the particles from the molten metal before pouring it into the mold cavity.

4. Conclusions

In this work, the bainite transformation kinetics at 280, 330, and 380 °C and microstructure as well as the tensile, hardness, and impact properties of the resulting material were characterized in a high carbon, high silicon cast steel containing (in wt.%) 0.8%C and 2.25%Si.
  • The overall microstructure depicts a clear bi-modal lognormal distribution of PAGS. Interdendritic and dendritic zones display an average grain size of 6.4 µm and 22.4 µm, respectively.
  • This cast steel presents a considerable microsegregation pattern of Mn, Si and Cr with larger concentrations in the interdendritic regions (≈2.6 wt.%Si, ≈1.6 wt.%Mn and ≈1.3 wt.%Cr) compared to the dendritic ones (≈1.6 wt.%Si, ≈0.8 wt.%Mn and ≈0.7 wt.%Cr). This affects the bainitic transformation, which starts in the dendritic areas, and these areasshow a faster transformation rate than the interdendritic areas.
  • An increase in the transformation temperature is not always associated with faster reaction kinetics. The transformation rate at 380 °C was lower than at 330 °C and 280 °C. However, for the three isothermal temperatures evaluated, the time to achieve the maximum amount of bainitic ferrite is reasonable for the point of view of the industrial practice (<200 min).
  • EBSD results show that the bainitic ferrite block size coarsens as the transformation temperature increases and the PAGS parameter governs their size over the chemical composition variation (microsegregation).
  • The ultra-fine microstructure developed by the isothermal treatment at 280 °C possesses a very high YS (≈1.6 GPa) and UTS (≈1.8 GPa) but a low TE (≈2%). On the other hand, the microstructure obtained at 380 °C showed the worst mechanical performance due to the presence of a significant amount of martensite in the microstructure. The poor ductility and toughness is attributed to the presence of inclusions, shrinkage cavities, and microsegregation. This could be overcome by improving the casting process.

Author Contributions

Conceptualization, A.B., F.G.C. and D.S.-M.; methodology A.B., N.T., D.S.-M. and F.G.C.; software, A.E.-C. validation, A.B., D.S.-M. and F.G.C.; formal analysis, A.E.-C., investigation, A.B., A.E.-C., D.S.-M., N.T., J.A.J., and F.G.C.; writing—original draft preparation, A.B., N.T.,A.E.-C., D.S.-M. and F.G.C.; writing—review and editing, A.B., A.E.-C., D.S.-M., N.T., J.A.J. and F.G.C.; visualization, A.B., A.E.-C., D.S.-M., N.T.; supervision, F.G.C. and D.S.-M.; project administration, A.B., D.S.-M. and F.G.C. All authors have read and agreed to the published version of the manuscript.

Funding

This work has been supported by CENIM-CSIC of Spain and CONICET, ANPCyT and MINCyT of Argentina [Project PICT 12-1146]. Some of the authors (D.S.M., J.A.J., F.G.C.) also acknowledge financial support from the Ministerio de Ciencia, Innovación y Universidades (ProyectosI+D+i 2019) in the form of a Coordinate Project (PID2019-109334RB) and to the Comunidad de Madrid through P2018/NMT4381project.

Institutional Review Board Statement

Not applicable.

Informed Consent Statement

Not applicable.

Data Availability Statement

The raw/processed data required to reproduce these findings cannot be shared at this time as the data also forms part of an ongoing study.

Acknowledgments

Authors are grateful for the experimental support to Carmen Peña (Mechanical Testing lab), Miguel Angel Acedo (Phase Transformations lab), Irene Llorente (X-ray lab) and Antonio Tomás López (Electron Microscopy lab) from CENIM-CSIC.

Conflicts of Interest

The authors declare no conflict of interest.

Nomenclature

AcmCritical temperature at which pearlite to austenite transformation starts
AHSSAdvanced high-strength steel
AlAluminum
ASTMAmerican Society of Testing Materials
bccBody-centered cubic
CCarbon
cmCementite phase
CoCobalt
CPComplex phase
CrChromium
DPDual phase
DICDifferential interference contrast
DRCLDerivative of the RCL
EBSDElectron backscatter diffraction
FeIron
FEG-SEMField emission gun-scanning electron microscopy
HC-HSi-SteelsHigh-carbon and high-silicon steels
HVVickers Hardness
kPartition coefficient
LOMLight optical microscopy
MMartensite
MnManganese
MoMolybdenum
MsMartensite start temperature
SiSilicon
PPhosphorous
PAGBPrior austenite grain boundary
PAGSPrior austenite grain size
RCLRelative change in length
SSulfur
TRIPTransformation-Induced Plasticity
SAE-AISISociety of Automotive Engineers-American Iron and Steel Institute
SEMScanning Electron Microscopy
TETotal elongation
TγAustenitizingtemperature
UTSUltimate tensile strength
VVanadium
vol.%Volume percent
wt.%Weight percent
XRDX-Ray diffraction
YSYield stress
αMartensite phase
ΔTDifference between Tγ and Acm
γAustenite phase
μ1 and μ2Constants that represent the mean of the logarithmic values of y1 (x) and y2 (x), respectively
pConstant that represents the weight of y1 (x)
σ1 and σ2Constants that represent the standard deviation of the logarithmic values of y1 (x) and y2 (x), respectively
x0Constant that increases as y2 (x) is shifted horizontally to higher values
yTheoretical probability (in percentage) of a prior austenite grain of size x (in µm)
y1 (x) and y2 (x)Function that describe the probability of a prior austenite grain of size x in the interdendritic and dendritic regions, respectively

References

  1. Putatunda, S.K. Austempering of a silicon manganese cast steel. Mater. Manuf. Process. 2001, 16, 743–762. [Google Scholar] [CrossRef]
  2. Lefevre, J.; Hayrynen, K.L. Austempered Materials for Powertrain Applications. J. Mater. Eng. Perform. 2013, 22, 1914–1922. [Google Scholar] [CrossRef] [Green Version]
  3. Ductile Iron Data for Design Engineers—Ductile Iron Society. Strongville(OH): DIS. Available online: https://www.ductile.org/didata/Section2/2intro.htm (accessed on 18 November 2020).
  4. Swift, K.G.; Booker, J.D. Manufacturing Process Selection Handbook; Chapter 3; Casting Processes; Butterworth-Heinemann: Oxford, UK, 2013; pp. 61–91. [Google Scholar] [CrossRef]
  5. Castings Applications—The Metalcasting. The Metalcasting. 2019. Available online: http://www.themetalcasting.com/casting-applications.html (accessed on 18 November 2020).
  6. Degarmo, E.P.; Black, J.T.; Kohser, R.A. Materials and Processes in Manufacturing, 9th ed.; Wiley: Hoboken, NJ, USA, 2003. [Google Scholar]
  7. ASM International. ASM Handbook, 9th ed.; ASM International: Geauga County, OH, USA, 2008; Volume 15. [Google Scholar]
  8. Casting Process Advantages—The Metalcasting. 2019. Available online: http://www.themetalcasting.com/casting-process-advantages.html (accessed on 18 November 2020).
  9. Åström, H.; Loberg, B.; Bengtsson, B.; Easterling, K.E. Hot cracking and micro-segregation in 18–10 stainless steel welds. Met. Sci. 1976, 10, 225–234. [Google Scholar] [CrossRef]
  10. Chojecki, A.; Telejko, I.; Bogacz, T. Influence of chemical composition on the hot tearing formation of cast steel. Theor. Appl. Fract. Mech. 1997, 27, 99–105. [Google Scholar] [CrossRef]
  11. Katayama, S.; Fujimoto, T.; Matsunawa, A. Correlation among solidification process, microstructure microsegregation and so-lidification cracking susceptibility in stainless steel weld metals. Trans. JWRI 1985, 14, 123–138. [Google Scholar]
  12. Ennis, B.; Jimenez-Melero, E.; Mostert, R.; Santillana, B.; Lee, P. The role of aluminium in chemical and phase segregation in a TRIP-assisted dual phase steel. Acta Mater. 2016, 115, 132–142. [Google Scholar] [CrossRef]
  13. Ahmed, M.; Salam, I.; Hashmi, F.H.; Khan, A.Q. Influence of banded structure on the mechanical properties of a high-strength maraging steel. J. Mater. Eng. Perform. 1997, 6, 165–171. [Google Scholar] [CrossRef]
  14. Offerman, S.; Van Dijk, N.; Rekveldt, M.T.; Sietsma, J.; Van Der Zwaag, S. Ferrite/pearlite band formation in hot rolled medium carbon steel. Mater. Sci. Technol. 2002, 18, 297–303. [Google Scholar] [CrossRef]
  15. Stauffer, A.C.; Koss, D.; Mckirgan, J.B. Microstructural banding and failure of a stainless steel. Met. Mater. Trans. A 2004, 35, 1317–1324. [Google Scholar] [CrossRef]
  16. Ramazani, A.; Quade, H.; Abbasi, M.; Prahl, U. The effect of martensite banding on the mechanical properties and formability of TRIP steels. Mater. Sci. Eng. A 2016, 651, 160–164. [Google Scholar] [CrossRef]
  17. Penha, R.N.; Vatavuk, J.; Couto, A.A.; Pereira, S.A.D.L.; De Sousa, S.A.; Canale, L.D.C. Effect of chemical banding on the local hardenability in AISI 4340 steel bar. Eng. Fail. Anal. 2015, 53, 59–68. [Google Scholar] [CrossRef]
  18. Verhoeven, J.D. A Review of Microsegregation Induced Banding Phenomena in Steels. J. Mater. Eng. Perform. 2000, 9, 286–296. [Google Scholar] [CrossRef]
  19. Krauss, G. Solidification, segregation, and banding in carbon and alloy steels. Met. Mater. Trans. A 2003, 34, 781–792. [Google Scholar] [CrossRef]
  20. Caballero, F.; Chao, J.; Cornide, J.; Garcia-Mateo, C.; Santofimia, M.J.; Capdevila, C. Toughness of Advanced High Strength Bainitic Steels. Mater. Sci. Forum 2010, 638, 118–123. [Google Scholar] [CrossRef]
  21. Edmonds, D. Advanced Bainitic and Martensitic Steels with Carbide-Free Microstructures Containing Retained Austenite. Mater. Sci. Forum 2010, 638, 110–117. [Google Scholar] [CrossRef]
  22. De Moor, E.; Speer, J.G. Chapter 10: Bainitic and quenching and partitioning steels. In Automotive Steels; Rana, R., Singh, S.B., Eds.; Woodhead Publishing: Cambridge, UK, 2017; pp. 289–336. [Google Scholar] [CrossRef]
  23. Caballero, F.G.; Bhadeshia, H.K.D.H.; Mawella, K.J.A.; Jones, D.G.; Brown, P. Design of novel high strength bainitic steels: Part 1. Mater. Sci. Technol. 2001, 17, 512–516. [Google Scholar] [CrossRef]
  24. Caballero, F.G.; Bhadeshia, H.K.D.H.; Mawella, K.J.A.; Jones, D.G.; Brown, P. Design of novel high strength bainitic steels: Part 2. Mater. Sci. Technol. 2001, 17, 517–522. [Google Scholar] [CrossRef] [Green Version]
  25. Caballero, F.G.; Bhadeshia, H.K.D.H.; Mawella, K.J.A.; Jones, D.G.; Brown, P. Very strong low temperature bainite. Mater. Sci. Technol. 2002, 18, 279–284. [Google Scholar] [CrossRef] [Green Version]
  26. Putatunda, S.K. Fracture toughness of a high carbon and high silicon steel. Mater. Sci. Eng. A 2001, 297, 31–43. [Google Scholar] [CrossRef]
  27. Fu, H.; Miao, Y.; Chen, X.; Qiao, B. Effect of Austempering on the Structures and Performances of Cast High Carbon Si-Mn Steel. Steel Res. Int. 2007, 78, 358–363. [Google Scholar] [CrossRef]
  28. Mandal, D.; Ghosh, M.; Pal, J.; Chowdhury, S.G.; Das, G.; Das, S.K.; Chowdhury, S. Evolution of microstructure and mechanical properties under different austempering hold-ing time of cast Fe–1.5Si–1.5Mn–V steels. Mater. Des. 2014, 54, 831–837. [Google Scholar] [CrossRef]
  29. Basso, A.; Toda-Caraballo, I.; San-Martín, D.; Caballero, F. Influence of cast part size on macro- and microsegregation patterns in a high carbon high silicon steel. J. Mater. Res. Technol. 2020, 9, 3013–3025. [Google Scholar] [CrossRef]
  30. Yoozbashi, M.; Yazdani, S.; Wang, T. Design of a new nanostructured, high-Si bainitic steel with lower cost production. Mater. Des. 2011, 32, 3248–3253. [Google Scholar] [CrossRef]
  31. Garcia-Mateo, C.; Caballero, F.G.; Bhadeshia, H.K.D.H. Acceleration of Low-temperature Bainite. ISIJ Int. 2003, 43, 1821–1825. [Google Scholar] [CrossRef] [Green Version]
  32. Caballero, F.; Bhadeshia, H. Very strong bainite. Curr. Opin. Solid State Mater. Sci. 2004, 8, 251–257. [Google Scholar] [CrossRef] [Green Version]
  33. Garcia-Mateo, C.; Caballero, F.G.; Sourmail, T.; Kuntz, M.; Cornide, J.; Smanio, V.; Elvira, R. Tensile behaviour of a nanocrystalline bainitic steel containing 3 wt% silicon. Mater. Sci. Eng. A 2012, 549, 185–192. [Google Scholar] [CrossRef] [Green Version]
  34. Tenaglia, N.E.; Boeri, R.; Massone, J.; Basso, A.D. Assessment of the austemperability of high-silicon cast steels through Jominy hardenability tests. Mater. Sci. Technol. 2018, 34, 1990–2000. [Google Scholar] [CrossRef]
  35. Yang, H.-S.; Bhadeshia, H.K.D.H. Uncertainties in dilatometric determination of martensite start temperature. Mater. Sci. Technol. 2007, 23, 556–560. [Google Scholar] [CrossRef]
  36. García de Andrés, C.; Bartolomé, M.J.; Capdevila, C.; Martín, D.S.; Caballero, F.G.; López, V. Metallographic techniques for the determination of the austenite grain size in medium-carbon microalloyed steels. Mater. Charact. 2001, 46, 389–398. [Google Scholar] [CrossRef] [Green Version]
  37. San-Martin, D.; Palizdar, Y.; Cochrane, R.; Brydson, R.; Scott, A. Application of Nomarski differential interference contrast microscopy to highlight the prior austenite grain boundaries revealed by thermal etching. Mater. Charact. 2010, 61, 584–588. [Google Scholar] [CrossRef] [Green Version]
  38. García de Andrés, C.; Caballero, F.; Capdevila, C.; Martín, D.S. Revealing austenite grain boundaries by thermal etching: Advantages and disadvantages. Mater. Charact. 2003, 49, 121–127. [Google Scholar] [CrossRef] [Green Version]
  39. Palizdar, Y.; Martin, D.S.; Ward, M.B.; Cochrane, R.; Brydson, R.; Scott, A. Observation of thermally etched grain boundaries with the FIB/TEM technique. Mater. Charact. 2013, 84, 28–33. [Google Scholar] [CrossRef] [Green Version]
  40. Bruker, A.X.S.; Gmb, H. DIFFRAC Plus Topas Version 4.2 [CD-ROM]; Bruker AXS GmbH: Karlsruhe, Germany, 2009. [Google Scholar]
  41. Bachmann, F.; Hielscher, R.; Schaeben, H. Texture Analysis with MTEX—Free and Open Source Software Toolbox. Solid State Phenom. 2010, 160, 63–68. [Google Scholar] [CrossRef] [Green Version]
  42. Lagarias, J.C.; Reeds, J.A.; Wright, M.H.; Wright, P.E. Convergence Properties of the Nelder—Mead Simplex Method in Low Dimensions. SIAM J. Optim. 1998, 9, 112–147. [Google Scholar] [CrossRef] [Green Version]
  43. Hao, Y.; Liu, W.; Li, J.; Nie, B.; Zhang, W.-N.; Liu, Z. Microstructural bandings evolution behavior and their effects on microstructure and mechanical property of super-austenitic stainless steel. Mater. Sci. Eng. A 2018, 736, 258–268. [Google Scholar] [CrossRef]
  44. Sha, W.; Leitner, H.; Guo, Z.; Xu, W. Chapter 11—Phase transformations in maraging steels. In Phase Transformations in Steels; Pereloma, E., Edmonds, D.V., Eds.; Woodhead Publishing: Cambridge, UK, 2012; Volume 2, pp. 332–362. [Google Scholar] [CrossRef]
  45. Liang, J.; Zhao, Z.; Tang, D.; Ye, N.; Yang, S.; Liu, W. Improved microstructural homogeneity and mechanical property of medium manganese steel with Mn segregation banding by alternating lath matrix. Mater. Sci. Eng. A 2018, 711, 175–181. [Google Scholar] [CrossRef]
  46. Basso, A.D.; Toda-Caraballo, I.; Eres-Castellanos, A.; San-Martin, D.; Jimenez, J.A.; Caballero, F. Effect of the Microsegregation on Martensitic and Bainitic Reactions in a High Carbon-High Silicon Cast Steel. Metals 2020, 10, 574. [Google Scholar] [CrossRef]
  47. Cahn, J.W. The impurity-drag effect in grain boundary motion. Acta Met. 1962, 10, 789–798. [Google Scholar] [CrossRef]
  48. Hillert, M. Solute drag, solute trapping and diffusional dissipation of Gibbs energy. Acta Mater. 1999, 47, 4481–4505. [Google Scholar] [CrossRef]
  49. Fujiyama, N.; Nishibata, T.; Seki, A.; Hirata, H.; Kojima, K.; Ogawa, K. Austenite grain growth simulation considering the solute-drag effect and pinning effect. Sci. Technol. Adv. Mater. 2017, 18, 88–95. [Google Scholar] [CrossRef]
  50. Bhadeshia, H.K.D.H. Bainite in Steels: Transformations, Microstructure and Properties, 2nd ed.; Chapter 5: Thermodynamics; IOM Communications Ltd.: London, UK, 2001; pp. 122–128. [Google Scholar] [CrossRef]
  51. Bhadeshia, H.K.D.H. Bainite: The Incomplete-Reaction phenomenon and the approach to equilibrium. In Proceedings of the International Solid-Solid Phase Transformations Conference, Pittsburgh, PA, USA, 10–14 August 1981. [Google Scholar]
  52. Garcia-Mateo, C.; Caballero, F.; Capdevila, C.; De Andrés, C.G. Estimation of dislocation density in bainitic microstructures using high-resolution dilatometry. Scr. Mater. 2009, 61, 855–858. [Google Scholar] [CrossRef] [Green Version]
  53. Caballero, F.G.; Santofimia, M.J.; García-Mateo, C.; De Andrés, C.G. Time-Temperature-Transformation Diagram within the Bainitic Temperature Range in a Medium Carbon Steel. Mater. Trans. 2004, 45, 3272–3281. [Google Scholar] [CrossRef] [Green Version]
  54. Santajuana, M.A.; Eres-Castellanos, A.; Ruiz-Jimenez, V.; Allain, S.; Geandier, G.; Caballero, F.; Garcia-Mateo, C. Quantitative Assessment of the Time to End Bainitic Transformation. Metals 2019, 9, 925. [Google Scholar] [CrossRef] [Green Version]
  55. Tenaglia, N.E.; Massone, J.; Boeri, R.; Speer, J.G. Effect of microsegregation on carbide-free bainitic transformation in a high-silicon cast steel. Mater. Sci. Technol. 2020, 36, 690–698. [Google Scholar] [CrossRef]
  56. Tenaglia, N.E.; Arias-Hidalgo, M.; Boeri, R.; Massone, J.; Basso, A.D. Study of austempering kinetics of high silicon bainitic cast steels. Int. J. Cast Met. Res. 2018, 32, 21–30. [Google Scholar] [CrossRef]
  57. Morales-Rivas, L.; González-Orive, A.; Garcia-Mateo, C.; Hernández-Creus, A.; Caballero, F.G.; Vázquez, L. Nanomechanical characterization of nanostructured bainitic steel: Peak Force Microscopy and Nanoindentation with AFM. Sci. Rep. 2015, 5, 17164. [Google Scholar] [CrossRef] [Green Version]
  58. Furnémont, Q.; Kempf, M.; Jacques, P.; Göken, M.; Delannay, F. On the measurement of the nanohardness of the constitutive phases of TRIP-assisted multiphase steels. Mater. Sci. Eng. A 2002, 328, 26–32. [Google Scholar] [CrossRef]
  59. Nyyssönen, T.; Peura, P.; Kuokkala, V.-T. Crystallography, Morphology, and Martensite Transformation of Prior Austenite in Intercritically Annealed High-Aluminum Steel. Met. Mater. Trans. A 2018, 49, 6426–6441. [Google Scholar] [CrossRef]
  60. Carpenter, H.C.H.; Tamura, S. Experiments on the production of large copper crystals. In Proceedings of the Royal Society of London; Series A. Mathematical and Physical Sciences; The Royal Society: London, UK, 1926; Volume 113, pp. 28–43. [Google Scholar]
  61. Bhadeshia, H.K.D.H. Bainite in Steels: Theory and Practice, 3rd ed.; CRC Press: London, UK, 2015. [Google Scholar]
  62. Mueller, I.; Rementeria, R.; Caballero, F.; Kuntz, M.; Sourmail, T.; Kerscher, E. A Constitutive Relationship between Fatigue Limit and Microstructure in Nanostructured Bainitic Steels. Materials 2016, 9, 831. [Google Scholar] [CrossRef] [Green Version]
  63. Sarizam, M.; Komizo, Y. Effects of Holding Temperature on Bainite Transformation in Cr-Mo Steel. J. Mech. Eng. Sci. 2014, 7, 1103–1114. [Google Scholar] [CrossRef]
  64. Furuhara, T.; Kawata, H.; Morito, S.; Maki, T. Crystallography of upper bainite in Fe–Ni–C alloys. Mater. Sci. Eng. A 2006, 431, 228–236. [Google Scholar] [CrossRef]
  65. Kawata, H.; Sakamoto, K.; Moritani, T.; Morito, S.; Furuhara, T.; Maki, T. Crystallography of ausformed upper bainite structure in Fe–9Ni–C alloys. Mater. Sci. Eng. A 2006, 438, 140–144. [Google Scholar] [CrossRef]
  66. Goulas, C.; Mecozzi, M.G.; Sietsma, J. Bainite Formation in Medium-Carbon Low-Silicon Spring Steels Accounting for Chemical Segregation. Met. Mater. Trans. A 2016, 47, 3077–3087. [Google Scholar] [CrossRef] [Green Version]
  67. Morito, S.; Yoshida, H.; Maki, T.; Huang, X. Effect of block size on the strength of lath martensite in low carbon steels. Mater. Sci. Eng. A 2006, 438, 237–240. [Google Scholar] [CrossRef]
  68. De-Castro, D.; Rementeria, R.; Vivas, J.; Sourmail, T.; Poplawsky, J.; Urones-Garrote, E.; Jimenez, J.; Capdevila, C.; Caballero, F. Examining the multi-scale complexity and the crystallographic hierarchy of isothermally treated bainitic and martensitic structures. Mater. Charact. 2020, 160, 110127. [Google Scholar] [CrossRef]
  69. Chang, L.C.; Bhadeshia, H.K.D.H. Austenite films in bainitic microstructures. Mater. Sci. Technol. 1995, 11, 874–882. [Google Scholar] [CrossRef]
  70. Garcia-Mateo, C.; Caballero, F. Understanding the Mechanical Properties of Nanostructured Bainite. In Handbook of Mechanical Nanostructuring; Aliofkhazraei, M., Ed.; Wiley-VCH Verlag GmbH & Co. KGaA: Weinheim, Germany, 2015; pp. 35–65. [Google Scholar]
  71. Langford, G.; Cohen, M. Strain hardening of iron by severe plastic deformation. ASM Trans. 1969, 62, 623–638. [Google Scholar]
  72. Caballero, F.G. Chapter 12: Carbide-free bainite in steels. In Phase Transformations in Steels; Pereloma, E., Edmonds, D.V., Eds.; Woodhead Publishing: Cambridge, UK, 2012; pp. 436–467. [Google Scholar]
  73. Garcia-Mateo, C.; Caballero, F.G. Ultra-high-strength Bainitic Steels. ISIJ Int. 2005, 45, 1736–1740. [Google Scholar] [CrossRef] [Green Version]
  74. Chen, X.; Li, Y. Effects of Ti, V, and rare earth on the mechanical properties of austempered high silicon cast steel. Met. Mater. Trans. A 2006, 37, 3215–3220. [Google Scholar] [CrossRef]
  75. García-Mateo, C.; Caballero, F.G. The Role of Retained Austenite on Tensile Properties of Steels with Bainitic Microstructures. Mater. Trans. 2005, 46, 1839–1846. [Google Scholar] [CrossRef] [Green Version]
  76. Morales-Rivas, L.; Garcia-Mateo, C.; Sourmail, T.; Kuntz, M.; Rementeria, R.; Caballero, F. Ductility of Nanostructured Bainite. Metals 2016, 6, 302. [Google Scholar] [CrossRef]
  77. Miihkinen, V.T.T.; Edmonds, D.V. Tensile deformation of two experimental high-strength bainitic low-alloy steels containing silicon. Mater. Sci. Technol. 1987, 3, 432–440. [Google Scholar] [CrossRef]
  78. Tenaglia, N.E.; Boeri, R.; Basso, A.D. Mechanical properties of a carbide-free bainitic cast steel with dispersed free ferrite. Mater. Sci. Technol. 2019, 36, 108–117. [Google Scholar] [CrossRef]
  79. Tenaglia, N.E.; Basso, A.; Massone, J.; Boeri, R. Development of ultra-high strength carbide-free bainitic cast steels. Int. J. Cast Met. Res. 2020, 33, 258–265. [Google Scholar] [CrossRef]
  80. Sourmail, T.; Caballero, F.; Garcia-Mateo, C.; Smanio, V.; Ziegler, C.; Kuntz, M.; Elvira, R.; Leiro, A.; Vuorinen, E.; Teeri, T. Evaluation of potential of high Si high C steel nanostructured bainite for wear and fatigue applications. Mater. Sci. Technol. 2013, 29, 1166–1173. [Google Scholar] [CrossRef]
Figure 1. Keel-block scheme showing the different specimens used in this study and the location from where they were extracted and machined.
Metals 11 00220 g001
Figure 2. Schematic view of the heat treatments schedules (temperature vs. time) used in this work.
Metals 11 00220 g002
Figure 3. Scheme showing tensile and impact samples used in this work.
Metals 11 00220 g003
Figure 4. Light optical microscopy (LOM) micrographs of the prior austenite grain boundaries revealed by thermal etching. (a) Bright field image of the microstructure at a low magnification; (bd) Micrograph corresponding to the red-square in image (a), using Nomarski microscopy (DIC).
Metals 11 00220 g004
Figure 5. Prior austenite grain size (PAGS) probability distribution, in which the theoretical probability distribution, fitted as a bimodal lognormal function, is overlaid.
Metals 11 00220 g005
Figure 6. (a) Relative change in length function of time of isothermal heat treatments at 280, 330, and 380 °C. (b) Determination of time to end the transformation at 280 °C by means of the DRCL (horizontal line corresponds to 4% of the maximum DRCL and the arrow pinpointed the determined time).
Metals 11 00220 g006
Figure 7. Volume fraction of retained austenite and Vickers Hardness (HV) as function of holding time at different transformation temperatures.
Metals 11 00220 g007
Figure 8. Microstructural evolution as function of isothermal temperature and holding time. (ac): 20 min, (df): 80 min, (gi): 160 min, (jl): 360 min. Nital 2%.
Metals 11 00220 g008aMetals 11 00220 g008b
Figure 9. SEM micrographs showing: (a) the microstructure obtained at 280 °C for 360 min, (b) interdendritic and (c) dendritic regions. Nital 2%.
Metals 11 00220 g009
Figure 10. SEM micrographs showing: (a) the microstructure obtained at 330 °C for 360 min, (b) interdendritic and (c) dendritic regions. Nital 2%.
Metals 11 00220 g010
Figure 11. SEM micrographs showing: (a) the microstructure obtained at 380 °C for 360 min, (b) interdendritic and (c) dendritic regions. Nital 2%.
Metals 11 00220 g011
Figure 12. Dilatometric curves for the three isothermal temperatures, for 360 min of holding time. Relative change in length as function of temperature. Curves correspond to final stage of heat treatment (quenching) from the transformation temperature to room temperature.
Metals 11 00220 g012
Figure 13. Clean phase maps, where the area percentage of austenite and ferrite are indicated in the legends. The maps correspond to the microstructures (a) 280—Dendritic; (b) 280—Interdendritic; (c) 330—Dendritic; (d) 330—Interdendritic; (e) 380—Dendritic; (f) 380—Interdendritic. The ferrite grain boundaries are depicted by black thin solid lines, the prior austenite grain (PAG) boundaries are represented by black thick solid lines, and the twin boundaries are represented by red thick solid lines.
Metals 11 00220 g013
Figure 14. Retained austenite (black) and ferrite block (red) size relative frequency distribution expressed as the equivalent circle diameter of each grain area for the conditions (a) 280—Dendritic; (b) 280—Interdendritic; (c) 330—Dendritic; (d) 330—Interdendritic; (e) 380—Dendritic; (f) 380—Interdendritic. Black and red dashed lines represent lognormal fittings to the experimental distributions. On the top part of each plot box, one can find the mean austenite and ferrite block grain equivalent diameter, which is followed by the standard deviation.
Metals 11 00220 g014
Figure 15. SEM micrographs showing casting defects in last to freeze zones (interdendritic regions) of fracture surface of tensile samples: (a) transformed at 280 °C, (b) transformed at 330 °C. Small black dots in Figure 13b corresponding to non-metallic inclusions.
Metals 11 00220 g015
Figure 16. LOM and SEM micrographs showing the microstructure of a region near at the fracture surface of tensile samples after test, transformed at: (a,b) LOM-280 °C: No martensite was observed. (c,d) LOM-330 °C and (e) SEM-330 °C: Martensite can be appreciated, pointed out with M letter (lighter areas), evidencing the Transformation-Induced Plasticity (TRIP) effect. Nital 2%.
Metals 11 00220 g016
Figure 17. SEM micrographs showing fracture surface of tensile samples: (a,b) transformed at 280 °C, (c,d) transformed at 330 °C, and (e,f) transformed at 380 °C.
Metals 11 00220 g017
Figure 18. SEM micrographs showing fracture surface of Charpy samples: (a,b) transformed at 280 °C, (c,d) transformed at 330 °C, and (e,f) transformed at 380 °C.
Metals 11 00220 g018
Figure 19. Chart showing ultimate tensile strength versus total elongation of the microstructures developed in this work against those reported for other wrought advanced bainitic steels [20,75,76,77,80].
Metals 11 00220 g019
Table 1. Chemical composition of the manufactured steel (wt.%).
CSiMnCrSPFe
0.802.251.051.100.010.013Balance
Table 2. Values of the parameters of the theoretical probability function fitted in this work (Equation (1)). The meaning of each of the abbreviations can be found in the main text.
pμ1μ2σ1σ2x0
0.431.783.050.390.351.35
Table 3. Statistical variables for theoretical probability distribution, fitted as a bimodal lognormal function.
Statistical VariablesMean/µmVariance/µm2Standard Deviation/µmMode/µm
Log-norm 16.46.72.65.1
Log-norm 222.465.78.118.7
Table 4. Ultimate tensile strength (UTS), yield stress (YS), total elongation (TE), and impact energy as function of the transformation temperature for 360 min, i.e., once the bainitic reaction has been completed.
Transformation TemperatureUTS (MPa)YS (MPa)TE (%)Impact Energy (J/cm2)Plate Thickness (nm)
280 °C1811 ± 381632 ± 422.0 ± 0.17.2 ± 2.855 ± 16
330 °C1363 ± 1011124 ± 512.8 ± 0.812.1 ± 0.784 ± 32
380 °C1024 ± 84-0.2 ± 0.15.0 ± 0.1330 ± 71
Publisher’s Note: MDPI stays neutral with regard to jurisdictional claims in published maps and institutional affiliations.

