1. Introduction
Modern technologies, such as renewable energy and e-mobility, demand a new portfolio of technology-critical elements and materials. Limited resources, national policies or monopolies threaten the supply of some technology-critical elements. Hence, the recovery of these elements from waste is crucial. On the one hand, demand for lithium (Li) has increased rapidly due to the popularity and extraordinary performance of Li-ion batteries. On the other hand, Li is produced by mainly two countries, Australia (ca. 55%) and Chile (ca. 23%) [
1]. The recycling of some components from Li-ion batteries is already put into practice, e.g., cobalt, in a pyrometallurgical process [
2,
3]. Pyrometallurgical recycling has the benefit of being adaptable to many waste streams; additionally, the emission of toxic compounds like HF is prevented. Due to its ignoble character, Li is driven into the slag and is usually not recovered.The recovery of Li from pyrometallurgical recycling slags can be accomplished by the targeted formation of “engineered artificial minerals” (EnAM).
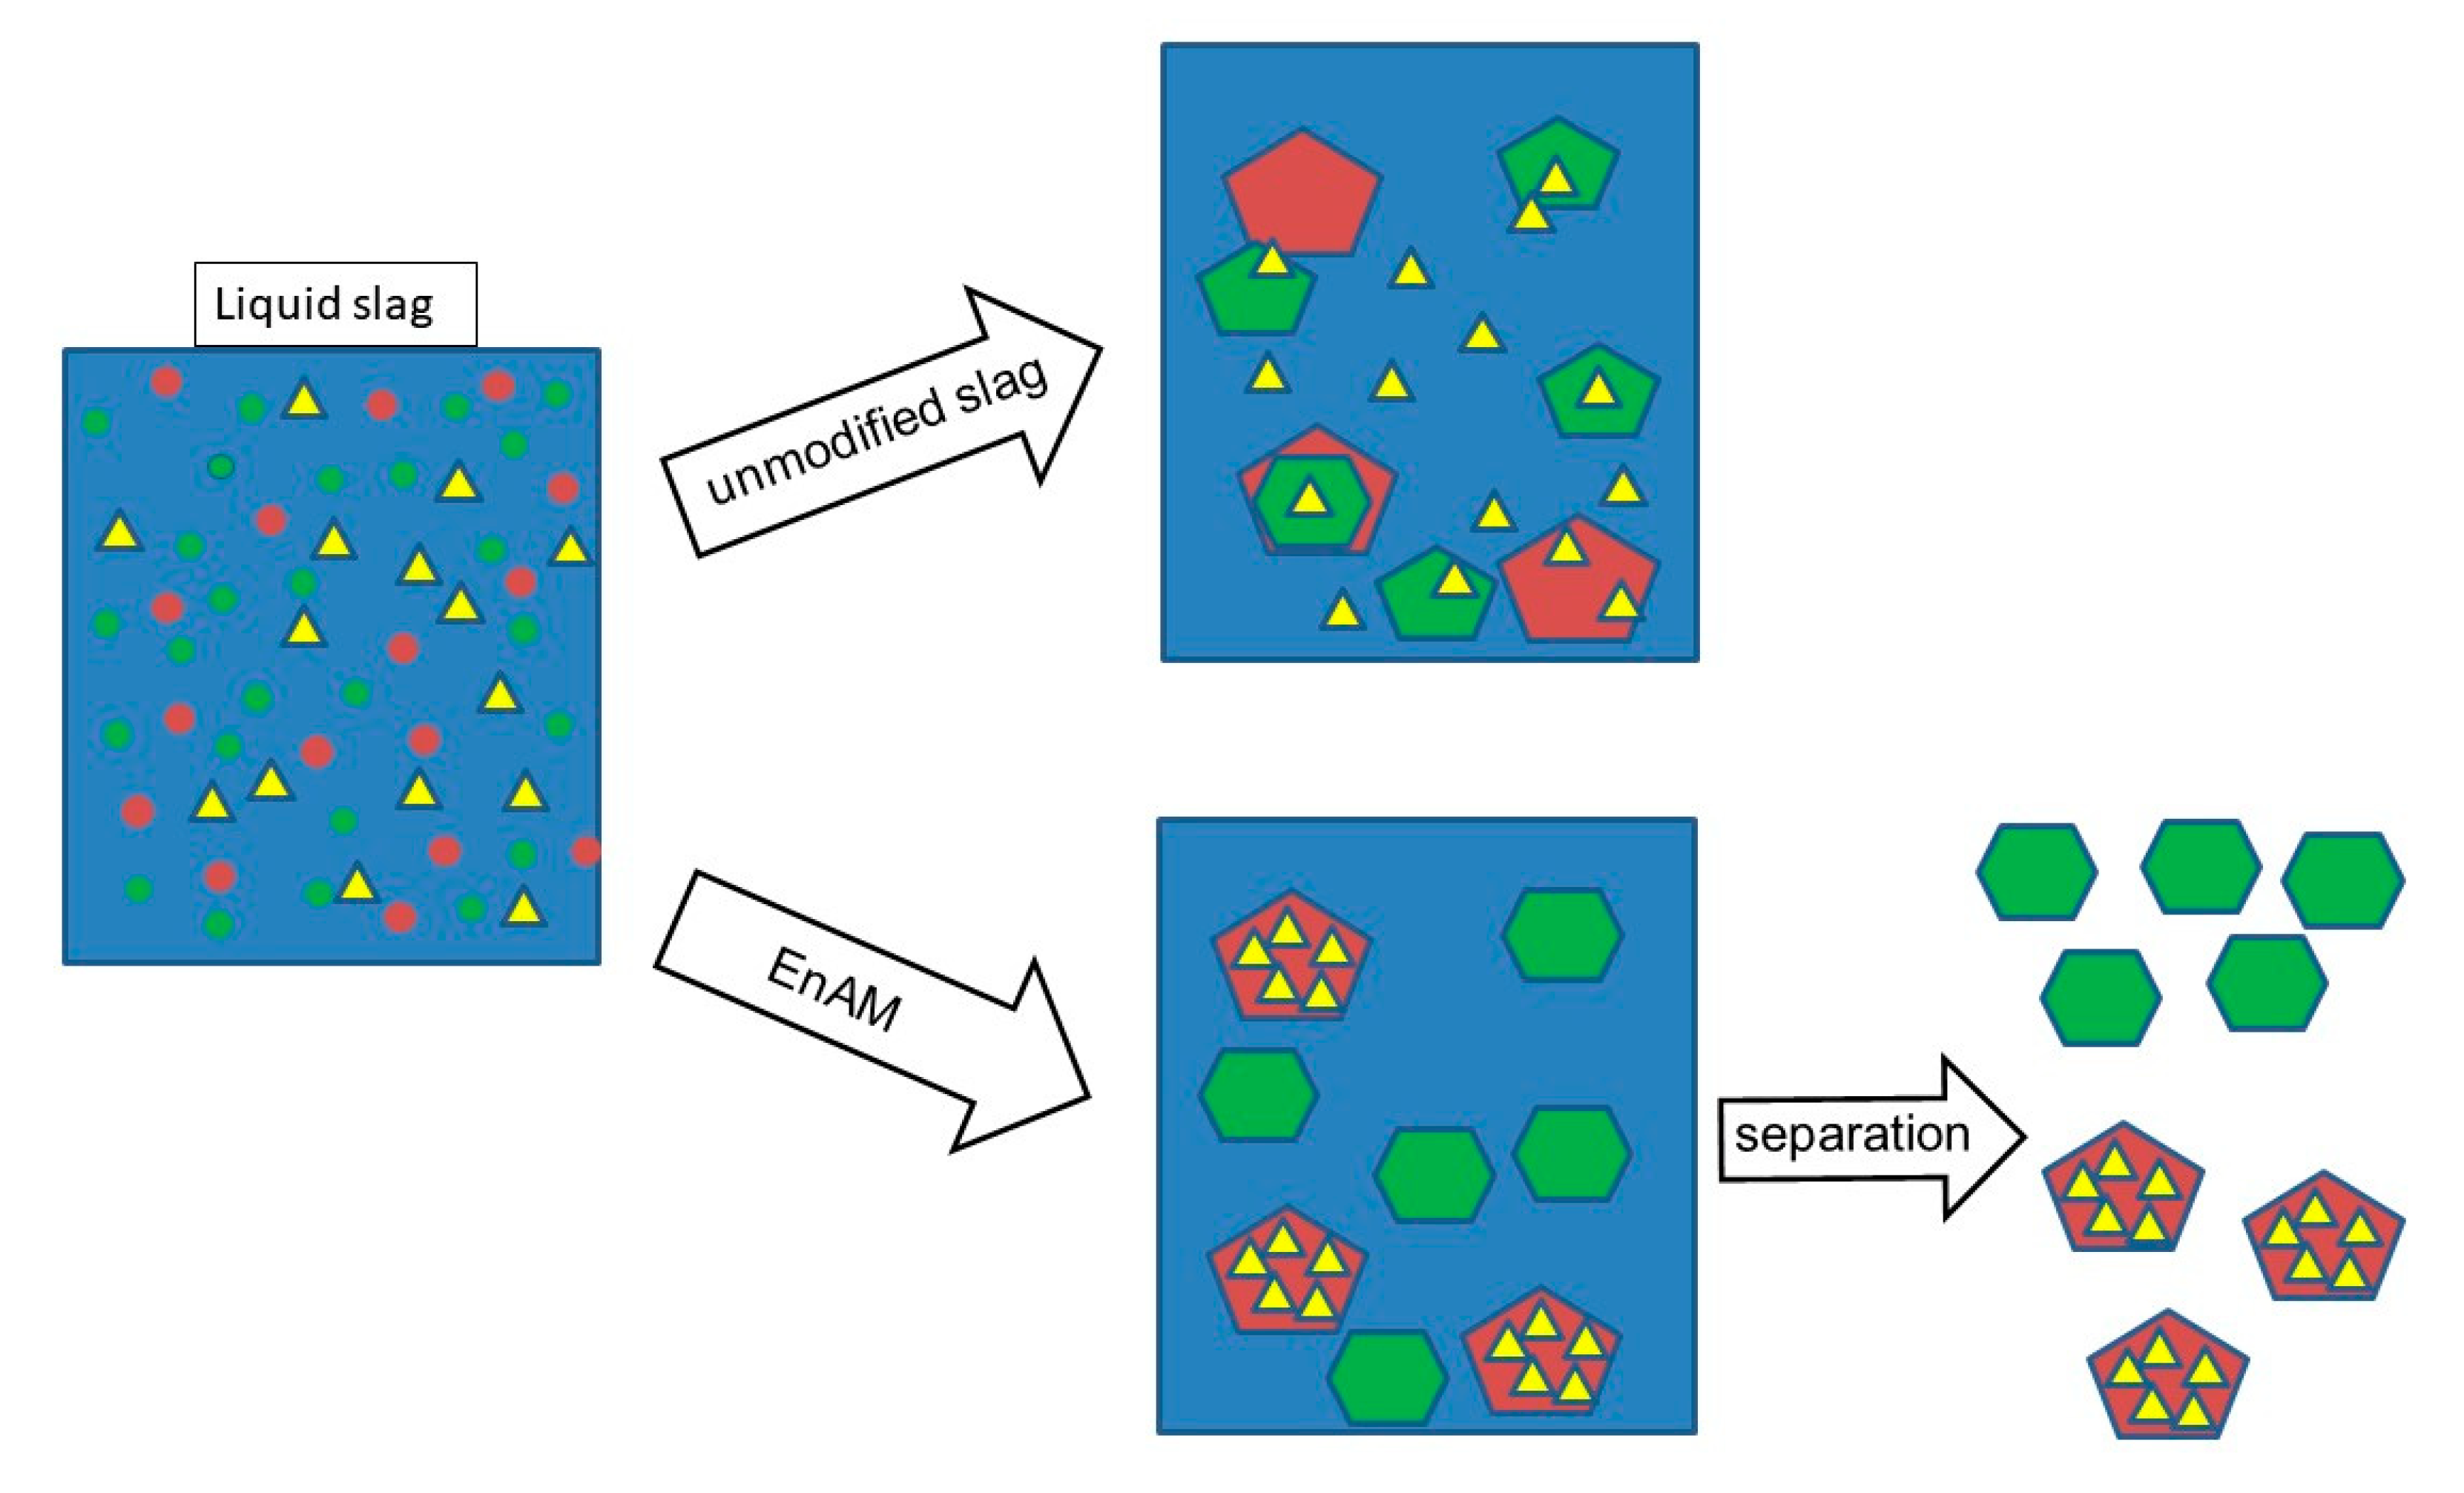
The strategy of EnAM formation is to concentrate the elements of interest in a few phases, with a structure and size that allows an efficient separation.
Figure 1 shows a scheme of EnAM formation. The target element (yellow triangle) spreads over several different phases (red and green forms) and the matrix (blue) in the unmodified slag (top picture). The target element will be difficult to isolate due to its occurrence in many different phases. The goal in EnAM is to concentrate the target element in a single phase (red pentagon, bottom picture) that differs physically and chemically from the other phases (green hexagon), and allows for efficient separation and further treatment.
Separation of artificial minerals, enriched in valuable elements from remaining slag components, might be carried out by flotation processes. Here, the composition and structure of phases are crucial. It can be expected that none of the artificially produced minerals will show hydrophobic behavior by nature. Thus, the mineral-collector-interaction has to be studied, and this interaction relies strongly on crystal structure and ions, responsible for the adsorption of the active group of collector molecules.
The recovery of Li from slags has been subject to several studies. Elwert et al. [
2] found that Li reacts with aluminum to form predominately large lithium aluminate (LiAlO
2) crystals. The aluminum binds Li from the melt uniformly in one phase at an early state of solidifying phase of the molten slag. The idiomorphic to hypidiomorphic lithium aluminate crystals can easily be separated from the matrix by flotation. Hence, lithium aluminate is a promising EnAM candidate. The recovery of Li from LiAlO
2 was successfully conducted by Haas et al. [
4]. Elwert et al. [
5] investigated a hydrometallurgical process to recover Li from slags with low aluminum compared to [
2] and enriched in silicone. However, it was found that the formation of LiAlO
2 is suppressed in manganese (Mn)-rich slags [
2]. In these slags, Li is distributed over several phases of low crystallinity. Elements like Mn seem to have a significant influence on the formation of compounds and grain size during the formation of the slag. Due to the increasing amount of Li-ion batteries with Mn-based cathode materials, i.e., Li-Ni
xMn
yCo
zO
2 (NMC), it must be assumed that the Mn content in battery waste streams will increase soon. Accordingly, it is necessary to understand the role of the redox-active Mn on the genesis of crystalline, and especially amorphous grains from the ionic melts. A careful characterization of the Mn-bearing grains will give insight into these processes. The first survey with mineralogical and thermodynamic methods on the formation of Li-EnAMs was conducted by Schirmer et al. [
6] on a similar system, but without Mn. Their study shows that formation of spinel solid solutions is a favorable reaction with a thermodynamically proved potential to scavange Li from the slag in an early stage of the solidification. Adding Mn to this system would result in more complex solidification reactions with Mn-containing spinel solid solutions in particular, as numerous spinel-like oxides of Li and Mn are already described [
7].
Therefore, in this study, Li- and Mn-bearing phases from a synthetic slag, in the following termed mock-up slag (MUS), of the system Li2O-CaO-SiO2-Al2O3-MgO-MnOx, with up to 17 mol% MnO2-content, are studied. The crystalline components are determined by powder X-ray diffraction (PXRD). The main Mn-containing phase could be identified as an oxide solid solution of spinel-type using electron probe microanalysis (EPMA). From a combination of the virtual compounds LiMnO2, Mn0.5AlO2 (1/2 galaxite spinel) and Mn0.5MnO2 (1/2 hausmannite), the formula (Li(2x)Mn2+(1−x))1+x(Al(2−z),Mn3+z)O4 was calculated. This matches with the PXRD results, as all main reflections of the oxides are located between those of LiAl5O8 and MnAl2O4. The EPMA and PXRD analysis showed that a high amount of grains are amorphous or of low crystallinity. The PXRD falls short of giving insight into the Mn species in amorphous phases. EPMA allows recognizing individual crystalline and amorphous phases. For amorphous phases, however, stoichiometric information can usually not be extracted from the data. Hence, laboratory-based X-ray absorption near edge structure (XANES) is applied here to determine the bulk Mn species of the crystalline and the amorphous components of the slag. The findings from this independent method confirmed the Mn oxidation state as being between +2 and +3, as well as the presence of Mn spinel structures.
5. Discussion
The experimental investigation of the influence of Mn on the solidification, and especially on the formation of the EnAM LiAlO2 in slags of the six-component oxide system (Li, Mg, Al, Si, Ca and Mn) is crucial to understand. This is also indispensable for the phase relations, as well as the reactions in this complex system. It will also help to predict the slag composition and improve thermodynamic modeling. Slags, unlike most geological features, are formed on a short timescale and with high cooling rates. Hence, non-equilibrium thermodynamic modeling will have to be consulted to develop a route to create the desired EnAM.
In contrast to the other elements in this system, Mn is redox-sensitive, occurring in several oxidation states ranging from +2 to +7. Due to the moderate to high oxygen fugacity in the slag, the expected oxidation numbers are +2, +3 and +4, and mixtures thereof. The purpose of this research was to study the suppression of LiAlO2 formation in Mn-rich Li-ion battery recycling slags. The determination of the Mn-species, including the oxidation state formed in slags, is key to understanding this phenomenon.
Investigations with PXRD and EPMA on Mn-rich MUS reveal that besides LiAl and GCAS, the melt contains large grains of Al/Mn-rich oxides. The PXRD results show that these oxides can be best described as spinel-like compounds. The diffractograms exhibit reflections in the range of the main (311) diffraction line of the spinel-structures MnAl
2O
4 (galaxite), Li
1−xMn
2O
4, Li
2Mn
2O
4 and LiAl
5O
8 (
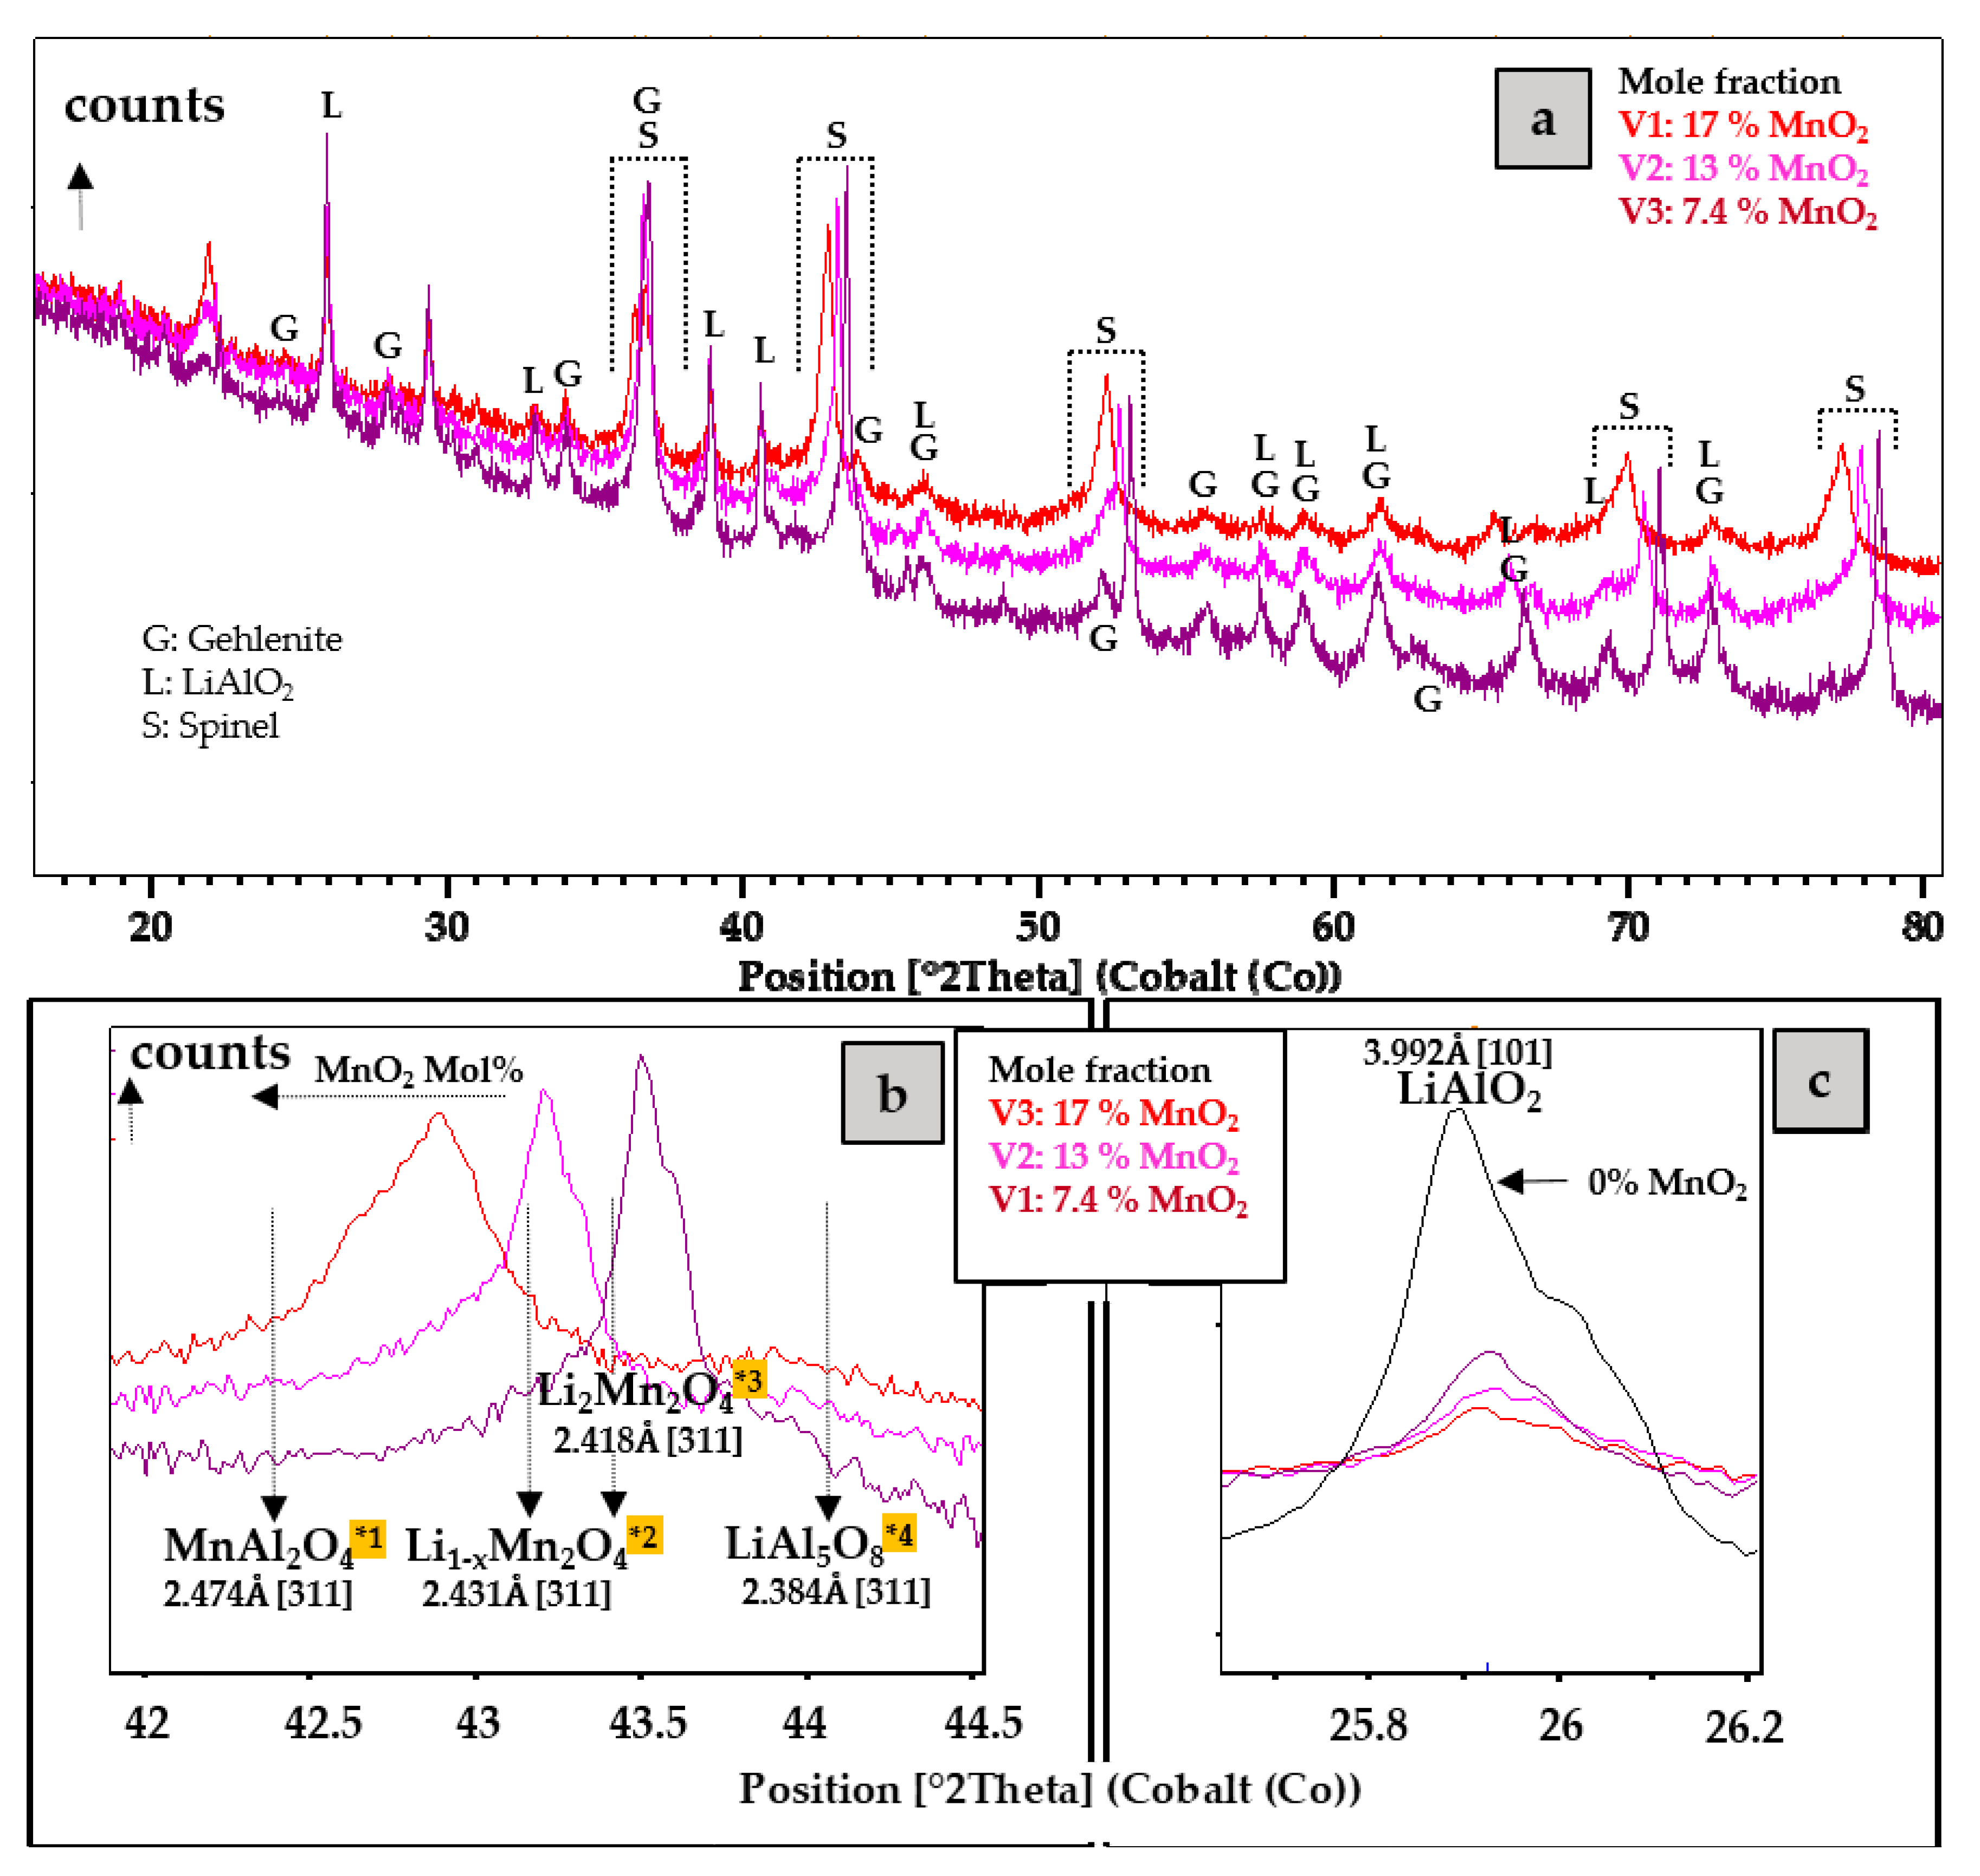
Figure 4). Due to the non-direct matching of these diffraction lines, the best explanation is a spinel solid solution with the elements Li, Al and Mn. With increasing Mn concentration within the melt experiments MUS V-1 to V-3, there is a shift of the diffraction reflection towards galaxite, indicating that the galaxite component is increasing.
The amount of LiAlO
2 seems to be suppressed compared to an Mn-free melt with similar Li-concentration (
Figure 4c, black line). Due to the high peak to background ratio, a comparable high amount of amorphous phase can be assumed.
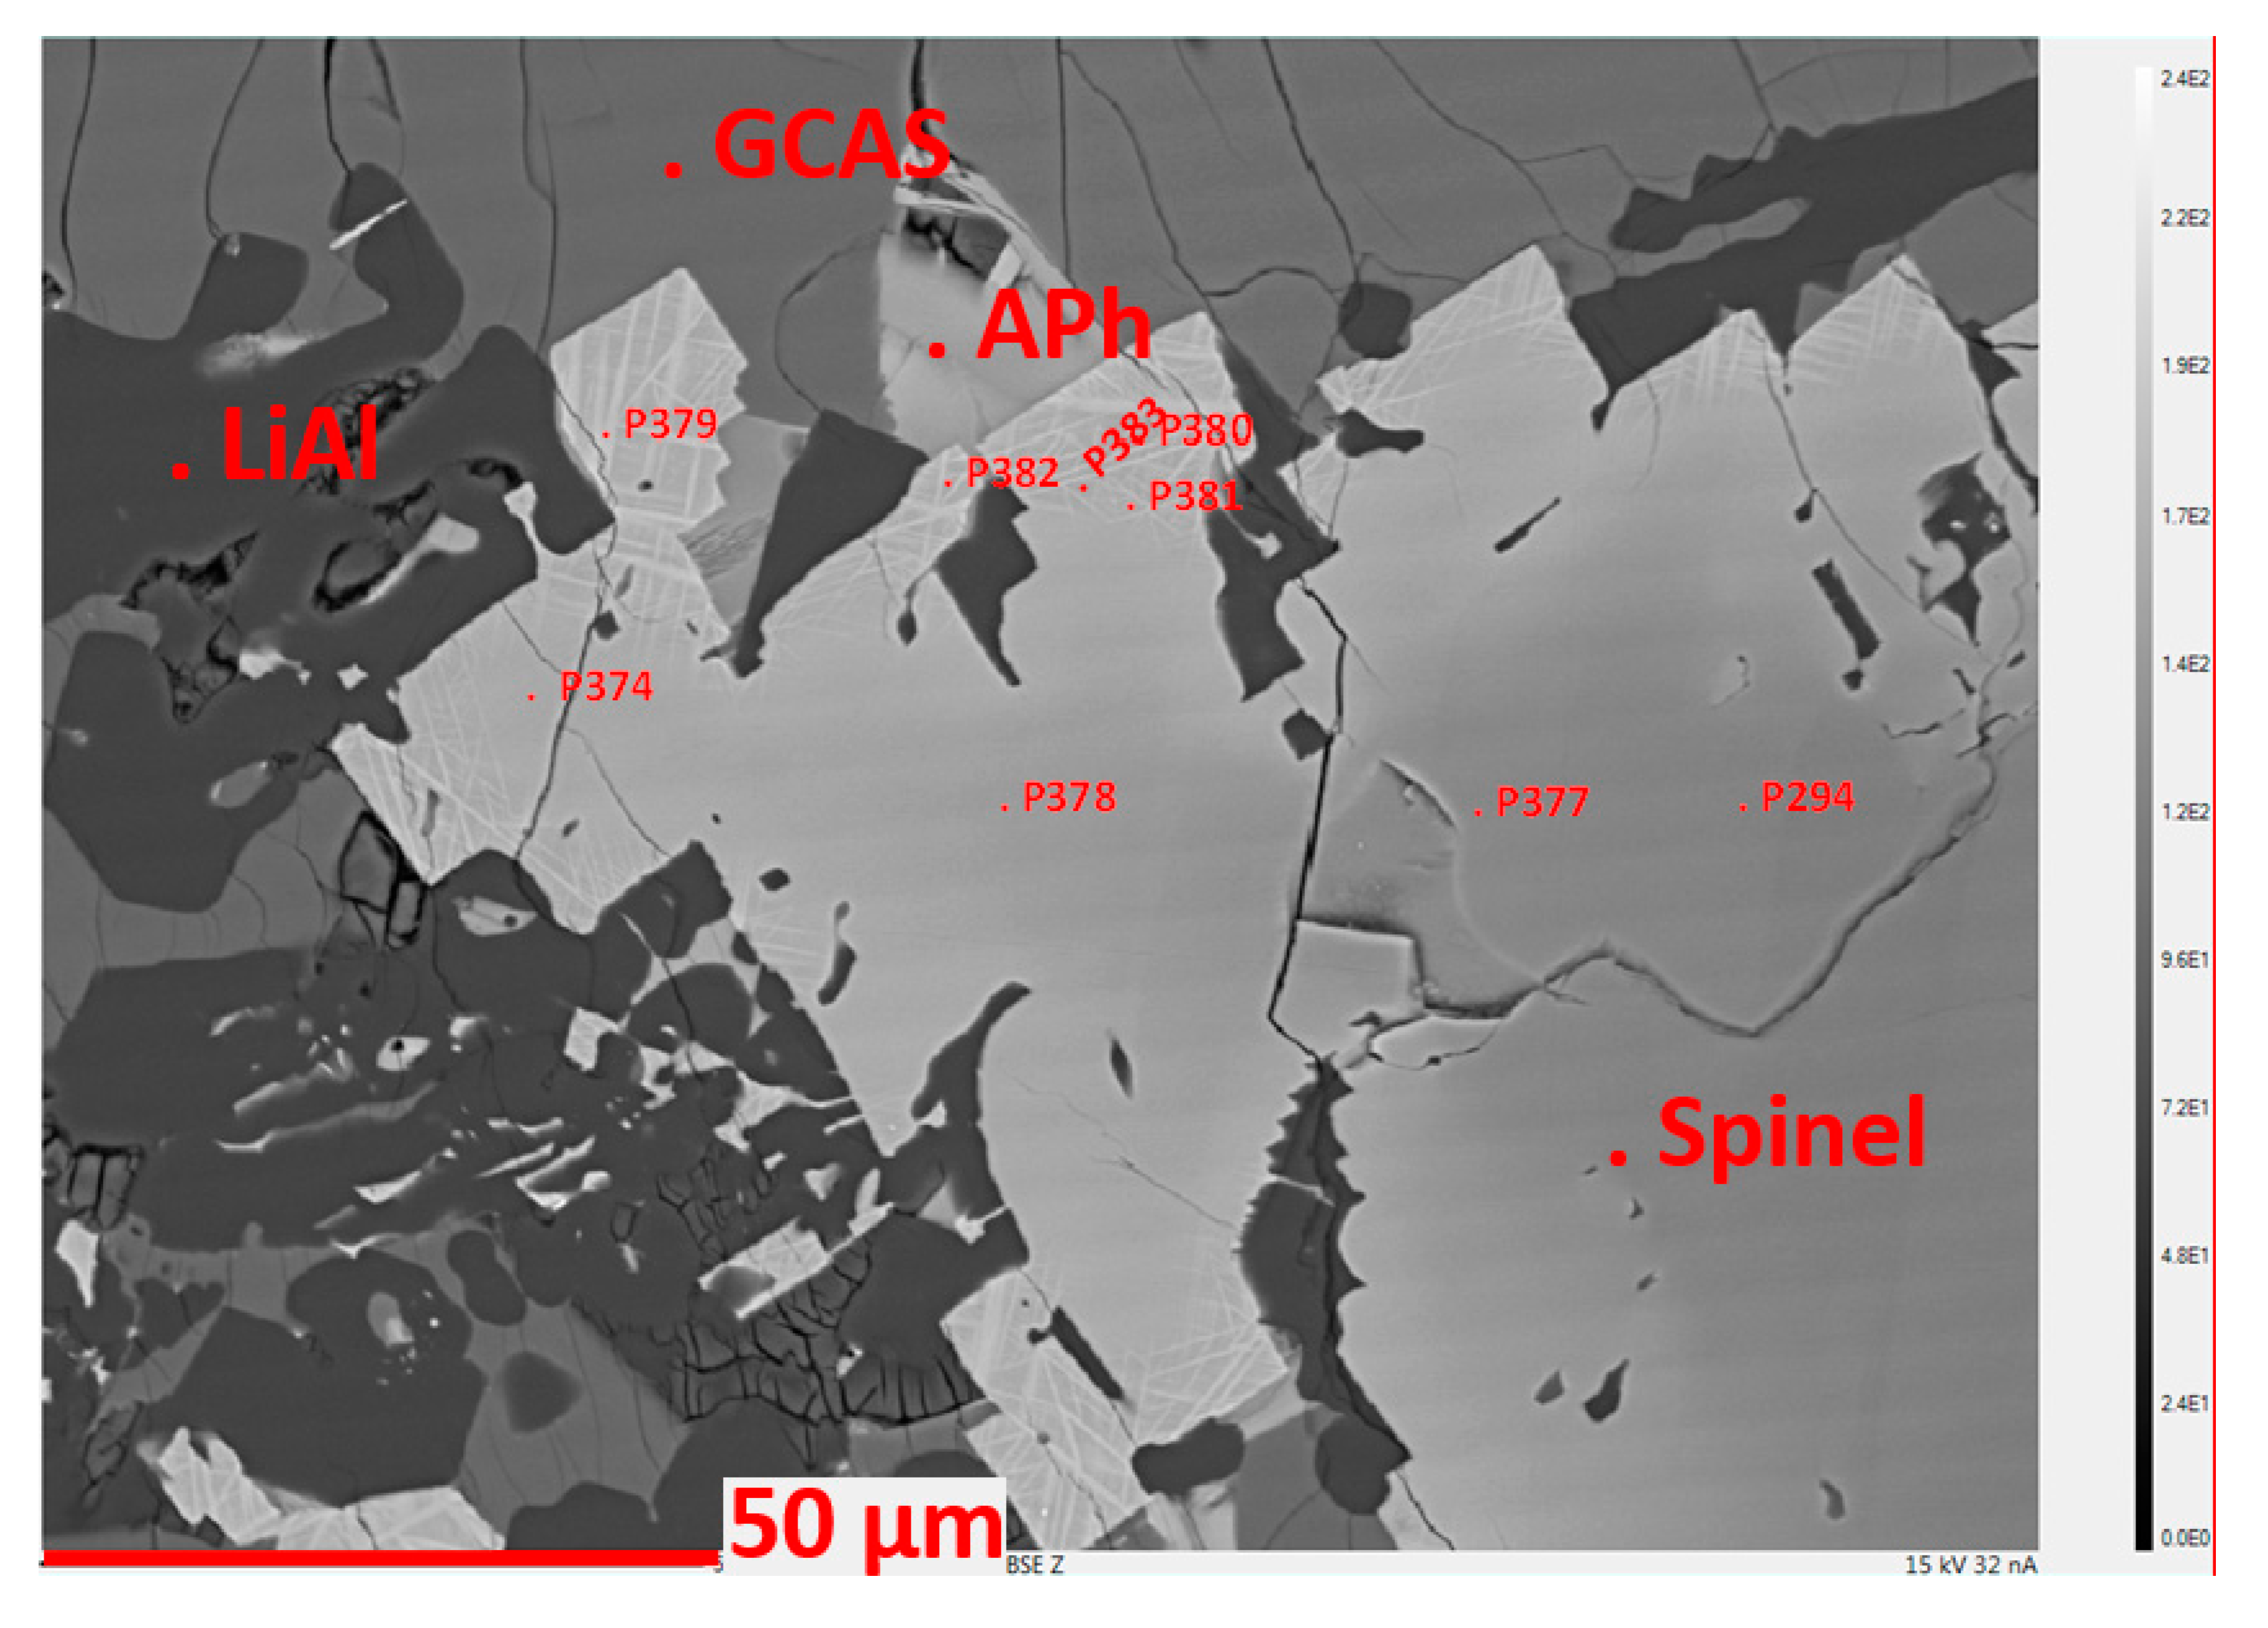
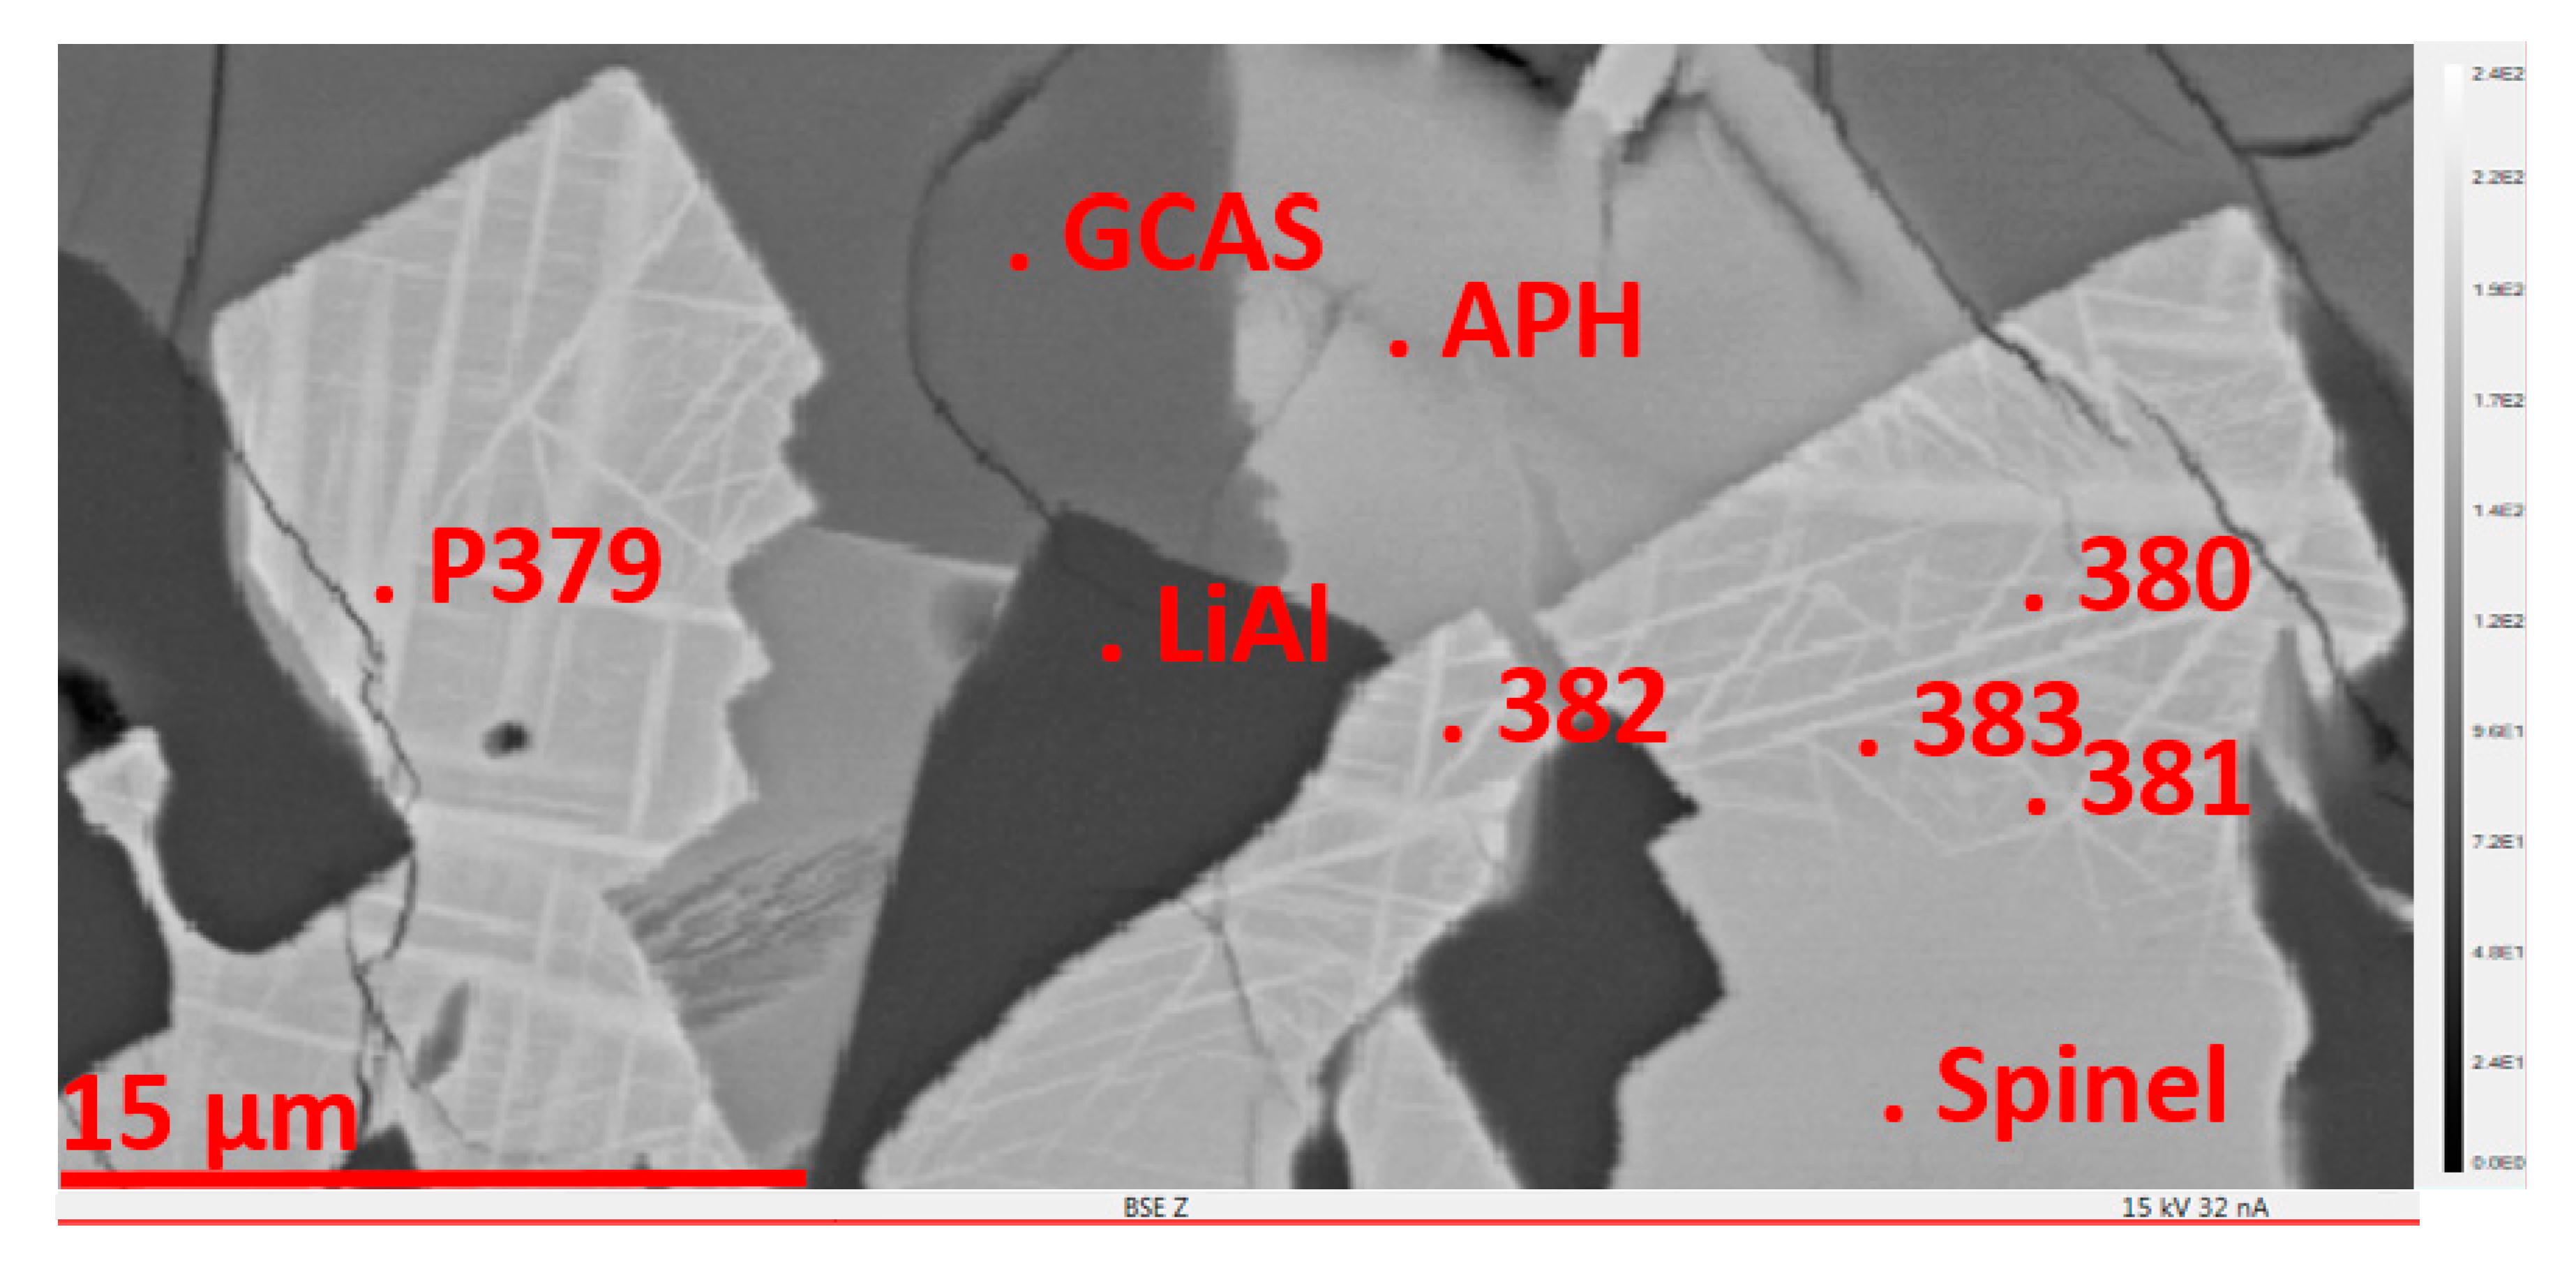
The BSE(Z) micrograph observations show large idiomorphous Mn-rich grains (example see:
Figure 5), suggesting an early and complex crystallization scenario. EPMA point scan analyses (
Table 3) show a distinct decrease in the aluminum concentration from the center to the rim of the predominant Mn-rich crystals. At the edge, the aluminum concentration drops nearly to zero. Additionally, there is a split into two components, one relatively Mn-enriched and one relatively Mn-depleted. If the composition of all measurements is calculated as fractions of the virtual compounds Mn
0.5AlO
2 (½ galaxite), LiMnO
2 and Mn
0.5MnO
2 (½ hausmannite) a general formula (Li
(2x)Mn
2+(1−x))
1+x(Al
(2−z),Mn
3+z)O
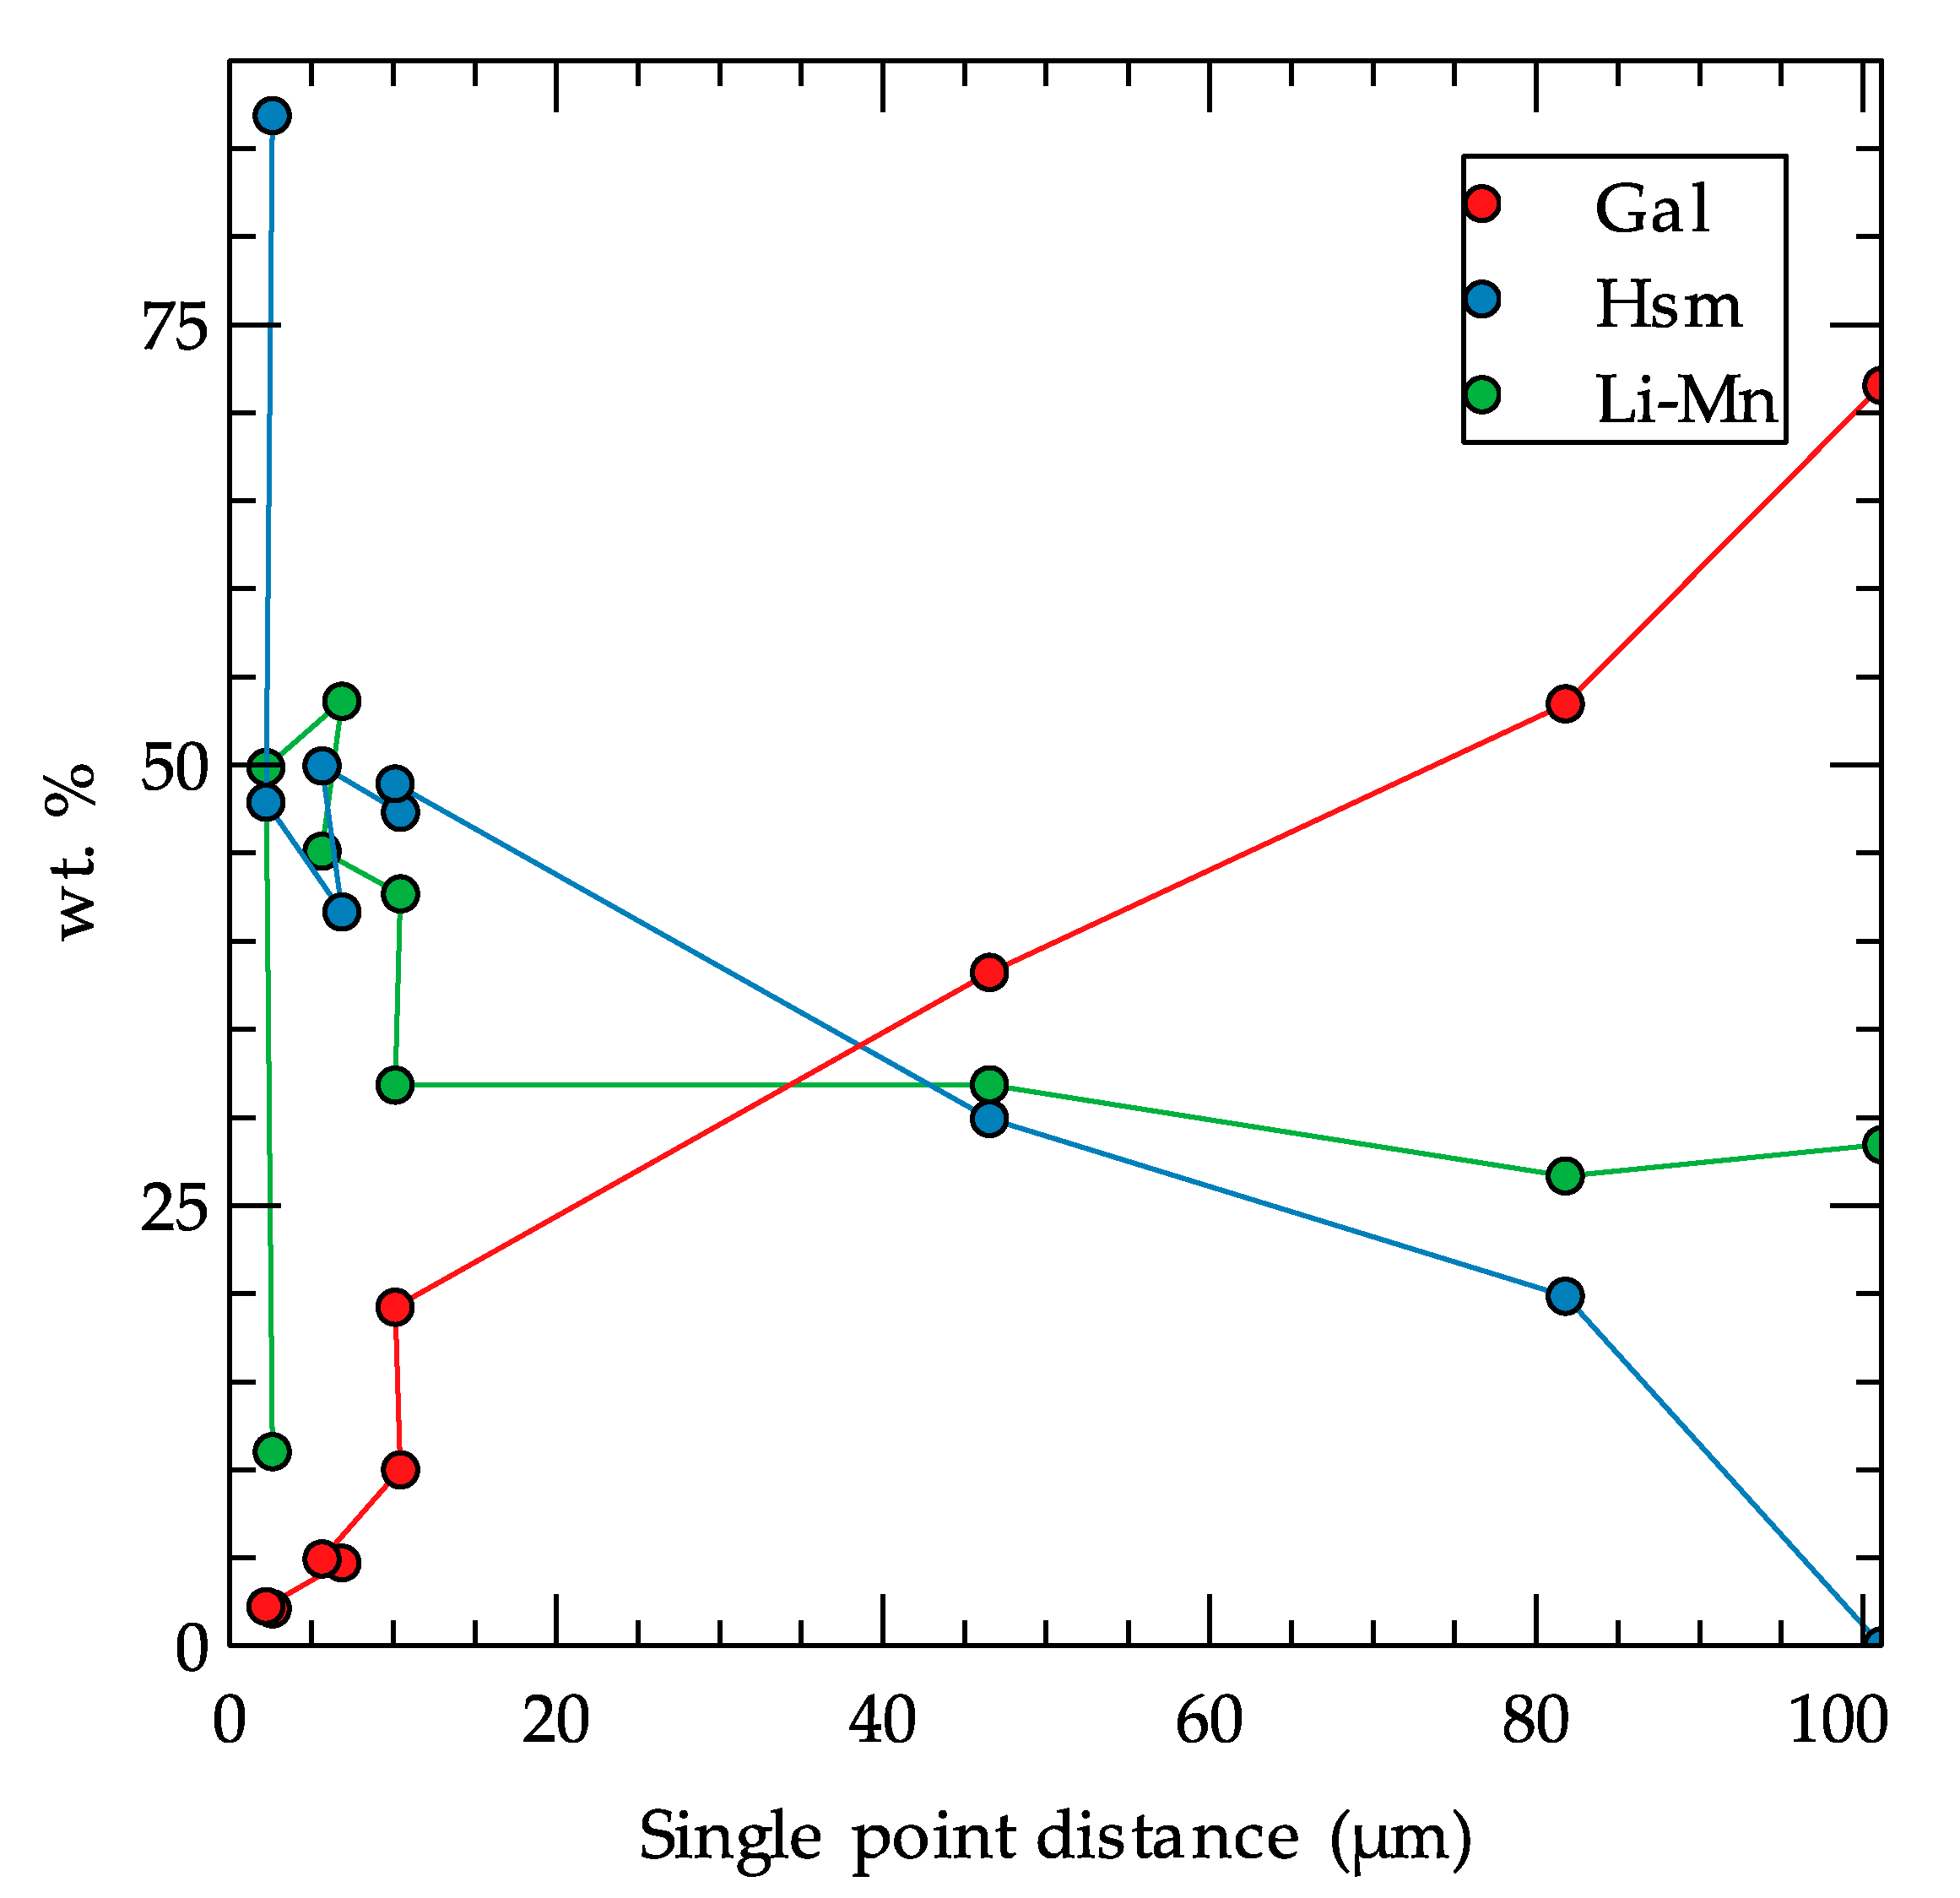
4 can be calculated. From this calculation, a Li-content is derived and used to assess a gradient of the Li-bearing compounds. In accordance with the elemental gradients, a constant decrease of the galaxite fraction from the center to the rim is observed. In contrast, the hausmannite fraction is increasing. The Li-Mn compound fraction stays more or less constant except for a steep increase at the last ~10 µm from the rim. Directly at the rim, a split into a “normal” and a Mn
0.5MnO
2-dominated region can be observed. The increase and decrease of the individual species over the point scans are shown in
Figure 11.
This observation indicates that from the beginning to the end of the crystallization, Li is incorporated into the spinel structure. The spinel composition itself changes from a galaxite-dominated to hausmannite-dominated chemistry. Directly at the rim, the oversaturation of the melt with Mn is such that the spinel solid solution segregates (most probably during cooling down to room temperature) to form two different (most probably spinel-like) oxides.
In this respect, it is interesting that at lower temperatures, the hausmannite converts to the tetragonal crystal system with low solubility of the spinel compound galaxite as reported by Chatterjee et al. [
9]. This could indicate an exsolution of the hausmannite component due to crystal lattice incompatibility. The hypothesis is backed by the results from the Mn K-edge analysis, which suggests a mixture of galaxite and Mn
2+, Mn
3+ oxide spinels. The virtual Li compound would mix into the cubic galaxite-like spinel phase.
By combining the above results, a scenario of the large crystal genesis is established. The crystallization starts with a high aluminum galaxite-like composition that is subsequently enriched in Mn during the crystal growth. At the end of the crystallization, the solid solution becomes unstable, indicated by exsolution whiskers with a higher mean atomic number, surrounded by the massive crystal.
Author Contributions
A.W. conceived the paper. A.W., U.E.A.F. and T.S. conducted the literature review. All melting experiments were designed and performed by H.Q. and D.G. The chemical bulk analysis was executed by the analysis laboratory of the Institute of Mineral and Waste Processing. The phase analysis (PXRD) and the mineralogical investigation (EPMA) were conducted by T.S. The speciation analysis with XANES and interpretation of the spectra was conducted by A.W. and U.E.A.F. Interpretation, discussion and conceptualization were conducted by all authors. All authors have read and agreed to the published version of the manuscript.
Funding
This research was funded by the Clausthal University of Technology in the course of a joint research project, “Engineering and Processing of Artificial Minerals for an Advanced Circular Economy Approach for Finely Dispersed Critical Elements” (EnAM).
Acknowledgments
We acknowledge support by Open Access Publishing Fund of Clausthal University of Technology. We thank Jörg Wittrock from the Institute of Inorganic and Analytical Chemistry for the idea and implementation of the galaxite synthesis. We thank Joanna Kolny-Olesiak for discussions and proofreading.
Conflicts of Interest
The authors declare no conflict of interest. The funders had no role in the design of the study, in the collection, analyses, or interpretation of data, in the writing of the manuscript, or in the decision to publish the results.
References
- Jaskula, B.W. Lithium. Available online: https://pubs.usgs.gov/periodicals/mcs2020/mcs2020-lithium.pdf (accessed on 15 December 2020).
- Elwert, T.; Strauss, K.; Schirmer, T.; Goldmann, D. Phase composition of high lithium slags from the recycling of lithium ion batteries. World Metall. -Erzmetall 2012, 65, 163–171. [Google Scholar]
- Velázquez-Martínez, O.; Valio, J.; Santasalo-Aarnio, A.; Reuter, M.; Serna-Guerrero, R. A Critical Review of Lithium-Ion Battery Recycling Processes from a Circular Economy Perspective. Batteries 2019, 5, 68. [Google Scholar] [CrossRef] [Green Version]
- Haas, A.; Elwert, T.; Goldmann, D.; Schirmer, T. Challenges and research needs in flotation of synthetic metal phases: EMPRC 06/25-06/26/2018. In Proceedings of the European Mineral Processing & Recycling Congress, Essen, Germany, 25–26 June 2018; EMPRC, 2018. GDMB Verlag GmbH: Clausthal-Zellerfeld, Germany, 2018. ISBN 978-3-940276-84-1. [Google Scholar]
- Elwert, T.; Goldmann, D.; Schirmer, T.; Strauss, K. Recycling von Li-Ionen-Traktionsbatterien; Recycling und Rohstoffe: Neuruppin, Germany, 2012; pp. 679–690. [Google Scholar]
- Schirmer, T.; Qiu, H.; Li, H.; Goldmann, D.; Fischlschweiger, M. Li-Distribution in Compounds of the Li2O-MgO-Al2O3-SiO2-CaO System—A First Survey. Metals 2020, 10, 1633. [Google Scholar] [CrossRef]
- Paulsen, J.M.; Dahn, J.R. Phase Diagram of Li–Mn–O Spinel in Air. Chem. Mater. 1999, 11, 3065–3079. [Google Scholar] [CrossRef]
- Konar, B.; van Ende, M.-A.; Jung, I.-H. Critical Evaluation and Thermodynamic Optimization of the Li2O-Al2O3 and Li2O-MgO-Al2O3 Systems. Met. Mater. Trans. B 2018, 49, 2917–2944. [Google Scholar] [CrossRef]
- Chatterjee, S.; Jung, I.-H. Critical evaluation and thermodynamic modeling of the Al–Mn–O (Al2O3–MnO–Mn2O3) system. J. Eur. Ceram. Soc. 2014, 34, 1611–1621. [Google Scholar] [CrossRef]
- Asaoka, S.; Okamura, H.; Akita, Y.; Nakano, K.; Nakamoto, K.; Hino, K.; Saito, T.; Hayakawa, S.; Katayama, M.; Inada, Y. Regeneration of manganese oxide as adsorption sites for hydrogen sulfide on granulated coal ash. Chem. Eng. J. 2014, 254, 531–537. [Google Scholar] [CrossRef] [Green Version]
- Kim, K.; Asaoka, S.; Yamamoto, T.; Hayakawa, S.; Takeda, K.; Katayama, M.; Onoue, T. Mechanisms of hydrogen sulfide removal with steel making slag. Environ. Sci. Technol. 2012, 46, 10169–10174. [Google Scholar] [CrossRef]
- Seidler, G.T.; Mortensen, D.R.; Remesnik, A.J.; Pacold, J.I.; Ball, N.A.; Barry, N.; Styczinski, M.; Hoidn, O.R. A laboratory-based hard X-ray monochromator for high-resolution X-ray emission spectroscopy and X-ray absorption near edge structure measurements. Rev. Sci. Instrum. 2014, 85, 113906. [Google Scholar] [CrossRef]
- Seidler, G.T.; Mortensen, D.R.; Ditter, A.S.; Ball, N.A.; Remesnik, A.J. A Modern Laboratory XAFS Cookbook. J. Phys. Conf. Ser. 2016, 712, 12015. [Google Scholar] [CrossRef]
- Le, H.V.; Parishan, S.; Sagaltchik, A.; Göbel, C.; Schlesiger, C.; Malzer, W.; Trunschke, A.; Schomäcker, R.; Thomas, A. Solid-State Ion-Exchanged Cu/Mordenite Catalysts for the Direct Conversion of Methane to Methanol. ACS Catal. 2017, 7, 1403–1412. [Google Scholar] [CrossRef]
- Dimitrakopoulou, M.; Huang, X.; Kröhnert, J.; Teschner, D.; Praetz, S.; Schlesiger, C.; Malzer, W.; Janke, C.; Schwab, E.; Rosowski, F.; et al. Insights into structure and dynamics of (Mn, Fe)Ox-promoted Rh nanoparticles. Faraday Discuss. 2018, 208, 207–225. [Google Scholar] [CrossRef] [Green Version]
- Lutz, C.; Fittschen, U.E.A. Laboratory XANES to study vanadium species in vanadium redox flow batteries. Powder Diffr. 2020, 1–5. [Google Scholar] [CrossRef]
- Gates-Rector, S.; Blanton, T. The Powder Diffraction File: A quality materials characterization database. Powder Diffr. 2019, 34, 352–360. [Google Scholar] [CrossRef] [Green Version]
- Downs, R.T.; Hall-Wallace, M. The American Mineralogist crystal structure database. Am. Mineral. 2003, 88, 247–250. [Google Scholar]
- Lafuente, B.; Downs, R.T.; Yang, H.; Stone, N. The power of databases: The RRUFF project. In Highlights in Mineralogical Crystallography; Walter de Gruyter GmbH: Berlin, Germany, 2015; pp. 1–30. [Google Scholar] [CrossRef]
- Jercinovic, M.J.; Williams, M.L.; Allaz, J.; Donovan, J.J. Trace analysis in EPMA. IOP Conf. Ser. Mater. Sci. Eng. 2012, 32, 12012. [Google Scholar] [CrossRef]
- Merlet, C. Quantitative Electron Probe Microanalysis: New Accurate Φ (ρz) Description. Mikrochim. Acta 1992, 12, 107–115. [Google Scholar] [CrossRef]
- Jahrman, E.P.; Holden, W.M.; Ditter, A.S.; Mortensen, D.R.; Seidler, G.T.; Fister, T.T.; Kozimor, S.A.; Piper, L.F.J.; Rana, J.; Hyatt, N.C.; et al. An improved laboratory-based X-ray absorption fine structure and X-ray emission spectrometer for analytical applications in materials chemistry research. Rev. Sci. Instrum. 2019, 90, 24106. [Google Scholar] [CrossRef] [Green Version]
- easyXAFS, LLC. easyXES100-Extended Executable Progra, Object Files, Documentation, and Source Code; easyXAFS, LLC: Seattle, WA, USA, 2018. [Google Scholar]
- Asakura, K.; Abe, H.; Kimura, M. The challenge of constructing an international XAFS database. J. Synchrotron Radiat. 2018, 25, 967–971. [Google Scholar] [CrossRef]
- Itoh, T. K_MnO2_Si111_20110423. Available online: https://www.cat.hokudai.ac.jp/catdb/index.php?action=xafs_dbinpbrowsedetail&opnid=2&resid=22&r=32 (accessed on 30 November 2020).
- Ravel, B.; Newville, M. ATHENA, ARTEMIS, HEPHAESTUS: Data analysis for X-ray absorption spectroscopy using IFEFFIT. J. Synchrotron Radiat. 2005, 12, 537–541. [Google Scholar] [CrossRef] [Green Version]
- De Vries, A.H.; Hozoi, L.; Broer, R. Origin of the chemical shift in X-ray absorption near-edge spectroscopy at the MnK-edge in manganese oxide compounds. Int. J. Quantum Chem. 2003, 91, 57–61. [Google Scholar] [CrossRef]
Figure 1.
Sketch of engineered artificial minerals (EnAM) formation. On the left, different elements are shown in the liquid slag-matrix: target element (yellow triangle), phase for EnAM (red) and other phases (green). The upper route refers to an unmodified slag–the target element is spread over several different phases and the matrix (blue). The target element is not recovered. The bottom picture illustrates the formation of EnAM. The target element is concentrated in a single phase (red pentagon) that differs physically and chemically from the other phases (green hexagon), and allows for efficient separation and further treatment.
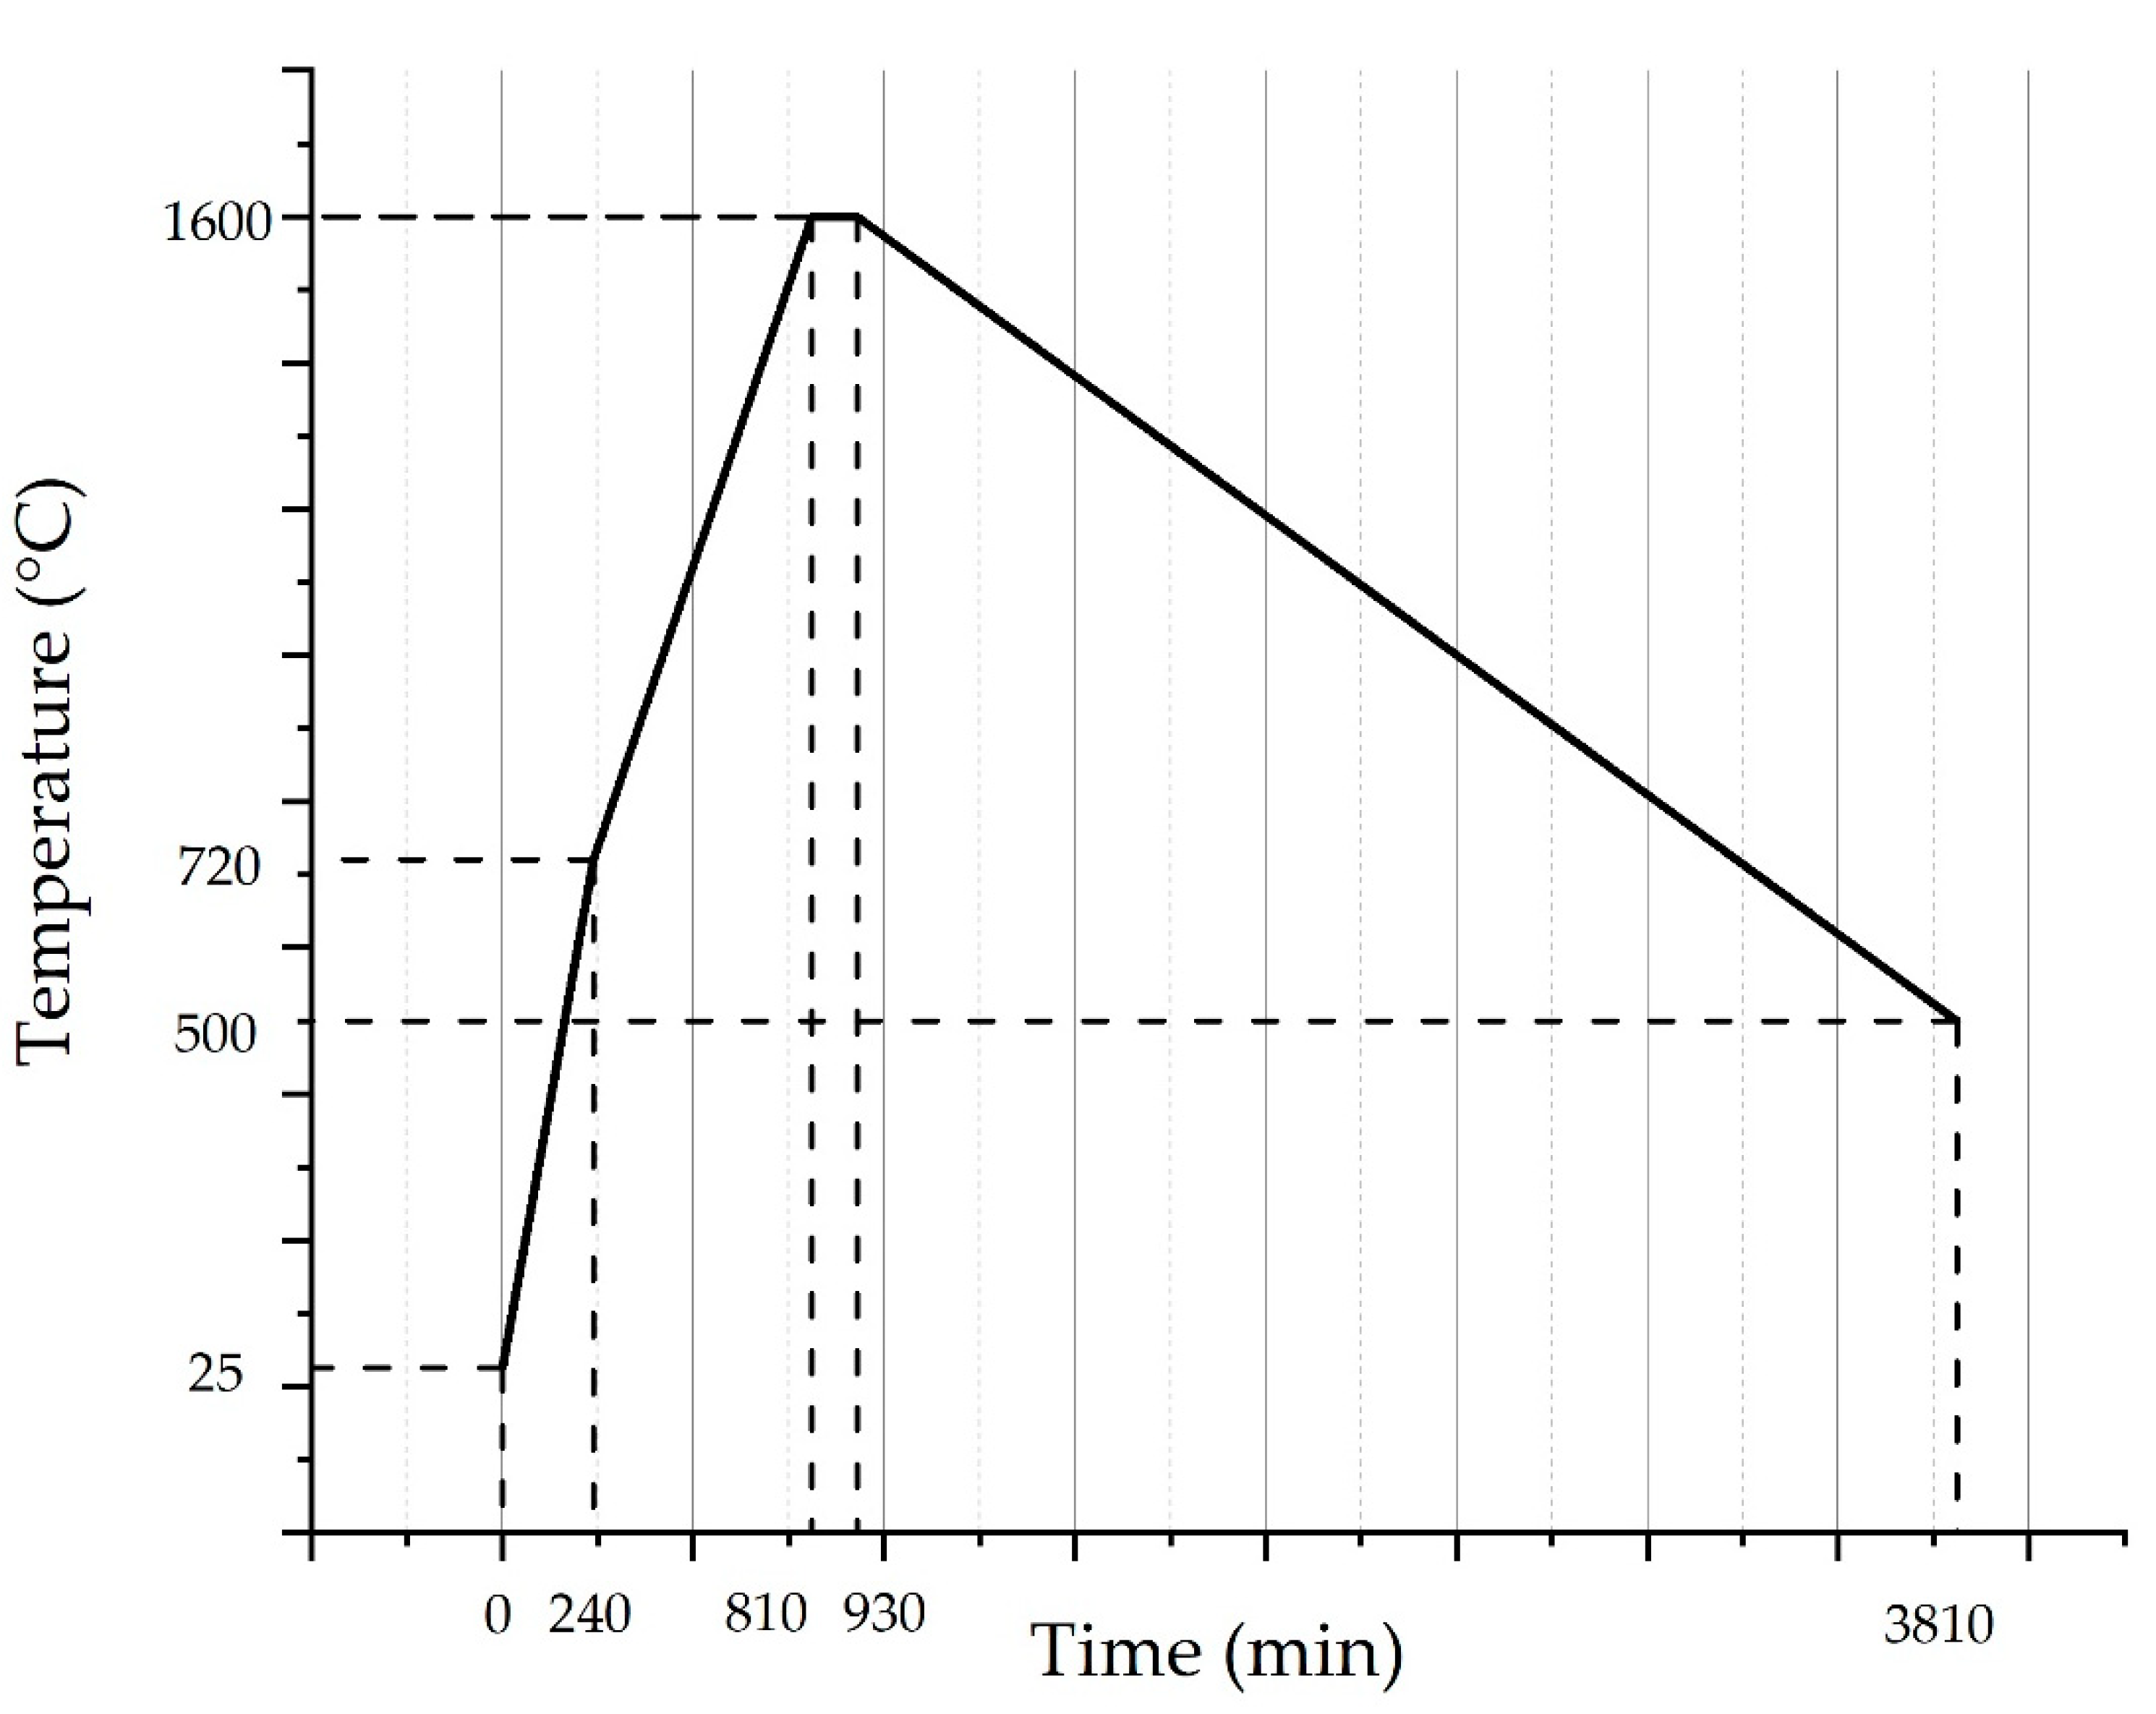
Figure 2.
Temperature program of the chamber furnace. A heating rate of 2.89 °C/min was employed to reach the melting temperature of Li2CO3 at 720 °C, followed by a heating rate of 1.54 °C to the target temperature of 1600 °C. The temperature was held for 120 min, and afterward, a cooling rate of 0.38 °C/min was employed to reach a temperature of 500 °C.
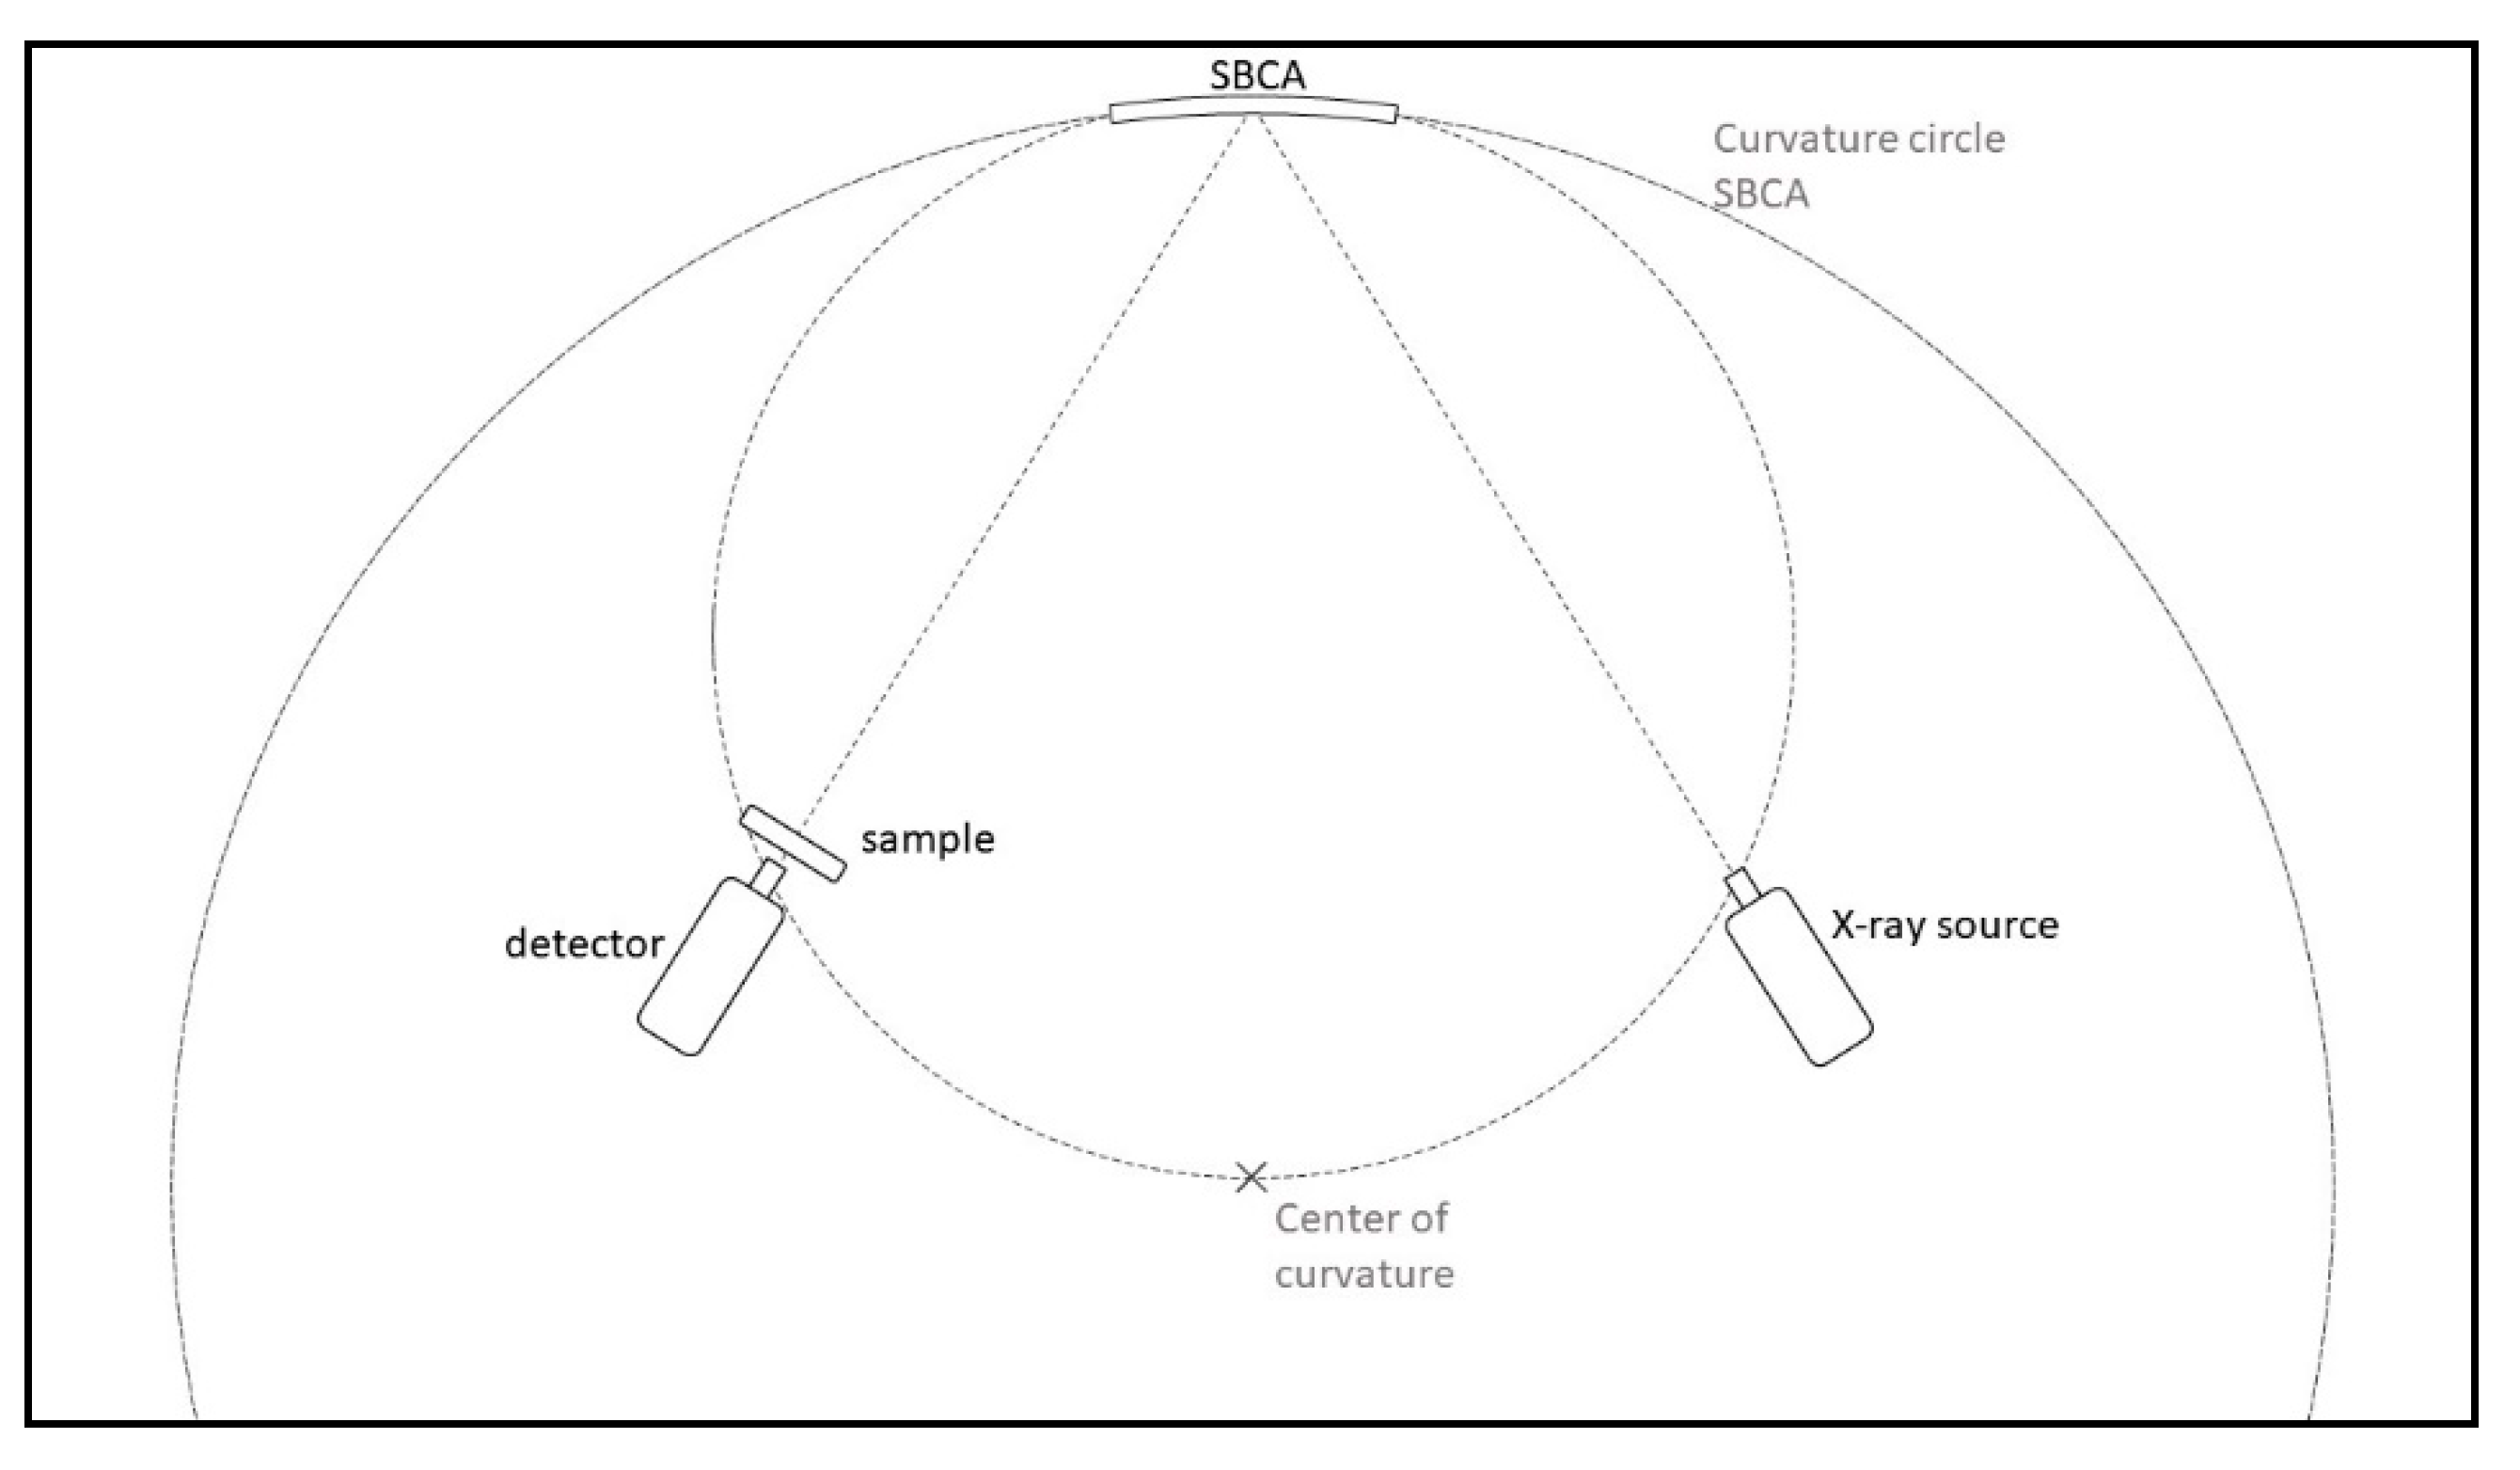
Figure 3.
Scheme of the Rowland circle monochromator. The outer circle represents the curvature of the SBCA. The inner circle has a diameter matching the radius of the curvature circle. On this inner circle, the X-ray source and the detector are positioned. The sample is positioned right in front of the detector. The components are set on a scissor drive, allowing fine energy scanning.
Figure 4.
(
a) Powder X-ray diffraction (PXRD) of the solidified melt. G: Gehlenite, S: Spinel, L: LiAlO
2. (
b): Enlarged section of the main spinel peak. * 1: the position of the main peak of MnAl
2O
4 from the ICDD-PDF2 no. 00-029-0880 [
17], * 2: the position of the main peak of the Li
(1−x)Mn
2O
4 spinel from the ICDD-PDF2 no. 00-038-07891 [
17], * 3: the position of the main peak of the Li
2Mn
2O
4 spinel from the ICDD-PDF2 no. 01-084-1524 [
17], * 4: the position of the main peak of the LiAl
5O
8 spinel from the ICDD-PDF2 no. 00-038-1425 [
17], (
c)
: Enlarged sections of the first two main LiAlO
2 peaks. In (
c): for comparison, the LiAlO
2 main reflection of an Mn-free solidified melt with comparable Li
2O content is presented.
Figure 5.
Electron micrograph (BSE(Z)) of the solidified melt. Light grey grain: spinel; dark gray sections, and dendrites: LiAl, surrounded by Ca-alumosilicate (GCAS, light grey sections); amorphous phases (APh): amorphous grain with unusual elements (K, Ba, Ti): contamination; black: pores or preparation damage. The chemical analysis of the points marked in red (P294–P383) is presented in
Table 3.
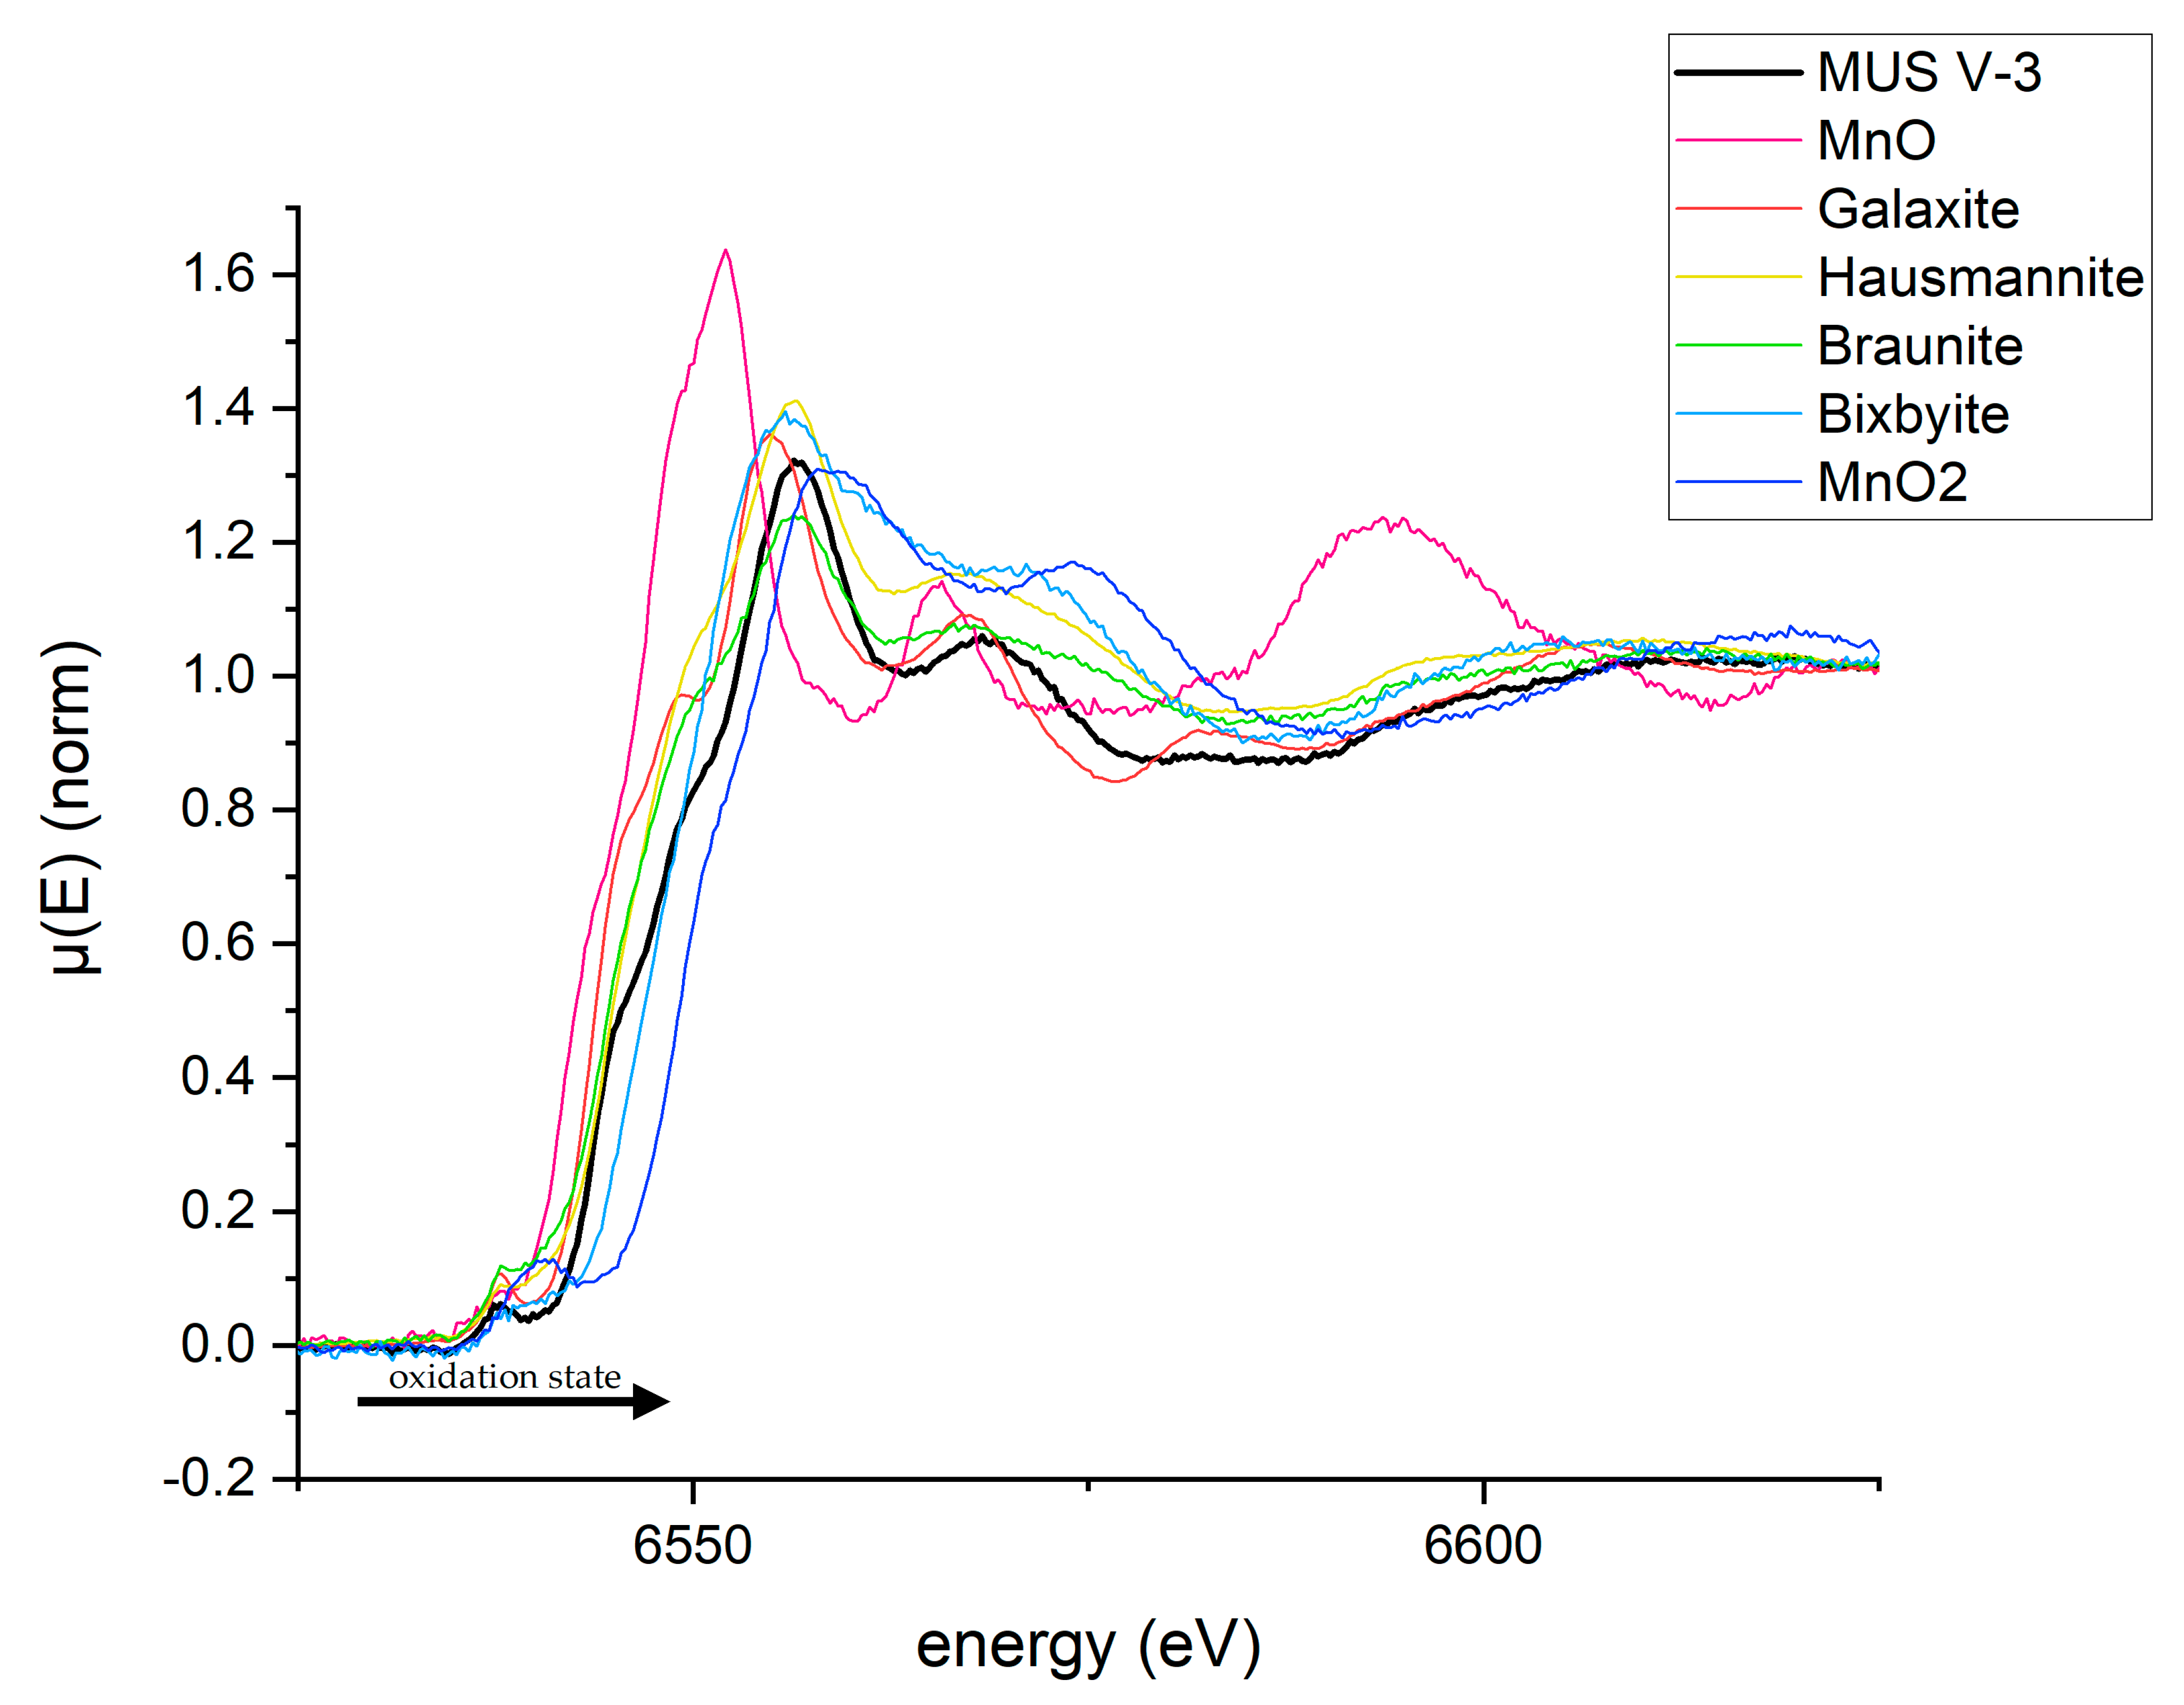
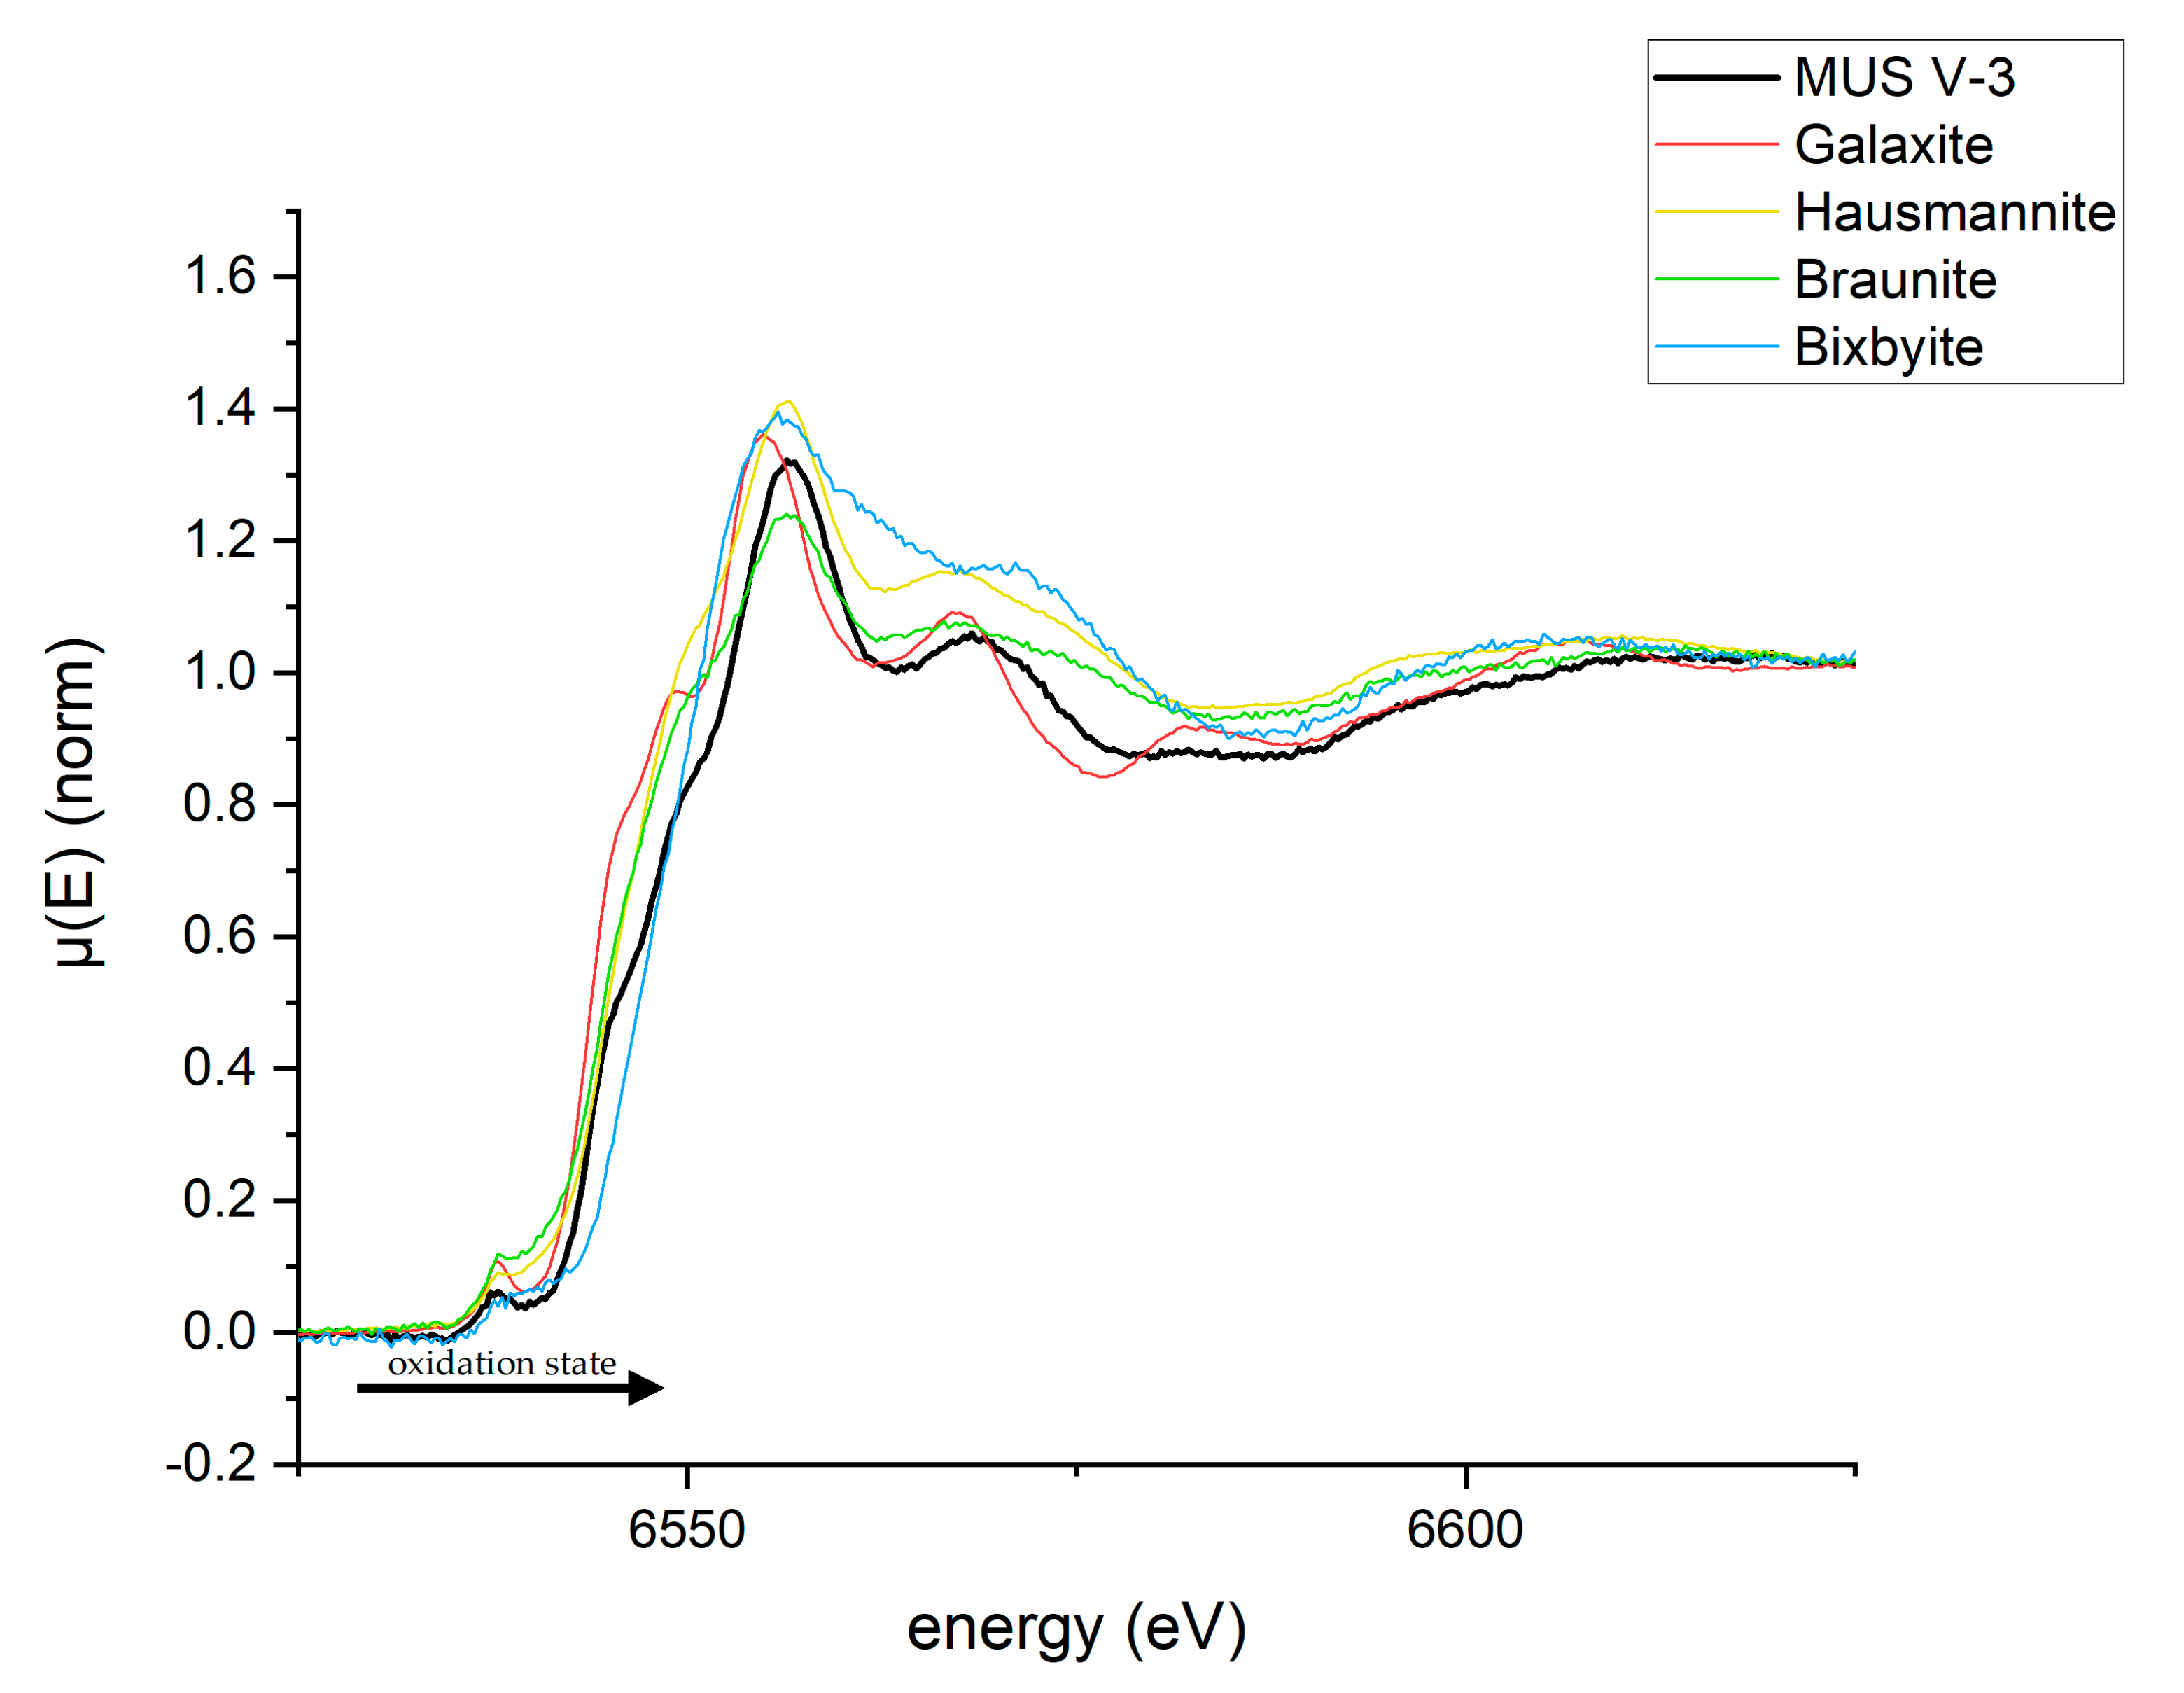
Figure 6.
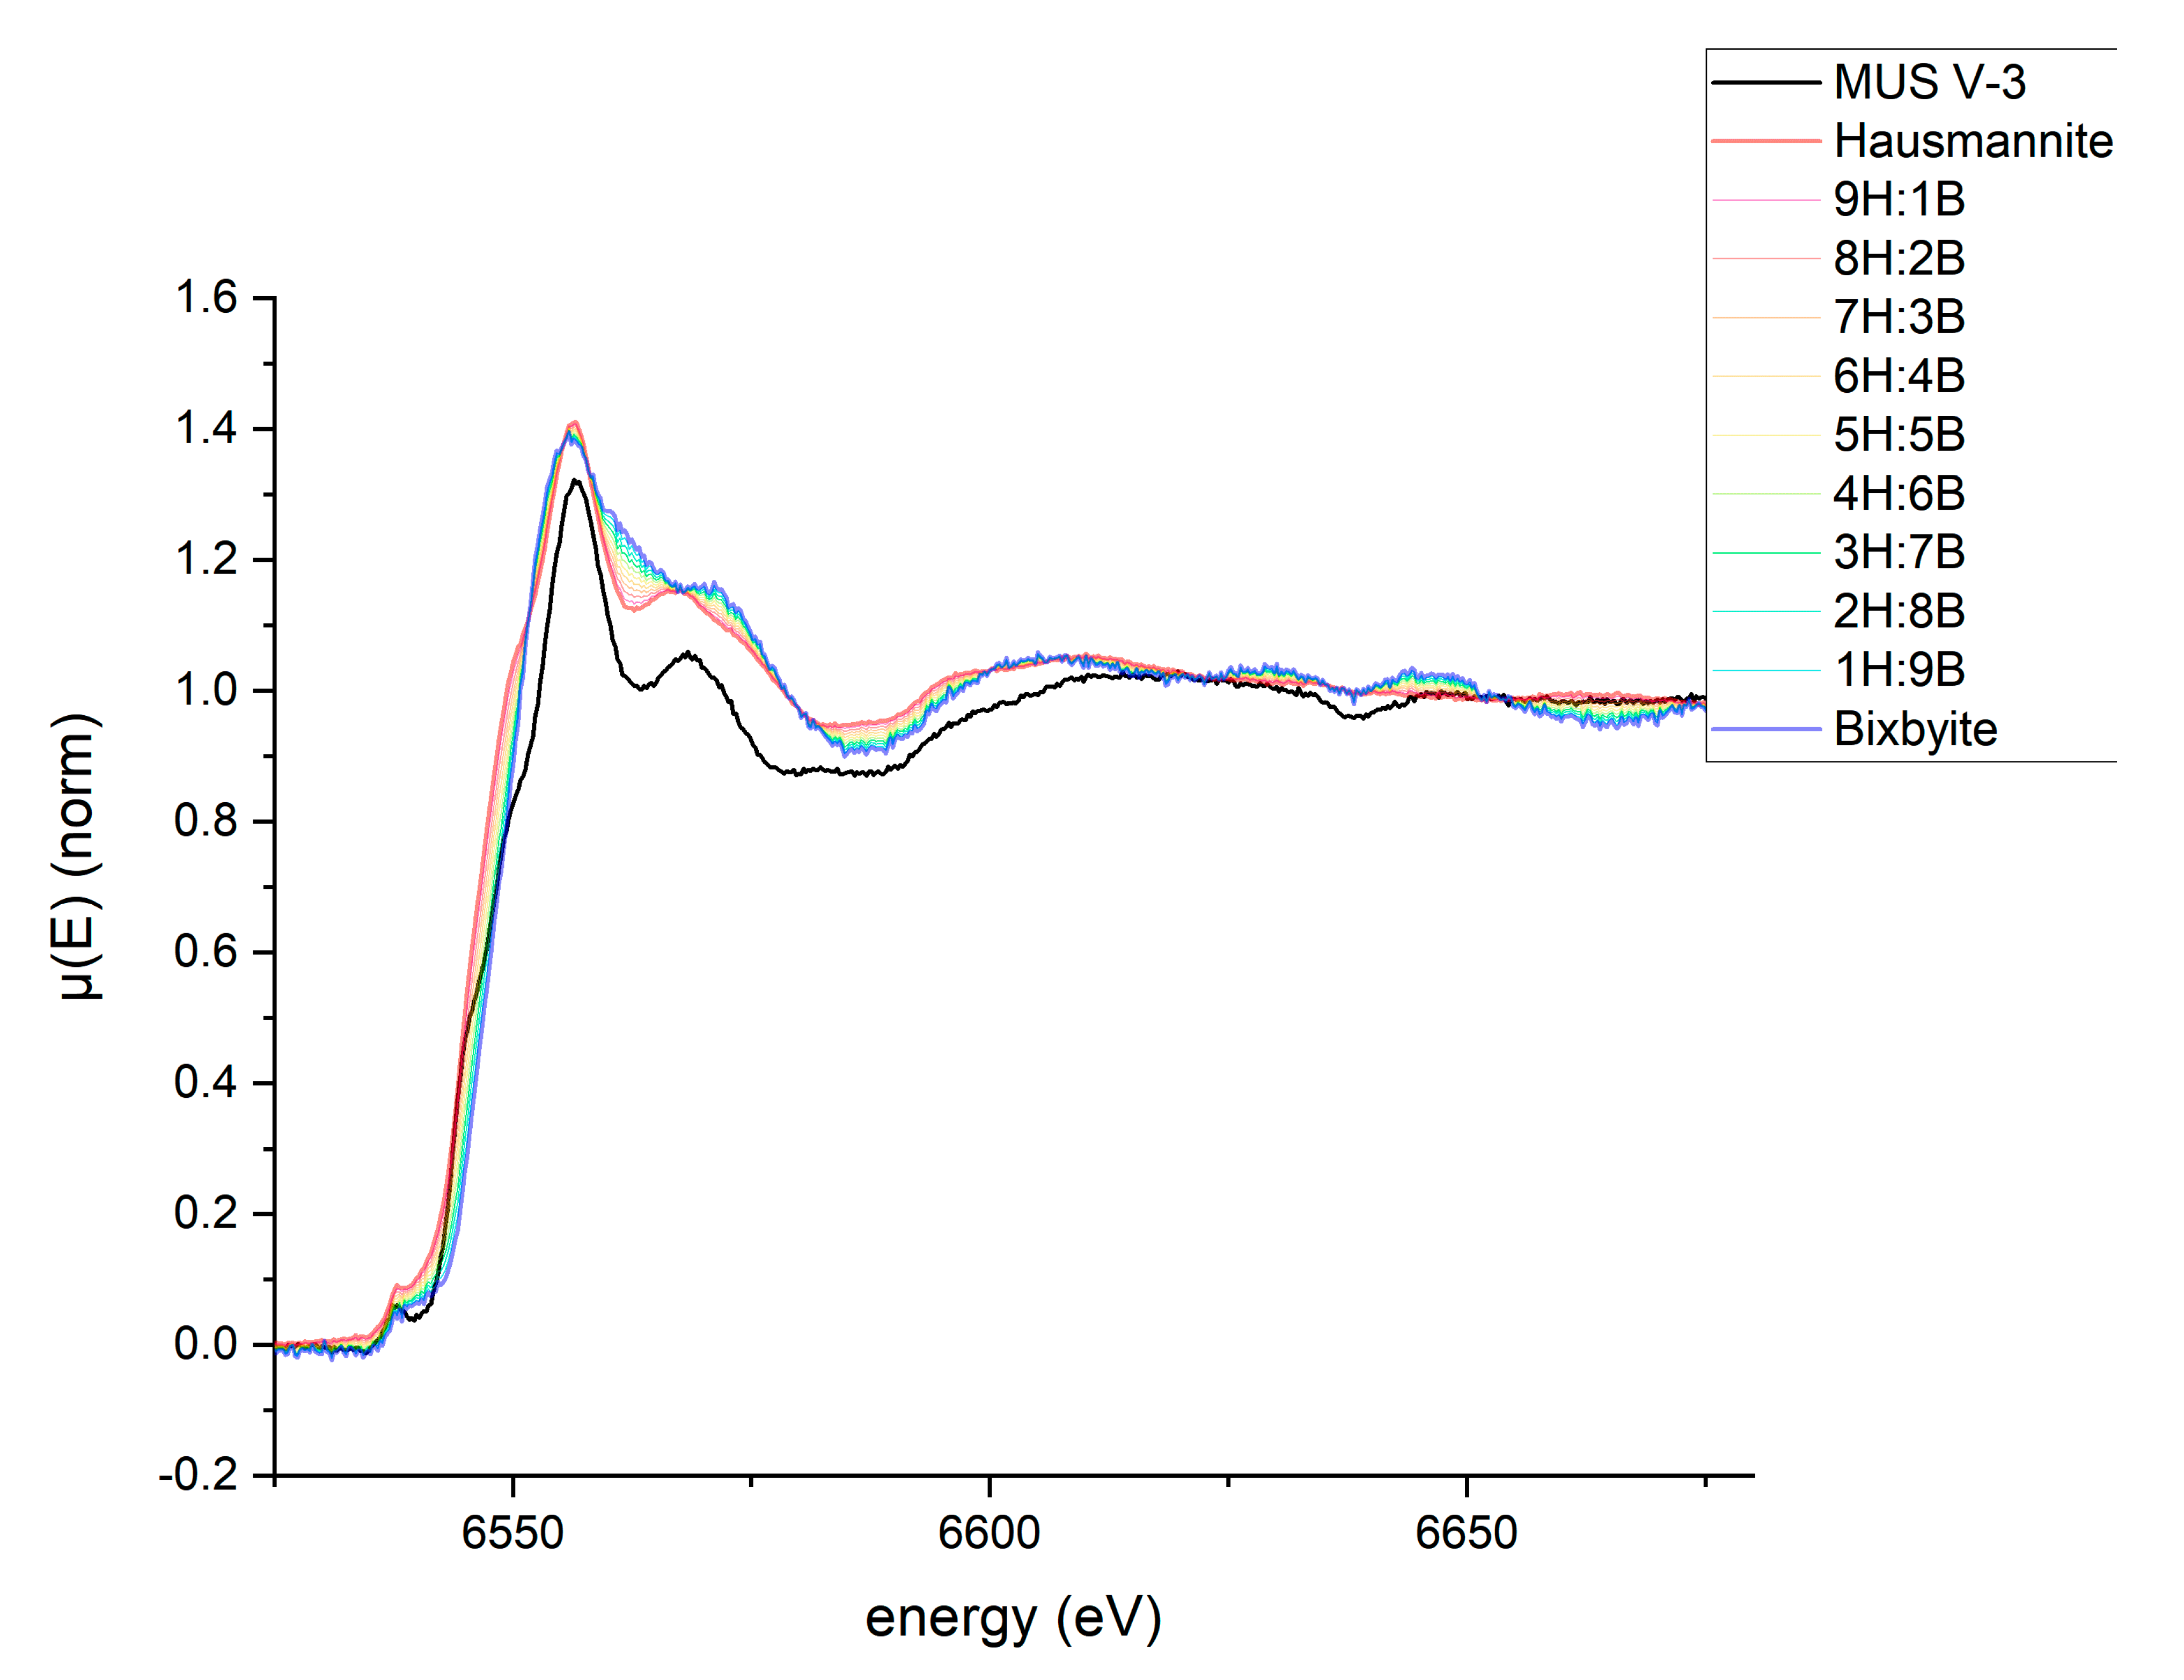
Spectra of Mn samples of different oxidation states. The spectra are compared to the spectrum of the mock-up slag (MUS). A shift of the edge accompanies the increase in the oxidation state which is indicated by the arrow. The mean oxidation states of Mn in the compounds are as follows: MnO: +2; galaxite: +2, hausmannite: +2.67; braunite: +2.85; bixbyite: +3; and MnO2: +4.
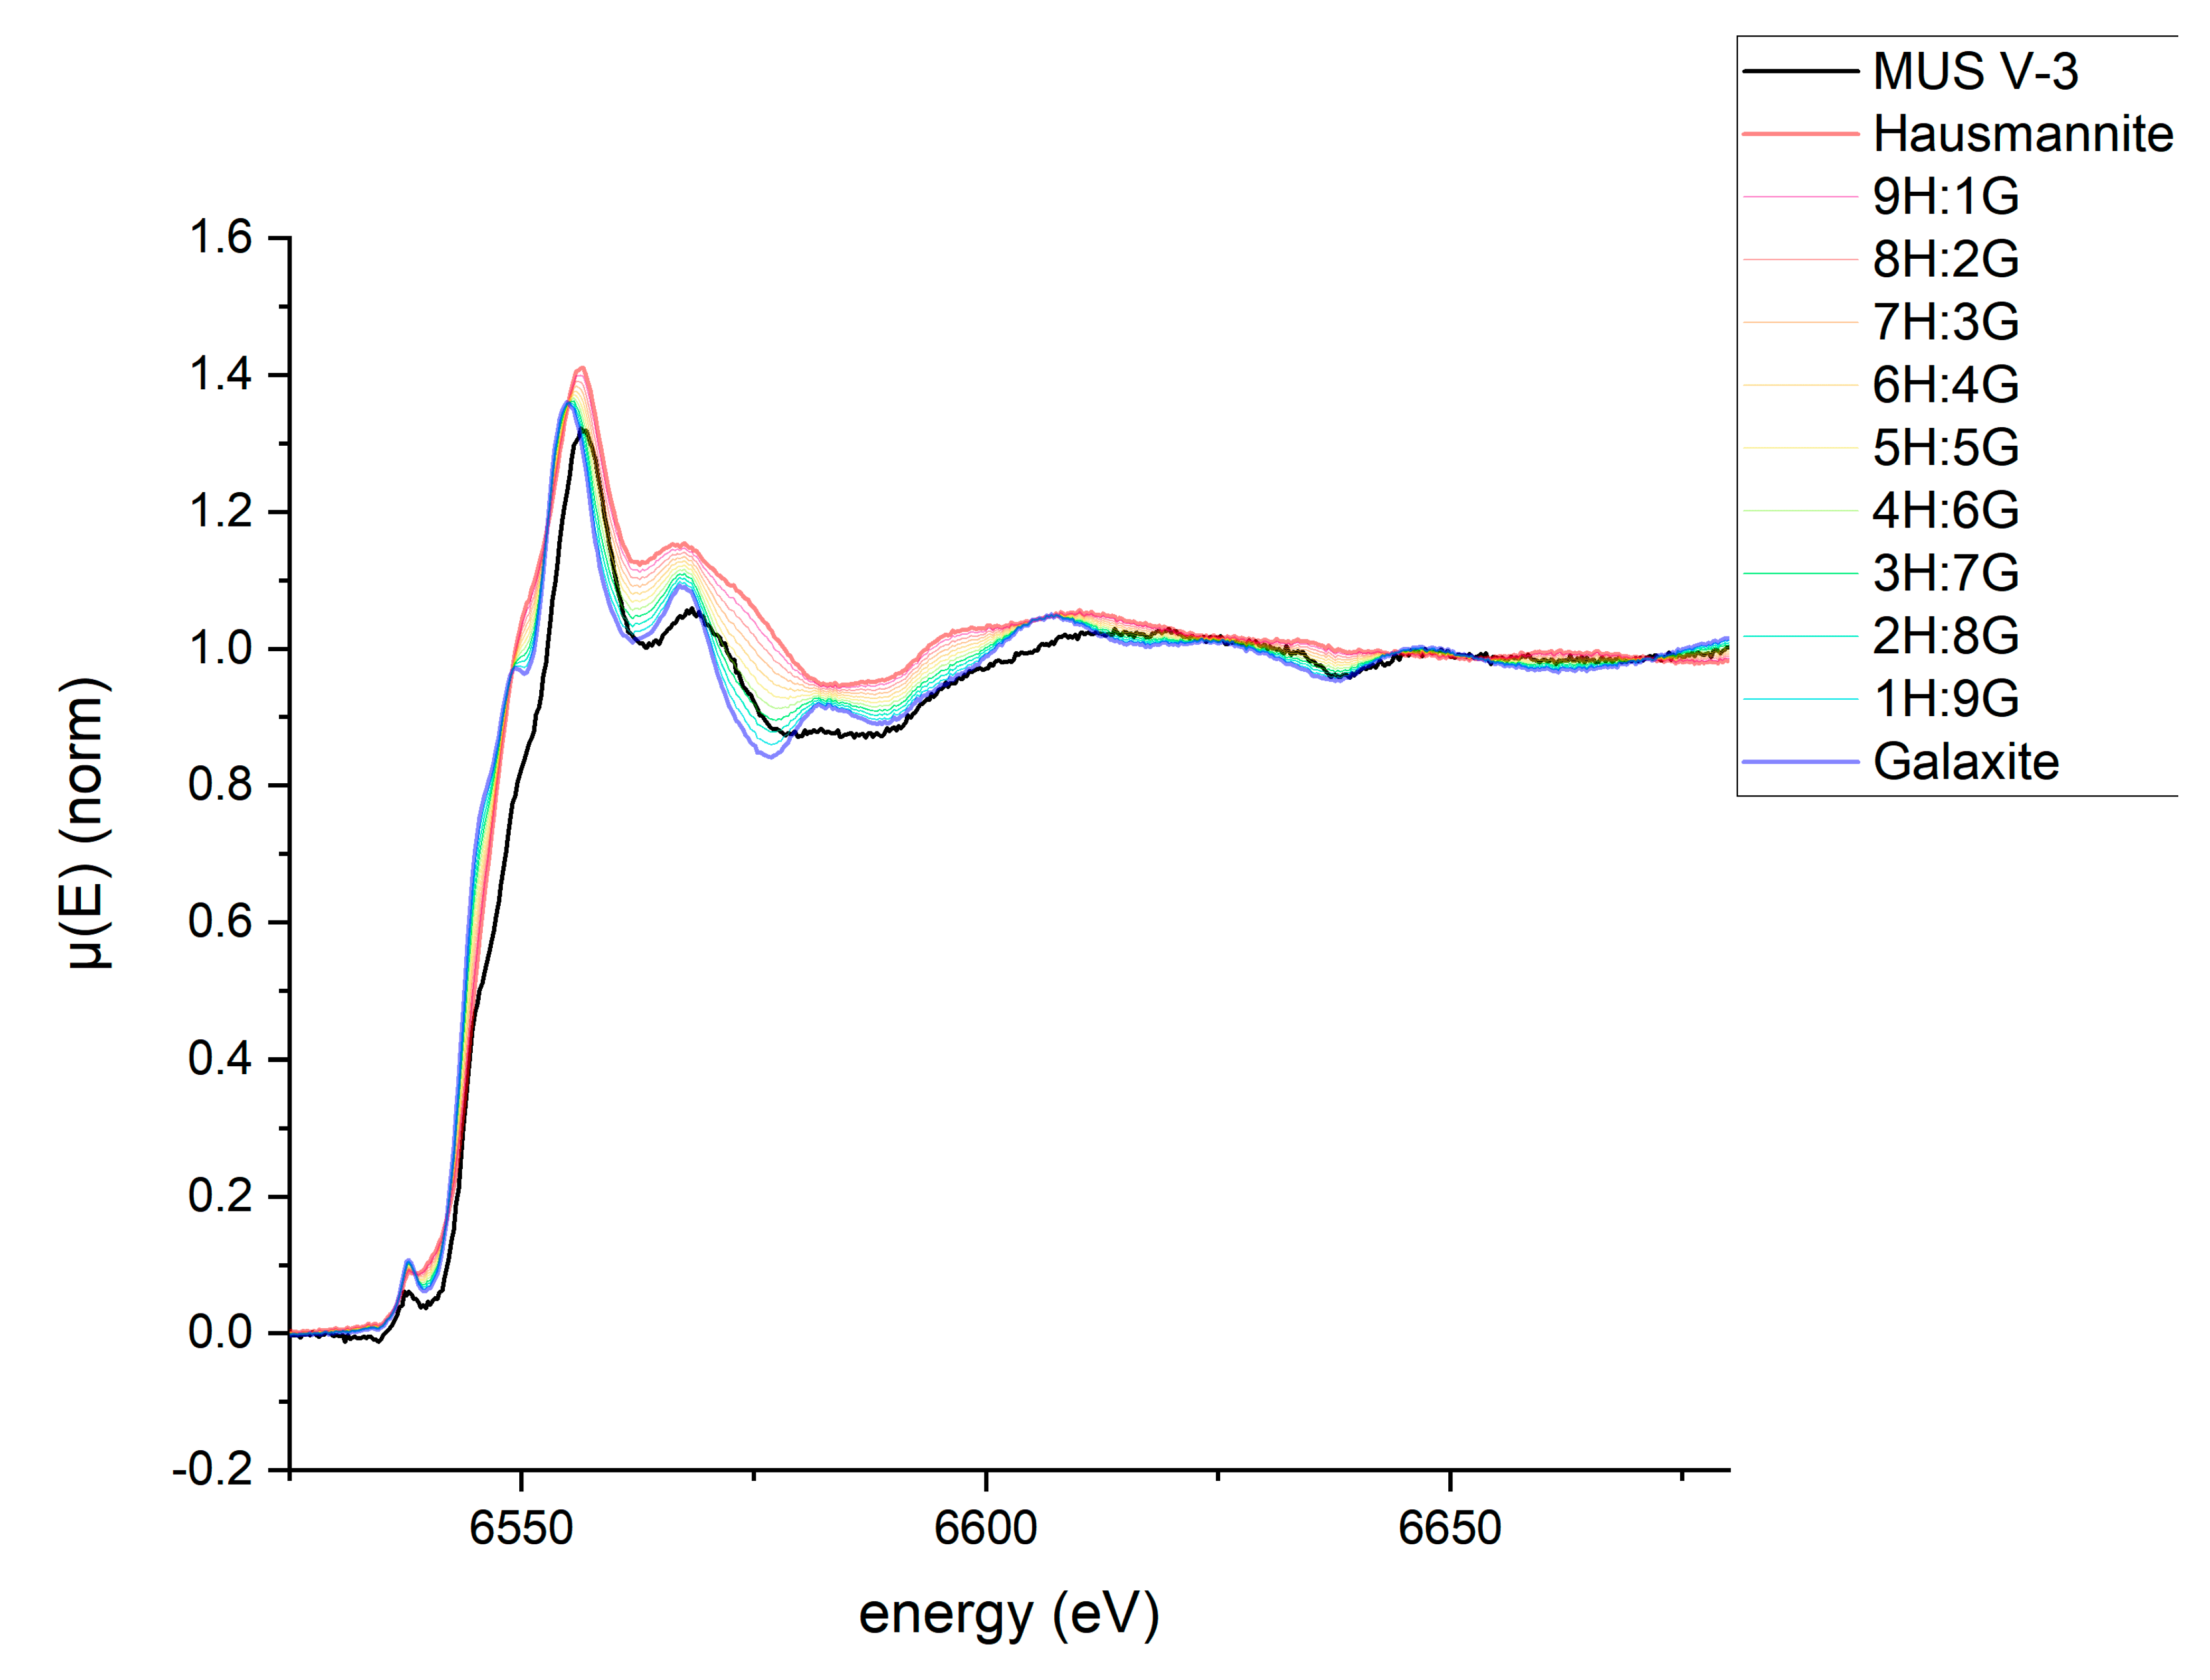
Figure 7.
Linear combination of hausmannite (H) and galaxite (G). At the edge jump, the MUS spectrum fits the spectrum of hausmannite, whereas after the jump, the spectrum is more similar to galaxite.
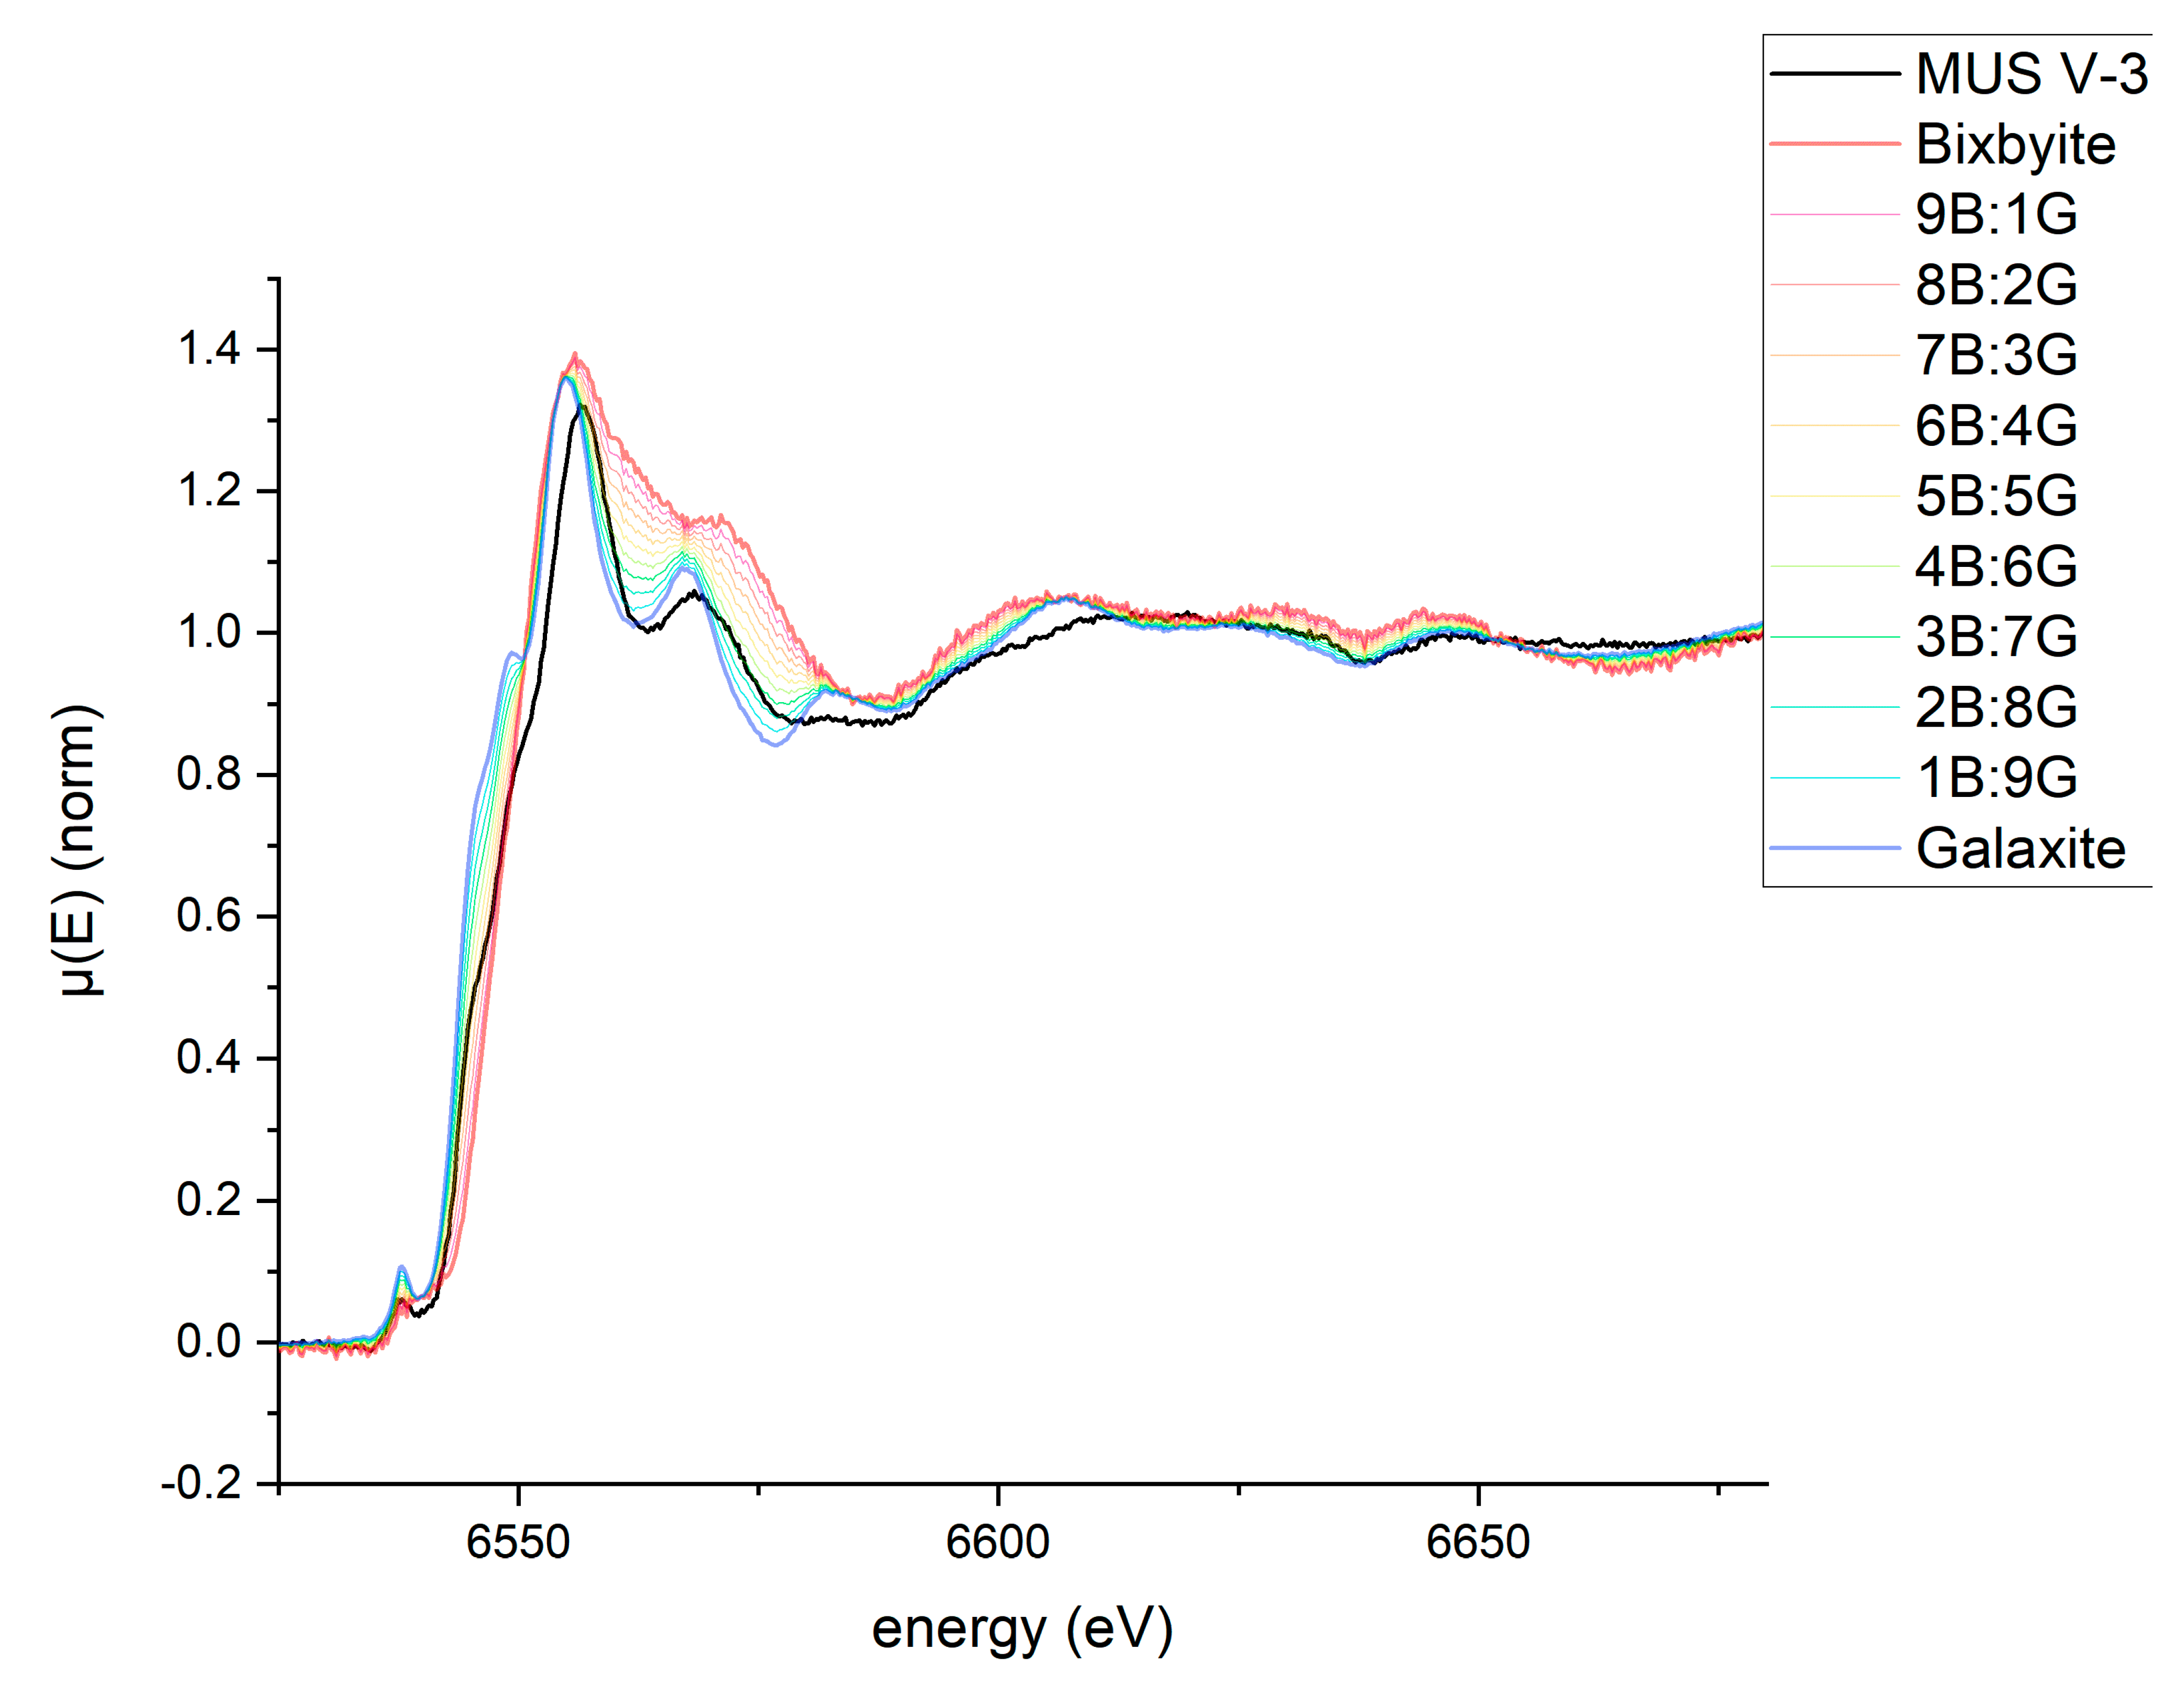
Figure 8.
Linear combination of bixbyite (B) and galaxite (G). The spectrum of the MUS is similar to the linear combination. At the edge jump, the MUS spectrum fits the middle of the linear combination, whereas in the region after the edge, the spectrum is more similar to that of galaxite.
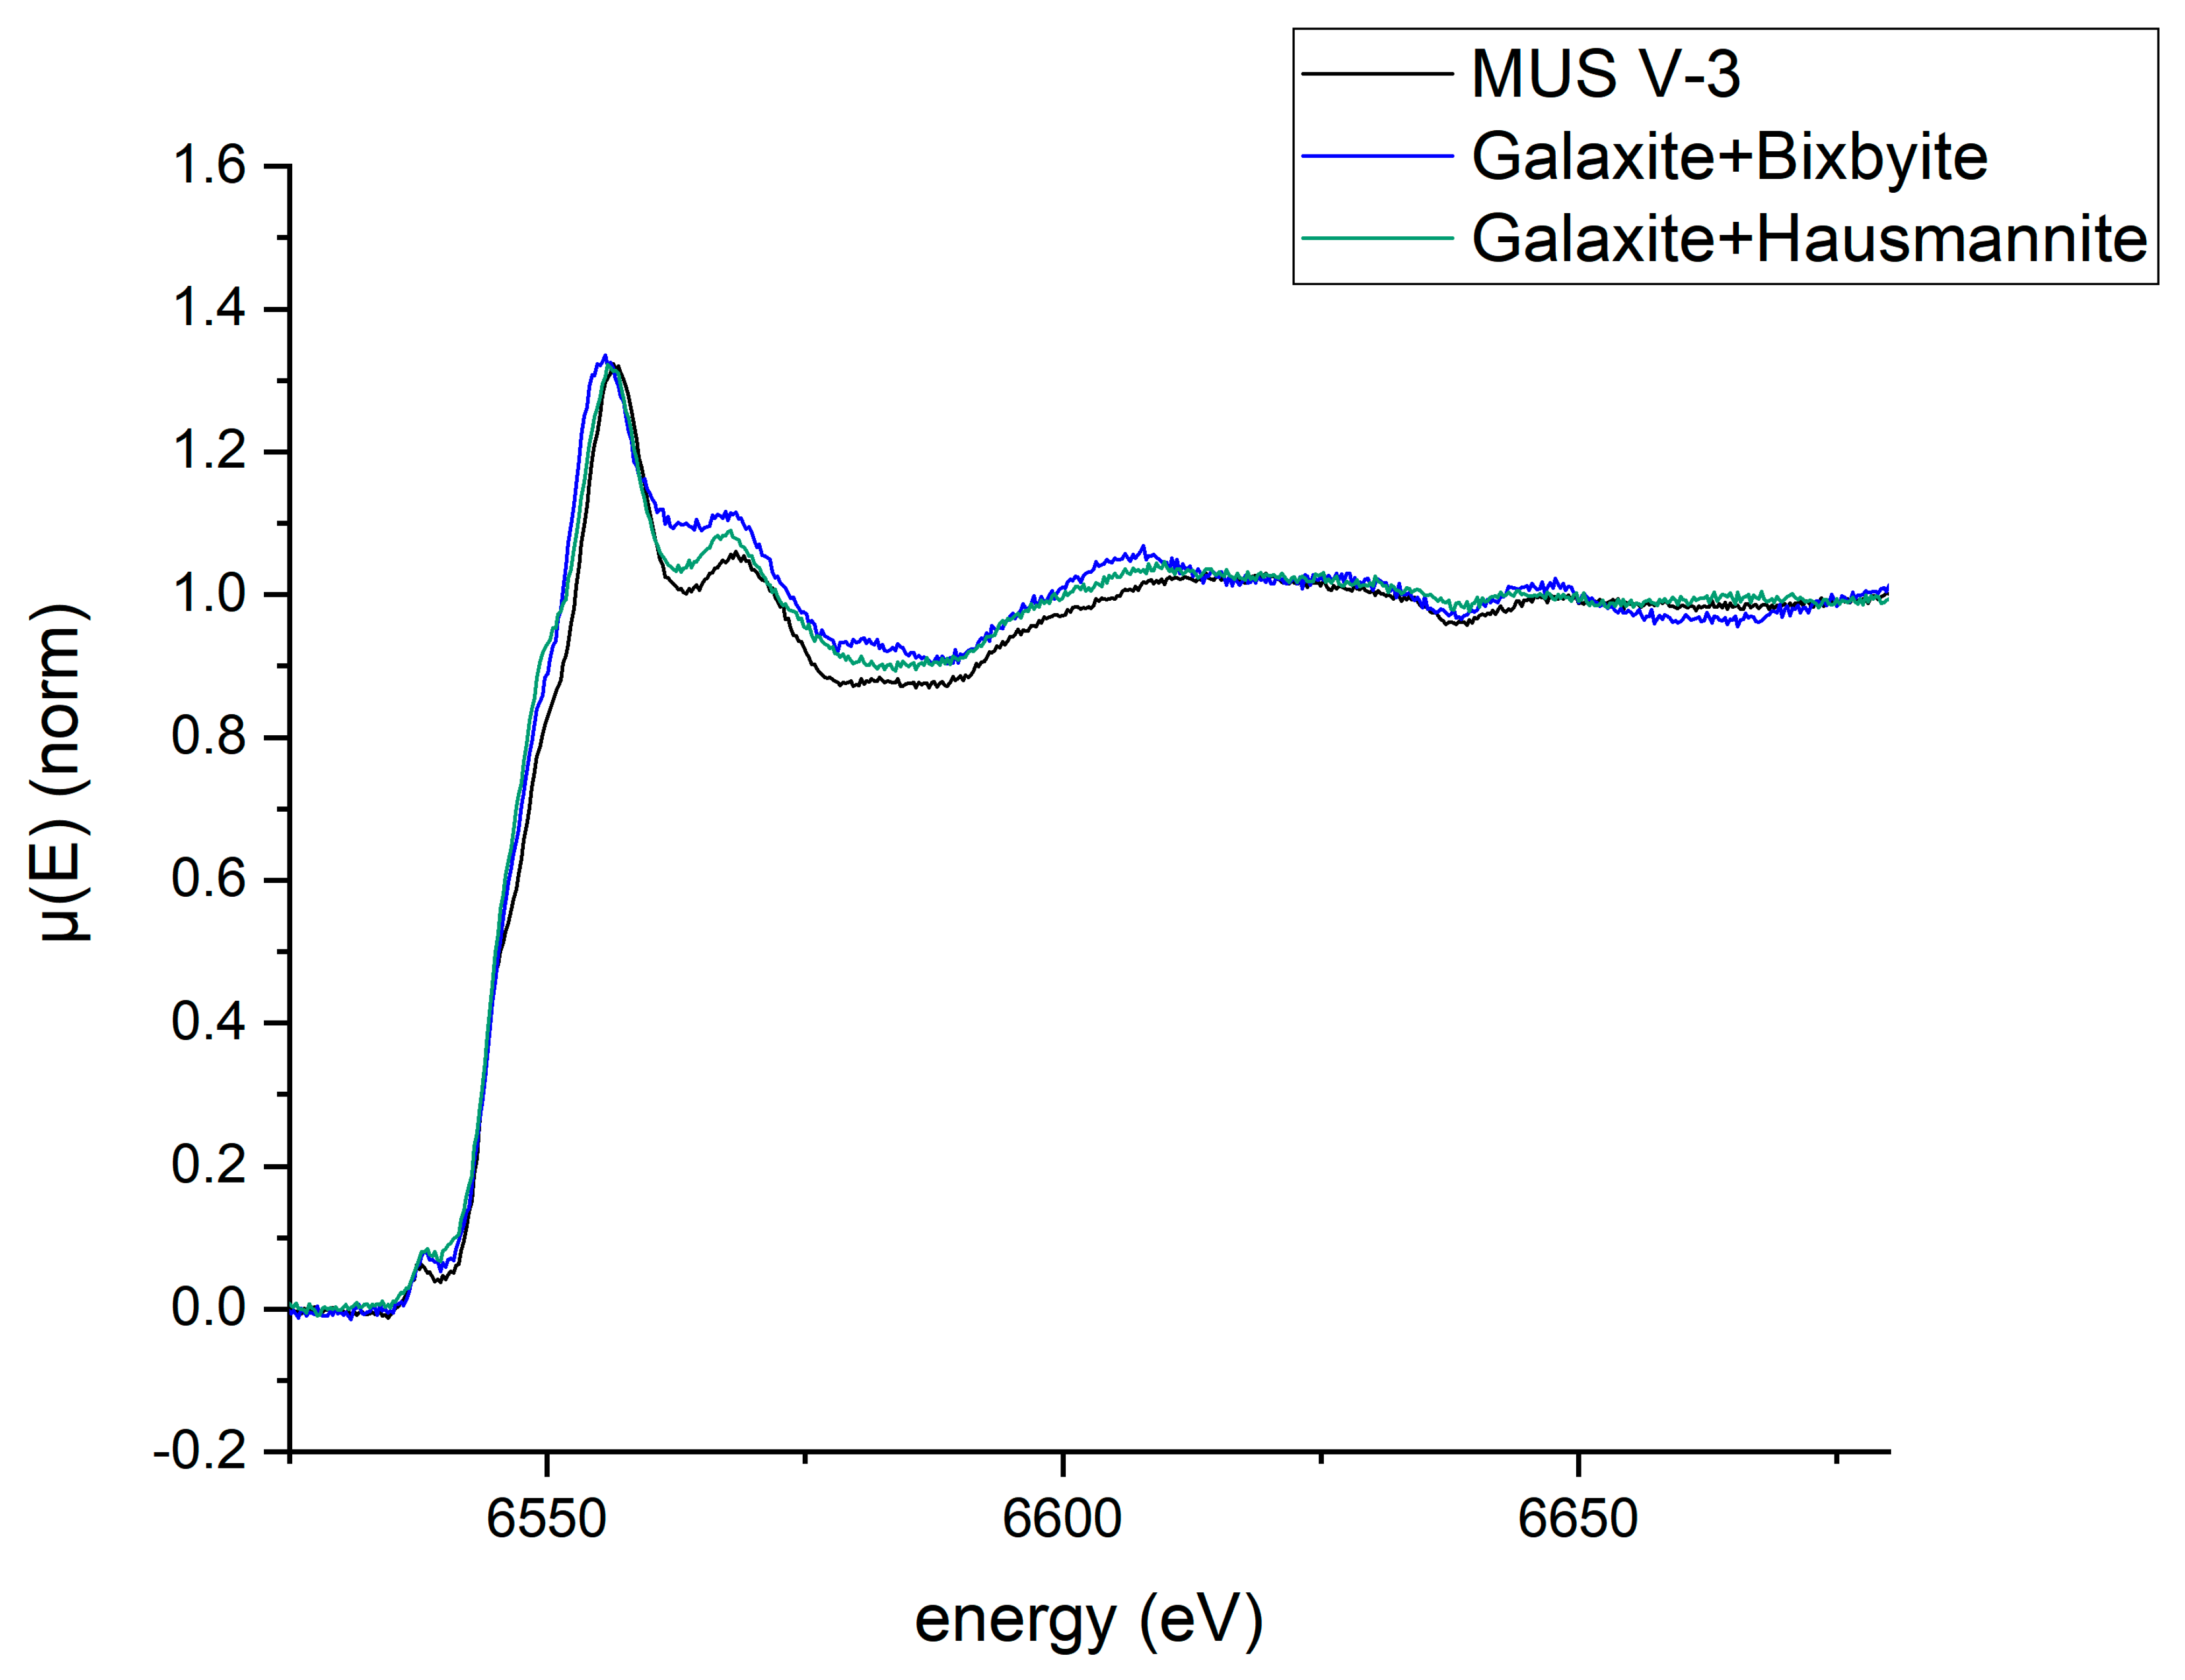
Figure 9.
Experimentally derived X-ray absorption near edge structure analysis (XANES) spectra of a 50 wt.% mixture of galaxite and bixbyite, respective of galaxite and hausmannite compared to the spectrum obtained from the MUS V-3. The pre-edge peak, edge jump and course of the spectrum are very similar for all three spectra.
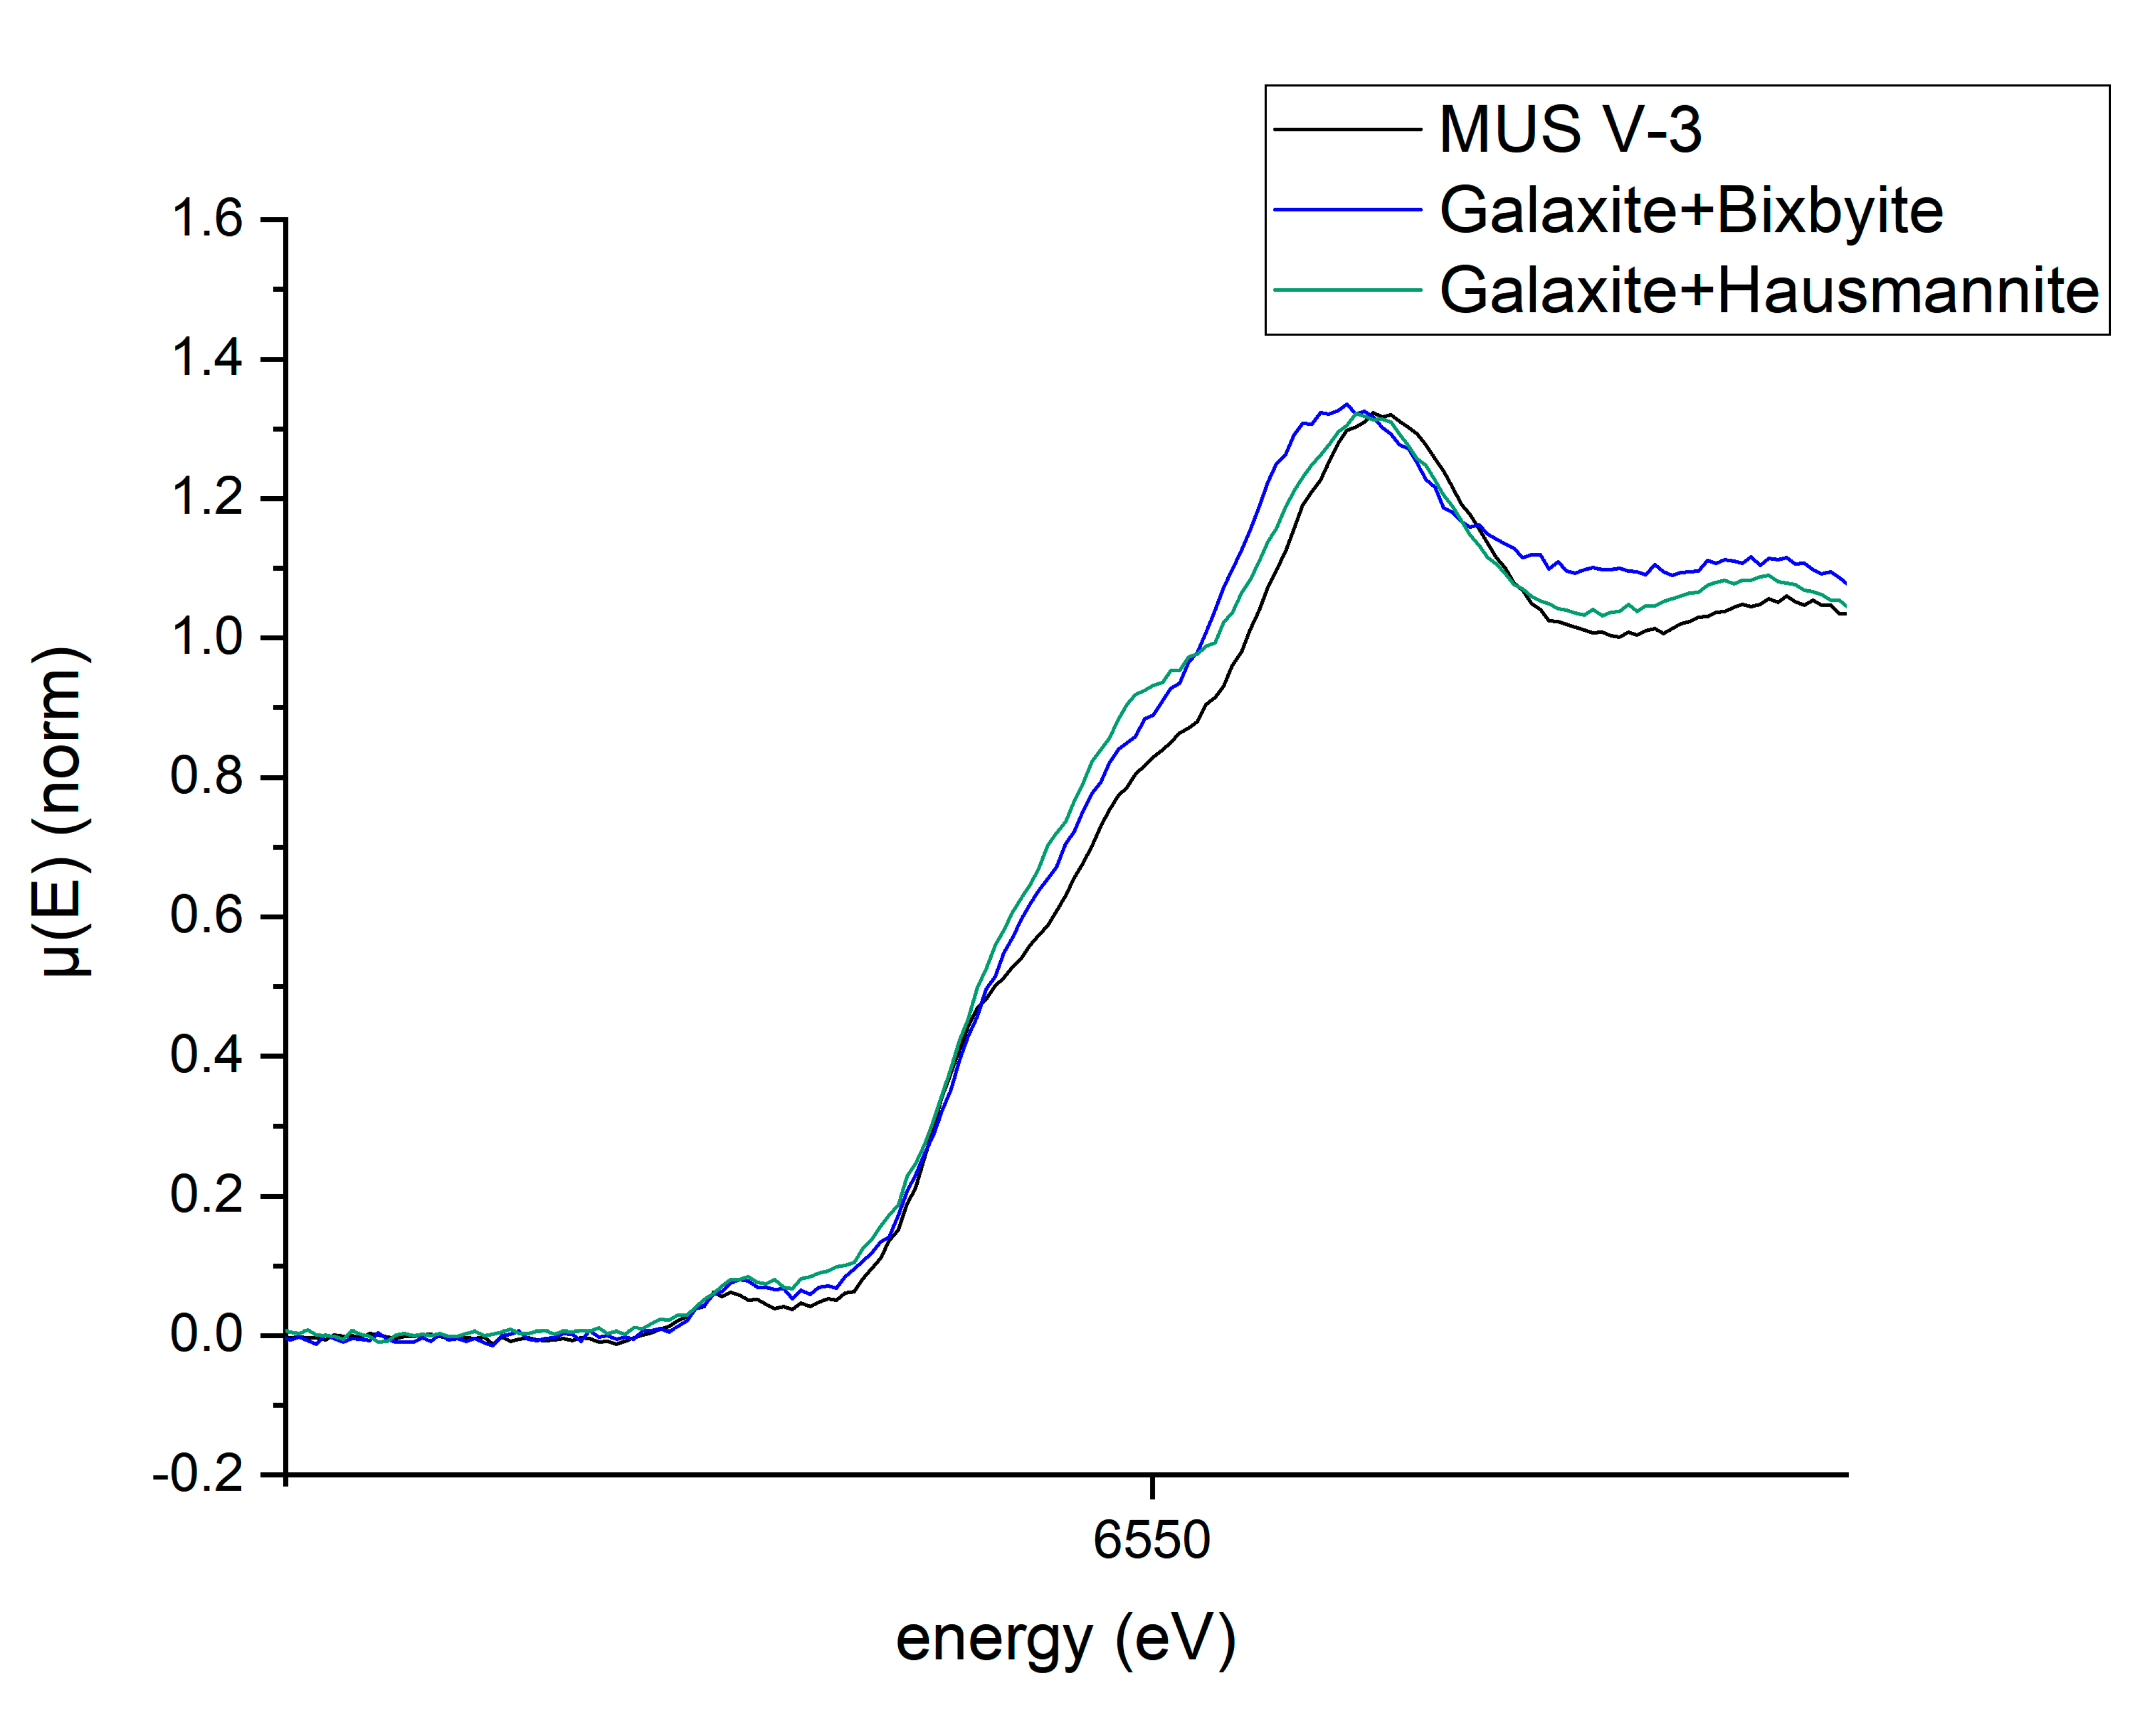
Figure 10.
Close-up to the edge jump from
Figure 9.
Figure 11.
Fractions of the virtual compounds Mn
0.5AlO
2 (½ galaxite, Gal), LiMnO
2 (Li-Mn), and Mn
0.5MnO
2 (½ hausmannite, Hsm) in the grain presented in
Figure 5.
Table 1.
Recovery of Li-compounds. Spod: spodumene, % StdDev: Relative standard deviation in percent, Repeats: N = 5, R: Recovery, LiAl: LiAlO2.
| Wt.% | Average Spod. | %StDev., Spod. | Ref. Spod. | R (%) | Average LiAl | %StDev., LiAl | Ref.
LiAl | R (%) |
|---|
| Al | 15.04 | 0.35 | 14.4 | 104 | 41.24 | 0.22 | 40.9 | 101 |
| Mg | 0.00 | n.a. | 0.0 | n.a. | 0.01 | n.a. | 0.0 | n.a. |
| Ti | 0.00 | n.a. | 0.0 | n.a. | 0.00 | n.a. | 0.0 | n.a. |
| Mn | 0.05 | n.a. | 0.0 | n.a. | 0.00 | n.a. | 0.0 | n.a. |
| Fe | 0.02 | n.a. | 0.0 | n.a. | 0.03 | n.a. | 0.0 | n.a. |
| Ca | 0.01 | n.a. | 0.0 | n.a. | 0.01 | n.a. | 0.0 | n.a. |
| K | 0.00 | n.a. | 0.0 | n.a. | 0.00 | n.a. | 0.0 | n.a. |
| Si | 28.71 | 0.56 | 30.0 | 96 | 0.01 | n.a. | 0.0 | n.a. |
| Na | 0.10 | 2.83 | 0.09 | 112 | 0.00 | n.a. | 0.0 | n.a. |
Table 2.
Comparison of the bulk chemical composition of the three melt experiments, given in mole percent.
| | Raw Mix (Mole Fraction) | Product (Mole Fraction) | Recovery % |
|---|
| | V-1 | V-2 | V-3 | V-1 | V-2 | V-3 | V-1 | V-2 | V-3 |
|---|
| Al2O3 | 32 | 29 | 28 | 33 | 31 | 29 | 103 | 107 | 104 |
| CaO | 16 | 14 | 14 | 15 | 15 | 14 | 94 | 107 | 100 |
| Li2O | 21 | 19 | 18 | 20 | 18 | 17 | 95 | 95 | 94 |
| MgO | 3 | 3 | 3 | 3 | 3 | 3 | 100 | 100 | 100 |
| MnO2 | 7.4 | 13 | 17 | 6.1 | 12 | 17 | 82 | 92 | 100 |
| SiO2 | 22 | 21 | 20 | 23 | 22 | 21 | 105 | 105 | 105 |
Table 3.
Elemental concentrations (wt.%) at the locations depicted in
Figure 5, sorted in ascending order according to the Al concentration. For a close-up of the lamellae region, see
Appendix C. The distance from the lamellae region points to the nearest rim is given. Regarding the point scans, a virtual line is drawn through all points to the left rim. The distances are given from each point to the intersection of this line with the rim.
| Location | Lamellae Region | Point Scan |
|---|
| No. | 379 | 382 | 383 | 380 | 381 | 374 | 378 | 377 | 294 |
|---|
| Distance from rim in µm | 2.6 | 2.2 | 6.9 | 5.6 | 10.4 | 10.1 | 46.5 | 81.8 | 101.2 |
| Al | 0.7 | 0.7 | 1.5 | 1.5 | 3.1 | 6.0 | 11.9 | 16.7 | 22.3 |
| Mg | 0.1 | 0.1 | 0.1 | 0.1 | 0.1 | 0.1 | 0.2 | 0.2 | 0.5 |
| Ti | 0.4 | 0.4 | 0.3 | 0.2 | 0.1 | 0.0 | 0.0 | 0.0 | 0.0 |
| Mn | 69.7 | 64.4 | 62.9 | 64.0 | 62.2 | 60.0 | 52.3 | 46.9 | 39.0 |
| Fe | 0.3 | 0.4 | 0.5 | 0.5 | 0.5 | 0.4 | 0.3 | 0.3 | 0.3 |
| Ca | 0.2 | 0.1 | 0.1 | 0.2 | 0.1 | 0.2 | 0.0 | 0.0 | 0.0 |
| Si | 0.2 | 0.2 | 0.2 | 0.2 | 0.1 | 0.1 | 0.1 | 0.0 | 0.0 |
Table 4.
Spinel formulas, calculated with the Al and Mn concentrations of
Table 3, sorted in ascending order according to the Al concentration. The Mn
2+/Mn
3+-ratio was calculated using the total measured Mn concentration in
Table 3. The Li concentration is derived from the calculated fraction of LiMnO
2. In the first section of the table, the concentrations of the elements are given in weight percent. In the second section, the calculated fractions of the different virtual components in percent are presented. In the last section, the stoichiometric ratio of the formula (Li
(2x)Mn
2+(1−x))
1+x(Al
(2−z),Mn
3+z)O
4 is presented. The distance from the lamellae region points to the nearest rim is given. Regarding the point scans, a virtual line is drawn through all points to the left rim. The distances are given from each point to the intersection of this line with the rim.
| Location | Lamellae Region | Point Scan |
|---|
| No. | 379 | 382 | 383 | 380 | 381 | 374 | 378 | 377 | 294 |
|---|
| Distance from rim in µm | 2.6 | 2.2 | 6.9 | 5.6 | 10.4 | 10.1 | 46.5 | 81.8 | 101.2 |
| Concentrations (wt.%) |
| Al | 0.7 | 0.7 | 1.5 | 1.5 | 3.1 | 6.0 | 11.9 | 16.7 | 22.3 |
| Mn2+ | 21.5 | 12.2 | 11.5 | 13.6 | 14.5 | 17.9 | 19.3 | 21.8 | 22.7 |
| Mn3+ | 48.2 | 52.2 | 51.4 | 50.4 | 47.7 | 42.1 | 33.0 | 25.1 | 16.7 |
| Li | 0.8 | 3.7 | 4.0 | 3.3 | 3.2 | 2.4 | 2.4 | 2.0 | 2.1 |
| Calculated fractions (%) |
| Mn0.5AlO2 | 2.1 | 2.2 | 4.7 | 4.9 | 10.0 | 19.2 | 38.2 | 53.5 | 71.5 |
| LiMnO2 | 11.0 | 49.9 | 53.6 | 45.1 | 42.7 | 31.8 | 31.9 | 26.7 | 28.5 |
| Mn0.5MnO2 | 86.9 | 47.9 | 41.7 | 50.0 | 47.3 | 48.9 | 29.9 | 19.9 | 0.0 |
| Stoichiometric factors (Li2xMn2+(1−x))(1+x)(Al(2−z),Mn3+z)O4 |
| x | 0.13 | 0.54 | 0.58 | 0.49 | 0.46 | 0.34 | 0.33 | 0.26 | 0.27 |
| z | 1.95 | 1.95 | 1.89 | 1.88 | 1.76 | 1.55 | 1.15 | 0.85 | 0.54 |
| Publisher’s Note: MDPI stays neutral with regard to jurisdictional claims in published maps and institutional affiliations. |
© 2021 by the authors. Licensee MDPI, Basel, Switzerland. This article is an open access article distributed under the terms and conditions of the Creative Commons Attribution (CC BY) license (http://creativecommons.org/licenses/by/4.0/).


 ,
, 


