Article

Surface Characteristics and Corrosion Behavior of Carbon Steel Treated by Abrasive Blasting

1
Department of Urban and Environmental Engineering, Kyushu University, Fukuoka 8190395, Japan
2
Department of Civil Engineering, Faculty of Engineering, Kyushu University, Fukuoka 8190395, Japan
*
Author to whom correspondence should be addressed.
Metals 2021, 11(12), 2065; https://doi.org/10.3390/met11122065
Submission received: 25 November 2021 / Revised: 16 December 2021 / Accepted: 17 December 2021 / Published: 20 December 2021
(This article belongs to the Special Issue Influence of Surface Treatment on Corrosion Behavior of Steels)

Abstract

:
The effects of blasting with metallic steel grit and non-metallic alumina grit on steel surface characteristics were evaluated. These abrasives are generally used at construction sites and in vacuum blasting. Milled steel specimens were used to investigate the effect of the blasting conditions on surface properties. The effect of difference in surface properties on the adhesion strength and corrosion behavior were measured through adhesion tests, polarization curves, and electrochemical impedance spectroscopy. The limitations of blasting were evaluated using corroded steel specimens, as were the effects of corrosion products, salts, and abrasive material remaining on the blasted steel surface on the adhesion and corrosion resistance of paint. Steel grit more effectively increased the surface roughness than alumina grit; however, with both abrasive materials, the roughness increased with the blast projection angle. However, in the case of alumina grit, some abrasive material remained on the surface; thus, the actual roughness not including the residual abrasive material was more complex and greater than that of the sample blasted with steel grit. According to the adhesion strength test of painted and unpainted specimens, the adhesion force improved with increasing surface roughness and residual abrasive materials. Further, surface roughness was linearly correlated with the adhesion strength of unpainted specimens for both abrasive materials with blasting, and the adhesion strength force with alumina grit was approximately 1.4 times higher than that with steel grit, suggesting that increased roughness and residual abrasive material could benefit adhesion. According to the electrochemical test results, lower roughness and increased residual abrasive material owing to alumina grit on the steel surface enhanced the surface corrosion resistance, confirming the benefit of residual materials. Grinding left behind corrosion products and salts under the steel, resulting in the recurrence of rusting. However, the residue from blasting with alumina suppressed corrosion, thus improving the adhesion and corrosion resistance of the paint.

1. Introduction

To maintain bridges and other steel structures, surface treatments are generally applied before painting to remove impurities from steel surfaces and impart appropriate roughness [1]. The durability and protection performance of paint on bridges and steel structures depend on the anchor pattern, corrosion products, and degree of residual salts. The surface roughness formed by surface treatments can increase the adhesion performance and corrosion resistance of paint [2,3,4]. However, many cases have been reported wherein moisture penetrates the coating owing to osmotic pressure and early corrosion occurs under the coating when salt remains on the steel surface because of insufficient surface treatment before painting [4]. Corrosion under the coating often progresses locally, leading to the fracture of steel members and even the collapse of structures in some cases [5]. Thus, surface treatment before painting is crucial for protecting steel structures from corrosion.
Although various surface treatment techniques have been developed [5,6], some of them have limited applicability in the field. Blasting is generally performed for surface treatments [7,8,9]. Various components related to blasting, such as abrasives, nozzles [10,11], and blasting equipment, have been developed to improve the surface treatment quality and efficiency. Blasting parameters such as the diameter of the nozzle, type of abrasive, blast pressure, and angle affect the surface properties of steel [7,12,13]. In addition, the size, distribution, diameter, density, and shape of particles, which together produce the blasting conditions, have been found to significantly influence the surface morphology [4,7,8,9,14,15]. Momber [8] reported that the material and particle shape of the abrasive considerably affected the surface properties of steel, including the introduction of secondary impurities on the blasted steel surface. Desale et al. [16] showed that the lower the shape factor of abrasive particles and the higher their density, the higher the resulting roughness of the steel surface. Tshimanga et al. [9] found that after 304L stainless steel was blasted with garnet, alumina grit, steel grit, or platinum grit, the steel grit from the steel surface showed the highest roughness, but the highest peaks formed when it was blasted with alumina grit. Ding et al. [13] showed that sand blasting induced plastic deformation while increasing the surface roughness. Furthermore, corrosion activities in acidic and neutral solutions increased with the spraying time of blasting; however, in alkali solutions, excellent corrosion resistance was observed, which increased in proportion to the spraying time of sand blasting. Harris and Beevers [12] revealed that the larger the particle size of alumina grit, the higher the roughness of the steel surface, and the abrasive itself was eroded. Leidheiser et al. [17] reported that the existence of an abrasive on a steel surface blasted by alumina grit decreased the initial corrosion rate with respect to that when steel grit was used; they claimed that blasting by a non-metal abrasive chemically modified the metal surface. Islam et al. [18] demonstrated that increasing the roughness of the steel by abrasive blasting increases the mechanical adhesion.
Despite the variety of studies examining the effects of abrasive blasting on the surface properties of steel, there has been no in-depth research on the change in the roughness of steel surfaces and the form and shape of abrasive residuals when abrasives comprising different materials (metallic and non-metallic) of the same particle size are used for blasting under the same blasting conditions. The relationship between the type of adhesion and the adhesion of the film must be investigated when the roughness of the steel surface is unbalanced and abrasive materials remain on the surface. Further, although the adhesion of coatings has been examined, the adhesion of the surface state of the steel itself to epoxy has not been studied in detail. Understanding the adhesion of the steel surface to the adhesive can lead to the development of a surface state capable of increasing adhesion when bonding carbon-fiber-reinforced polymer (CFRP) materials, which are widely used for the structural repair and upgrading of corroded steel structures and steel plates.
Various surface treatment technologies are currently being developed; but there is a lack of criteria for discriminating new technologies. Therefore, standards must be identified and established by evaluating how the surface properties, adhesion strength, and corrosion resistance are affected by various conditions in commonly employed blasting treatments. Studying these parameters can help optimize the blasting treatment method by varying the blasting conditions according to the location of the steel structure member and the corrosion state of the surface during surface treatment.
In this study, the blasting conditions were examined using both metallic and non-metallic abrasives. In addition, differences in blasting conditions were studied using polished and corroded carbon steel plates, representing new construction and sites in need of service, respectively. After establishing basic data on blasting conditions using milled steel sheets, the effects of corrosion products, salt, and abrasive materials on the adhesion and corrosion resistance of steel plates were investigated using corroded steel plates. The surface morphology of blasted steel with an adhesive was also measured using a laser microscope, and the abrasive residue on the steel surface was analyzed via scanning electron microscopy with energy dispersive X-ray analysis (SEM-EDX). The adhesion strength was tested by dolly testing. Furthermore, polarization curves were recorded, and electrochemical impedance spectroscopy (EIS) was used to evaluate the effects of the steel surface conditions on the corrosion properties.

2. Experimental

2.1. Milled Specimen

A JIS G 3106 SM490A carbon steel plate with dimensions of 70 mm × 70 mm × 6 mm was used as the specimen, and its chemical composition is shown in Table 1.
A polished steel plate was used to directly evaluate the surface, corrosion, and physical properties of the blast-treated steel surface. A cermet disk (cutting diameter: 50 mm, cutting speed: 215 m/min, revolutions per minute: 1369 rpm) was used to mill away (NEXUS, model: 510C-Ⅱ, MAZAK, Elgin, IL, USA) 0.1 mm from the steel surface, such that the roughness of the steel surface before blasting did not influence the surface properties after blasting. After milling, the line roughness (Ra) of the surface which was measured in the perpendicular direction of the shape of the milling process was 1 μm or lower, and this specimen is hereafter referred to as the milled (MI) specimen.
A blasting machine (PB500P, pressure blast cabinet) was used for all blasting experiments, and a valve (model: Thompson Valve II, Schmidt Abrasive Blasting Equipment, Selangor, Malaysia) was connected to supply a constant amount of abrasive, which was injected through a Venturi nozzle (model: SN156-550AP, bore diameter: 7.9 mm, length: 148.1 mm, KENNAMETAL, Pittsburgh, PA, USA), which is widely employed in experiments and different fields. In addition, the abrasive, blast pressure, abrasive projection angle, and distance were adopted according to the conditions generally used at new constructions sites and those in need of serviced sites. Steel grit, which is generally used in both types of sites, was adopted as one abrasive, and the other was alumina grit with a relatively high Mohs hardness. The particle size (d) of both abrasives was unified to 425 μm for 90% or more of the particles to minimize the effect of the particle size of each abrasive. Microscopic images of the abrasives are shown in Figure 1, and their specifications and chemical composition are listed in Table 2. The nozzle and specimen were fixed and blasted for 5 s with a blast pressure of 0.7 MPa, an abrasive projection rate of, 3.83 L/min, an angle of 60° from the horizontal, and a distance to the subject of 300 mm. After milling, the following steel plates cleaned by both abrasive blasting were hen characterized in terms of surface roughness to examine the effects of blasting residue:
(1)
MST: Steel grit blasted specimen.
(2)
MAL: Alumina grit blasted specimen.

2.2. Corroded Specimen

Corroded steel plates were used to evaluate the limitations of the blasting treatment, the durability of the paint, and physical properties. To observe the surface of the blasted substrates, plates were first corroded through combined cycle corrosion (CCT) acceleration tests. These accelerated exposure tests were carried out using Cycle-D, as specified by Japanese Industrial Standards (JIS) K 5600-7-9. One entire cycle takes 6 h, and the cyclic conditions are shown in Table 3. The accelerated tests were performed for 120 cycles. The resulting corroded steel plates were then surface-treated by abrasive blasting to the Sa 3 (ISO 8501-1) level under the same blasting conditions as those used on the polished steel plate:
(1)
CST: Steel grit blasted specimen.
(2)
CAL: Alumina grit blasted specimen.
To simulate exposure to the atmospheric conditions corresponding to the time interval between the end of the blasting treatment and the application of the coating, blasted surfaces were exposed to 90% relevant humidity at 30 °C in a humidity chamber for different durations ranging from 0 and 24 h. These conditions aimed to simulate an average summer day at the University of the Ryukyus based on weather data from January, 2015, through September, 2019. The coating was a 100 μm thick film of modified epoxy resin coating commonly used for steel structures.

2.3. Evaluation Method of Surface Roughness

To evaluate the roughness generated on the steel surface by blasting, the surface morphology of the steel was characterized using a three-dimensional shape-measuring laser microscope (LEXT, model: OLS4500, OLYMPUS, Tokyo, Japan). The measurement area was 0.6 mm × 10 mm at the center of the blasted steel surface. After measurement, the line roughness was calculated and quantified by averaging the results of 11 lines with a 10 mm baseline within the laser measurement area.
Both linear and areal roughness parameters were evaluated. The linear roughness parameters were the arithmetic mean deviation (Ra), root mean square deviation (Rq), and maximum height (Rz), which are all magnitude parameters, and the mean width (RSm), a spacing parameter, was also determined. The areal roughness parameters were the arithmetical mean height (Sa) and maximum height (Sz).
The actual roughness and anchor pattern of the steel were quantitatively evaluated using the fractal dimension method on cross-sectional SEM images. Specifically, the fractal dimension was determined by applying a box-counting algorithm [19,20] to the fractal-dimensional interface line. By continuously changing the size of the squares, the number of squares covering the interface line can be counted. The slope between individual box sizes is calculated using Equation (1), and the fractal dimension of the interface line DB is calculated according to Equation (2).
d i = log n i + 1 log n i
D B = log d i + 1 log d i log N i + 1 log N i
where d is the length of a side of the square, and N is the number of squares along the interface line.

2.4. Surface Characterization

The abrasive residue on the blasted steel was analyzed in surface and cross-sectional images recorded using SEM (SU3500, HITACHI, Tokyo, Japan) under low vacuum conditions, and the elements were analyzed using EDX. For the elemental analysis, the main components of the abrasive, i.e., Fe, O, and Al, were mapped.

2.5. Adhesion Strength Method

The adhesion strength was measured to evaluate the adhesion performance of the coating film according to the surface condition of the steel. To evaluate the fine differences in adhesion between the roughness of the steel and the residual abrasive, an unpainted specimen was also evaluated. In addition, the adhesion performance of the coating film was evaluated by applying a modified epoxy resin coating with a thickness of 100 μm to the steel surface. Specifically, a two-liquid epoxy resin with a mix ratio of 1:1 was applied to a dolly as an adhesive, and the dolly adhered to the surface of the test piece while maintaining a uniform normal stress of 0.9 MPa for 30 min. Then, the adhesive was cured for 48 h at 35 °C and a relative humidity of 10%. The adhesion was tested through pull-off tests using a desktop tension–compression testing machine (MSC-10/500-2) at a tensile speed of 0.5 mm/min. Each sample was tested three times for each set of conditions to ensure reproducibility.

2.6. Electrochemical Test

Electrochemical tests were performed to obtain basic indices for describing the effects of the surface properties and residual abrasives on the corrosion properties and corrosion resistance of the coating. The electrochemical tests were performed using a potentiostat (VersaSTAT 4, Princeton Applied Research, Ametek, Berwyn, PA, USA). A 3.5 wt% NaCl solution was used as the electrolyte. The blasted steel surface and coating were cleaned with air and then washed with distilled water. In addition, a measurement area of 100 mm2 was exposed as the working electrode, while the other parts were covered with an electrochemical sample mask. An Ag/AgCl electrode in a saturated potassium chloride solution was used as the reference electrode, and a platinum foil plate (50 mm × 10 mm × 1 mm) was used as the counter electrode.
Three parallel specimens used for the polarization test under the same condition. After the potential of the steel surface stabilized, the polarization curves were recorded at a scanning rate of 10 mV/min in the range of Eocp ± 250 mV. Furthermore, the corrosion current (icorr) and corrosion potential (Ecorr) were determined using the Tafel extrapolation method. After the polarization measurements, the corrosion conditions of the steel surface were observed using an optical microscope (OM, model: VHX-1000, Keyence, Osaka, Japan). Moreover, the EIS test was also performed on one sample after 1 h monitoring of open circuit potential, which was tested in the range of 10 mHz to 100 kHz.

3. Results and Discussion

3.1. Effects of Abrasive Blasting on the Steel Surface

The results of measuring the surface properties of the steel blasted with each abrasive using a laser microscope are shown in Figure 2. The color scale ranging from red to black indicates the distance between peaks and valleys. In the case of MST, irregular roughness features caused by plastic deformation were observed on the steel surface, as shown in Figure 2a. In particular, the surface of MST was found to be rougher than that of the MAL, and the valleys were particularly deep. On the other hand, on the surface of the MAL specimen shown in the laser microscope image in Figure 2b, grains of abrasive material appear. Furthermore, when the dark area on the MAL surface is compared with the color scale, no valleys seem to appear, suggesting the presence of abrasive residue.
Figure 3 shows the surface and cross-sectional SEM-EDX images, which were recorded to examine the particles on the steel surface and the shape of the abrasive residue. The principal components of each abrasive, i.e., steel grit (Fe, O) and alumina grit (Al, O), were analyzed via EDX. In the case of MST, shown in Figure 3a, irregular roughness features were observed. Further, several anchor patterns appear in the cross-sectional images. Although it was difficult to perform EDX analysis on the abrasive residue from the steel grit because the MST specimen and steel grit had the same components, no residue from the abrasive particles was observed by SEM on MST. Meanwhile, in the case of MAL, shown in Figure 3b, a large amount of residual abrasive was observed on the steel surface. Furthermore, the features of the surface roughness were difficult to observe owing to the abrasive residue present across the entire surface. The cross-sectional images reveal that the valleys in the surface roughness created by the blasting treatment and the broken abrasives were embedded in the anchoring pattern. Further, the EDX mapping results confirm that O and Al were distributed in these same locations, which were assumed to be Al2O3, which is the principal component of alumina grit. This finding proved that alumina grit residue was distributed over the entire surface of the specimen.
The surface roughness was quantified in terms of linear and areal roughness parameters, as presented in Table 4. The trends in Ra, Rq, and Rz, which are the magnitudes of the linear roughness parameters, followed MAL < MST for all values of Sa and Sz, which are the areal roughness parameters. Meanwhile, among the spacing parameters, RSm showed a trend opposite to those of the aforementioned parameters, and comparing the abrasives showed an increasing trend in the order of MST < MAL.
The sharper the abrasive particle, the larger the impact energy [10] and roughness [16]. The microscopic images in Figure 1 show that the edges of the alumina grit particles were sharper and more acutely angled than those of the steel grit. The shape factor (SF) of the abrasive particles can be expressed by the following equation [16]:
SF = 4πA/P2
where P is the overall perimeter (μm), and A is the projected area (μm2) of the abrasive; SF values close to 1 indicate a round shape, whereas SF values close to 0 indicate a sharp shape. The SF values of steel grit and alumina grit were 0.719 and 0.735, respectively. Thus, sharper particles imparted higher roughness, which is consistent with the findings of Desale et al. [16].
Furthermore, the higher the specific gravity and density of the abrasive, the larger the grinding force. The impact energy E of the abrasive can be expressed by Equation (4):
E = 1/12πd3ρv2
where d is the average particle diameter (m), ρ is the density (kg/m3), and v is the velocity (m/s) of the abrasive [8,21]. Because both abrasives in this study had a diameter d = 425 μm, d was approximately identical for the two abrasives. Thus, assuming that v was also constant, only ρ affected E. Consequently, because the specific gravity and the apparent density of the abrasives are lower for alumina grit than for steel grit, the impact energy and grinding force for alumina grit are also lower. This explains why the roughness parameters, Ra, Rq, and Rz, were higher for MST than those for MAL.
However, the alumina grit used to treat MAL is non-metallic. Thus, when the abrasive particles were broken into finer pieces when they collided with the surface, these abrasive particles were easily buried and remained in the valleys on the roughened steel surface. Thus, RSm, the mean width of the roughness features, increased.
The results of the DB analysis of roughness from the cross-sectional SEM images of the steel specimens are shown in Figure 4. The fractal dimension DB is a value that can vary within the limits 1 < DB < 2. A DB value approaching 2 means the evaluated surface is substantially irregular. The red line shows the roughness measured using a laser microscope, and the black line excluding the abrasive residue shows the actual roughness of the steel. As shown in Figure 4a, when measuring a surface with a laser microscope, it is not possible to avoid measuring complex roughness features such as anchor patterns on the steel surface because the surface is measured vertically with respect to the specimen. As shown in Figure 4b, because of the residual abrasive, the laser microscope measurements are smaller for MAL than those for MST; however, the actual roughness excluding the abrasive is high, and the DB value is large. Because the abrasive material remains in the anchor patterns and valleys of the surface roughness generated by the blasting treatment, and the roughness measured with a laser microscope also includes the abrasive material, the grinding material remaining on the surface affects both the roughness formation and its measurement.

3.2. Mechanical Properties of Blast-Treated Surfaces

The roughness and abrasive residual amount were adjusted by blasting at 30°, 60°, and 90°, and the results are listed in Table 5. An area of 4 mm × 3 mm was analyzed, and the area ratio of each element was calculated to quantify the residual degree of the abrasive. As shown in Table 5, the Ra, RSm, and the actual roughness DB of the steel specimens increased as the blast angle increased for both abrasive types. For the same angle, Ra and RSm of MST are greater than those of MAL, but DB is lower. In addition, in the case of MAL, the residual amount of abrasive increased with the increasing blast angle.
Adhesion tests were performed to examine the mechanical properties of the blast-treated steel surfaces as a function of the blasting conditions. To compare the behavior of the surface roughness and grinding material, a dolly was directly attached to the surface of the painted steel and subjected to an adhesion test. In addition, an unpainted steel specimen was tested for comparison with the painted steel plates. A tensile load was applied perpendicular to the surface being tested, and the adhesion strength was determined as the maximum load before failure. The area of adhesion was then observed; less than 50% was regarded as a success; otherwise, the test was considered to be a failure. The failure type was either adhesive failure or a combination of adhesive and cohesive failure, which indicates that the maximum failure strength represents the strength of the adhesion.
The adhesion strength according to blasting conditions is shown in Figure 5 for unpainted steel. Regardless of the abrasive material, the larger the blasting angle, the higher the adhesion strength. The adhesion strength of MST was less than that of MAL under each condition. In addition, the difference between the results of the three specimens of MAL was smaller than that of MST. However, in the case of 90° angle for the MAL, the adhesion was weaker in one test than in the other two tests. Figure 6 shows the conditions of the broken surface after the adhesion test. All blasting conditions except for the angle of 90° of MAL resulted in adhesion separation between substrates and adhesives. In the case of MAL blasted at 90°, separation occurred between adhesives/dolly. Thus, the failure mode of the 90° MAL specimen was found to be different from that of the other specimens, as the adhesion strength at the substrate/adhesive interface was greater than that between the adhesive and the dolly.
The positive correlation between the roughness Ra measured by the laser microscope and adhesion strength is shown in Figure 7. Regardless of the grinding medium, there is a high linear correlation, with a coefficient of 0.8 or more. The roughness of MAL, including the contribution from abrasive materials, is lower than that of MST; however, its adhesion strength was approximately 1.4 times higher than that of MST. Thus, the abrasive residue had a greater effect on adhesion than on roughness.
Figure 8 explains the failure mechanism and represents how the surface condition affects the adhesion strength. To evaluate how the anchor pattern and microscale surface condition affect adhesion, the fractal dimension of the substrate DB and that of the adhesive DB′ were calculated separately. The red and black lines represent DB′ and DB, respectively. As shown in Figure 8a, the adhesive and substrate are well attached to the rough anchor pattern, and DB′ is equal to 1.07, whereas DB is 1.13. As shown in Figure 8b, particles of the grinding material remaining on the steel surface and adhesive are well attached, and the values of DB′ and DB are 1.04 and 1.11, respectively. Comparing the differences between DB′ and DB for MST and MAL, which are 0.06 and 0.07, respectively, indicates the interlocking of the adhesive with the substrate.
As the blasting angle increases, the roughness increases and forms an uneven and complex surface. This suggests that the adhesion increases because the surface area provides more bonding points for the paint molecules of the adhesive. As broken particles of the abrasive material remaining on the surface combine with the adhesive, they increase the molecular size of the adhesive, thereby increasing the binding strength owing to the uneven roughness. Therefore, the increase in roughness and the residual abrasive materials may improve adhesion. Furthermore, the adhesion strength of MAL is greater than that of MST, indicating that the presence of alumina residue has a greater effect on adhesion than does the roughness.
The conditions of the fracture surface after the adhesion tests on the painted steel are shown in Figure 9. Under all conditions, regardless of blasting conditions, since the adhesion between the substrate and the coating is much greater, the detachment occurred firstly inside the coating itself.

3.3. Electrochemical Properties of Blast-Treated Surface

Electrochemical measurements were performed to investigate the relationship between the corrosion characteristics and the roughness and abrasive residue on the surface of blasted steel. The polarization curves recorded after immersion in a 3.5 wt% NaCl solution are shown in Figure 10. The parameters of the electrochemical characteristics obtained from these curves are listed in Table 6. Surface and cross-sectional images of the steel after immersing the blasted steel in a 3.5 wt% NaCl solution are shown in Figure 11 and Figure 12, respectively. In the case of MST, as the angle increased, icorr increased, whereas both Ecorr and icorr decreased in the case of MAL. In addition, for the same angles, the parameters of MST were larger than those of MAL. This suggests that the higher the roughness, the greater is Ecorr. Because Ecorr increases proportionally, it does not change the slope of the polarization curve. Meanwhile, icorr is related to the reaction area of the electrode [22]. The icorr of MAT increases as the roughness decreases. However, according to the MAL results, as the roughness increases and the amount of residual abrasive materials remaining on the surface increases, and the icorr decreases. Therefore, it is considered that the icorr decreased because the reaction area of the electrode decreased as the roughness decreased and the residual abrasive material increased.
According to the corrosion conditions of the steel surface, as shown in Figure 11, MST was corroded across the entire surface, whereas in the case of MAL, the parts with no abrasive residue corroded. This is because Al2O3 has excellent corrosion resistance [23,24]. Therefore, the residual alumina grit provided some parts of the steel surface with corrosion resistance [24,25]. In the case of MAL, the electrode reaction area was probably smaller than that of MST owing to the abrasive residue on MAL. Regardless of the abrasive, however, the roughness increased as the blasting angle increased; thus, the electrode reaction area increased. However, in the case of MAL, the amount of residual abrasive materials increased as the roughness increased, which reduced the electrode reaction area of the electrode. Therefore, the increased roughness and enhanced amount of abrasive residue also led to better corrosion resistance. In the case of MST, as shown in Figure 12a, corrosion products can be observed along cracks under the steel surface, whereas in the case of MAL, as shown in Figure 12b, no corrosion appears in areas where abrasives remain deeply embedded in the steel surface. Regardless of the abrasive, the surface of the steel is plastically deformed by blasting treatment. Surface cracking accelerates corrosion by generating a deformed, unstable surface owing to plastic deformation. The blast energy increases as the angle increases, thus increasing the surface roughness while cracking occurs. In turn, these cracks facilitated electrolyte penetration, enabling corrosion at the bottom of the surface, which is called gap corrosion. Therefore, the corrosion resistance was reduced because of cracks on the surface. However, in the case of MAL, the residual grinding material is densely embedded in the roughness features on the steel surface, thus preventing the electrolyte from penetrating cracks and delaying corrosion.
Figure 13 shows Nyquist plots from the EIS characterization of the blasted steel plates after 1 h of immersion. The MI specimen without blasting showed a significantly larger semicircle diameter than the specimens blasted with abrasives. In the case of MST, the diameter of the semicircle became smaller as the blasting angle increased. On the other hand, in the case of MAL, the diameter of the semicircle increased with the increasing blasting angle. The EIS parameters extracted using the equivalent circuit are listed in Table 7. The equivalent circuit is illustrated in Figure 14 [26,27], where Rs denotes the resistance of the solution, Rct denotes the charge transfer impedance, CPEdl denotes the electric double-layer capacity, and n denotes the exponential term. For MST, CPEdl increased as the blasting angle increased, whereas n and Rct decreased. On the other hand, for MAL, the opposite trend in the parameters was observed. The results in Table 5 suggest that the lower the roughness of the steel surface, the higher the corrosion resistance, which is consistent with the results reported by Ding et al. [13]. Furthermore, an increase in the amount of residual abrasive reduced the probability of corrosion. Therefore, the generation of roughness on the steel surface after blasting treatment decreased the corrosion resistance, but the agglomeration of residual abrasives improved it.

3.4. Electrochemical Properties and Electrochemical Properties of Blast-Treated Surface

Cross-sectional SEM-EDX images of the corroded CST and CAL specimens immediately after blasting are shown in Figure 15. Evidently, residues (corrosion products, salts, and abrasive materials) remained on the surface because of the limitations of abrasive blasting. This residue would facilitate corrosion, which would be accelerated in an offshore environment, thus affecting the adhesion and durability of the coating film.
Figure 16 illustrates the state of the blasted CST and CAL surfaces after 0 and 24 h in an environmental chamber at 30 °C and a relative humidity of 90%. The appearance of rust on the blast-cleaned CST surface is more severe, which indicates that alumina grit better inhibits corrosion than steel grit under the same environmental conditions. The corrosion area ratio of the specimens exposed for 24 h was also analyzed over an area of 50 mm × 30 mm. The corroded area ratios of CST and CAL were 36% and 27%, respectively. Thus, the corroded area of CST was 9% larger than that of CAL. The existence of abrasive residue on CAL decreased the initial corrosion rate with respect to that of CST. Thus, the alumina grit remaining on the surface was confirmed to be beneficial.
The fracture surface conditions after the adhesion tests on the unpainted and painted surfaces after 0 and 24 h of exposure for CST and CAL are shown in Figure 17 and Figure 18, respectively. The adhesion strength results according to blasting conditions are shown in Figure 19. After pull-off tests were performed, the adhesion strength results and failure types were analyzed separately. Overall, the failure type was the same under all conditions, namely, a combination of cohesive failure and adhesive failure. In addition, images of both CST and CAL corresponding to 0 h of exposure showed that adhesive remained on the dollies, which indicated that the adhesion to the substrates was larger than or approximately the same as the stress applied to the adhesive. Figure 17 shows that after 24 h of exposure, adhesive remained on both the substrate and dollies after the adhesion test. In addition, the fracture of the paint confirmed that, although this fracturing occurred inside the coating under all conditions, regardless of the blasting conditions, the fractures were separate from the position of rust debris. The visible rust on the substrates also corresponded to residual adhesive, with rust-colored areas on the dollies that were isolated or surrounded by a thin layer of adhesive. It was concluded that the initial failure started at the location of rust, and stress concentrations formed around the large (microscale) particles at the poles; thus, a cavity might grow by tearing the material at the inner surface with respect to the stress direction [28]. Therefore, the surface condition has a severe impact on the adhesion. During the 24 h interval, the adhesion decreased by 30% for CST and by more than 20% for CAL. CST exhibited a greater reduction in adhesion owing to the larger corrosion area. This finding confirmed that the alumina residue is beneficial in steel construction applications and increases adhesion as a corrosion inhibitor.
The effects of corrosion and the residual grinding materials remaining on the exposed surface of CST and CAL on the coating durability were evaluated through EIS experiments. According to reference [29,30,31], it represents the values |Z|f = 0.1 Hz and fb can be used as significant parameters to evaluate the coating film degradation quantitatively.
The EIS test was performed after immersing the specimens in 3.5 wt% NaCl solution for 24 h. Figure 20 shows the EIS spectrum and Bode plots. The impedance modulus value decreased to the range of 5–8 Ω cm2 in the case of CAL but decreased to 3–5 Ω cm2 in the case of CST. In particular, |Z|f = 0.1 Hz represents the coating film degradation index [29], which was smaller for CST than that for CAL, regardless of the exposure time, and it decreased when the exposure time was increased to 24 h. The larger the corroded area, the smaller the |Z|f = 0.1 Hz. The result exhibited that the larger the corroded area on the steel surface was characterized by lower the adhesion of the coating film, and more easily the coating film deteriorates.
The phase angle decreased rapidly for all surface conditions, regardless of the blasting conditions. This decrease is believed to be due to an increase in the capacitive behavior owing to the penetration of the electrolyte solution into the coating. The phase angle of 45° in the impedance spectrum is defined as the breakpoint frequency, and the peeling area increases for an increase in fb [30,31]. In the high- and medium-frequency regions and at fb, which was smaller for CAL than that for CST, regardless of the exposure time, and it increased when the exposure time was increased to 24 h. This result confirmed that an increase in the immersion time caused the coating to peel more rapidly for CAL than for CST. In addition, after 24 h of exposure, film peeling was observed in CST, as shown in Figure 21. This suggests that the electrolyte increases the corrosion area and causes swelling under the coating film by osmotic pressure, thereby increasing the adhesion degradation of the coating film. Therefore, the corrosion resistance of the paint is reduced. However, in the presence of residual grinding material, the adhesion between the steel and the paint was higher than that on the steel plate with no residue because the residual grinding material reduced the penetration and spread of the electrolyte. Therefore, the residual grinding material is proven to improve the corrosion resistance of the paint. It is difficult to completely remove corrosion products and salts owing to the limitations of the grinding material blasting treatment; thus, using alumina grit to increase the adhesive force between steel and paint is recommended for steel members in harsh or corrosive environments.

4. Conclusions

By blasting steel plates with different abrasive materials, the effects of the blast-treated steel surface properties, coating adhesion, and corrosion properties were investigated. In addition, the effects of corrosion products, salts, and grinding materials remaining on the blast-treated steel surface on the adhesion and corrosion resistance of the paint were clarified. As a result, the following conclusions were obtained:
(1)
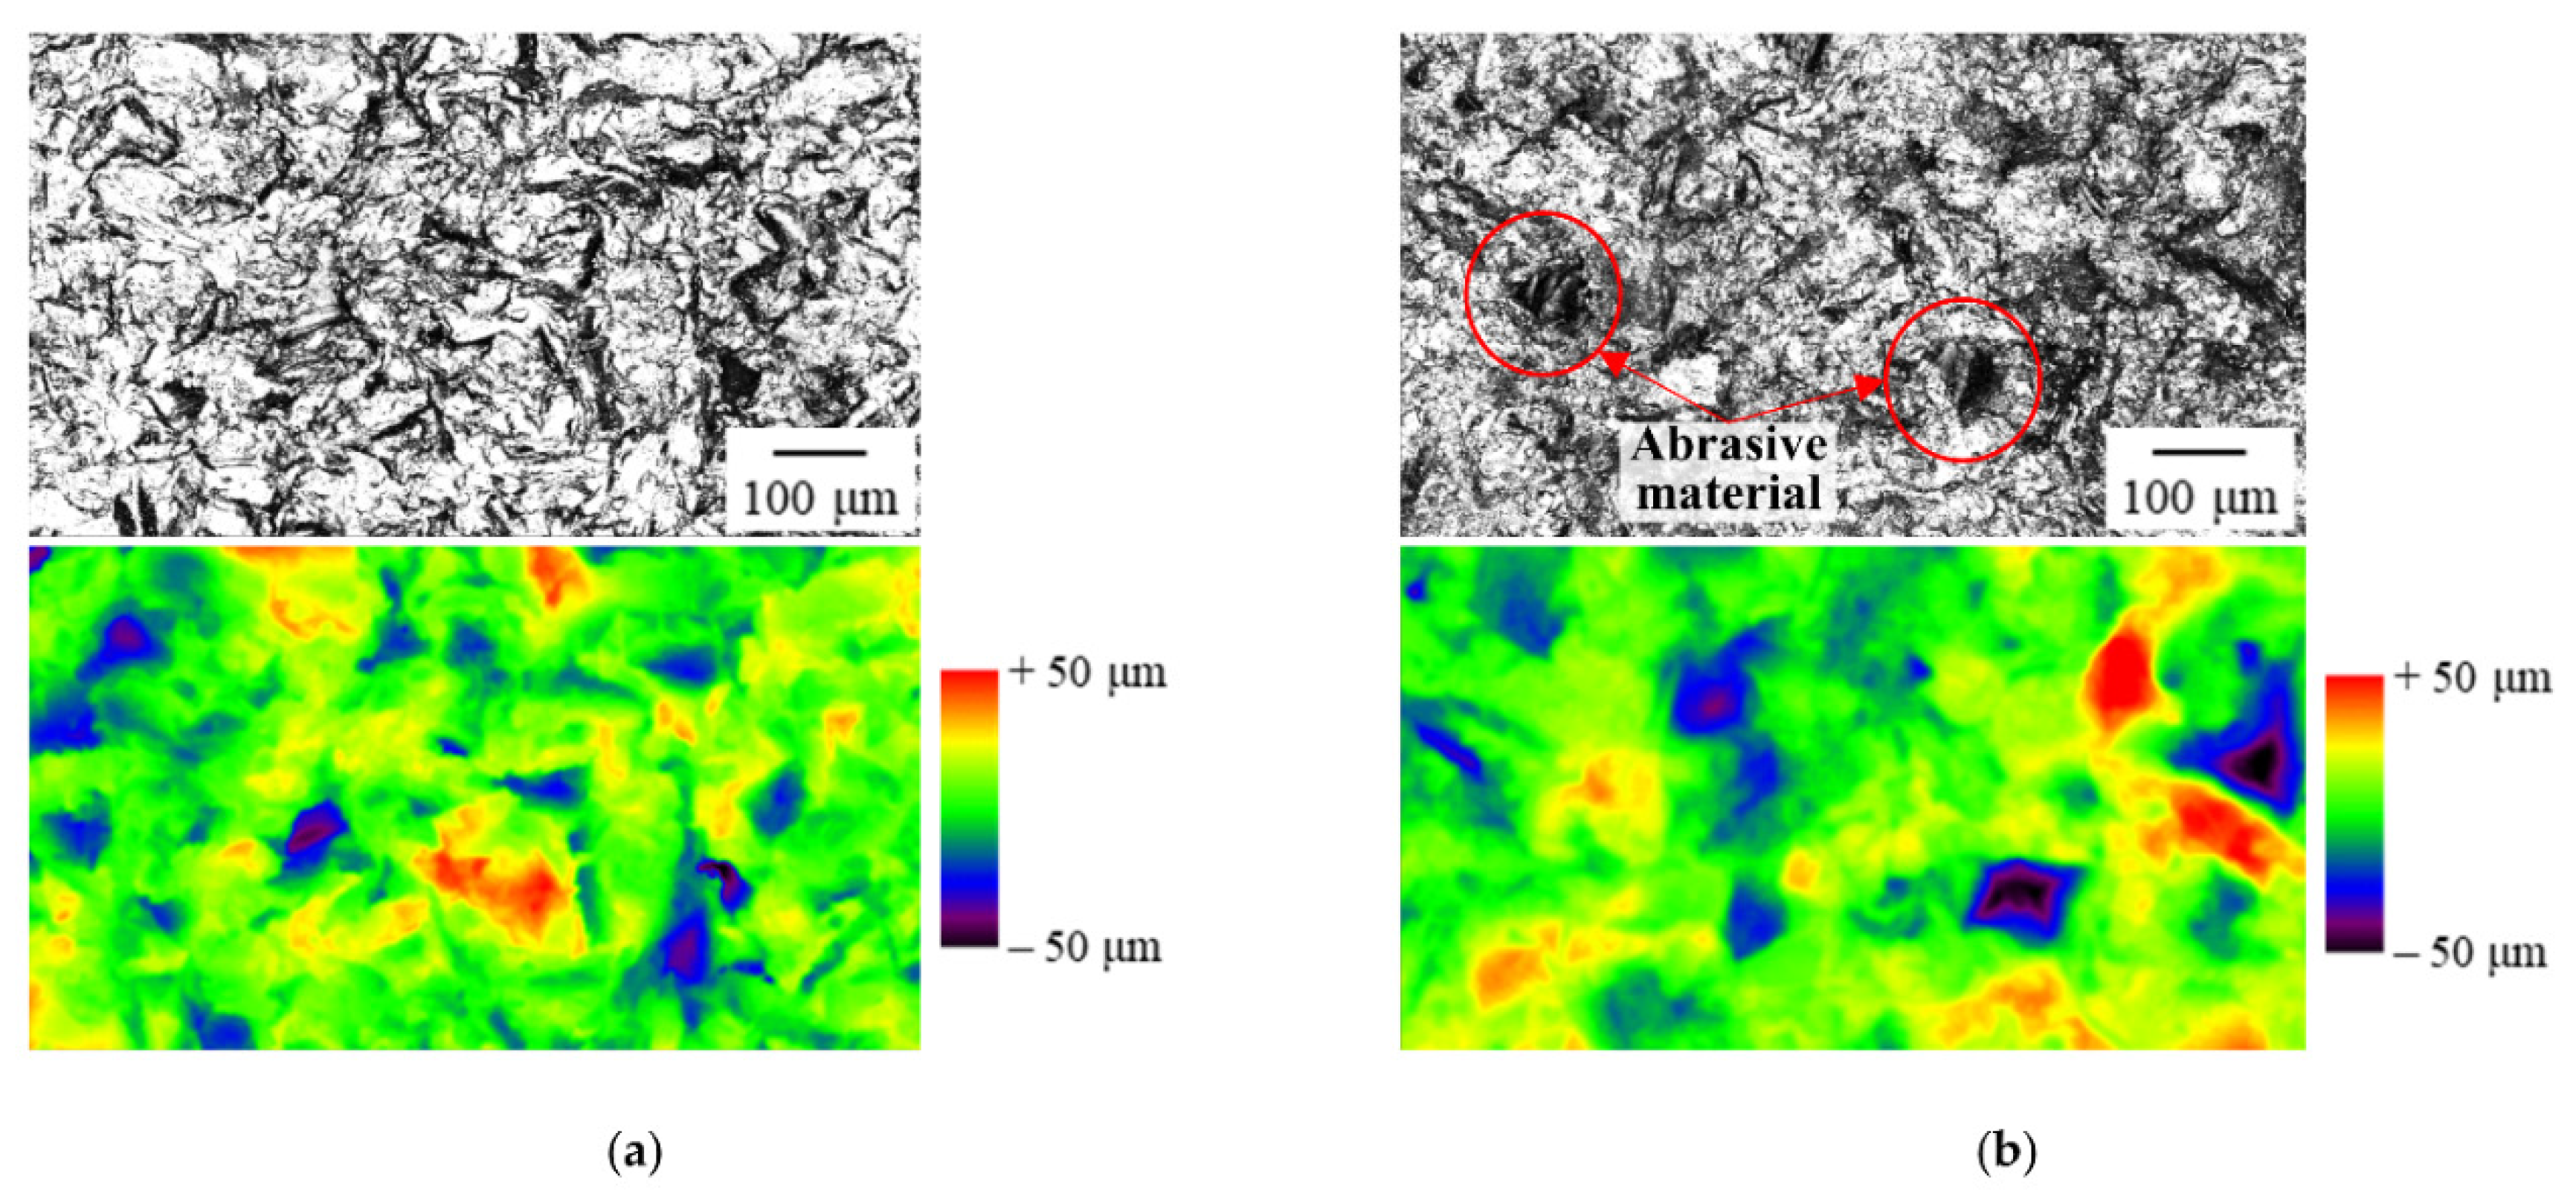
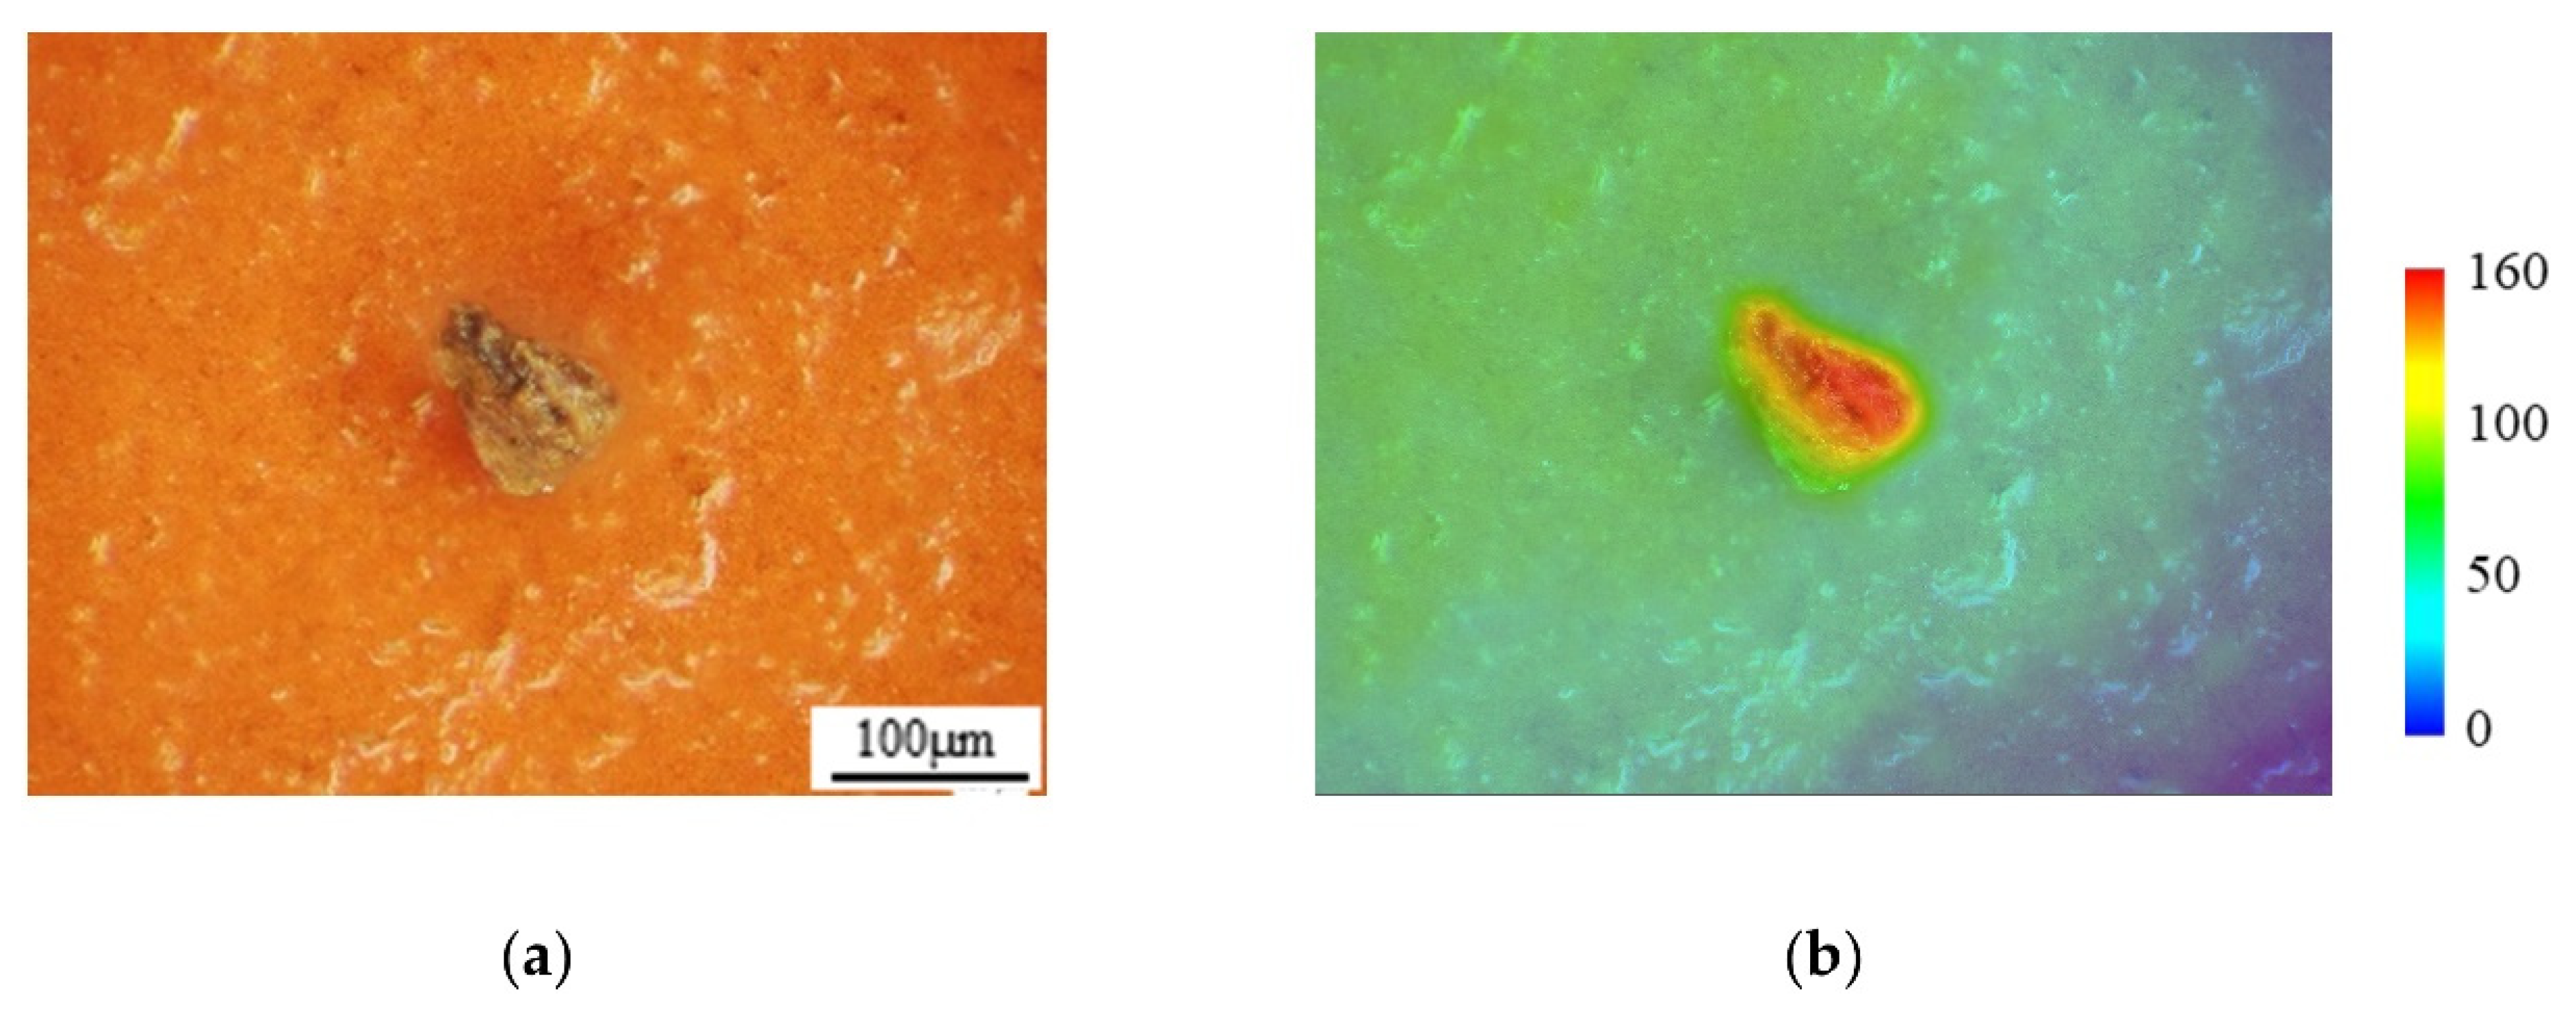
Abrasive blasting forms irregular roughness on the steel surface. Steel grit with sharp particles, a high specific gravity, and a high density more effectively increased the roughness of the steel surface than alumina grit. However, when specimens were blasted with alumina grit, some residual abrasive remained on the steel surface. For both types of abrasive material, the roughness increased as the blast angle increased, and the amount of residual abrasive also increased in the case of alumina grit. Based on the cross-sectional observation, the roughness of the actual steel was higher and more complex when MAL than that of MST. This finding suggested that the residual abrasive material on the steel surface had a significant effect on the measurement of surface roughness.
(2)
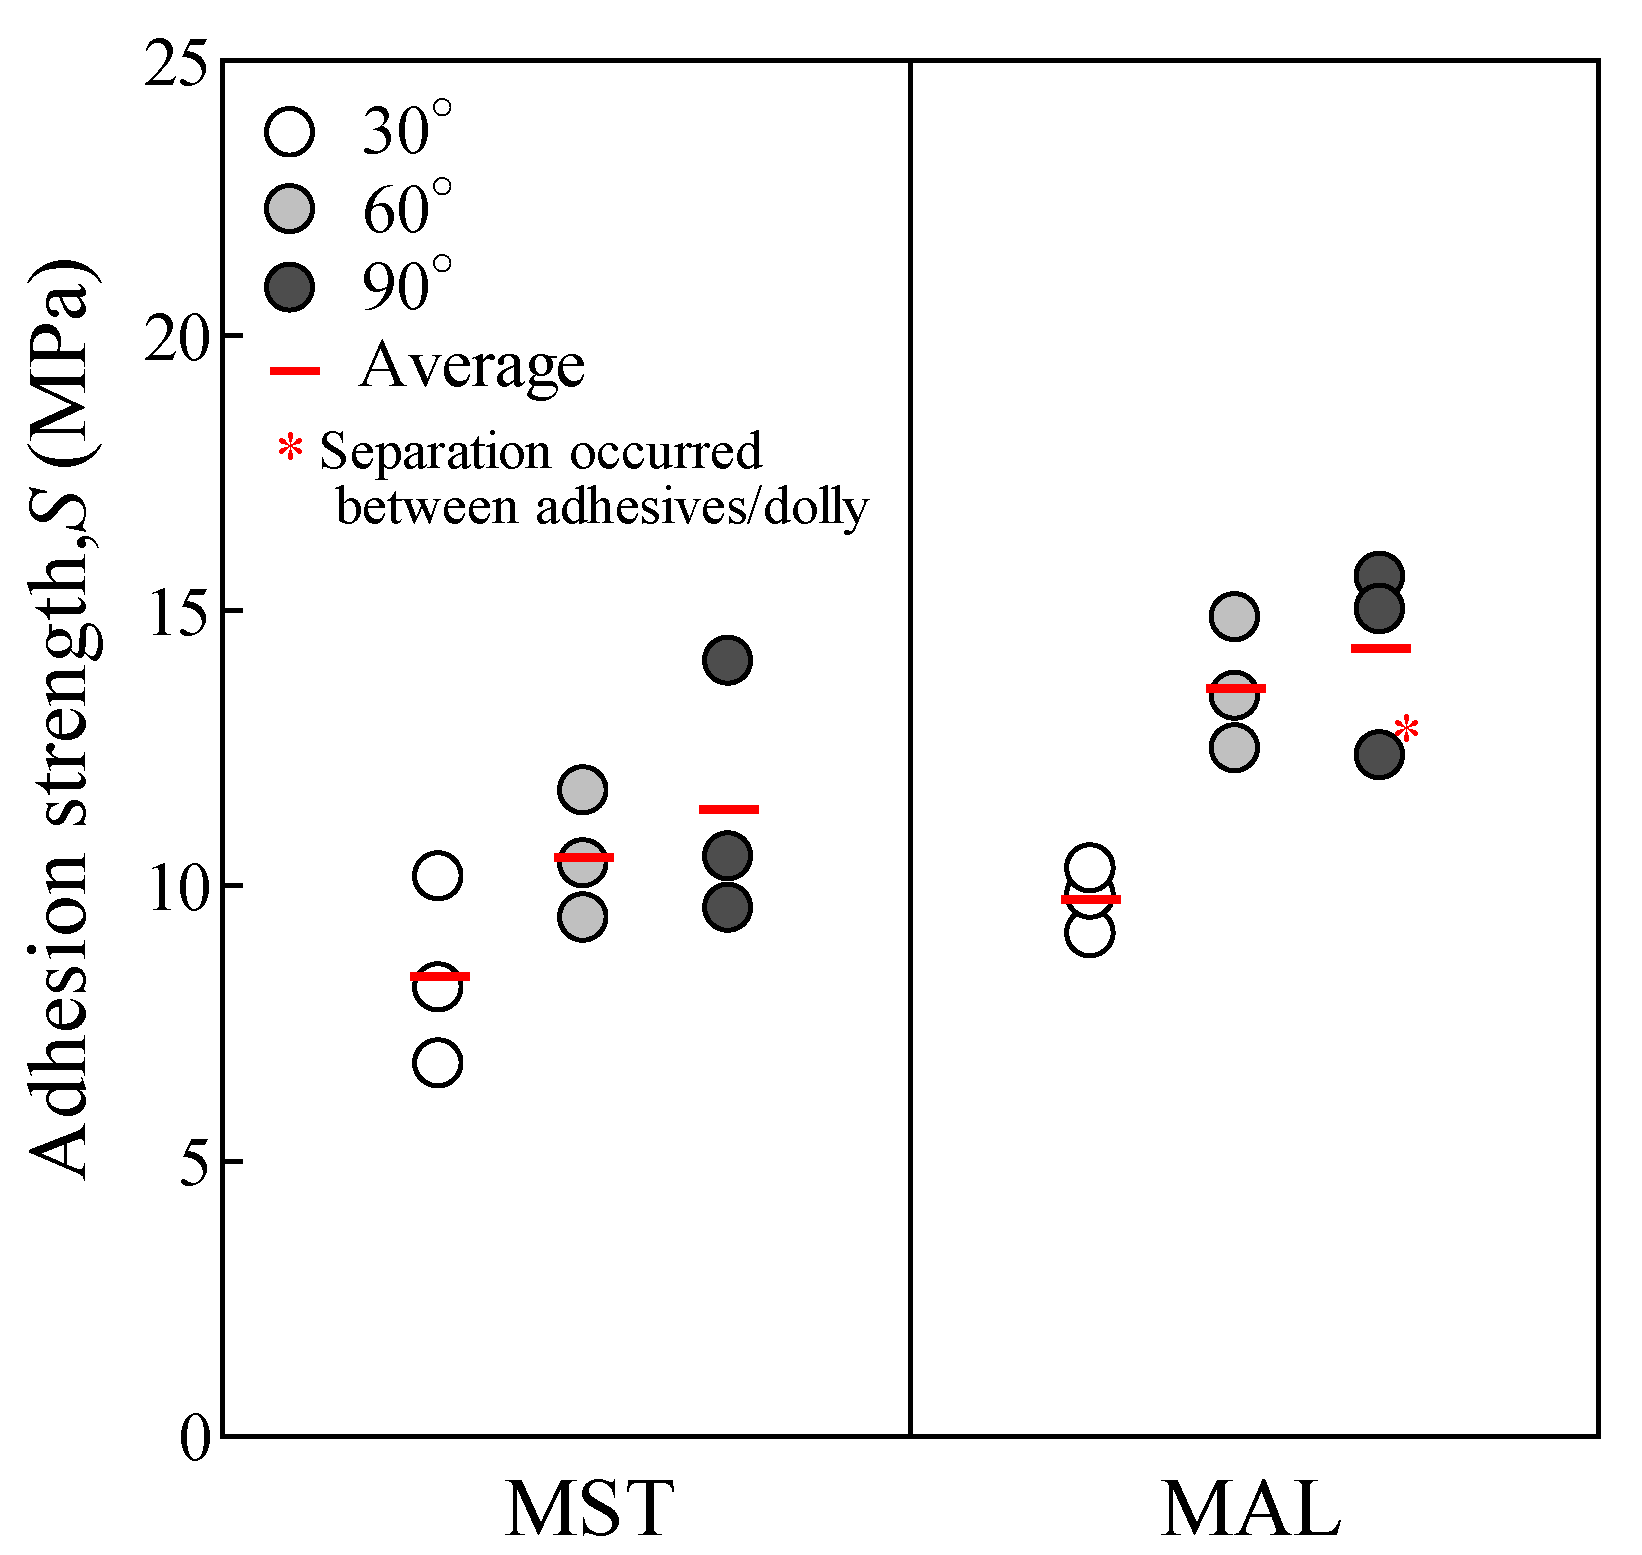
The tested adhesion strength showed that as the surface roughness of the steel increased and the abrasive residue increased, the surface area available to combine with the adhesive increased, thereby improving adhesion. Regardless of the abrasive material, a highly linear correlation was observed between the surface roughness and adhesion strength, with a correlation coefficient above 0.9. The roughness features of MAL included some abrasive material; although its roughness was lower than that of MST, its adhesion strength was approximately 1.4 times higher. Thus, the particles of broken abrasive material remaining on the surface combine with the adhesion strength to increase the molecular size of the adhesive, thereby increasing the binding strength owing to the uneven roughness.
(3)
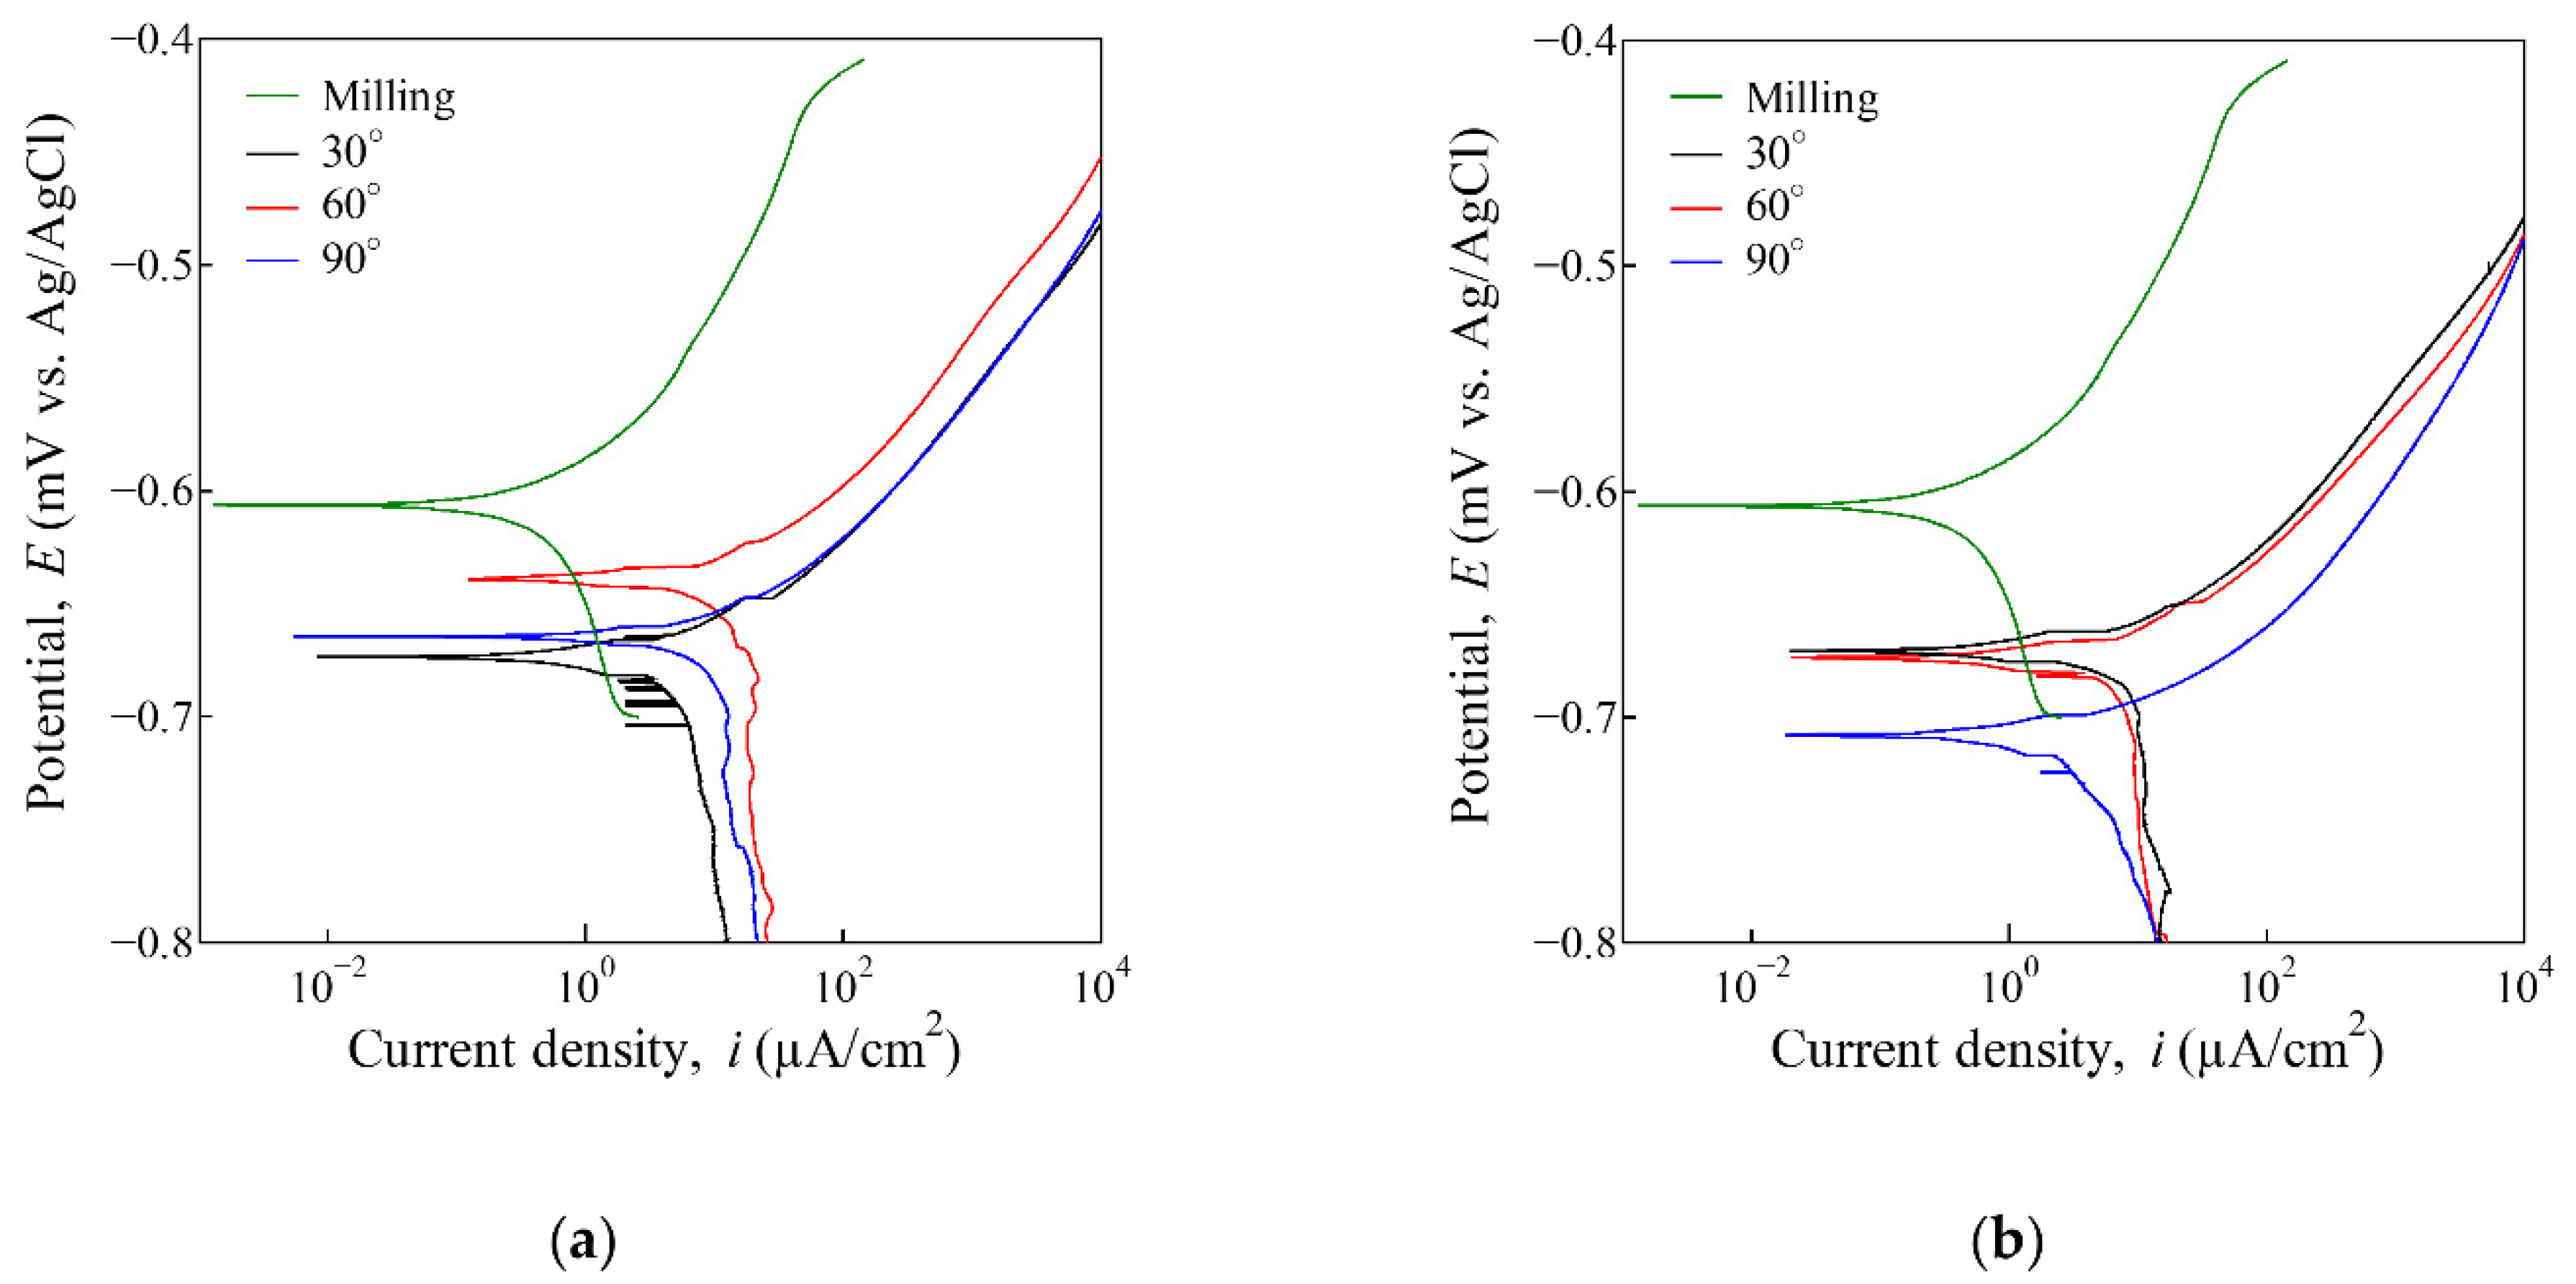
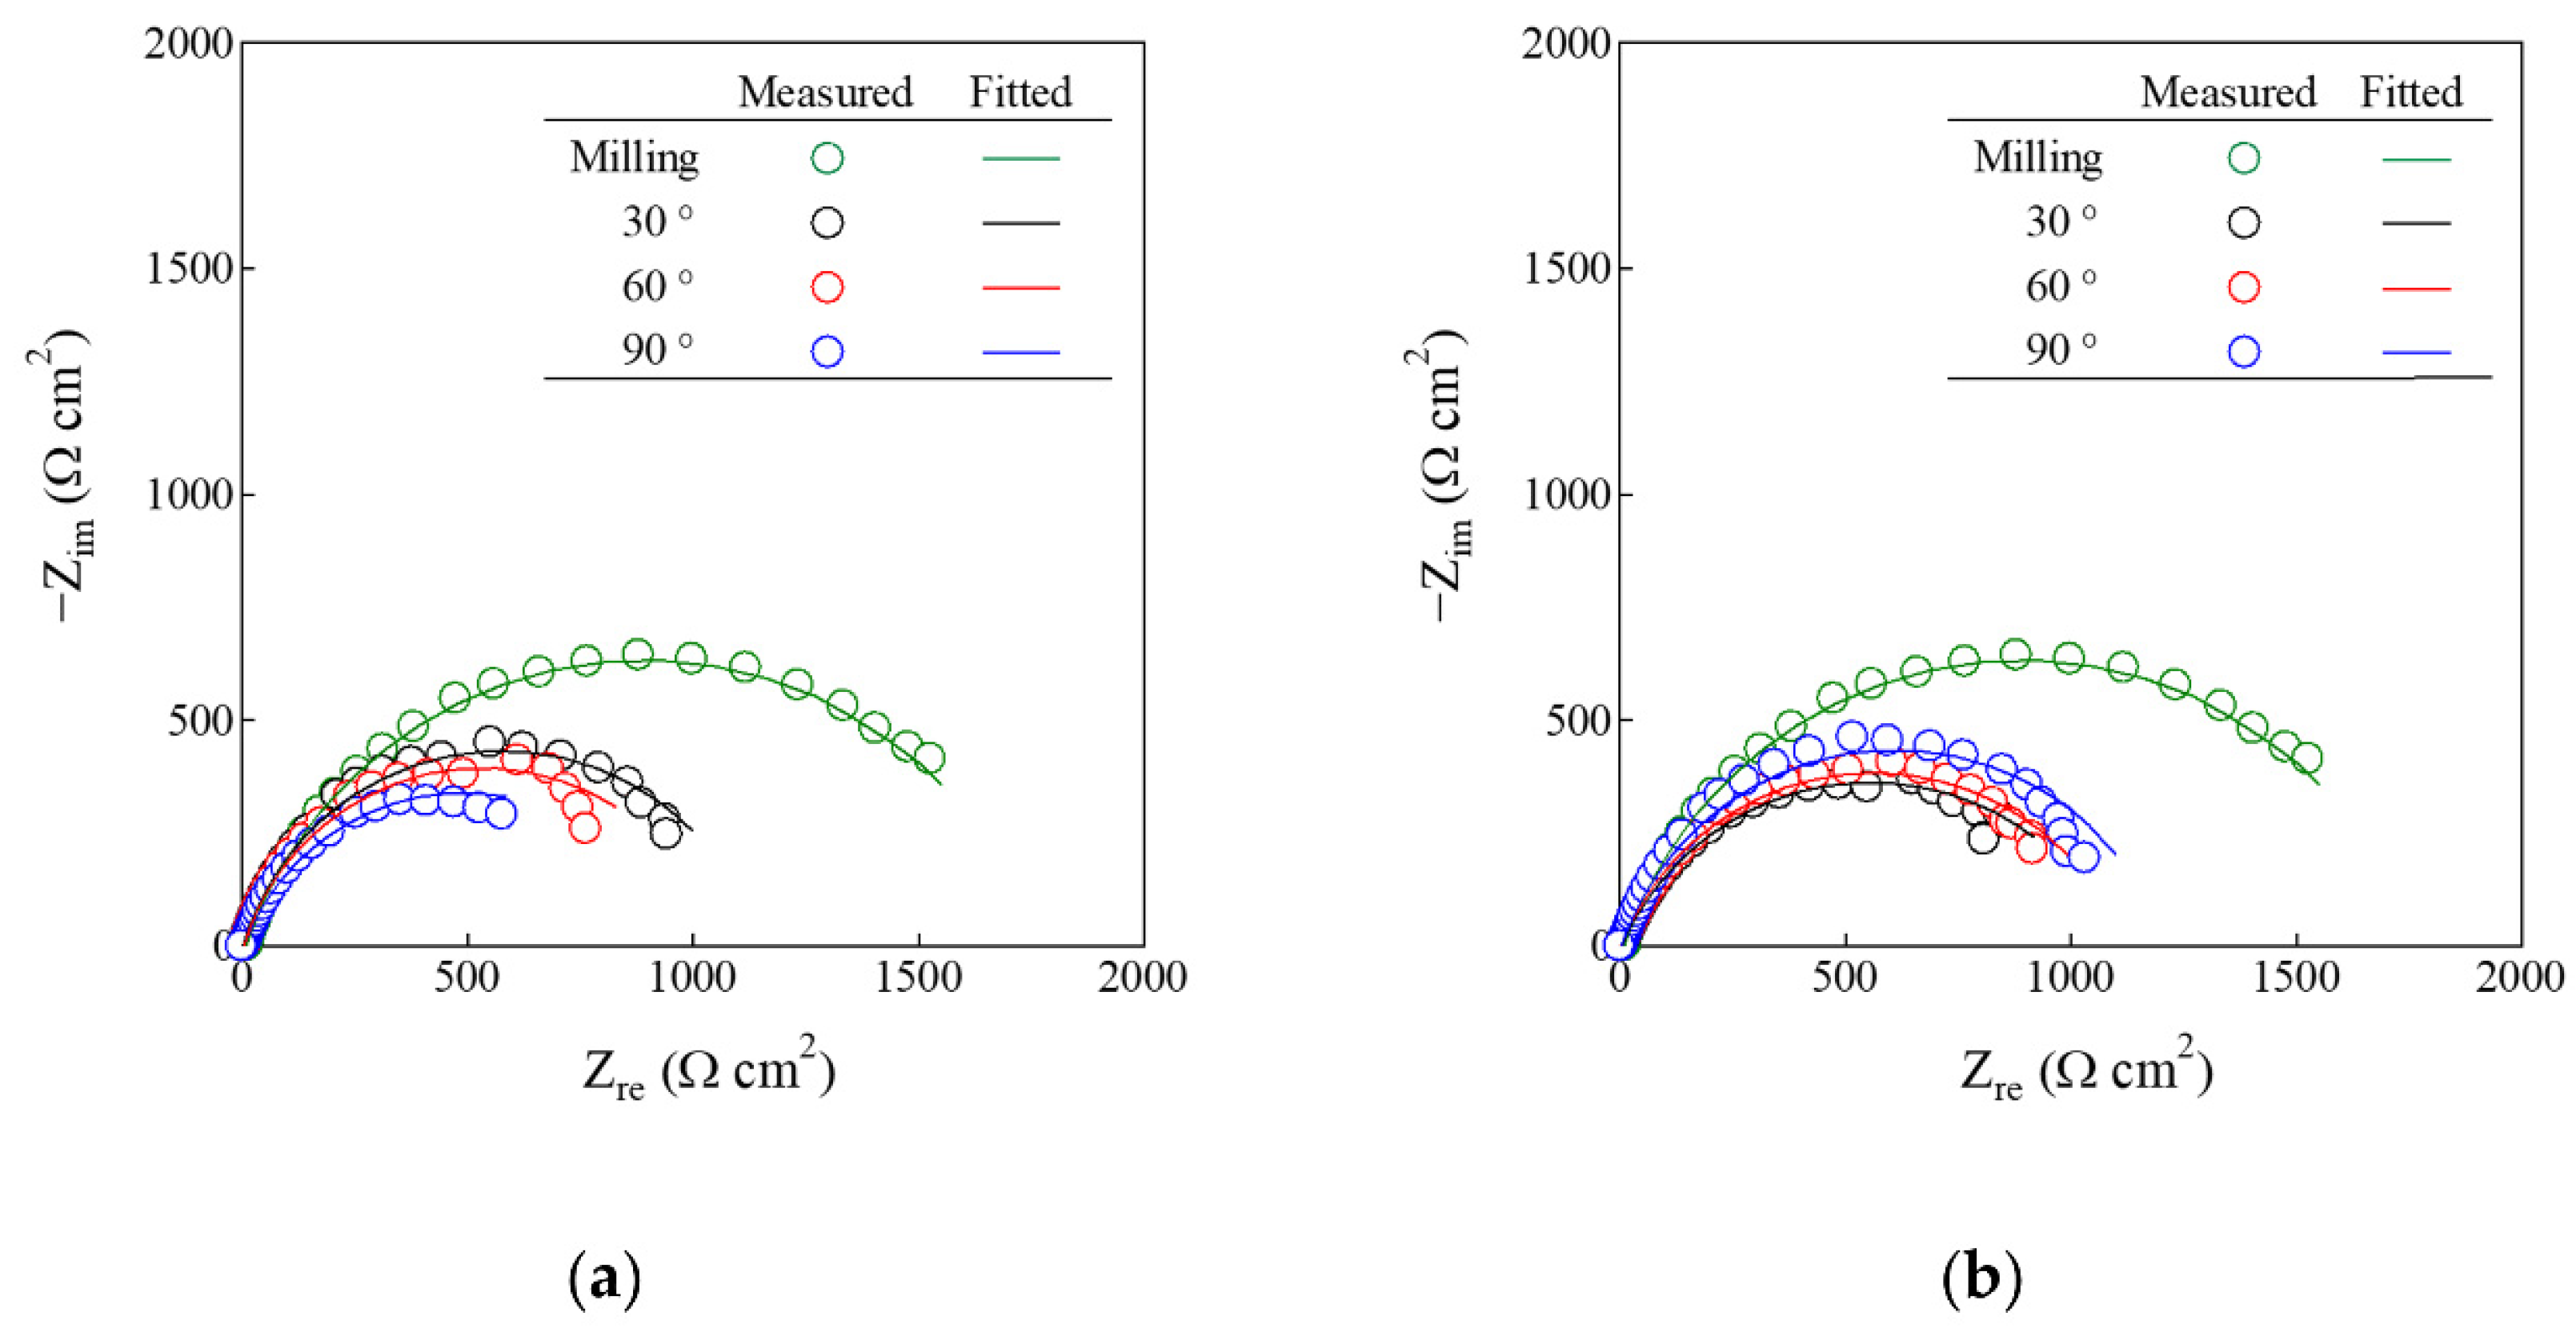
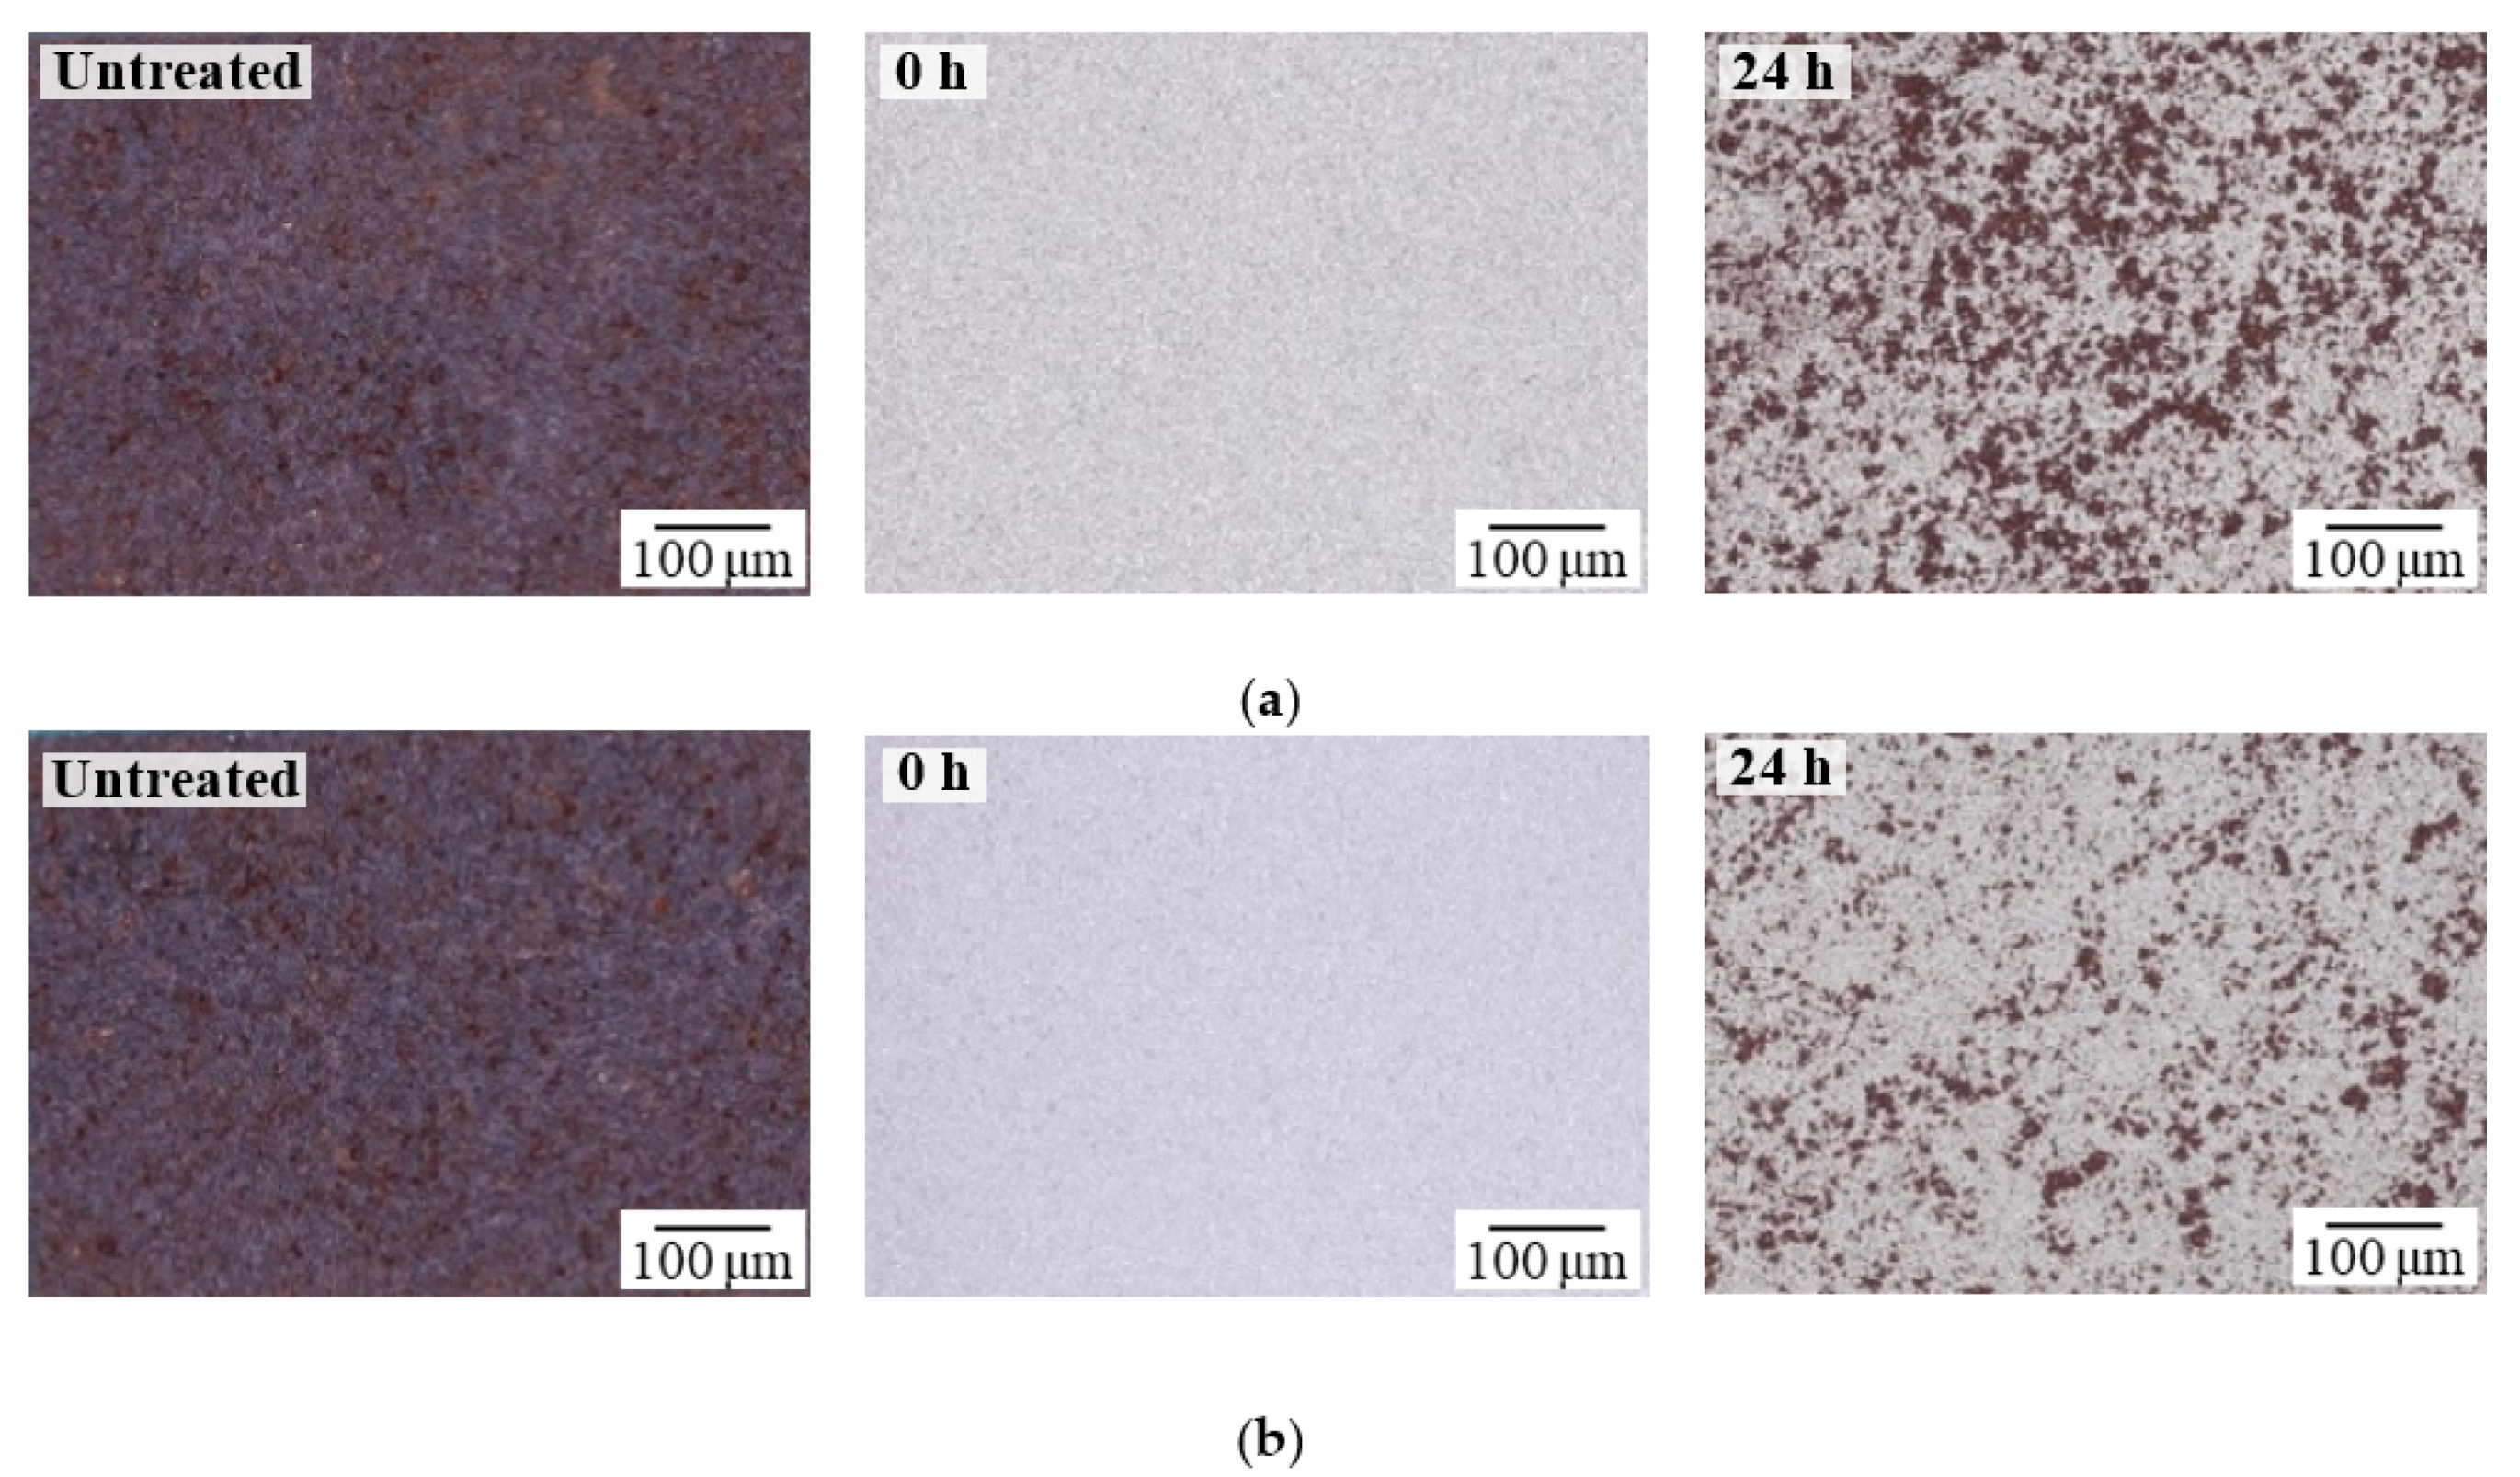
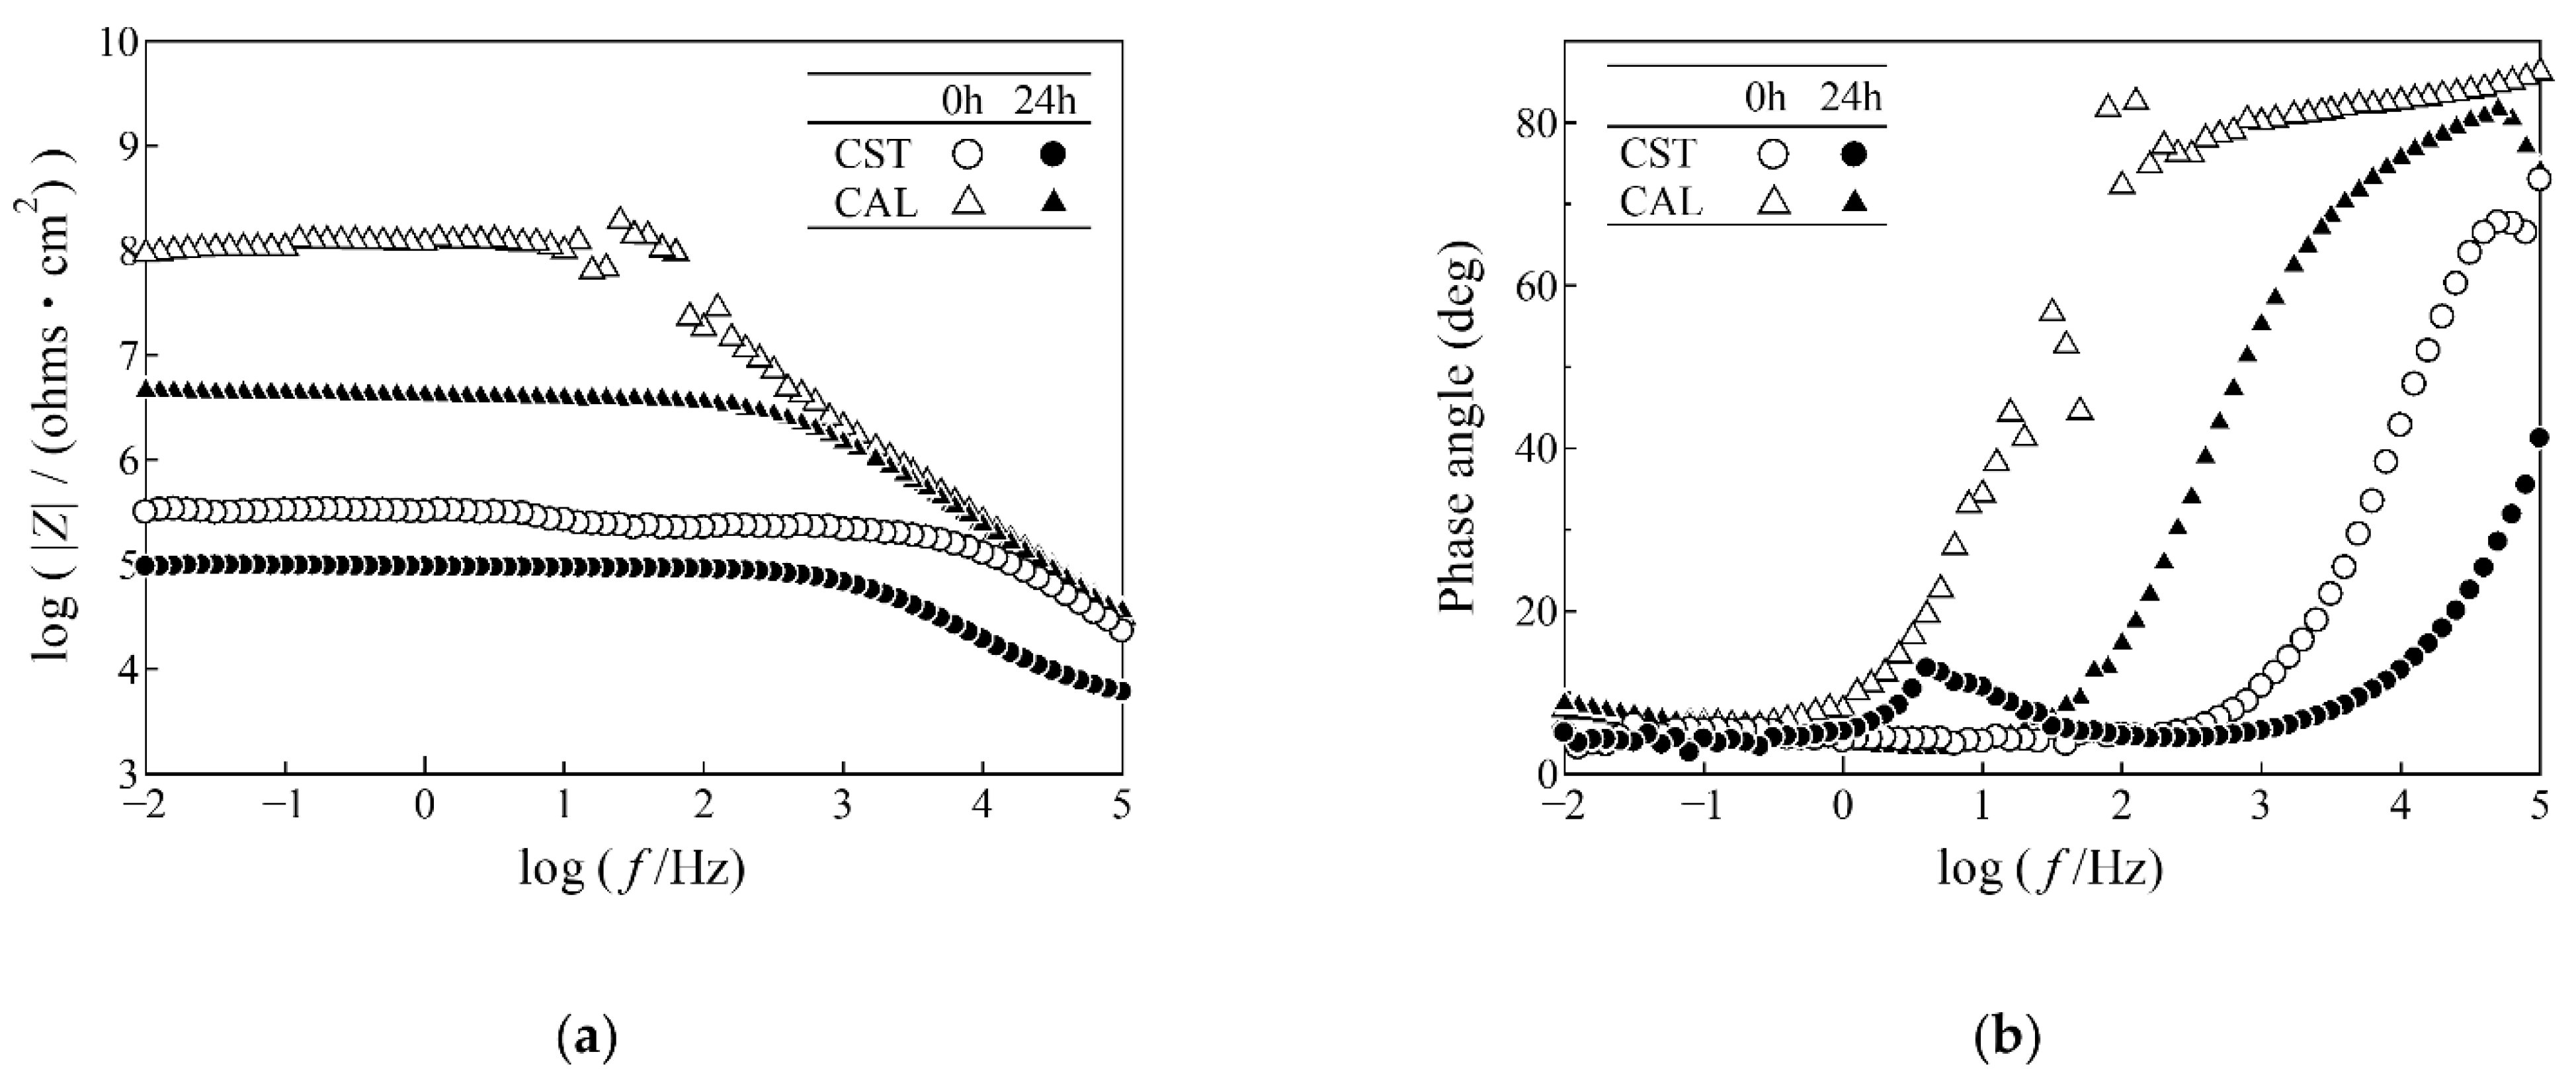
As observed in electrochemical testing, the lower the roughness of the steel surface and the greater the amount of abrasive remaining on the surface, the smaller the corrosion reaction area of the steel surface, as the abrasive residue decreased the penetration of ions. Blasting the steel surface using alumina grit provided better corrosion resistance than using steel grit. For the corroded steel plates after blast treatment and paint coating, the residue positively affected the corrosion resistance of paint because it reduced the penetration of electrolytes and the diffusion of corrosion. Corrosion was suppressed by residual abrasive materials, and increased adhesion and paint adhesion. Therefore, this finding suggests that alumina grit should be used where issues of severe corrosion persist.

Author Contributions

A.K.: Resources, Methodology, Writing—original draft, Writing—review & editing, Visualization. S.K.: Conceptualization, Supervision. M.Y.: Writing—review and editing. All authors have read and agreed to the published version of the manuscript.

Funding

This research was funded by JSPS KAKENHI under Grant Numbers JP19K15074 and JP19H02227. The financial support from the Kyushu Regional Management Service Associa-tion is acknowledged.

Institutional Review Board Statement

Not applicable.

Informed Consent Statement

Not applicable.

Data Availability Statement

All data included in this paper are available upon request by contact with the corresponding author.

Conflicts of Interest

The authors declare no conflict of interest.

References

  1. Kainuma, S.; Yang, M.; Ishihara, S.; Kaneko, A.; Yamauchi, T. Corrosion protection of steel members using an Al-Zn base sacrificial anode and fiber sheet in an atmospheric environment. Constr. Build. Mater. 2019, 224, 880–893. [Google Scholar] [CrossRef]
  2. Rudawska, A.; Danczak, I.; Müller, M.; Valasek, P. The effect of sandblasting on surface properties for adhesion. Int. J. Adhes. Adhes. 2016, 70, 176–190. [Google Scholar] [CrossRef]
  3. Hagen, C.M.H.; Hognestad, A.; Knudsen, O.; Sørby, K. The effect of surface roughness on corrosion resistance of machined and epoxy coated steel. Prog. Org. Coat. 2019, 130, 17–23. [Google Scholar] [CrossRef]
  4. Amada, S.; Satoh, A. Fractal analysis of surfaces roughened by grit blasting. J. Adhes. Sci. Technol. 2000, 14, 27–41. [Google Scholar] [CrossRef]
  5. Webb, S.S. Belief Driven Autonomous Manipulator Pose Selection for Less Controlled Environments. Ph.D. Thesis, University of New South Wales Australia, Sydney, NSW, Australia, 2008. [Google Scholar]
  6. Schmidt, M.; Merklein, M.; Bourell, D.; Dimitrov, D.; Hausotte, T.; Wegener, K.; Overmeyer, L.; Vollertsen, F.; Levy, G.N. Laser based additive manufacturing in industry and academia. CIRP Ann. 2017, 66, 561–583. [Google Scholar] [CrossRef]
  7. Maková, I.; Sopko, M. Effect of blasting material on surface morphology of steel sheets. Acta Metall. Slovaca 2010, 16, 109–115. [Google Scholar]
  8. Momber, A. Blast Cleaning Technology; Springer: Berlin/Heidelberg, Germany, 2013; Volume 53, ISBN 9788578110796. [Google Scholar]
  9. Tshimanga, N.L.; Combrink, G.A.; Wa Kalenga, M. Surface morphology characterization of grade 304L stainless steel after abrasive blasting. Mater. Today Proc. 2020, 38, 544–548. [Google Scholar] [CrossRef]
  10. Achtsnick, M.; Hoogstrate, A.M.; Karpuschewski, B. Advances in high performance micro abrasive blasting. CIRP Ann.-Manuf. Technol. 2005, 54, 281–284. [Google Scholar] [CrossRef]
  11. Achtsnick, M.; Geelhoed, P.F.; Hoogstrate, A.M.; Karpuschewski, B. Modelling and evaluation of the micro abrasive blasting process. Wear 2005, 259, 84–94. [Google Scholar] [CrossRef]
  12. Harris, A.F.; Beevers, A. Effects of grit-blasting on surface properties for adhesion. Int. J. Adhes. Adhes. 1999, 19, 445–452. [Google Scholar] [CrossRef]
  13. Ding, L.; Torbati-Sarraf, H.; Poursaee, A. The influence of the sandblasting as a surface mechanical attrition treatment on the electrochemical behavior of carbon steel in different pH solutions. Surf. Coat. Technol. 2018, 352, 112–119. [Google Scholar] [CrossRef]
  14. Liebhard, M.; Levy, A.V. Effect of erodent particle characteristics on the erosion of metals. Wear Mater. Int. Conf. Wear Mater. 1991, 1, 123–127. [Google Scholar] [CrossRef]
  15. Hadavi, V.; Moreno, C.E.; Papini, M. Numerical and experimental analysis of particle fracture during solid particle erosion, Part II: Effect of incident angle, velocity and abrasive size. Wear 2016, 356–357, 146–157. [Google Scholar] [CrossRef]
  16. Desale, G.R.; Gandhi, B.K.; Jain, S.C. Effect of erodent properties on erosion wear of ductile type materials. Wear 2006, 261, 914–921. [Google Scholar] [CrossRef]
  17. Leidheiser, H.; Musić, S.; McIntyre, J.F. The improved corrosion resistance of steel in water after abrasive blasting with alumina. Corros. Sci. 1984, 24, 197–201. [Google Scholar] [CrossRef]
  18. Mayer, P.; Dmitruk, A.; Kaczmar, J.W. Adhesion of functional layers based on epoxy and polyurethane resins for aluminum substrate. Int. J. Adhes. Adhes. 2021, 109, 102899. [Google Scholar] [CrossRef]
  19. Amada, S.; Yamada, H. Introduction of fractal dimension to adhesive strength evaluation of plasma-sprayed coatings. Surf. Coat. Technol. 1996, 78, 50–55. [Google Scholar] [CrossRef]
  20. Saborowski, E.; Steinert, P.; Dittes, A.; Lindner, T.; Schubert, A.; Lampke, T. Introducing fractal dimension for interlaminar shear and tensile strength assessment of mechanically interlocked polymer-metal interfaces. Materials 2020, 13, 2171. [Google Scholar] [CrossRef]
  21. Pyum, S.I.; Lee, W.J. The effect of prior Cl ion on pit initiation. Corr. Sci. 2001, 43, 353–363. [Google Scholar]
  22. Zhang, Z.; Qian, Y.; Xu, J.; Zuo, J.; Li, M. Corrosion behaviors of Cr2AlC/α-Al2O3 composites in 3.5 wt. % NaCl aqueous solution. Ceram. Int. 2020, 46, 11846–11853. [Google Scholar] [CrossRef]
  23. Ralph, B.; Yuen, H.C.; Lee, W.B. The processing of metal matrix composites—An overview. J. Mater. Process. Technol. 1997, 63, 339–353. [Google Scholar] [CrossRef]
  24. Yasir, M.; Zhang, C.; Wang, W.; Xu, P.; Liu, L. Wear behaviors of Fe-based amorphous composite coatings reinforced by Al2O3 particles in air and in NaCl solution. Mater. Des. 2015, 88, 207–213. [Google Scholar] [CrossRef]
  25. Jamali, F.; Danaee, I.; Zaarei, D. Effect of nano-silica on the corrosion behavior of silicate conversion coatings on hot-dip galvanized steel. Mater. Corros. 2015, 66, 459–464. [Google Scholar] [CrossRef]
  26. He, S.; Wang, Z.; Hu, J.; Zhu, J.; Wei, L.; Chen, Z. Formation of superhydrophobic micro-nanostructured iron oxide for corrosion protection of N80 steel. Mater. Des. 2018, 160, 84–94. [Google Scholar] [CrossRef]
  27. Kovacı, H.; Bozkurt, Y.B.; Yetim, A.F.; Aslan, M.; Çelik, A. The effect of surface plastic deformation produced by shot peening on corrosion behavior of a low-alloy steel. Surf. Coat. Technol. 2019, 360, 78–86. [Google Scholar] [CrossRef]
  28. Fond, C. Cavitation criterion for rubber materials: A review of void-growth models. J. Polym. Sci. Part B Polym. Phys. 2001, 39, 2081–2096. [Google Scholar] [CrossRef]
  29. Kobayashi, H.; Yamashita, Y.; Hayashi, N.; Kataoka, Y.; Okido, M. Research Concerning the Correlation between the Phenomena of Coating Degradation in Steel Coated with Various Paints and Impedance Value. Zairyo-to-Kankyo 2015, 64, 82–90. [Google Scholar] [CrossRef] [Green Version]
  30. Potvin, E.; Brossard, L.; Larochelle, G. Corrosion protective performances of commercial low-VOC epoxy/urethane coatings on hot-rolled 1010 mild steel. Prog. Org. Coat. 1997, 31, 363–373. [Google Scholar] [CrossRef]
  31. Souto, R.M.; Fernández-Mérida, L.; González, S.; Scantlebury, D.J. Comparative EIS study of different Zn-based intermediate metallic layers in coil-coated steels. Corros. Sci. 2006, 48, 1182–1192. [Google Scholar] [CrossRef]
Figure 1. Micrograph of abrasive materials: (a) Steel grit; (b) Aluminum grit.
Metals 11 02065 g001
Figure 2. Blasted surface and color scale according to roughness measured by a laser microscope: (a) MST, (b) MAL.
Metals 11 02065 g002
Figure 3. SEM-EDX analysis of the surface and cross-section of the specimens subjected to blasting: (a) MST, (b) MAL.
Metals 11 02065 g003
Figure 4. Fractal dimension (DB) analysis of roughness from the SEM images of the cross-section of the blasted specimens: (a) MST, (b) MAL.
Metals 11 02065 g004
Figure 5. The results of adhesion strength.
Metals 11 02065 g005
Figure 6. Fracture surface of the unpainted steel after the adhesion test (MAL, Blasting angle 90°).
Metals 11 02065 g006
Figure 7. Relationship between surface roughness (Ra) and adhesion strength.
Metals 11 02065 g007
Figure 8. Fractal dimension (DB) analysis shows the mechanical interlock at the interface between the glue and the blasted substrate: (a) MST, (b) MAL.
Metals 11 02065 g008
Figure 9. Fracture surface of the painted steel after the adhesion test (Blasting angle 90°): (a) MST, (b) MAL.
Metals 11 02065 g009
Figure 10. Potentiodynamic polarization curves of the blasted specimens in 3.5 wt% NaCl solution: (a) MST, (b) MAL.
Metals 11 02065 g010
Figure 11. Microscopic images of the surfaces of the blasted specimens before and after immersing in 3.5 wt% NaCl solution: (a) MST, (b) MAL.
Metals 11 02065 g011
Figure 12. Microscopic images of the cross-section of the blasted specimens after immersing in 3.5 wt% NaCl solution: (a) MST, (b) MAL.
Metals 11 02065 g012
Figure 13. EIS measurements of the blasted specimens after immersing in 3.5 wt% NaCl solution for 1 h: (a) MST, (b) MAL.
Metals 11 02065 g013
Figure 14. Equivalent circuits.
Metals 11 02065 g014
Figure 15. SEM-EDX images on the cross-section of the blasted specimens: (a) CST, (b) CAL.
Metals 11 02065 g015
Figure 16. Surface morphologies of the blasted surfaces after 0 and 24 h exposure: (a) CST, (b) CAL.
Metals 11 02065 g016
Figure 17. Fracture surface conditions after the adhesion tests on the unpainted surfaces after 0 and 24 h exposure: (a) CST, (b) CAL.
Metals 11 02065 g017
Figure 18. Fracture surface conditions after the adhesion tests on the painted surfaces after 0 and 24 h exposure: (a) CST, (b) CAL.
Metals 11 02065 g018
Figure 19. The results of adhesion strength.
Metals 11 02065 g019
Figure 20. EIS measurements of blasted specimens after immersing in 3.5 wt% NaCl solution for 24 h showed by Bode plots: (a) log |Z|-log f, (b) Phase angle-log f.
Metals 11 02065 g020
Figure 21. Surface morphology after immersing in a 3.5 wt% NaCl solution (CST 24 h): (a) CST Microscopic image, (b) Contour image.
Metals 11 02065 g021
Table 1. Chemical compositions of carbon steel plate (wt%).
CSiMnPSFe
0.180.191.330.0140.003bal
Table 2. Chemical composition of abrasive materials.
(a) Steel Grit
Abrasive
Materials
MaterialSpecific
Gravity
(g/cm3)
Bulk
Density
(kg/dm3)
Mohs
Hardness
Composition (wt%)
FeCSiMgPS
Steel gritMetallic123.5910bal1.200.400.350.050.05
(b) Aluminum Grit
Abrasive
Materials
MaterialSpecific
Gravity
(g/cm3)
Bulk
Density
(kg/dm3)
Mohs
Hardness
Composition (wt%)
Al2O3SiO2Fe2O3MgOCaO
Aluminum gritNon-Metallic4.01.891294.01.760.890.370.47
Table 3. Corrosion cycle applied during the accelerated exposure tests (Cycle D of JIS K 5600-7-9).
StepTime (h)ConditionsTemperature (°C)Humidity (%)
10.5NaCl solution spray (5 wt%)30 ± 298
21.5Wettability
32Drying50 ± 220
4230 ± 2
One cycle is consist of step 1 to 4.
Table 4. Chemical composition of abrasive materials.
SpecimenLinear Roughness (μm)Areal Roughness (μm)
RaRqRzRSmSaSz
MST10.112.870.32749.65111
MAL8.6910.255.12958.1393.1
Regardless of the linear roughness parameters, the Coefficient of variation (COV) was less than 10%.
Table 5. The results of surface roughness according to blasting angle.
SpecimenBlasting Angle
( ° )
Ra
(μm)
RSm
(μm)
Actual Roughness of the Steel
(Fractal Dimension, DB)
Area Ratio of the Residual
Abrasive Materials (%)
MI-0.584---
MST309.222551.06-
609.402781.14-
909.743021.17-
MAL308.491421.145.03
608.691511.1910.6
908.811661.3015.8
Regardless of the conditions, the COV of all parameters calculated herein were less than 10%.
Table 6. Fitting results of potentiodynamic polarization curves.
SpecimenBlasting Angle (°)Ecorr (mVAg/AgCl)icorr (μA/cm2)
MI-−603 ± 41.29 ± 0.351
MST30−669 ± 56.46 ± 2.40
60−651 ± 1120.4 ± 2.24
90−658 ± 723.9 ± 6.31
MAL30−679 ± 89.50 ± 2.19
60−683 ± 58.03 ± 2.14
90−701 ± 76.06 ± 0.802
Table 7. Fitting result of EIS parameters for blasted specimens.
SpecimenBlasting Angle (°)Rs
(Ω cm2)
CPEdl
−1 sn cm−2)
nRct
(Ω cm2)
Chi-Squared
MI-9.603.17 × 10−40.79017719.48 × 10−3
MST303.231.67 × 10−30.82411337.00 × 102
604.451.92 × 10−30.7739863.89 × 102
904.462.00 × 10−30.7948422.49 × 102
MAL304.142.27 × 10−30.73911043.65 × 102
603.961.76 × 10−30.76611174.56 × 102
904.721.53 × 10−30.79212114.76 × 102
Publisher’s Note: MDPI stays neutral with regard to jurisdictional claims in published maps and institutional affiliations.

